health care cost & utilization
TRANSCRIPT

HEALTH CARE COST & UTILIZATION IN 2019PUBLISHED NOVEMBER 10, 2020

MN Community Measurement 2
HEALTH CARE COST & UTILIZATION IN 2019Introduction This report is possible because of
the engagement of several stakeholders who are committed to continuous improvement and recognize the important role measurement plays in helping our community establish priorities and improve together.
MNCM extends particular thanks to the following health plans for their collaboration in providing the data for this report:
• Blue Cross Blue Shield of MN• HealthPartners• Medica Health Plans• PreferredOne
REPORT AUTHORS AND CONTRIBUTORS
Gunnar NelsonHealth [email protected]
Jess Donovan, MPH, RN, BSN, PHNClinical Measurement [email protected]
HEALTH CARE COST & UTILIZATION IN 2019
RESOURCE USE
UTILIZATION MEASURES
PRICE INDEX
AVERAGE COST PER
PROCEDURE
TOTAL COST OF CARE
x =
As an independent nonprofit dedicated to empowering health care decision makers with meaningful data, MN Community Measurement (MNCM) is a statewide resource for timely, comparable
information on health care costs and quality. MNCM has one of the most robust public transparency efforts in the nation related to health care costs, which provides perspective on total cost of care,
resource use and price as drivers of total cost, and prices for individual services. This report, which MNCM publishes annually, includes data from our analysis of 2019 health care costs for Minnesotans
who have private health insurance.
As shown in the diagram below, total cost is a function of resource use times price. This report
includes information on all three components (Sections 1 and 2). In addition, it also provides a deeper look at health care utilization (Section 3) and prices for individual services (Average Cost Per
Procedure section 4).

MN Community Measurement 3
COST TREND BY TYPE OF SERVICE, PER PATIENT PER MONTHCommercially insured patients, 2013-2019
The analysis in this report is based on claims data for 2019 from the four health plans with the largest commercially-insured patient populations in Minnesota: Blue Cross Blue Shield of Minnesota, HealthPartners, Medica Health Plans, and PreferredOne.
In 2019, the average total cost of care (TCOC) for commercially insured patients cared for by Minnesota primary care providers was $627 per month, an increase of $152 or 32 percent since 2013.
The definition of cost is the amount paid to the health care provider by both the health plan and the patient. This report does NOT use billed charges nor premium as part of the payment calculation. This chart includes all costs for patients who are attributed to a primary care provider, without adjustments for high-cost outliers.
This analysis includes 1,440,000 patients and $10.3 billion in claims.
.
HEALTH CARE COST & UTILIZATION IN 2019
MN Community Measurement 4
SIX YEAR TREND IN COST GROWTH
Commercial patients in Minnesota, cost per patient
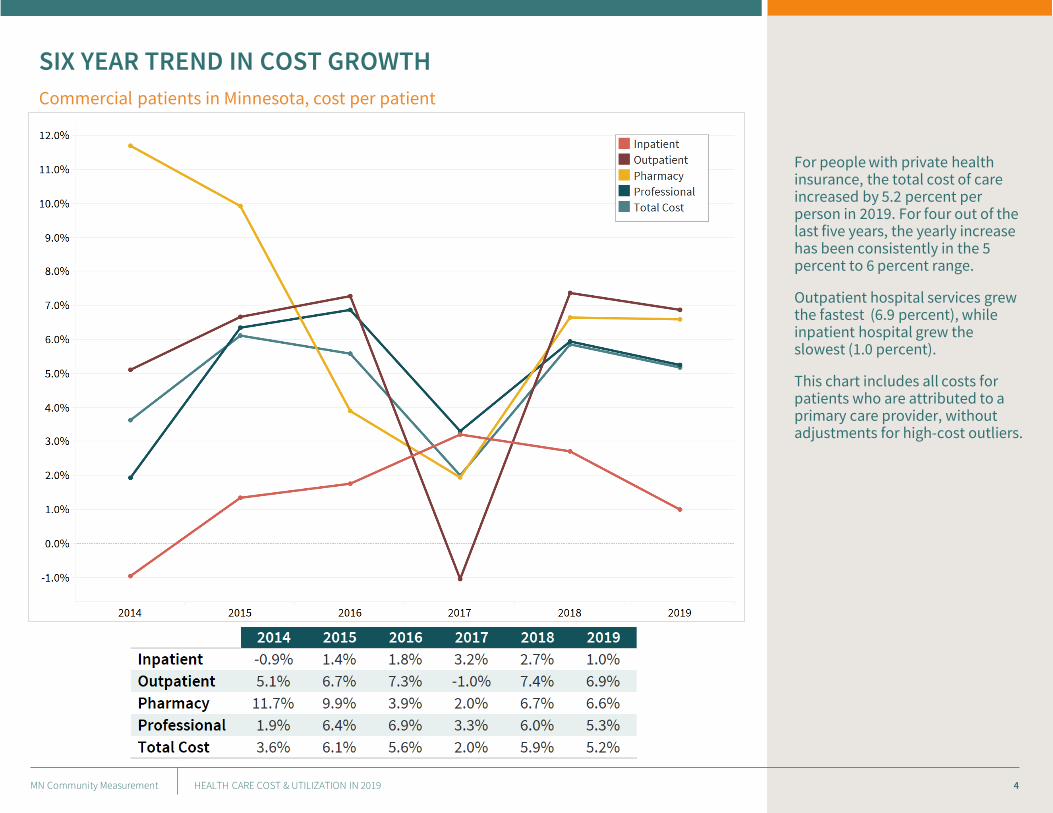
For people with private health insurance, the total cost of care increased by 5.2 percent per person in 2019. For four out of the last five years, the yearly increase has been consistently in the 5 percent to 6 percent range.
Outpatient hospital services grew the fastest (6.9 percent), while inpatient hospital grew the slowest (1.0 percent).
This chart includes all costs for patients who are attributed to a primary care provider, without adjustments for high-cost outliers.
HEALTH CARE COST & UTILIZATION IN 2019

MN Community Measurement 5
2019 TOTAL COST OF CARE BY MEDICAL GROUPCommercially insured patients, risk-adjusted relative costs (95% confidence intervals)
Since MNCM began publishing its TCOC analysis, the variation in total cost of care among medical groups in the region has remained stable. There is no statistical evidence that the variation between medical groups is widening or narrowing. In addition, there has been little change in the relative positions of medical groups within the overall cost distribution.
Detailed results of the TCOC analysis by medical group are included in the separate appendix to this report.
For details on the methodology for this analysis, see page 13
HEALTH CARE COST & UTILIZATION IN 2019

MN Community Measurement 6
2019 RELATIVE PRICE VS. RELATIVE RESOURCE USE
Commercial patient risk-adjusted costs by attributed medical group
PRICE COMPARED TO TOTAL COST
R2 = 0.6233
RESOURCE USECOMPARED TO TOTAL COST
R2 = 0.2624
Lower total cost
Higher total cost
Total cost is driven by both the amount of resources used and the price of each resource. To better understand the reasons for cost variation, MNCM’s analysis separates total cost into these two components.
The top chart (red) shows the relationship between relative price and relative resource use. There is significant variation in both.
The bottom two charts display the relationship between price and total cost (orange) and resource use and total cost (blue).
From examining this scatter plot for each year of this report, it is rare for a medical group to have overall prices more than 20 percent lower than the market average or to be more than 20 percent more efficient in resource use than average.
The variation in price is a more significant factor in the total cost of care than the amount of resources used.
HEALTH CARE COST & UTILIZATION IN 2019

MN Community Measurement 7
2019 MINNESOTA REGIONAL COMPARISONCommercial patient risk-adjusted costs by patient region of residence (3-digit zip code)
HEALTH CARE COST & UTILIZATION IN 2019
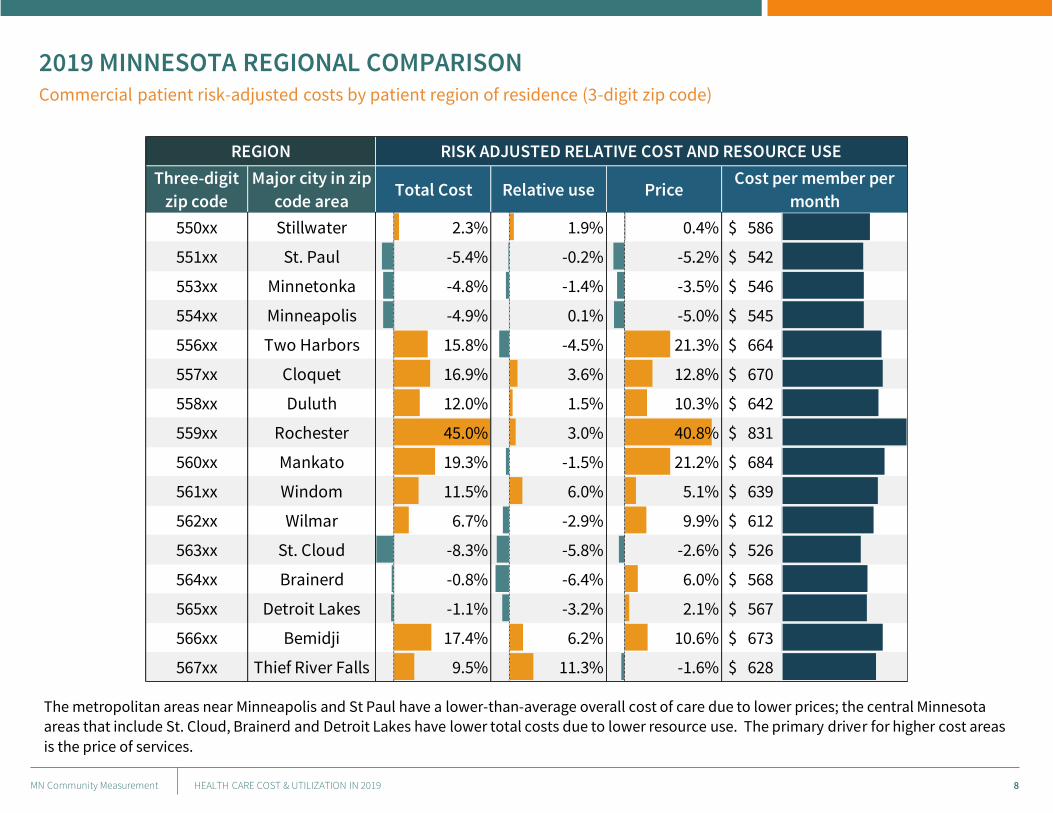
Comparison of Minnesota patients by area of residence (3- Digit Zip Code) shows substantial variation in risk-adjusted cost of care.
The risk-adjusted cost of care varies from a low of $526 in central Minnesota (ZIP code 563xx) to a high of $831 in southeastern Minnesota (ZIP Code 559xx).
MN Community Measurement 8
2019 MINNESOTA REGIONAL COMPARISONCommercial patient risk-adjusted costs by patient region of residence (3-digit zip code)
Three-digit
zip code
Major city in zip
code areaTotal Cost Relative use Price
550xx Stillwater 2.3% 1.9% 0.4% $ 586
551xx St. Paul -5.4% -0.2% -5.2% $ 542
553xx Minnetonka -4.8% -1.4% -3.5% $ 546
554xx Minneapolis -4.9% 0.1% -5.0% $ 545
556xx Two Harbors 15.8% -4.5% 21.3% $ 664
557xx Cloquet 16.9% 3.6% 12.8% $ 670
558xx Duluth 12.0% 1.5% 10.3% $ 642
559xx Rochester 45.0% 3.0% 40.8% $ 831
560xx Mankato 19.3% -1.5% 21.2% $ 684
561xx Windom 11.5% 6.0% 5.1% $ 639
562xx Wilmar 6.7% -2.9% 9.9% $ 612
563xx St. Cloud -8.3% -5.8% -2.6% $ 526
564xx Brainerd -0.8% -6.4% 6.0% $ 568
565xx Detroit Lakes -1.1% -3.2% 2.1% $ 567
566xx Bemidji 17.4% 6.2% 10.6% $ 673
567xx Thief River Falls 9.5% 11.3% -1.6% $ 628
Cost per member per
month
REGION RISK ADJUSTED RELATIVE COST AND RESOURCE USE
HEALTH CARE COST & UTILIZATION IN 2019
The metropolitan areas near Minneapolis and St Paul have a lower-than-average overall cost of care due to lower prices; the central Minnesota areas that include St. Cloud, Brainerd and Detroit Lakes have lower total costs due to lower resource use. The primary driver for higher cost areas
is the price of services.

MN Community Measurement 9
2019 VARIATION IN UTILIZATIONActual-to-expected utilization by medical group for commercial patients
HEALTH CARE COST & UTILIZATION IN 2019
This figure illustrates the variation across medical groups in utilization rates of different services, adjusted for age, gender, and risk. For example, medical group variation in emergency room utilization ranges from 47 percent below expected for the patient mix to 105 percent above, while
variation in pharmacy prescriptions filled ranges from 26 percent below expected to 39 percent above expected.
Detailed results of this analysis by medical group are included in the separate appendix to this report.

MN Community Measurement
2019 COMMERCIAL AVERAGE COST PER SERVICE
Minimum Median Maximum Medicare Medicaid
EYE SERVICES
Determination of refractive state $9 $38 $58 $14
Eye exam, new patient $84 $215 $353 $153 $108 141%
Visual acuity screen $3 $7 $57 $2
IMAGING
Chest X-ray (2 views) $38 $78 $320 $32 $23 244%
Knee X-ray (3 views) $49 $85 $240 $38 $28 224%
X-Ray exam of wrist $52 $84 $370 $37 $28 227%
LABORATORY
Complete blood count (CBC) $8 $11 $77 $7 $6 157%
Glycated hemoglobin test $12 $16 $85 $11 $10 145%
Gonorrhea test $42 $64 $150 $39 $35 164%
Lipid panel $10 $25 $122 $17 $13 147%
MEDICAL SERVICES
Cardiac stress test $144 $210 $950 $72 $51 292%
Pure tone hearing test air $18 $30 $67 $8
Spirometry test $60 $92 $111 $36 $25 256%
MENTAL HEALTH SERVICES
Psychiatric diagnostic evaluation $100 $232 $477 $138 $125 168%
OFFICE VISITS
Office visit, new patient, 20 minutes $103 $181 $209 $76 $58 238%
Office visit, established patient, 15 minutes $97 $161 $199 $74 $58 218%
PHYSICAL THERAPY AND CHIROPRACTIC TREATMENT
Physical therapy evaluation - low complexity $79 $148 $258 $86 $62 172%
SURGERY
Stitches for a wound $138 $220 $277 $89 $64 247%
Vasectomy $652 $1,016 $1,860 $378 $260 269%
GOVERNMENT FEES
October 2019
when comparable
COMMERCIAL RANGECOMMERCIAL AS A
PERCENTAGE OF
MEDICARE
10
Examples
HEALTH CARE COST & UTILIZATION IN 2019
Average Cost per Procedure (ACP) is a measure of the average amount paid to each medical group by commercial health plans for specific common ambulatory care procedures and services. The measures represent actual amounts paid for services (i.e., not list prices) and include amounts paid by insurance and patient out-of-pocket costs.
This table provides examples of pricing variation for procedures that a patient could shop for.
The complete list of 113 procedures is included in Appendix Table 4. Prices by medical group are available at MNHealthscores.org.
The prices listed here are limited to procedures that are both high volume and are typically the complete cost of the procedure. There is usually not a separate fee for the facility.
As shown here, prices for individual services vary substantially – for example, an X-Ray of the wrist can vary from $52 to $370 for a commercial patient, while the Medicare fee is $37.
MN Community Measurement 11
COMPARISON OF COMMERCIAL PRICES TO MEDICARE FEE SCHEDULE2014 - 2019
HEALTH CARE COST & UTILIZATION IN 2019
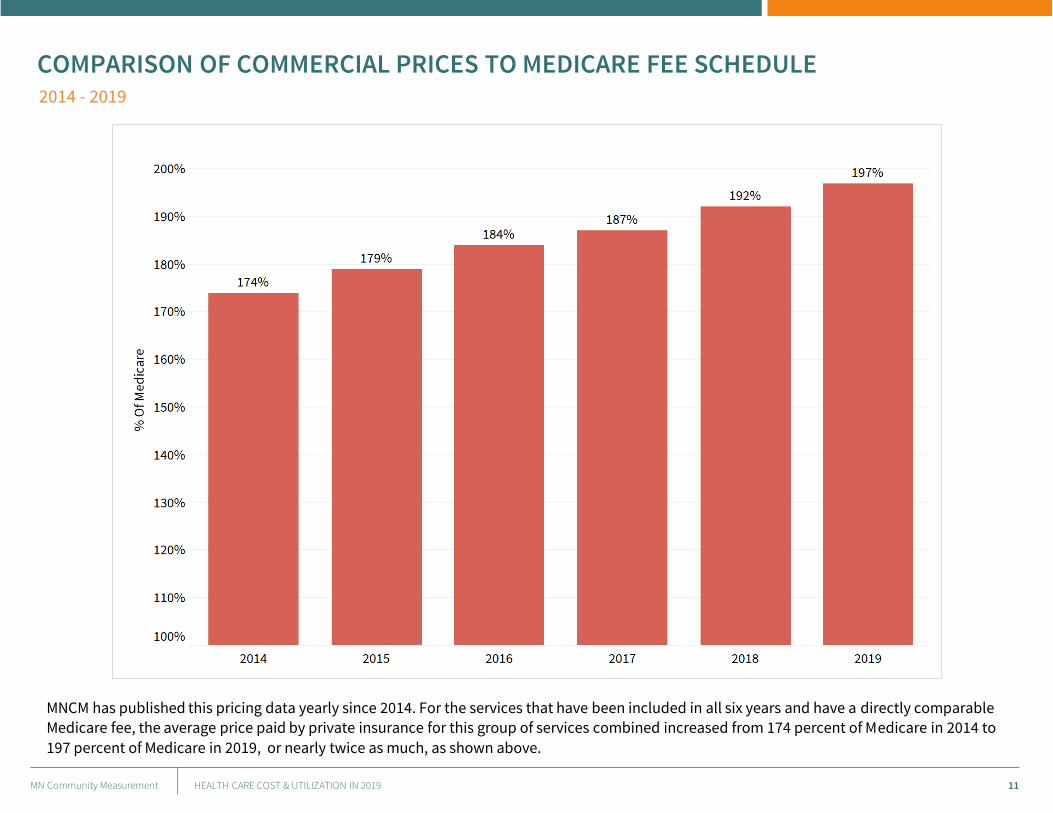
MNCM has published this pricing data yearly since 2014. For the services that have been included in all six years and have a directly comparable Medicare fee, the average price paid by private insurance for this group of services combined increased from 174 percent of Medicare in 2014 to
197 percent of Medicare in 2019, or nearly twice as much, as shown above.
MN Community Measurement 12
2019 AVERAGE PRICES FOR IMAGING SERVICESClinic compared to hospital outpatient for commercial patients
HEALTH CARE COST & UTILIZATION IN 2019
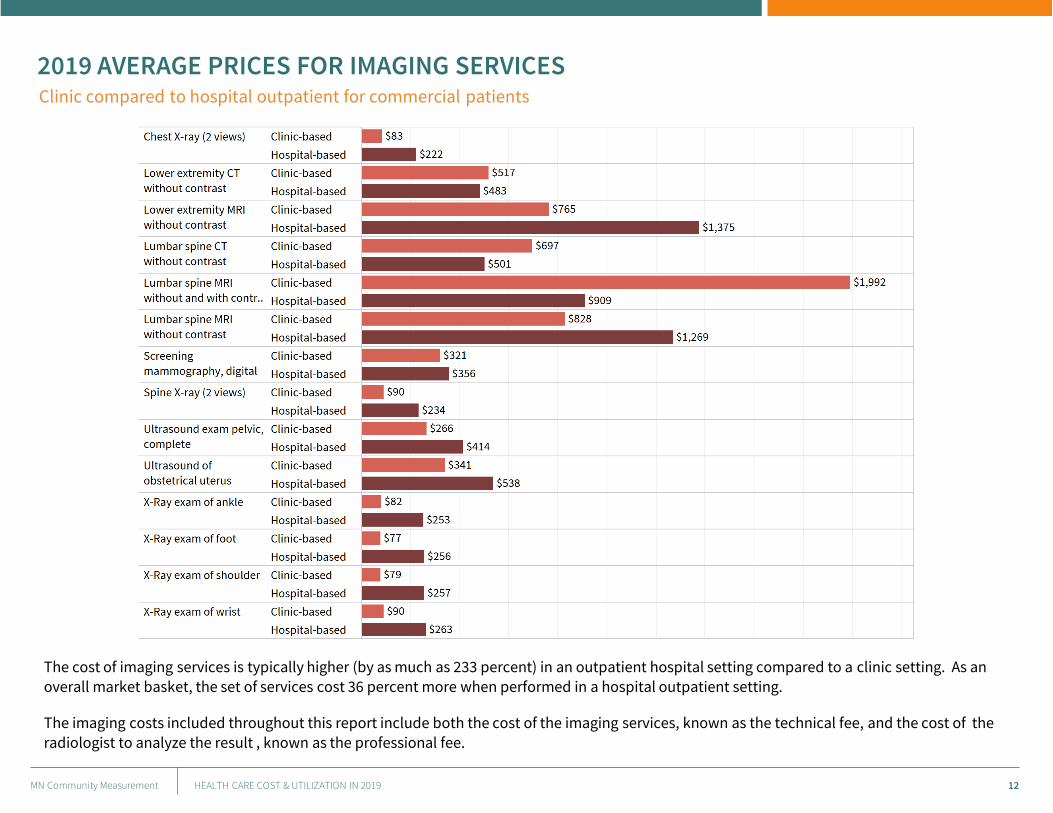
The cost of imaging services is typically higher (by as much as 233 percent) in an outpatient hospital setting compared to a clinic setting. As an overall market basket, the set of services cost 36 percent more when performed in a hospital outpatient setting.
The imaging costs included throughout this report include both the cost of the imaging services, known as the technical fee, and the cost of the radiologist to analyze the result , known as the professional fee.

MN Community Measurement 13
METHODOLOGY & DEFINITIONS
HEALTH CARE COST & UTILIZATION IN 2019
All data collected and calculated in a unique collaborative process between Blue Cross Blue Shield of MN, HealthPartners, Medica Health Plans, PreferredOne and MN Community Measurement.
Total Cost of Care (TCOC), TCI(Total Cost Index) and TCRRV(relative resource use) measures were developed and are maintained by HealthPartners and are endorsed by the National Quality Forum.
• COST: For the purposes of this report, cost is defined as allowable charges which is the total paid by the health plan and the patient. Billed charges are not used to define costs.
• DATA SOURCE: Administrative claims from Blue Cross Blue Shield of MN, HealthPartners, Medica Health Plans and PreferredOne.
• DATES OF SERVICE: January 1, 2019 through December 31, 2019. This analysis includes claims processed as of April 30, 2020.
• PATIENT ATTRIBUTION (ASSIGNMENT):• TCOC: All costs are assigned to the medical group with the patient’s majority of primary care activity.
• Average Cost Per Procedure: Attribution is based on billing provider and includes all commercial patients from participating health plans.
• POPULATION:
• Commercial patients for individual plan and group plans, including self insured employer groups.
• TCOC: Patients age 1-64 who were on same health plan for at least nine months during the 2019 dates of service.
• Average Cost Per Procedure: All commercial patients enrolled in the four health plans during the 2019 dates of service.
• RISK ADJUSTMENT:
• TCOC: Costs are adjusted for known risk factors that are reported in administrative claims, using version 11.0 of the Johns Hopkins Adjusted Clinical Groups (ACG) grouper. Costs above $125,000 per patient are removed when comparing medical groups but included when calculating statewide trends.
• Utilization: Utilization is adjusted for known risk factors that are reported in administrative claims, using version 11.0 of Johns Hopkins ACG grouper plus gender and age. No outlier adjustments.
• Average Cost Per Procedure: Not risk adjusted as this is a measure of cost per unit not rate or appropriateness of care.
• SAMPLE SIZE REQUIREMENTS FOR PUBLIC REPORTING
• TCOC: Minimum of 600 attributed patients per medical group.
• Average Cost Per Procedure: Minimum of 50 services per procedure per medical group with data from at least three of the health plans.
The confidence interval for the Total Cost of Care measure is calculated by “bootstrapping with replacement” which is a process where many samples are pulled from the full data set, each time calculating the outcome. MNCM calculated the 95 percent confidence interval for the TCOC for each medical group by repeating the process 600 times from unique randomly selected subsets of the data.
The confidence interval is calculated as the 2.5th percentile and 97.5th percentile of the 600 repeated calculations.

MN Community Measurement 14
APPENDIX TABLES
RESOURCE USE
UTILIZATION MEASURES
PRICE INDEX
AVERAGE COST PER
PROCEDURE
TOTAL COST OF CARE
x =
Detailed tables by medical group can be found here.
APPENDIX TABLE 1: 2019 Total Cost of Care, Relative Resource Use and Relative Pricing by Medical Group
APPENDIX TABLE 2A: Utilization: Facility Based Services
APPENDIX TABLE 2B: Utilization: Office Visits and Pharmacy Use
APPENDIX TABLE 2C: Utilization: Diagnostic Services
APPENDIX TABLE 3A: Average Cost Per Procedure: X-Ray Exam of Wrist
APPENDIX TABLE 3B: Average Cost Per Procedure: Lumbar Spine MRI without Contrast
APPENDIX TABLE 3C: Average Cost Per Procedure: Psychiatric Diagnostic Exam
APPENDIX TABLE 4: 2019 Average Cost Per Procedure
HEALTH CARE COST & UTILIZATION IN 2019