health benefi ts for local government - cigna benefi ts for local government research findings...
TRANSCRIPT
12
848973 09/11
Health Benefi ts for Local Gove rnment
Findings from 2011 ICMA-CIGNA Study

1
Company reputation
Ability to improve the health of my employees through wellness program, coaching, etc.
Support to local community/charitable causes
Service hours/availability 24/7
Network access and discounts
Price/co-payments and other charges
Investing in Minority and Women Business Enterprise (MWBE)
Percent reporting
0 20 40 60 80 100
Layoffs
Funding employee/retirees
Unfunded mandates
Service delivery
Employee health care costs
Budget
Percent reporting
0 20 40 60 80 100
20% 21%23% 23%
27%30%
10,000 –24,000
25,000 –49,999
50,000 –99,999
100,000 –249,999
250,000 –499,999
500,000+Company reputation
Ability to improve the health of my employees through wellness program, coaching, etc.
Support to local community/charitable causes
Service hours/availability 24/7
Network access and discounts
Price/co-payments and other charges
Investing in Minority and Women Business Enterprise (MWBE)
Percent reporting
0 20 40 60 80 100
Layoffs
Funding employee/retirees
Unfunded mandates
Service delivery
Employee health care costs
Budget
Percent reporting
0 20 40 60 80 100
20% 21%23% 23%
27%30%
10,000 –24,000
25,000 –49,999
50,000 –99,999
100,000 –249,999
250,000 –499,999
500,000+
IntroductionCIGNA recently collaborated with the International City/
County Management Association (ICMA) on a groundbreaking,
nationwide survey to better understand one of the most
signifi cant challenges facing local governments – providing
comprehensive, cost-eff ective health care benefi ts to
employees.
Findings from the survey show that the cost of providing
benefi ts is a signifi cant concern for local governments,
regardless of size or geographic location. Despite these
cost pressures, the majority of local governments say they
have no plans to reduce, delay or cancel program design
enhancements, including health promotion eff orts.
While many would benefi t from establishing programs to
address workforce health care concerns, the survey showed
that the majority are not taking full advantage of health
improvement and benefi t changes that could improve
employee health conditions and health spending, and help
lower their benefi t costs.
This paper will share insights into the survey fi ndings. We will
examine current benefi t practices in local governments across
the U.S., and look at emerging trends and benefi t strategies
being employed to help local governments deliver the most
cost-eff ective workforce benefi t solutions.
Top Operating ConcernsBudget worries top the list of local government concerns, with
the expense of employee and retiree health care benefi ts and
unfunded mandates weighing heavily on the minds of local
government administrators as their top concerns. Not surprisingly,
service delivery – their ability to eff ectively serve the needs of
their constituents given the intense expense pressures they face –
ranked third among administrator concerns.
Table of Contents
Introduction ...........................................................1
Top Operating Concerns ......................................1
Top Workforce Health Concerns .........................2
Paying for Health Insurance ................................3
Current Benefi t Approaches ...............................4
Cost-saving Strategies ..........................................5
Health Management Program Trends ..............7
Impact of Health Care Reform ............................9
Health Plan Decision-making .............................9
Research Methodology ..................................... 10
Map of Respondents .......................................... 11
Health Benefi ts for Local Government Research Findings
Figure 1: Top Three Operating Concerns

2
Top Workforce Health ConcernsThe survey collected information to assess specific workforce health concerns. Overall, obesity/weight was, by far, the top
concern, followed by stress management and fitness.
Figure 2: Top Workforce Health Concerns
Local governments identified several obstacles impeding their ability to develop a healthy workforce. The following five were
cited as their biggest concerns:
n Lack of employee participation
n Insufficient financial incentives to encourage participation in programs
n Inadequate budget to support health management programs
n Too many other demands on employees
n Lack of organizational structure/staffing to support it
There are, however, a few differences among the population groups.
The local governments in the over 1,000,000 population group identified “lack of evidence about which practices work
best” (30%) and “poor or inadequate communication of health management programs” (30%) as more concerning than
“lack of organization structure/staffing to support it.” Those with a population of 500,000 to 1,000,000 cited “lack of senior
management support” (33%) equally as concerning as “lack of organization structure/staffing to support it” (33%).
Figure 3: Obstacles to Developing a Healthy Workforce
Obstacle % reporting
Lack of employee engagement 64%
Lack of sufficient financial incentives to encourage participation in programs 62%
Lack of adequate budget to support effective health management programs 59%
Too many other demands on employees/not enough time 53%
Lack of organization structure/staffing to support it 40%
Lack of adequate internal staff 34%
Lack of evidence about which practices work best 23%
Lack of appropriate tools to be successful 21%
Lack of senior management support 10%
Poor or inadequate communication of health management programs 10%
Lack of actionable data/information from insurance administrator 10%
63% 35% 35%
Obesity/Weight Stress Management Fitness
3
Company reputation
Ability to improve the health of my employees through wellness program, coaching, etc.
Support to local community/charitable causes
Service hours/availability 24/7
Network access and discounts
Price/co-payments and other charges
Investing in Minority and Women Business Enterprise (MWBE)
Percent reporting
0 20 40 60 80 100
Layoffs
Funding employee/retirees
Unfunded mandates
Service delivery
Employee health care costs
Budget
Percent reporting
0 20 40 60 80 100
20% 21%23% 23%
27%30%
10,000 –24,000
25,000 –49,999
50,000 –99,999
100,000 –249,999
250,000 –499,999
500,000+
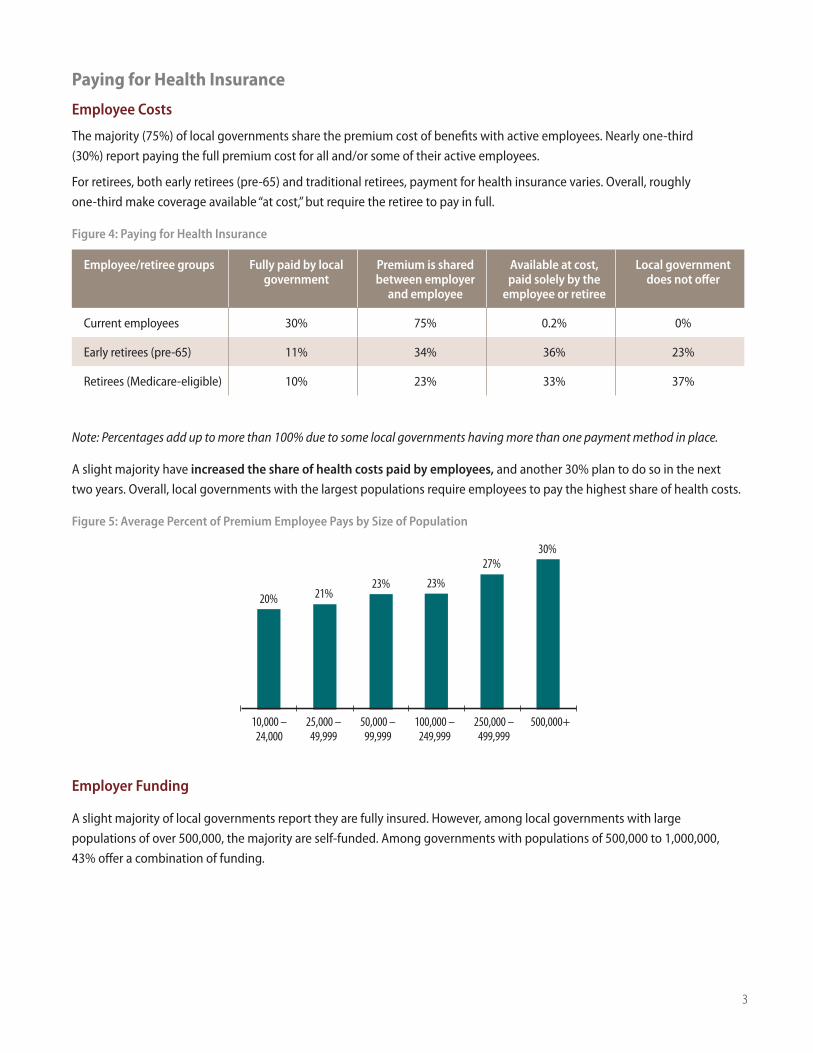
Paying for Health Insurance
Employee Costs
The majority (75%) of local governments share the premium cost of benefits with active employees. Nearly one-third
(30%) report paying the full premium cost for all and/or some of their active employees.
For retirees, both early retirees (pre-65) and traditional retirees, payment for health insurance varies. Overall, roughly
one-third make coverage available “at cost,” but require the retiree to pay in full.
Figure 4: Paying for Health Insurance
Employee/retiree groups Fully paid by local government
Premium is shared between employer
and employee
Available at cost, paid solely by the
employee or retiree
Local government does not offer
Current employees 30% 75% 0.2% 0%
Early retirees (pre-65) 11% 34% 36% 23%
Retirees (Medicare-eligible) 10% 23% 33% 37%
Note: Percentages add up to more than 100% due to some local governments having more than one payment method in place.
A slight majority have increased the share of health costs paid by employees, and another 30% plan to do so in the next
two years. Overall, local governments with the largest populations require employees to pay the highest share of health costs.
Figure 5: Average Percent of Premium Employee Pays by Size of Population
Employer Funding
A slight majority of local governments report they are fully insured. However, among local governments with large
populations of over 500,000, the majority are self-funded. Among governments with populations of 500,000 to 1,000,000,
43% offer a combination of funding.
4
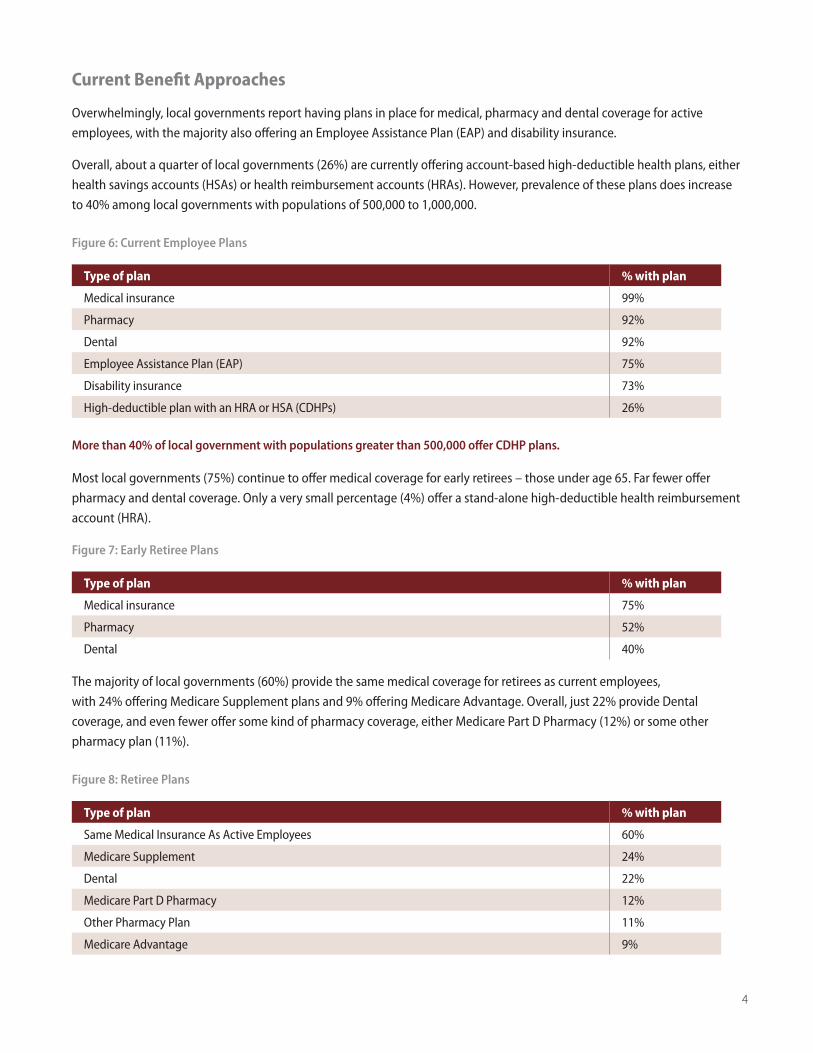
Current Benefit Approaches
Overwhelmingly, local governments report having plans in place for medical, pharmacy and dental coverage for active
employees, with the majority also offering an Employee Assistance Plan (EAP) and disability insurance.
Overall, about a quarter of local governments (26%) are currently offering account-based high-deductible health plans, either
health savings accounts (HSAs) or health reimbursement accounts (HRAs). However, prevalence of these plans does increase
to 40% among local governments with populations of 500,000 to 1,000,000.
Figure 6: Current Employee Plans
Type of plan % with plan
Medical insurance 99%
Pharmacy 92%
Dental 92%
Employee Assistance Plan (EAP) 75%
Disability insurance 73%
High-deductible plan with an HRA or HSA (CDHPs) 26%
Most local governments (75%) continue to offer medical coverage for early retirees – those under age 65. Far fewer offer
pharmacy and dental coverage. Only a very small percentage (4%) offer a stand-alone high-deductible health reimbursement
account (HRA).
Figure 7: Early Retiree Plans
Type of plan % with plan
Medical insurance 75%
Pharmacy 52%
Dental 40%
The majority of local governments (60%) provide the same medical coverage for retirees as current employees,
with 24% offering Medicare Supplement plans and 9% offering Medicare Advantage. Overall, just 22% provide Dental
coverage, and even fewer offer some kind of pharmacy coverage, either Medicare Part D Pharmacy (12%) or some other
pharmacy plan (11%).
Figure 8: Retiree Plans
Type of plan % with plan
Same Medical Insurance As Active Employees 60%
Medicare Supplement 24%
Dental 22%
Medicare Part D Pharmacy 12%
Other Pharmacy Plan 11%
Medicare Advantage 9%
More than 40% of local government with populations greater than 500,000 offer CDHP plans.

5
Cost-saving Strategies
In all but a few categories, the majority of local governments report that no action has been taken to reduce health care
expenses/claims costs, and in some instances, that may not be a bad thing. For example:
n 89% have not reduced or eliminated health promotion programs, and they do not plan to do so.
n 76% have not delayed or canceled new health care and productivity program offerings, and do not intend to do so.
n 71% have not delayed or canceled program design enhancements, such as including a health-coaching program or
adding a disease-management program.
In other benefit cost-saving areas, local governments have been more active than inactive:
n 65% have taken or are planning to take action to significantly increase pharmacy copays, deductibles or coinsurance.
n 61% are actively communicating/educating employees on health care costs and living healthier lifestyles or plan to
do so in the future.
n 60% report having programs in place, or plan to add programs in the future, to audit or review eligibility or enrollment
in their health plans.
n About half (48%) have taken action, or plan to take action, to create incentives to encourage employees to use
high-quality/low-cost hospitals and physicians.
n 41% have taken action, or plan future action, to reduce plan options.
Local government action to help employees maintain their health and reduce health risks is mixed:
n Almost two-thirds (63%) have already integrated employee participation in wellness programs with health plan data or
they are planning to do so in the next two years.
n A majority (61%) have taken action or are planning future action so that employees will complete a health risk appraisal,
although the percentages decrease among the smaller population groups.
n Just over half (51%) have taken action, expect to take further action and/or plan to take initial action in the next two
years to have employees participate in disease management programs.
n 47% have taken action or plan to take action in the next two years to encourage employees to complete biometric
screenings, which can help determine their risk for certain diseases; these programs appear more prevalent in larger
local governments (population 250,000 and over).
n 43% already have programs to encourage completion of adult health exams or plan to add programs in the future.
n 36% have taken action or plan to take future action to help employees maintain target-level blood pressure, because
of the health risks high blood pressure presents. The responses to maintaining cholesterol levels are similar to the
responses to maintaining blood pressure.

6
n 36% report taking action or planning future action to reward/penalize employees based on their tobacco-use status.
n 34% already have, or are planning to take, future action to help employees maintain their body mass index (BMI) within
target levels.
n One third (33%) have taken action, or plan to take action within the next two years, to add programs aimed at improving
compliance with an evidence-based course of treatment. However, a majority of respondents in the three largest
population groups indicate they have already taken, or plan to take, action within the next two years.
n One-quarter (25%) have taken action, or are planning future action, to integrate health and disability/absence
management programs with a single vendor.
n 14% have taken action or are planning future action to provide different disability benefit levels (incentive) based on
health management program participation.
As local governments look to future plan and program design enhancements to improve health and lower costs, several
untapped opportunities appear to exist. For example, very few are now offering, or planning to offer, consumer-driven health
plans, on-site and personal coaching services, and online benefit selection tools.
Figure 9: Untapped Plan/Program Opportunities
Local governments with the largest populations appear more willing to offer these plans and programs.
Of local governments with a population over 1,000,000, 46% currently offer an on-site clinic. Overall, the percentages
reporting that they are considering an on-site clinic are higher among larger local governments.
60% with populations over 500,000 currently offer a health coach/advisor program.
The majority with populations over 250,000 currently offer online enrollment tools.
Health savings account (HSA) or HRA with underlying medical plan
Online tools to select/enroll in benefits
Health coach/advisor
Online tools to customize benefits
On-site health clinics
26% 28%
9% 11%
27% 12%
27% 26%
11% 18%
Type of Plan/Program Offering % Offering Now/% Considering Offering with the Next 1–2 Years

7
Health Management Program Trends
The survey collected information on local governments’ use of targeted health improvement programs to address specifi c
workforce health concerns. It also looked at current programs in place, and plans to expand these programs in the future.
Overall, the majority of local governments currently do not have health improvement programs in place to address common
health risks – even among their top health concerns. However, many are considering adding programs in the future.
Figure 10: Workforce Health Concerns (listed in order of top concerns)
Did You Know?
According to the CDC, more than 75% of health care costs are due to chronic conditions.
Chronic diseases – such as heart disease, diabetes and obesity – are the most common and costly of all health problems. Today, nearly one in two adults is living with at least one chronic illness.
But the good news is that chronic diseases are also the most preventable.
Four common, health-damaging, but modifi able behaviors – tobacco use, insuffi cient physical activity, poor eating habits and excessive alcohol use – are responsible for much of the illness, disability and premature death related to chronic diseases.
n Already have in place n Considering for future
Obesity/Weight Management
Stress Management
Fitness
Smoking
Heart Disease
Disease Prevention
Diabetes
Cancer
Asthma
Nutrition
Depression
Low Back Pain
At-risk Pregnancies
44% 20%
15%
20%
40% 19%
19%
19%
17%
52% 20%
45%
33%
37% 17%
33%
22% 15%
21% 11%
38%
34%
23% 16%
18% 8%
8
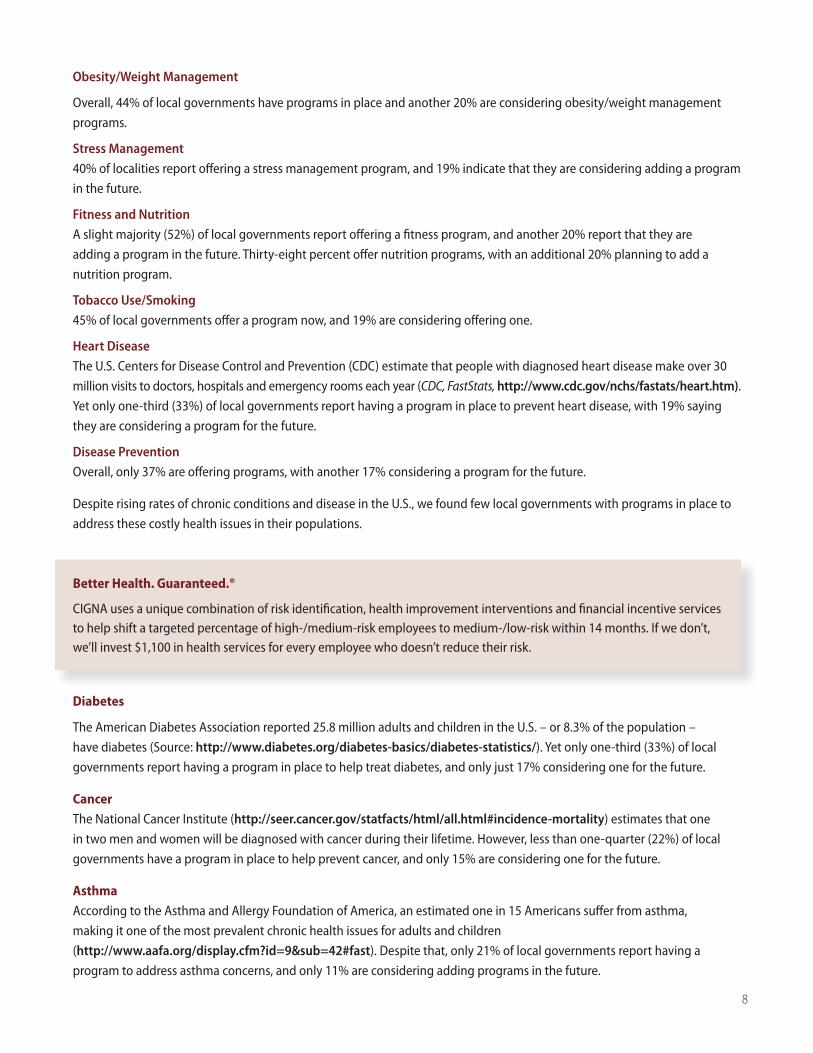
Obesity/Weight Management
Overall, 44% of local governments have programs in place and another 20% are considering obesity/weight management
programs.
Stress Management
40% of localities report off ering a stress management program, and 19% indicate that they are considering adding a program
in the future.
Fitness and Nutrition
A slight majority (52%) of local governments report off ering a fi tness program, and another 20% report that they are
adding a program in the future. Thirty-eight percent off er nutrition programs, with an additional 20% planning to add a
nutrition program.
Tobacco Use/Smoking
45% of local governments off er a program now, and 19% are considering off ering one.
Heart Disease
The U.S. Centers for Disease Control and Prevention (CDC) estimate that people with diagnosed heart disease make over 30
million visits to doctors, hospitals and emergency rooms each year (CDC, FastStats, http://www.cdc.gov/nchs/fastats/heart.htm).
Yet only one-third (33%) of local governments report having a program in place to prevent heart disease, with 19% saying
they are considering a program for the future.
Disease Prevention
Overall, only 37% are off ering programs, with another 17% considering a program for the future.
Despite rising rates of chronic conditions and disease in the U.S., we found few local governments with programs in place to
address these costly health issues in their populations.
Diabetes
The American Diabetes Association reported 25.8 million adults and children in the U.S. – or 8.3% of the population –
have diabetes (Source: http://www.diabetes.org/diabetes-basics/diabetes-statistics/). Yet only one-third (33%) of local
governments report having a program in place to help treat diabetes, and only just 17% considering one for the future.
Cancer
The National Cancer Institute (http://seer.cancer.gov/statfacts/html/all.html#incidence-mortality) estimates that one
in two men and women will be diagnosed with cancer during their lifetime. However, less than one-quarter (22%) of local
governments have a program in place to help prevent cancer, and only 15% are considering one for the future.
Asthma
According to the Asthma and Allergy Foundation of America, an estimated one in 15 Americans suff er from asthma,
making it one of the most prevalent chronic health issues for adults and children
(http://www.aafa.org/display.cfm?id=9&sub=42#fast). Despite that, only 21% of local governments report having a
program to address asthma concerns, and only 11% are considering adding programs in the future.
Better Health. Guaranteed.®
CIGNA uses a unique combination of risk identifi cation, health improvement interventions and fi nancial incentive services to help shift a targeted percentage of high-/medium-risk employees to medium-/low-risk within 14 months. If we don’t, we’ll invest $1,100 in health services for every employee who doesn’t reduce their risk.
9
Depression
A recent study sponsored by the World Health Organization and the World Bank found unipolar major depression to be
the leading cause of disability in the United States
(http://www.depressionperception.com/depression/depression_facts_and_statistics.asp). Yet, only slightly more
than one-third (34%) of local governments have a program currently in place to manage depression, with another 15%
considering adding a program in the future.
Impact of Health Care Reform
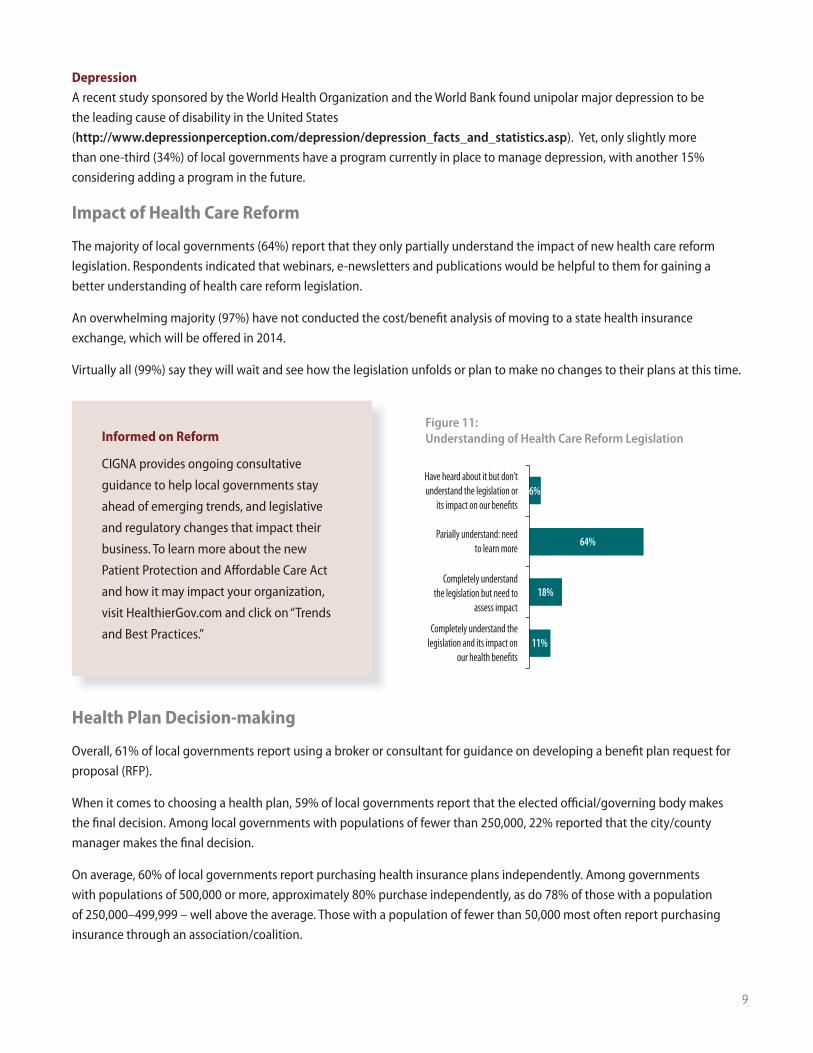
The majority of local governments (64%) report that they only partially understand the impact of new health care reform
legislation. Respondents indicated that webinars, e-newsletters and publications would be helpful to them for gaining a
better understanding of health care reform legislation.
An overwhelming majority (97%) have not conducted the cost/benefi t analysis of moving to a state health insurance
exchange, which will be off ered in 2014.
Virtually all (99%) say they will wait and see how the legislation unfolds or plan to make no changes to their plans at this time.
Health Plan Decision-making
Overall, 61% of local governments report using a broker or consultant for guidance on developing a benefi t plan request for
proposal (RFP).
When it comes to choosing a health plan, 59% of local governments report that the elected offi cial/governing body makes
the fi nal decision. Among local governments with populations of fewer than 250,000, 22% reported that the city/county
manager makes the fi nal decision.
On average, 60% of local governments report purchasing health insurance plans independently. Among governments
with populations of 500,000 or more, approximately 80% purchase independently, as do 78% of those with a population
of 250,000–499,999 – well above the average. Those with a population of fewer than 50,000 most often report purchasing
insurance through an association/coalition.
Informed on Reform
CIGNA provides ongoing consultative
guidance to help local governments stay
ahead of emerging trends, and legislative
and regulatory changes that impact their
business. To learn more about the new
Patient Protection and Aff ordable Care Act
and how it may impact your organization,
visit HealthierGov.com and click on “Trends
and Best Practices.”
Figure 11: Understanding of Health Care Reform Legislation
Have heard about it but don’t understand the legislation or
its impact on our benefits
Parially understand: need to learn more
Completely understand the legislation but need to
assess impact
Completely understand the legislation and its impact on
our health benefits
6%
64%
18%
11%
10
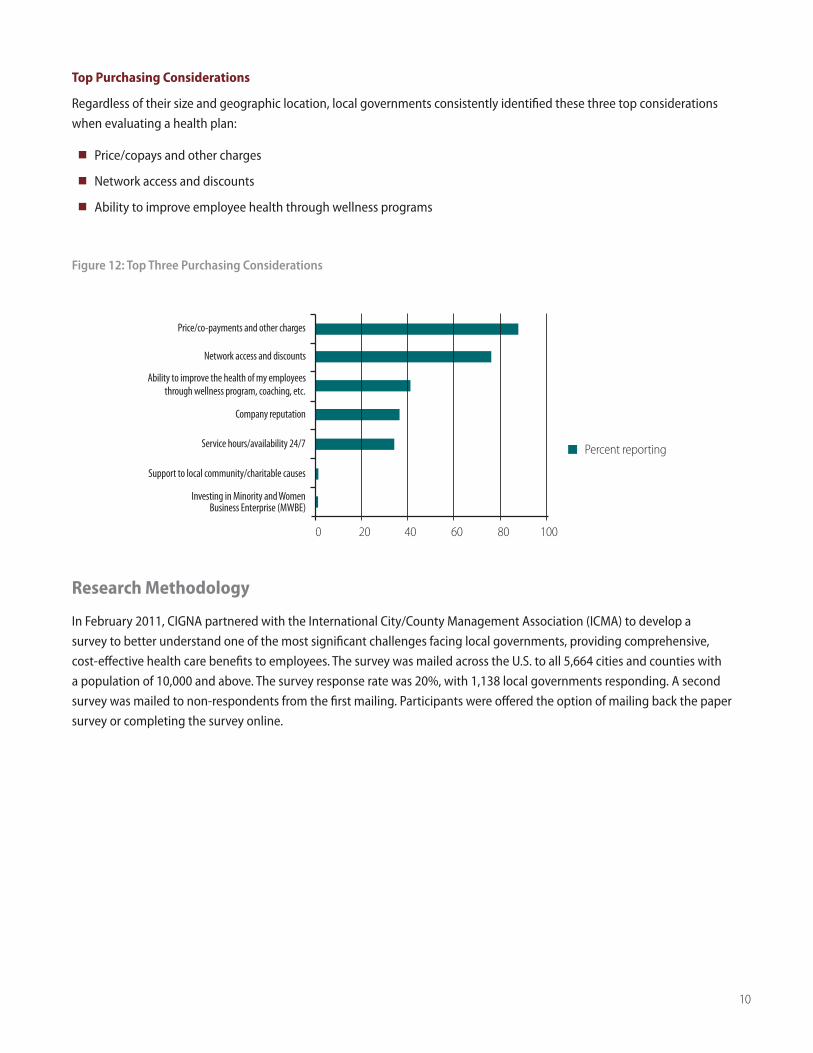
Top Purchasing Considerations
Regardless of their size and geographic location, local governments consistently identified these three top considerations
when evaluating a health plan:
n Price/copays and other charges
n Network access and discounts
n Ability to improve employee health through wellness programs
Figure 12: Top Three Purchasing Considerations
Research Methodology
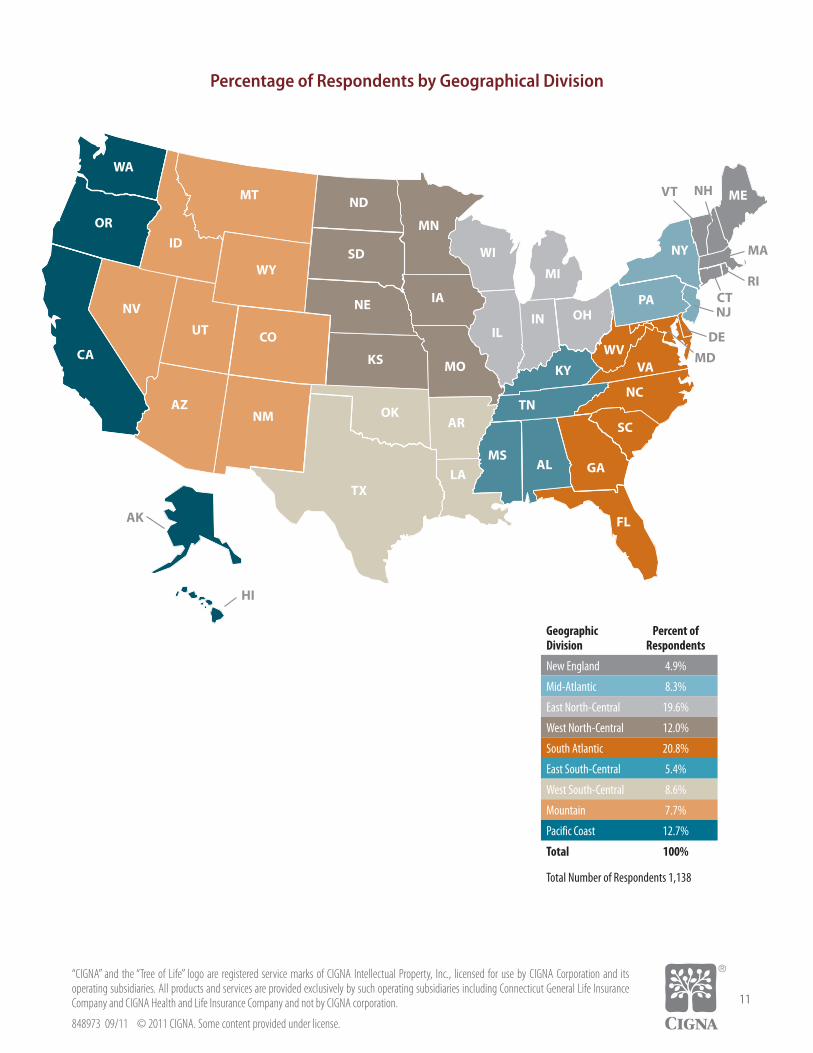
In February 2011, CIGNA partnered with the International City/County Management Association (ICMA) to develop a
survey to better understand one of the most significant challenges facing local governments, providing comprehensive,
cost-effective health care benefits to employees. The survey was mailed across the U.S. to all 5,664 cities and counties with
a population of 10,000 and above. The survey response rate was 20%, with 1,138 local governments responding. A second
survey was mailed to non-respondents from the first mailing. Participants were offered the option of mailing back the paper
survey or completing the survey online.
Company reputation
Ability to improve the health of my employees through wellness program, coaching, etc.
Support to local community/charitable causes
Service hours/availability 24/7
Network access and discounts
Price/co-payments and other charges
Investing in Minority and Women Business Enterprise (MWBE)
Percent reporting
0 20 40 60 80 100
Layoffs
Funding employee/retirees
Unfunded mandates
Service delivery
Employee health care costs
Budget
Percent reporting
0 20 40 60 80 100
20% 21%23% 23%
27%30%
10,000 –24,000
25,000 –49,999
50,000 –99,999
100,000 –249,999
250,000 –499,999
500,000+
11
“CIGNA” and the “Tree of Life” logo are registered service marks of CIGNA Intellectual Property, Inc., licensed for use by CIGNA Corporation and its operating subsidiaries. All products and services are provided exclusively by such operating subsidiaries including Connecticut General Life Insurance Company and CIGNA Health and Life Insurance Company and not by CIGNA corporation.
848973 09/11 © 2011 CIGNA. Some content provided under license.
WA
OR
CA
ID
NV
MT
WY
UT CO
AZNM
TX
OK
KS
NE
SD
ND
MN
IA
MO
AR
LAMS
IL
WI
MI
IN OH
KY
TN
AL GA
FL
SC
NC
VAWV
PA
NY
ME
RI
MA
VT NH
NJ
HI
CT
MD
AK
DE
Percentage of Respondents by Geographical Division
GeographicDivision
Percent of Respondents
New England 4.9%
Mid-Atlantic 8.3%
East North-Central 19.6%
West North-Central 12.0%
South Atlantic 20.8%
East South-Central 5.4%
West South-Central 8.6%
Mountain 7.7%
Pacific Coast 12.7%
Total 100%
Total Number of Respondents 1,138