health and working conditions of hotel guest room ...lohp.org/docs/pubs/vegasrpt.pdfhealth and...
TRANSCRIPT

Health and Working Conditions
of Hotel Guest Room Attendants in Las Vegas
Report
Prepared for the Culinary Workers' Union, Local 226, Las Vegas
by
Niklas Krause, M.D., Ph.D., M.P.H.
Assistant Professor of Medicine
Division of Occupational and Environmental Medicine
University of California at San Francisco
with
Pamela T. Lee, B.S.
Teresa Scherzer, Ph.D., M.S.W.
Reiner Rugulies, Ph.D., M.P.H., Dipl. Psych.
Patricia L. Sinnott, P.T., M.P.H.
and
Robin L. Baker, M.P.H.
San Francisco, California
June 15, 2002

ii
TABLE OF CONTENTS
EXECUTIVE SUMMARY............................................................................................... 1
PREFACE ......................................................................................................................... 8
INTRODUCTION........................................................................................................... 10
METHODOLOGY.......................................................................................................... 12
1. Questionnaire Survey Project Description and Study Design............................... 12
2. Development of Survey Instrument (Objective 1) ................................................ 14
3. Survey Administration .......................................................................................... 15
4. Blood Pressure and Heart Rate Project Description and Study Design................ 17
5. Data Management and Analyses ........................................................................... 20
RESULTS ....................................................................................................................... 22
1. Study Population................................................................................................... 22
2. Current Physical Workload and Ergonomic Problems (Objective 2) ................... 24
3. Change of Physical Workload During the Last 5 Years (Objective 3) ................. 30
4. Psychosocial Job Factors (Objective 4) ................................................................ 32
Potential of the Job ........................................................................................... 33
Work Stress........................................................................................................ 35
Respect, Social Support, and Problem Solving at Work ................................... 40
5. Health Status and Functional Limitations (Objective 5) ...................................... 42
6. Work-related Injury and Disability (Objective 6)................................................. 47
7. Blood Pressure Screening (Objective 7)............................................................... 50
8. Associations Between Work Conditions, General Health, and Severe Pain
(Objective 8) ......................................................................................................... 51
ACKNOWLEDGEMENTS ............................................................................................ 55
REFERENCES................................................................................................................ 58
TABLES

iii
LIST OF TABLES
TABLE 1. Participation Rates by Hotel.
TABLE 2. Characteristics of Study Participants by Hotel.
TABLE 3. Number of Rooms and Beds During Last Work Day, by Hotel.
TABLE 4. Number of Floors or Buildings Traveled During a Typical Work Day, by Hotel.
TABLE 5. Scheduled Room Cleaning Assignments by City.
TABLE 6. Usual Frequency of Work Tasks Per Day.
TABLE 7. Ergonomic Problems by Hotel.
TABLE 8. Average Number of Work Tasks Performed Compared to Previous Five Years, by Hotel.
TABLE 9. Changes in Work Tasks Compared to Previous Five Years, by Hotel.
TABLE 10. Job Satisfaction by Hotel.
TABLE 11. Job Potential by Hotel.
TABLE 12. Quality of Work by Hotel.
TABLE 13. Time Pressure and Conflicting Demands at Work, by Hotel.
TABLE 14. Skip Lunch or Breaks, or Work Longer to Complete Assigned Rooms.
TABLE 15. Psychological Job Demands and Job Control, by Hotel.
TABLE 16. Average Scores for Psychological Job Demands and Job Control, by Hotel.
TABLE 17. High Levels of Job Strain by Hotel.
TABLE 18. Psychological Demands, Job Control, and Job Strain: Comparison of Las Vegas Room Cleaners, San Francisco Room Cleaners, and San Francisco Bus Drivers
TABLE 19. Work Effort and Reward, by Hotel.
TABLE 20. Average Scores for Work Effort and Reward, by Hotel.
TABLE 21. Percentage of Room Cleaners With Work Effort-Reward Imbalance by Hotel.
TABLE 22. Supervisor and Co-Worker Support, by Hotel.
TABLE 23. Average Scores for Supervisor Support and Co-Worker Support, by Hotel.
TABLE 24. Problem Solving at Work by Hotel.
TABLE 25. Self-Rated General Health in Room Cleaners by Hotel.
TABLE 26. Self-rated Health According to the Short-Form-36 Health Survey (SF-36) by Hotel.
TABLE 27. Self-rated health: Comparison of Las Vegas Guest Room Attendants with San Francisco Guest Room Attendants and the General US Population

iv
TABLE 28. Psychosomatic Symptom Scores by Hotel.
TABLE 29. Musculoskeletal Pain During the Past 4 Weeks by Body Part and Hotel.
TABLE 30. Musculoskeletal Pain During the Past 4 Weeks, by Body Part and Age Group.
TABLE 31. Took Pain Medication During the Last Four Weeks, by Hotel.
TABLE 32. Work Related Pain, Discomfort or Injuries During the Past 12 Months, by Hotel.
TABLE 33. Work Days Missed Because of Work-Related Pain or Discomfort During the Past 12 Months.
TABLE 34. Reported Work-Related Injury or Illness During the Last 12 Months.
TABLE 35. Barriers to Reporting Work-Related Injuries or Illnesses.
TABLE 36. Workers Compensation Payment of Medical Care Expenses for Reported Work-Related Injury or Illness (n = 166)
TABLE 37. Hypertension Among Room Cleaners.
TABLE 38. Age-Adjusted Risk Factors for Self-Reported Fair or Poor Health (SF-36 scale).
TABLE 39. Age-Adjusted Risk Factors for Self-Reported Severe or Very Severe Pain (SF-36 scale).

1
EXECUTIVE SUMMARY
Background and Significance.
This report describes initial results of a study of working conditions, health, and
quality of life of hotel guest room attendants in the hospitality industry of Las Vegas.
The hospitality industry has experienced a wave of restructuring, consolidation, and new
practices to cut costs, including lean staffing and greater performance demands while
constantly upgrading services in a competitive environment. The research project
explores the impact of these and related changes on the health and quality of life of the
largest occupational group within the hospitality industry, hotel room cleaners (guest
room attendants or GRAs).
Jobs in housekeeping (and food and beverage) operations of the hospitality industry
represent the future of work in the growing service sector. The hospitality industry is a
major employer of low-wage service workers in U.S. metropolitan areas and tourism
centers, and in Nevada in particular. A $75 billion industry, it employs 1.1 million
workers in full- and part-time jobs at 47,000 establishments nationwide. Unlike other
services, businesses in the hospitality industry cannot be moved across borders. It is
likely that this industry will remain a fast growing sector in industrialized societies.
Room cleaning jobs in the hospitality industry are characterized by increasing repetitive
physical workloads, low income, low skill utilization, low job control, increasing use of
contingency employment, and virtually no prospects for training and career advancement.
There is compelling evidence that such low-income jobs result in a disproportionately
high burden of illness, injury, and disability. High workers' compensation and health care
utilization costs reflect only a small proportion of the total societal burden associated with
these working conditions, which are representative for a growing number of immigrant
workers, workers of color, working women, and former welfare recipients. The
hospitality industry has become a major target for welfare-to-work and job training
programs in cities throughout the country. An aging workforce is faced with increasing
job demands in a competitive industry constantly upgrading services. Few and only
limited epidemiological studies have been done including this growing workforce, and
little is known about the specific working conditions, quality of life, and health risks of
these workers and how they could be addressed by workplace health promotion
programs, ergonomic and organizational job redesign interventions, improved medical
care, and labor-management cooperation on occupational health and safety.

2
Study goals.
This study takes a broad view of physical and psychosocial job factors, health,
musculoskeletal disorders, work-related injury, and health-related quality of life. The
goal of this research is to describe the work environment in terms of biomechanical and
organizational risk factors that may impede health and quality of life of guest room
attendants. The specific objectives of this study are to (1) develop a survey instrument for
measuring working conditions and health outcomes of hotel workers, (2) compare health
and working conditions among 5 different types of hotels including one upscale tourist
hotel, one mid-level tourist tour and travel hotel, one convention center and mid-level
tourist hotel, one all-suite mid-level tourist hotel, and one economy tourist hotel, and (3)
compare health and working conditions of GRAs in Las Vegas with those of hotel room
cleaners in San Francisco previously studied by the same investigators.
Methodological Approach.
The study combines qualitative and quantitative research methods and is participatory
in design and implementation, thereby laying the groundwork for sustainable efforts in
understanding and improving health and safety of service workers. This is a collaborative
project of the Las Vegas hotel guest room attendants organized in the Culinary Workers
Union Local 226 and researchers from the Department of Medicine at the University of
California at San Francisco and the Labor and Occupational Health Program of the
University of California at Berkeley. The cooperation follows the model of participatory
action research: guest room attendants are involved in all aspects of the project including
the formulation of the research questions, survey instrument development, study
planning, design and implementation, and interpretation of study results. The main
advantages of this approach are that: (1) the research addresses the specific needs of the
research user, (2) research questions and methods are informed by the first-hand
experience and knowledge of the people whose work conditions and health status are
examined, and (3) a context is developed in which interpretation of results become
meaningful for all participants. In addition, involvement of study participants will help
the dissemination of study results among the various stakeholders, and may increase the
motivation for sustained efforts in planning and implementing changes which improve
working conditions, health, and quality of life for hotel workers.
Study Results and Conclusions.
1. Limited job potential. In general, the occupational potential of room cleaners appears
to be restricted in all hotels in terms of job security, job promotion prospects, and the
3
quality of work. Guest room attendants in Las Vegas report nearly twice as often to be
dissatisfied with their job than those in San Francisco (55% versus 25%), more often rate
their job security as poor (69% versus 48%), and that they have experienced or expect to
experience undesirable changes in their work situation (72 % versus 46 %). These
differences indicate a substantial potential for improvement of job security and job
quality in Las Vegas hotels. This study identifies several physical and organizational
characteristics of the work environment of Las Vegas GRAs which are known risk factors
for health and safety, and which are also amenable to change.
2. Increase of physical workload during last five years. Although no longitudinal data
are available, the results of this survey and reports from focus groups suggest that the
physical workload of GRAs increased during the last five years. 87 percent of all guest
room attendants agreed with the statement "Over the past few years, my job has become
more and more demanding." On average, 4.2 of 26 tasks surveyed are performed less
often than five years ago, 12.4 tasks are performed about as often as before, and 9.4 tasks
are performed more often than five years ago. Continuous upgrading of the hotels has led
to an increase in the frequency of strenuous or time-consuming tasks such as cleaning of
Jacuzzis, cleaning of large shiny surfaces (glass, mirror, brass, or marble), or taking out
trash. The extent of the increase, the particular tasks involved, and the reasons for the
increase differ between the five hotels studied, indicating a potential for change. In
addition, the number of rooms to be cleaned during an 8-hour shift has increased in
several hotels.
3. Current physical workload and time pressure. Nearly all guest room attendants
(87%) described their job as "physically demanding." There are considerable differences
in current workload by several measures between different hotels. The number of rooms
assigned per room cleaner per day alone is insufficient to measure physical workload or
to assure appropriate and equal workload assignments for room cleaners. This study
identified important additional factors that determine the actual workload of room
cleaners including: (1) the number of guests staying in each room, (2) the number of beds
to be made, (3) the need to travel to another floor or building, (4) cleaning Jacuzzis,
marble, glass, and mirrors, (5) the need to restock missing supplies on linen cart, (6)
garbage and food left in the room, and (7) having to call in from each room, among other
items.
Las Vegas guest room attendants clean more rooms and especially more suites than
those in San Francisco and report more time pressure. An average of 75 percent of all

4
guest room attendants report that their jobs requires them to work very fast, and 88%
report having constant time pressure due to a heavy workload. On average only 18% of
GRAs say that they have enough time to get the job done. In comparison, an average of
46 percent of San Francisco room cleaners reported to have enough time to get their job
done. Two thirds (66%) of GRAs in Las Vegas report skipping lunch or breaks or work
longer in order to complete their daily room assignments. In focus groups, several room
cleaners reported they regularly come to work 30-60 minutes early in order to be able to
finish their work in time in the afternoon or to deal with extra assignments during the day.
4. High levels of work stress. More than three quarters of all GRAs experience time
pressure, and two thirds skip lunch or breaks or work longer hours to complete their work
assignments. High workloads and time pressure produce high levels of job stress. Stress
researchers commonly measure job stress by asking standard questions about the
psychological or mental demands of the job together with questions about how much
control or influence workers have over their work, including how and when to do the
work. The combination of high job demands and low job control is called "job strain" or
"job stress". High levels of job stress were experienced by a quarter of all employees.
On average, a total of 78 percent of guest room attendants also experience an imbalance
between their work efforts and rewards. Most indicators of job stress were higher in Las
Vegas than in San Francisco hotel workers. The level of job strain measured by a
standard questionnaire was 2-4 times higher among GRAs in Las Vegas than among San
Francisco hotel room cleaners surveyed in 1998. This indicates strong regional
differences and/or increases in job stress over time in the hotel industry. This also
suggests a substantial potential for improving working conditions for Las Vegas GRAs.
Job strain has been shown to be a major risk factor for several diseases including high
blood pressure, myocardial infarction, musculoskeletal disorders and associated work
disability. Effort-reward imbalance, another indicator of job stress, was reported by 57%
of GRAs in Las Vegas compared to 31% in San Francisco.
5. Respect, social support, and problem solving at work. According to scientific
research, social support at work from supervisors and from coworkers can buffer some of
the detrimental health effects associated with job stress. On the other hand, lack of
support, especially lack of supervisory support and respect, can be the cause of chronic
disease, absenteeism, and occupational injury. Respect from supervisors and
management has been a major issue for room cleaners, which they discussed extensively
in the focus groups. Respect and social support from supervisors and coworkers differed
5
significantly between hotels, but overall ratings were similar to San Francisco. The local
union and management were rated differently with regard to their commitment to in
health and safety issues: 88% of GRAs agreed that the union considers health and safety
an important issue, but only 42% said that management did so.
6. Low levels of general health and high levels of pain. The health status of guest room
attendants was studied by self-report using standardized questionnaires. The general
health rating on a standardized scale from 0-100 (Short-Form-36 Health Survey) appears
to be considerably worse for guest room attendants in Las Vegas (39) than that of the
general US population (72) or of room cleaners in San Francisco (56). These differences
cannot be explained by age differences, because Las Vegas workers are younger than San
Francisco workers.
More than three quarters of guest room attendants reported work-related pain or
discomfort during the past 12 months which was severe enough to visit a doctor (in 62%
of all cases) and to take time off from work (in 32% of all cases). 83% of all GRAs
reported taking pain medication during the last 4 weeks for pain they had at work.
Severe or very severe pain was experienced by 50% or more GRAs in the lower back
(62%), upper back (59%), feet or ankles (56%), upper arms or shoulders (54%), and hips
and legs (each 50%). Severe or very severe pain was reported also in the neck (43 %), the
hands (43%), and the knees (44%). Although hotel room cleaners in San Francisco are on
average 6 years older than Las Vegas GRAs, they reported much less severe or very
severe pain in the musculoskeletal system, on average 26% in hands, 21% in upper backs,
24% in lower back and a maximum of 31% in the shoulders.
Physical functioning is measured by a series of questions assessing if and how much
workers are limited by their health in typical daily activities such as running, lifting
groceries, pushing a vacuum cleaner, etc. Average physical functioning scores (50.0)
were considerably lower than in the San Francisco study (62.1).
General feelings of vitality and energy or (inversely) fatigue are important indicators
of health. Guest room attendants in Las Vegas showed relatively low average vitality
scores (36.3) compared with San Francisco hotel room cleaners (51.5) or the general US
population (60.9).
7. High rates of elevated blood pressure. High blood pressure can be the result of
chronic job stress and may lead to cardiovascular diseases such as congestive heart
failure, acute myocardial infarction, or stroke. About 25% of the adult US population has
high blood pressure. In this study, 39.3% of guest room attendants had elevated blood

6
pressure, based on reported doctor's diagnosis, medication, or direct measurement of
resting blood pressure during the survey.
8. High rates of work-related disability and under-reporting of workers'
compensation injury. More than three quarters (78% in Las Vegas, 77% in San
Francisco) of all guest room attendants reported work-related pain during the last year,
however only 32% (50 % in San Francisco) reported this pain to their supervisors or
management, and only 21% (23% in San Francisco) of all workers had a formally
reported work-related injury during the last year. Several reasons for this apparent under-
reporting of potentially compensable work-related pain were given by GRAs in Las
Vegas including: (1) punitive actions by the employer, (2) discouragement by medical
providers, and (3) the need to pay medical bills. This can be expected to cause substantial
cost-shifting from employer liability insurance into health insurance or employee out-of-
pocket expenses. Work days lost because of work-related pain in general, and because of
formally reported workers' compensation injuries or illnesses specifically, varied between
the different hotels. Further analyses are needed to determine how much of these
differences are caused by differences in physical workload and psychosocial working
conditions.
In focus groups workers frequently reported punitive experiences after reporting a
work-related injury, having to take drug tests before receiving medical care, or the
discounting of their pain and health care needs by their direct supervisors or medical care
providers. To investigate this issue further, GRAs were surveyed about their experiences
after reporting an injury or illness. 33% of GRAs answered that they had to take a drug
test, but this practice differed significantly between hotels. After the injury, 89% of GRAs
were taken to a clinic or doctor. Only 46% of GRAs say they got well before returning to
work. After returning to work 36% missed additional days of work because of their
injury. In the course of their work-related injuries, 21 % of GRAs reported to have
received a warning or other discipline for missing work. These responses show that
GRAs experience important barriers at work for reporting work-related injury and illness.
9. Associations Between Poor Work Conditions, Poor Health, and Severe Pain.
Physical workload is associated with ill general health and, to a lesser degree, with severe
pain in this study. For example, GRAs cleaning more than 14 rooms are 30 % more
likely to suffer from fair or poor health, and to report 25% more often severe or very
severe pain during the past 4 weeks. A workload of more than 18 beds per day increases
the risk of fair or poor health by 43%. Traveling 3 buildings per day increases the risk of

7
ill health 2.5-fold, and the risk of severe pain 4-fold. Similarly, having to travel 3 floors
per day increases the risk of ill health and the risk of severe pain about 2-fold compared
with working in one building or on one floor, respectively.
Two psychosocial job factors, time pressure and low job control, increased the risk of
ill health by 65% and 50%, respectively. All psychosocial workplace factors analyzed in
this section were strongly associated with severe pain. The report of severe or very
severe pain increased 2.36-fold or 236% with time pressure, 1.75-fold or 175% with high
psychological demands, 1.67 or 167% with having low job control, and 1.58 or 158%
with job strain.
These results suggest that physical workload, time pressure, low job control, high
psychological demands, and high job stress all increase the risk of ill health or severe pain
in Las Vegas GRAs, regardless of age. Although these results need to be repeated in a
longitudinal (prospective) study in order to establish causality, the findings are consistent
with the scientific literature showing that biomechanical and psychosocial stressors can
cause pain and chronic disease. The findings of this study clearly suggest that the
relatively high levels of poor health and severe pain among Las Vegas GRAs – compared
to those in San Francisco or to the general US population – are at least in part attributable
to the relatively high physical workload, time pressure, and other job stressors described
in this study. All these job factors are amenable to change, therefore indicating a
considerable potential for job redesign, workplace health promotion, and disease
prevention. The study provides detailed analyses of work conditions which can be
utilized by stakeholders for planning specific interventions.
10. Outlook: Potential for improving working conditions and health status of guest
room attendants. The findings of this study are suggestive of an association between
poor working conditions and reduced health in hotel room cleaners. Room cleaners
report increasing physical workloads in recent years, and a large proportion of room
cleaners are exposed to high levels of job stress. This study also found that room cleaners
have high rates of work-related pain and disability, and that the health status of room
cleaners is below the national average. Age-adjusted multivariate analyses showed
statistically significant associations between work conditions and health. Further analyses
are needed to determine the most important occupational risk factors. The substantial
variation in both working conditions and health status between hotels in San Francisco
and Las Vegas indicates that workload and work organization in housekeeping can be
designed in ways which would reduce the burden of illness and disability currently
experienced in this occupation.

8
PREFACE
The hospitality industry has experienced a wave of restructuring, consolidation, and
new practices to cut costs, including lean staffing and greater performance demands. This
research project investigates the impact of these and related changes on the health and
quality of life of the largest occupational group within the hospitality industry, hotel room
cleaners. This first report describes initial results of a study of hotel guest room
attendants (GRAs) in Las Vegas. Additional analyses and results will be presented peer-
reviewed scientific publications.
This is a report on the health and working conditions of guest room attendants in the
hotel industry of Las Vegas. This report is made available primarily to facilitate ongoing
internal discussions of these topics between room cleaners, union, and management
representatives. In addition, other labor and management groups or researchers may find
this report useful for planning their own investigations. The names of involved hotels are
not presented in this document to grant anonymity to the hotels.
The study was a collaborative effort involving individuals from several academic and
non-academic institutions. Niklas Krause, a physician and epidemiologist from the
Division of Occupational and Environmental Medicine of the University of California in
San Francisco (UCSF), directed the project in collaboration with Pam Tau Lee and Robin
Baker from the Labor and Occupational Health Program (LOHP) of the School of Public
Health at the University of California in Berkeley (UCB). LOHP, directed by Robin
Baker, is a public service arm of the Center for Occupational and Environmental Health
(COEH) at the School of Public Health at UCB. LOHP has nearly 30 years of experience
providing training, information, and technical assistance to labor, joint labor-management
groups, and community-based organizations on an array of occupational health issues.
This project followed a participatory approach, i.e., the study population participated
directly through a Guest Room Attendant Research Advisory Council, focus groups, and
indirectly through union representatives of the Culinary Workers Union Local 226 in the
planning and design of the study, the design, translation, and pilot-testing of the survey
questionnaire, and in the recruitment of study participants. Pam Tau Lee directed and
coordinated all field activities in Las Vegas, conducted focus groups, and, in cooperation
with Cheri Young from the William F. Harrah College of Hotel Administration of the
University of Nevada, Las Vegas (UNLV), trained all graduate student research assistants
from UNLV and the Community College of Southern Nevada (CCSN). Preliminary

9
study results were presented and discussed in separate meetings with focus group
participants, union representatives, employer representatives, and several hundred Las
Vegas guest room attendants during May 2002, about six weeks after data collection was
completed. Final decisions regarding the study design, scientific methods, statistical
analysis, and presentation of study results were made by Niklas Krause, the principal
investigator from the University of California at San Francisco. Robin Baker acted as
liaison between academic researchers and union representatives, and shared the
supervision of the field coordinator and the overall administration of the project with
Niklas Krause.
This report was written by Niklas Krause, and he takes full responsibility for its
scientific integrity and accuracy. Teresa Scherzer, a post-doctoral fellow from the
University of California at Berkeley, and Reiner Rugulies, a research scientist from the
University of California at San Francisco, assisted with the survey questionnaire design,
and performed all data management and statistical analysis tasks. Patricia Sinnott, a
physical therapist and doctoral student from the School of Public Health at UC Berkeley,
assisted in the development of procedures and training protocols regarding casual and
ambulatory blood pressure measurement, and drafted the respective sections of the report.
Suggestion for citation of this report: Krause N, Lee PT, Scherzer T, Rugulies R,
Sinnott PL, Baker RL, Health and working conditions of guest room attendants in Las
Vegas hotels, Report to the Culinary Workers Union, Local 226, San Francisco, June 15,
2002, 112 pages
For communication regarding this report or to order a copy of this report, please
contact Dr. Niklas Krause, University of California, 1301 South 46th Street, Building
163, Richmond, CA 94804 Telephone: 510-231-9540, E-mail:
[email protected]. Copies are also available through (1) Pam Tau Lee c/o
University of California at Berkeley, Labor and Occupational Health Program, School of
Public Health, 2223 Fulton St., 4th floor, Berkeley, CA 94720-5120, or through (2) Peggy
Pierce, Culinary Workers Union, Local 226, 1630 South Commerce St., Las Vegas,
Nevada 89102. The report will be delivered with an invoice in the amount of $20
including shipping.

10
INTRODUCTION
Study rationale. Jobs in housekeeping (and food and beverage) operations of the
hospitality industry represent the future of work in the growing service sector. The
hospitality industry is a major employer of low-wage service workers in U.S.
metropolitan areas and tourism centers, and in Nevada in particular. A $75 billion
industry, it employs 1.1 million workers in full- and part-time jobs at 47,000
establishments nationwide (American Hotel and Motel Association, 1997). Unlike other
services, businesses in the hospitality industry cannot be moved across borders. It is
likely that this industry will remain a fast growing sector in industrialized societies.
Room cleaning jobs in the hospitality industry are characterized by increasing
repetitive physical workloads, low income, low skill utilization, low job control, and
virtually no prospects for training and career advancement. There is compelling evidence
that such low-income jobs result in a disproportionately high burden of illness, injury,
and disability.(Judge et al., 1998; Kaplan et al., 1996; Lynch et al., 1997; Lynch et al.,
1998; Mackenbach, 1992; North et al., 1993; Syme, 1986) High workers' compensation
and health care utilization costs reflect only a small proportion of this total burden.
Working conditions in the hospitality industry are important for a growing number of
immigrant workers, workers of color, working women, and former welfare recipients.
The hospitality industry has become a major target for welfare-to-work and job training
programs in cities throughout the country. An aging workforce is faced with increasing
job demands in a competitive industry constantly upgrading services. Few
epidemiological studies have been done on this growing workforce and little is known
about the specific working conditions and health risks and how they could be addressed.
This study takes a broad view of physical and psychosocial job factors, general
health, musculoskeletal disorders, work-related injury and disability, and health-related
quality of life. The study combines qualitative and quantitative research methods and is
participatory in design and implementation, thereby laying the groundwork for
sustainable efforts in understanding and improving health and safety of service workers.
The study focuses on housekeeping workers since they are the largest occupational
category in the industry.
Study goals. The goals of this study are to (1) develop a survey instrument for
measuring working conditions and health outcomes of hotel workers, (2) measure heart
rate and blood pressure before, during, and after work in a subsample of about 500 guest
room attendants, (3) compare health and working conditions among 5 different types of

11
hotels including one upscale tourist hotel (Hotel A), one mid-level tourist tour and travel
hotel (Hotel B), one convention and mid-level tourist hotel (Hotel C), one new upscale all
suites hotel (Hotel D), and one old economy tourist hotel (Hotel E), and (4) compare
health and working conditions of GRAs in Las Vegas with hotel room cleaners in San
Francisco where a similar survey was conducted in 1998 (Krause et al., 1999).
Specific Objectives. The specific objectives of this study include:
(1) Develop survey instrument in collaboration with GRA Research Advisory Council
(2) Assess current physical workload of GRAs
(3) Estimate change in physical workload over a 5-year period
(4) Assess psychosocial (organizational) job characteristics
(5) Assess health status, functional limitations, and quality of life
(6) Assess the frequency of work-related injury and duration of disability
(7) Measure heart rate and blood pressure at rest and during work
(8) Examine the associations between work and health while accounting for age
(9) Compare working conditions of GRAs in Las Vegas with those in San Francisco
(10) Compare health status of GRAs in Las Vegas with those in San Francisco and of the
general US population
Organization of this report. The report is organized in sections according to the
study objectives listed above with a description of the research methodology preceding
the report of the results. The report on the first objective, "Development of a survey
instrument in collaboration with room cleaners" is integrated into the description of the
study methodology. Comparisons of health and working conditions in Las Vegas with
San Francisco (Objective 9) or the general US population (Objective 10) are integrated
within the respective content areas presented in the results section. The English version
of the final survey instrument is attached at the end of this report.
12
METHODOLOGY
1. Questionnaire Survey Project Description and Study Design
Introduction. This is a collaborative project of the Las Vegas hotel guest room
attendants organized in the Culinary Workers Union Local 226 and researchers from the
Department of Medicine at the University of California at San Francisco and the Labor
and Occupational Health Program of the University of California at Berkeley. The
cooperation follows the model of participatory action research: room cleaners are
involved in all aspects of the project including the formulation of the research questions,
survey instrument development, study planning and design, implementation of the study
plan, and interpretation of study results. The main advantages of this approach are that
the research addresses the specific needs of the research user, that research questions and
methods are informed by the first hand experience and knowledge of the people whose
work conditions and health status are examined, and that a context is developed in which
interpretation of results become meaningful for all participants. In addition, involvement
of study participants will help the dissemination of study results among the various
stakeholders, and may increase the motivation for sustained efforts in planning and
implementing changes which improve working conditions, health, and quality of life for
room cleaners.
Unfortunately, during the initial phases of this study collaboration with management
could not be sought for several reasons. Most importantly, it was necessary to insure
anonymity of prospective participants, some of whom had expressed fear of reprisal by
supervisors. Therefore the survey administration and all research activities were
conducted off site. Further, the research project coincided with upcoming contract
negotiations which tend to temporarily reduce the willingness to cooperate between labor
and management. Since work conditions of supervisors or managers were not part of the
study's objectives, their input, which could be helpful in understanding and interpretation
of the results, can be sought at a later point in time. The following paragraphs describe
how the study was implemented.
Convening advisory council of room cleaners (focus groups). Union
representatives selected about 29 union members to establish a Research Advisory
Council to identify and discuss key issues of work and health among guest room
attendants and to collaborate with university researchers in the development and

13
administration of a survey instrument (hotel worker questionnaire). Selected members
represented a cross-section of low, middle, and high seniority guest room attendants from
24 different hotels in Las Vegas, not including the target hotels. All target hotels are
located on the "strip'" in the newer section of the city's gaming industry. Members of the
council came from diverse ethnic backgrounds and meetings were simultaneously
translated into Spanish by union field representatives and interpreters, who themselves
did not participate in the discussions.
Conducting focus group sessions. Meetings were led by researchers and health
educators from the University of California. A total of eight 3-hour focus group sessions,
attended by 25-29 guest room attendants, were held between June 7 and September 6,
2001, at the union hall in Las Vegas. Guest room attendants received a small stipend
($30 per 3-hour session) for their participation on the council. During the sessions guest
room attendants from 24 representative hotels described and compared their job tasks,
daily schedules, the type of hotels, rooms and guests, and changes in job tasks and in the
hotels during the last five years. They identified job stressors such as ergonomic
problems, physical strain, musculoskeletal problems, productivity demands, and
relationships with supervisors and management.
Selecting participating hotels for room cleaner survey. Researchers suggested the
selection of hotels that could be expected to differ in both physical workload and
psychosocial work conditions. Focus groups developed a list of characteristics for
classifying hotels according to these criteria. However, it was difficult to rank hotels in
these discussions because most guest room attendants typically had direct work
experience with only one hotel. Finally, five out of 39 unionized hotels were selected for
inclusion in the study, representing five different types: one upscale tourist hotel (Hotel
A), one mid-level tourist tour and travel hotel (Hotel B), one convention center and mid-
level tourist hotel (Hotel C), one all-suite mid-level tourist hotel (Hotel D), and one older
economy tourist hotel (Hotel E). The individual hotels were selected by union leaders
based on logistical and recruitment considerations, and to insure a minimum eligible
study population of 1,500 GRAs. The total bargaining unit list of these five hotels
counted 1724 guest room attendants. However, due to layoffs during the fall of 2001 and
exclusion of non-working and swing and night-shift workers, the eligible study
population was only 1276 active daytime GRAs at the time of the survey.

14
Defining the study population (inclusion and exclusion criteria). The eligible study
population was determined from union membership rosters provided by the union
director of operations. These lists were crosschecked with seniority lists and work
schedule lists provided by hotel management to the union. Swing and night shift GRAs
were excluded because their job tasks differ considerably form day shift work. The
eligible day shift study population derived this way consisted of 1303 guest room
attendants from the five selected hotels, 288 from Hotel C, 354 from Hotel A, 293 from
Hotel B, 256 from Hotel D, and 112 from Hotel E. This includes 27 GRAs (8 at Hotel C,
9 at Hotel A, and 10 at Hotel B) who appeared on the work schedule lists but did not
show up at the hotels during the survey weeks. These GRAs received no invitation to
participate in the survey and were therefore excluded from the study population for the
calculation of participation rates. Thus, the final eligible study population consisted of
1276 dayshift GRAs.
2. Development of Survey Instrument (Objective 1)
Identifying key issues and developing survey questions. Key issues covered by the
survey were identified in focus groups with the room cleaner Research Advisory Council
(see above). Researchers developed a draft survey using questionnaire items developed
from focus group discussions and items from standard questionnaires previously used in
other study populations. The standardized questions were used to assess organizational
and psychosocial job characteristics but were not specific enough to measure differences
in physical workload among hotels and were not sensitive enough to measure change
over the last 5 years. Therefore, most questions regarding the physical workload had to
be newly developed. This question development was greatly facilitated by an earlier
study of hotel room cleaners in San Francisco (Krause et al., 1999). For the psychosocial
work conditions, researchers presented union representatives with several established
instruments so that they could pre-select items that were of special interest. Researchers
integrated the original scales that included these items in the draft survey instrument to
insure that results could be compared with other study populations in future analyses. For
general health indicators and health functioning standard measurement instruments were
selected by researchers. In addition, based on focus group discussions, questionnaire
items on pain in different body regions were developed and included.
Pre-testing of survey questionnaire. The survey instrument was pre-tested in an
expanded focus group which included lower, middle, and high seniority guest room
15
attendants. This group of 20 room cleaners represented 15 different hotels. Translators
helped room cleaners to understand the English questions. Based on this pre-test,
researchers made minor edits and rearranged the format of a few questions to make them
easier to understand.
Translating the survey instrument into Spanish and Serbo-Croatian. The revised
survey instrument was translated by professional (Serbo-Croatian) and lay (Spanish)
translators. Limited resources did not allow for a formal back translation for the Serbo-
Croatian survey. A translation into Tagalog or other languages spoken by the substantial
number of hotel workers who had immigrated from the Philippines was not attempted
because most of these workers appeared to have sufficient English language skills.
3. Survey Administration
Introduction. Given that it was to be the first time that this population would participate
in such a comprehensive and complex survey and given the fact that on-site translators
did such an effective job during the pre-test of the survey instrument, it was decided to
invite guest room attendants to scheduled meetings where they could fill out the survey
questionnaire with the help of translators. This format was also chosen to secure
confidentiality of all responses and anonymity of all participants (see below). For this
purpose, a meeting room outside the participating hotels was selected for the survey
administration. This room was part of the union hall complex and has a separate entry and
exit doorway on the rear of the building not in sight of union offices. Only survey
administrators, university researchers, and participating guest room attendants were
allowed to enter this room. Survey administrators were trained and supervised by
university researchers.
Recruitment and training of survey administrators. Researchers recruited 27
research assistants including graduate students from the University of Nevada at Las
Vegas, the Community College of Southern Nevada, and guest room attendants from
non-participating hotels. These assistants received a one half-day training from
university researchers describing their roles and responsibilities, and an overview of the
questionnaire with special attention to difficult questions and skipping patterns.

16
Administration of questionnaires. The questionnaire was administered in two
waves, March 21 - 25 and April 4 - 8, from 5 p.m. to 8 p.m., to insure equal opportunity
for room cleaners to participate. Using flyers and union announcements and reminder
calls, all active dayshift guest room attendants working at the pre-selected hotels were
invited to fill out the survey questionnaire at the union hall. An attempt to mail
invitations failed because of some technical error in assigning zip codes, all mail was
returned by the post office. During the second wave of the survey, non-responders from
the first wave received another personal invitation from guest room attendants and union
representatives at their hotel to participate in the study.
At the time of the survey guest room attendants were checked in using a registration
form. The registration form asked the participant for consent to participate in a blood
pressure (BP) screening and measurement of height and weight, and whether they
preferred to fill out the survey themselves or be interviewed one-on-one. Participants
were provided with a questionnaire in their preferred language or, if this language was not
available, were given the option to be interviewed by a translator. The researcher affixed
a code-numbered label to the registration form, the survey, and to a blood pressure data
card if the participant agreed to participate in the BP screening, or to the BP log sheet if
she had participated in an earlier BP screening (see following description of blood
pressure pilot study). Again referring to the registration form, the researcher gave each
participant appropriate consent forms for her signature after explaining the content and
purpose of the form.
Researchers supervised the entire procedure; trained research assistants and
translators were available to assist guest room attendants if they did not understand a
question. Guest room attendants wishing to be interviewed were directed to the interview
table and given assistance. This option was utilized mostly by participants who had
limited reading and writing skills. Those who spoke Korean, Thai, Lao, Chinese, and
Tagalog had the option to be interviewed by researchers in their own language.
Completed surveys were deposited into a ballot-type box or sealed envelopes and were
handled only by university researchers. Union personnel did not have access to any of
the completed surveys.
Telephone follow-up. About 20 guest room attendants turned in incomplete surveys
with missing information on whole sections. These guest room attendants had to leave
early during the survey administration mostly because of home responsibilities and long
or shared commutes. During the second wave of the survey administration waiting

17
husbands and children of participants were allowed to enter the room in order to reduce
the potential of conflicts with personal or family responsibilities. Researchers and trained
research assistants made follow-up phone calls to participants with incomplete surveys
and were able to collect the missing information from about 8 of them.
4. Blood Pressure and Heart Rate Project Description and Study Design
Introduction. Concurrent with the survey project, the researchers from the
University of California (San Francisco and Berkeley) developed and implemented the
second project to collect cardiovascular and anthropometric measurements on a smaller
group of guest room attendants from selected hotels. The purpose of this second study
was to establish baselines for these measurements (blood pressure, heart rate, height and
weight measurements) and to measure the guest room attendants’ blood pressure and
heart rate responses to their work and home activities. This part of the overall study was
developed to address Goal 2 of the Study Goals, “measure heart rate and blood pressure
during and after work in a subsample of about 500 GRAs” and Specific Objectives 2.
“assess current physical workload of GRAs”, 6. “measure heart rate and blood pressure at
rest and during work,” and 8 ” assess health care needs.” This portion of the overall
study included two components: 24 hour monitoring of heart rate and blood pressure
using personal heart rate and blood pressure monitors in a sample of 591 GRAs; baseline
data collection of heart rate, blood pressure, height and weight after work, in a sample of
290 GRA survey participants.
Development of the data collection protocols. Several data collection protocols
were developed for this phase of the study including blood pressure measurement by
research assistants, heart rate measurement by research assistants, weight measurement
by research assistant, height measurement by research assistants. These protocols were
integrated into a manual used to train the research assistants who would be both taking
the measurements on the GRAs and training the GRAs to take their own measurements
with a personal device. In this way training was standardized and data collection
consistency maximized.
Blood pressure and heart rate measurement by research assistant. The protocols
for measurement of blood pressure with an arm cuff sphygmomanometer and manual
heart rate measurement were developed by researchers from the literature(1992) and
adapted, slightly, for the expected environment at the union hall. The protocol included
identification of the dominant arm, support for the arm to be measured, repeated

18
measurements, placement of the cuff, dial, and stethoscope, and finger placement for the
heart rate reading.
Height and weight measurement by the research assistant. Protocols for
measuring height and weight using a standard physician office scale were developed and
integrated into the training manual, including provisions to maintain participant
confidentiality.
Blood pressure and heart rate measurement by the individual participant. The
protocol for participant measurement of their own blood pressure and heart rate using an
electronic wrist cuff monitor were developed by the researchers. The study required a
standardized protocol which was slightly different from the manufacturer’s protocol and
not expected to influence the accuracy of the readings.
Data collection materials and physician referral forms. Several data collection
forms and protocols were developed to provide for consistency of reporting and retrieval
of the data, including materials to record baseline measurements and methods to track use
of different electronic wrist cuffs. A diary was developed for the participants to record
the measurements from the wrist cuff alongside the activity they were performing at the
time of measurement. In addition, because it was anticipated that some participants
might have unexpected high blood pressure readings or undiagnosed hypertension, a
protocol for notifying the participant of the readings and providing this information to
their individual physician was developed. Measurement criteria for referral to their
physicians was developed by researchers from the literature (Tsuji et al., 1997; Weisser et
al., 2000).
Consent forms. Consent forms for participation in each phase of this portion of
the study were developed and approved by the University of California at Berkeley and
San Francisco.
Pilot testing. In December 2001, a pilot test of the proposed blood pressure study
was done with the participation of approximately 40 Las Vegas GRAs. The study was
explained by the researchers, both in English and with the assistance of translators,
consent was given, and the participants were trained per the protocols on the use the
home measurement devices, and how to record the readings in the study diary. The
protocol included taking one blood pressure and heart rate reading before retiring that
night, one reading in the morning before work, and then 8 – 16 readings throughout the
day, following completion of several specific activities in the diary. Pilot participants
took the wrist cuff monitor home with them in the evening after training, and returned it
the next evening after work. After returning the device, and while the researchers were

19
downloading the memory from the devices, the participants completed a brief survey to
give the researchers information on any problems or any suggestions they had to make
the procedure easier. After the pilot test was done, small refinements of the procedure
were made, and the training manual for the research assistants was finalized.
Training the research assistants. Research assistants were recruited from the
University of Nevada at Las Vegas and the Community College of Southern Nevada to
assist with the participant training and data collection for this phase of the study. These
research assistants were trained over 2 days by university researchers, using the manuals
prepared for this purpose, and participating in protocol simulation and practice.
24-hour ambulatory blood pressure measurements. In February 2002, the
ambulatory blood pressure study was begun. The target of 100 room cleaners per hotel
was exceeded and a total of 591 participants from the five study hotels were recruited by
university researchers through the union. Over a period of five weeks participants came
in small groups to the union hall to be trained in the protocols, and to collect data on the
wrist cuff blood pressure monitors for one day each. Each participant had baseline blood
pressure, heart rate, weight and height measurements taken on the first night of their
participation. The research assistants, supervised by university researchers, trained the
GRA participants and took the baseline measurements. This procedure occurred over
several nights, requiring rotation of the devices. The research assistants had several
responsibilities, they described the study, obtained informed consent, trained the
participants, took baseline measurements, then downloaded data from the returning
participants (from the previous day and night) and cleared the memory of the devices for
the following day’s use. Each night the research assistants, while downloading the
measurements from the wrist cuff device, recorded any variation from the diary report
onto the diary (in red ink). Ambulatory blood pressure was measured with the Omron
HEM-630 device.
Resting blood pressure measurements during the questionnaire survey.
During the survey GRAs who had not participated in the ambulatory blood pressure study
were invited to have their blood pressure, heart rate, body weight and height taken during
the evening they completed the questionnaire survey. Each participant gave informed
consent, and using the protocols developed for collecting these measurements, research
assistants took blood pressure, heart rate, body weight and height measurements on an
additional 296 GRAs during the survey evenings. 6 records were excluded because of

20
missing information on blood pressure readings. In total, 783 survey participants had
their blood pressure measured either during the survey (290) or during the earlier
ambulatory blood pressure study (493).
Overall participation in blood pressure screening. 83.2 percent (783 out of 941) of
questionnaire survey participants had their resting blood pressure checked either during
the questionnaire survey or during the ambulatory blood pressure study. Another 98
GRAs had their blood pressure taken during the ambulatory blood pressure study but did
not participate in the survey. However, these participants completed a shortened
questionnaire during their blood pressure training session. In total, 881 (783+98) GRAs
participated in any blood pressure screenings.
5. Data Management and Analyses
Data management and data entry. Researchers developed (1) an electronic
database for all sample and questionnaire data using Microsoft Access 97 software for the
PC, and (2) a manual with decision rules for data entry and coding. Decision rules were
created to deal with ambiguous or contradictory responses. Data were entered from
questionnaires into the database by research assistants especially recruited and trained for
this task. Data entry was checked by two other people, with one person reading
information aloud from the questionnaire while the other person compared the item with
corresponding data in the database on the computer screen and by statistical algorithms.
Similar procedures were used to enter and check blood pressure screening data.
Statistical analyses. Electronic data were transferred from the Access Database into
Stata Statistical Software, Release 6.0 program for further analyses. Analyses for this
preliminary report include the calculation of frequencies, averages (means), standard
deviations (SD), and totals for each questionnaire item, and the construction of summary
scales. Analyses were done separately for each participating hotel and totals across all
hotels were also calculated. For differences in frequencies between hotels, chi-square
tests were used; for comparisons of means one-way analysis of variance was used.
Variables that showed any statistically significant difference between any of the hotels (p-
value less than 0.05) are marked by an asterisk in the tables, p-values greater than 0.05
but less than 0.1 showing a trend for statistical significance are marked by an asterisk in
parenthesis. In the description of the results, statistical significance is not emphasized,

21
because statistical significance is mainly a function of sample size and variation, which
are by definition relatively small in this study of a single occupation with five subsamples
from several hotels. The significance of data should be evaluated by the size of the
differences, the range of responses (captured by the standard deviation for means) and,
most importantly, by its meaning to stakeholders.

22
RESULTS
1. Study Population
Introduction. This section (1) reports how many of the guest room attendants from
the five selected hotels participated in the study by filling out the questionnaire, and (2)
describes general characteristics of the study participants such as their age and work
history. The text makes reference in underlined characters to Tables which can be found
at the end of the text section and to Questions numbered as they appear in the
questionnaire, a copy of which is attached to this document.
Participation rates. Participation rates are reported as the percentage of eligible
guest room attendants who completed the survey questionnaire. The universe of eligible
GRAs were those scheduled to work day shifts at five selected Las Vegas hotels in March
and early April 2002, i.e., at the time of the survey administration, as determined by hotel
work schedule lists (see above under Methodology). Of 1276 eligible daytime guest
room attendants 941 participated in the survey (74 percent participation rate).
Table 1 shows the numbers of eligible and participating guest room attendants and
participation rates separately for each hotel. In each hotel the majority of GRAs
participated and completed the survey questionnaire. Participation rates differed between
hotels ranging from 55 percent at Hotel D to 93 percent at Hotel E. GRAs attending a
focus group meeting at May 10, 2002, to discuss initial study results, attributed the low
participation rate at Hotel D to fears of reprisal from management. Apparently,
management did unilateral decide to raise the number of rooms to be cleaned within an 8
hour work day from 13 to 14 which gave rise to some protests from GRAs. In the weeks
before the survey was administered management fired 23 people who were wearing red
solidarity ribbons. According to a union spokesperson, 22 of them were rehired, while
one union person, who had explained to her co-workers that they were being paid by the
hour and not by the room, remained fired during the survey administration and up to the
time of this report writing. Union representatives shared the opinion that fear of loosing
one's job is the most likely explanation of the low participation rate at Hotel D.
Characteristics of study participants (Questions 2-3 and 55-68). Sociodemo-
graphic characteristics and work history information are available for the guest room
attendants who filled out the questionnaire.

23
Table 2 shows sociodemographic and occupational characteristics of study
participants by hotel.
Gender: Nearly all guest room attendants are women (99%).
Age: 42% of guest room attendants are less than 40 years old, 35% between 40 and
49 years, 19% between 50 and 59 years, and 4% were 60 or more years old. The average
age of all participants was 41.7 years (Standard deviation 9.6 years). Although there is no
significant difference in the mean age across hotels, the older age groups (50 or more
years) constitute a larger percentage of the workforce at Hotel A (25%), Hotel C (29%),
and Hotel E (27%) compared to Hotel B (15%) or Hotel D (15%). On average 23 percent
of guest room attendants were over 50 years old. The respective proportion was 44% in
the San Francisco Hotel Room Cleaner Study, where participants were on average 6 years
older (47.7 years).
Ethnicity, language and nationality: The majority of guest room attendants consider
their race or ethnic group to be Latina (76%). Only 6 percent classify themselves as
African American, 6 percent as White/Caucasian, and less than 1% as Native American.
Filipino and Asian constituted each 5 percent of the study population. Significant
differences regarding ethnicity were found between the hotels. The highest proportion of
Latinas was found at Hotel B (90%), the highest proportion of African Americans at
Hotel E (16%), and the highest proportion of Asians at Hotel C and Hotel D with 10
percent each. Most employees were born outside of the US (85%) and for 89 percent
English is not their native language.
Years of education: GRAs on average report about 9 years of education, however,
some room cleaners counted years with some on-the-job training thereby making these
numbers difficult to interpret. However, no significant differences were found between
hotels.
Family income: The monthly family income before taxes averaged $2,127 dollars.
Homeownership: 60 percent of room cleaners owned their home or apartment, 40
percent were renting.
Household size and dependents needing care: On average GRAs lived in households
with three adults and 2.4 children. 59 percent of households needed child, elderly or
disabled care for an average of two dependents.
Years working as guest room attendant: On average, participants had worked as
guest room attendants for 7.7 years, mostly at the current hotel, and there were no
significant differences between hotels.
24
Work status: Most guest room attendants are full-time employees (92%). The
number of part-time employees differed significantly between hotels, ranging from 5
percent at Hotel B to 15 percent at Hotel E.
Work hours: Full-time employees work at least 8 hours five days per week,
respondents reported a total of 42.2 hours on average. Part-time employees generally
work 8 hours per day but less than 5 days per week; respondents reported an average of
18 hours per week.
Second jobs were held by a total of 4 percent of guest room attendants.
Comparison of responders and non-responders. The study population comprises a
non-probability sample of all eligible guest room attendants and the sample therefore may
be biased in the direction of availability and willingness to participate. For example,
people who are not working during survey days are less available, especially if they are
on sick or disability leave. This could mean that the health status of employees appears
to be better in the study sample than in the entire room cleaner population. No data were
available for people who did not respond at all, making it impossible to compare
responders and non-responders. However, given the high participation rate of 74 percent,
differences between responders and non-responders are unlikely to bias the study results.
In general, epidemiologists consider studies with response rates of more than 60 or 70
percent as being of high methodological quality and unlikely to be biased by self-
selection of respondents.
2. Current Physical Workload and Ergonomic Problems (Objective 2)
Introduction. General questions about physical workload (15e, 16l) were taken from
standardized questionnaires which were originally designed to capture differences
between occupations, but not within one particular occupation. For this study comparing
physical workload within the same occupation new questions were developed in focus
groups. These questions capture those specific features of the physical work environment
of guest room attendants that may differ from establishment to establishment. The
discussions with guest room attendants in focus groups revealed that the number of rooms
to clean per day does not fully account for differences in physical workload experienced
by guest room attendants. Guest room attendants developed a long list of specific factors
which influence their workload even if the number of rooms is equal. This list was
incorporated in questions 6-14 developed specifically for guest room attendants. These

25
questions assess the workload of guest room attendants broadly by number of buildings,
floors, rooms, and beds, and baths per day (Questions 6-9), and in detail by assignment to
special rooms ("check-out," "VIP," "rush," "Jacuzzi"), type of beds ("king," "queen,"
"roll-away" etc.), special amenities (e.g., coffee machines), and frequency of specific
tasks or problems involved in room cleaning (Questions 12-14).
Responses to questions about physical workload are not presented in the same order
they were asked in the questionnaire. Rather, responses to the more general questions on
physical workload are reported first, followed by responses to the more detailed questions
regarding specific physical job characteristics. The latter are summarized in Tables 5-9.
Physical job demands (Question 15e). Nearly all guest room attendants (87%)
described their job as "physically demanding." The percentage was highest at Hotel C
and Hotel D (94%), followed by Hotel B (90%), Hotel A (89%), and Hotel E (87%). The
more detailed questions developed specifically for this study show that there are a
number of aspects of the physical workload that differ significantly between hotels.
Physical workload (Questions 6-9). The physical workload of guest room
attendants is in part determined by the number of assigned rooms during a typical day.
Unlike in San Francisco, there is no contract language setting a daily maximum number
of rooms a GRA can be assigned. Therefore, the number of rooms management expects
to be cleaned during an 8-hour workday varies between hotels in Las Vegas. For
example, workers reported in focus groups that their quota was 10 regular rooms and 4
suites at Hotel B, and 12-13 regular rooms and 1-2 suites at Hotel C. Some hotels have
rules that give more credit to cleaning suites than to cleaning regular rooms. For
example, at Hotel E 1 suites counts as 2 rooms, and a penthouse apartment counts for 3
rooms. At Hotel C, normal suites count as 1 room and penthouse suites as 7 rooms. At
Hotel D, so-called mini-suites count as 1 room, other suites between 2-4 rooms, and
penthouse suites for 4 rooms. At Hotel B most suites get credited as 1.5 rooms. At Hotel
A, suites count as 3 rooms, or as 4 rooms if they contain two bedrooms. GRAs reported
an increase of their quota in several hotels. GRAs reported that the 2-bedreoom suites at
Hotel A used to get 6 rooms credit until about 2 years ago; now the credit is only 4
rooms. GRAs from Hotel E reported a reduction of credits for some suites, and a change
of total number of required rooms from 12 to16 to 17 or 18 and back to 16 over the past
ten years. Hotel D workers were required to clean 13 suites until last year when the quota
was increased to 14. None of the participating hotels had any rule about dropping the
number of rooms after a certain number of checkouts. However, Hotel E gives 1 room

26
credit if the penthouse suite is a checkout. For comparison, in San Francisco the
maximum number of regular rooms is currently 14, and one room gets dropped for every
7 checkouts, and 2 rooms for every 10 checkouts. Hotels in Los Angeles drop 1 room for
every 8 checkouts. In Atlantic City, the maximum number of regular rooms per day is 14,
and 2-room suites count as 2 regular rooms.
Questions 8 a-d assess the number of different rooms cleaned during the last workday.
This question takes a snapshot at the physical workload during the last workday. The
most recent workday was chosen to facilitate accurate recall. Since questionnaires were
filled out during different weekdays, aggregated results from this question can be
expected to be comparable to an average "typical" workday. However, since
questionnaires were administered during March and early April, i.e., outside the Las
Vegas high tourism and convention seasons, responses may underestimate the average
workload. Also, following the events of September 11, 2001, occupancy rates were still
below average. On the other hand, reduced staffing levels after lay-offs following the
events of September 11, 2001, may have resulted in an increased workload for GRAs
compared to pre-September 11 levels.
The workload in each room not only varies by number and type of room but also by
the number and type of beds and the corresponding number of guests staying in the
rooms. Therefore, guest room attendants were also asked to recall the number and type of
beds they made during their last workday (Question 8 e, f, g). The highest number of
guests per room or suite is expected during the holiday and summer vacation seasons
when more families travel to Las Vegas. During these times up to 8 or 9 persons may
stay at a suite including the use of up to 3 rollaway beds per suite.
Table 3 shows the mean number of rooms and beds cleaned per day. The average
total number of rooms cleaned was 15.2, ranging from 13.8 at Hotel A to 17.1 at Hotel D.
The average number of regular rooms ranged from 5.6 (Hotel D) to 14 (Hotel C), and the
average number of suites from 1.5 at Hotel B to 11.6 at Hotel D. Although Hotel D is
considered a suite-only hotel, GRAs at Hotel D reported an average number of 5.6 regular
rooms per day. This discrepancy was presented to employees in a focus group discussing
preliminary survey result and the following explanation emerged in the discussion: Some
room cleaners probably converted mini-suites into regular rooms, because they count as
one regular room only.

27
There are four types of "special rooms" requiring extra work efforts: checkouts, VIP's
(requiring special cleaning and stocking,), rush rooms, and rooms with Jacuzzi (to be
cleaned at floor level). Daily checkouts range from 5.3 at Hotel D to 6.9 at Hotel C, and
VIP's and rush rooms combined ranged from 0.4 at Hotel B to 1.5 at Hotel E. The total
number of all kinds of special rooms assigned per day was on average 10.2, highest at
Hotel A (10.7), and lowest at Hotel D (9.2).
The number of beds to be made each day averaged 19.4 and ranged from 15.8 (Hotel
A) to 22.9 (Hotel B). The breakdown by type of bed is also shown in Table 3. On
average, a room cleaner makes about 12 "Queen", about 6 "King", and 1 "Rollaway, Crib
or Sofa" beds each day. This translates in at least 19 guests per day, but may represent an
average of up to 28 guests if Queen and King size beds are occupied by 2 persons. Since
the amount of trash and the amount of linen, bath towels, and garbage is proportional to
the number of guests, future assessments of the workload of room cleaners should take
the number of guests into account.
Assignments of the same worker to different floors or buildings during the day adds
to the physical workload (walking, pushing or pulling cart) and can be time-consuming,
depending on frequency, distance, service elevator wait time, etc. Usually there is only
one service elevator for room cleaners on each floor, and they are not allowed to use other
elevators which results in wait time, especially at the beginning of the shift when all room
cleaners travel to their different floors. Therefore, physical workload measures need to
also take into account the frequency of traveling between floors or buildings. Questions 6
and 7 capture these circumstances for a normal workday.
Table 4 shows the number of floors or buildings traveled during a typical day. As
shown in the last columns of Table 4, 64 percent of all guest room attendants travel to
more than one floor during a typical workday, and 14 percent travel to more than one
building. The required traveling differs considerably between hotels. For example, the
percent of guest room attendants assigned to only one floor is 71% at Hotel A, 34% at
Hotel B, 20% at Hotel C, 16% at Hotel D, and 12% at Hotel E (see Table 4). Most (86%)
GRAs work in one building with the exception of Hotel E where 45 percent work in two
or more buildings during a typical workday.
Pushing and pulling the linen cart constitutes heavy physical labor. Some hotels in
Las Vegas (e.g., New York, Paris, and Cesar’s) provide electrical carts but none of the

28
hotels selected for study in Las Vegas or previously in San Francisco furnished carts with
electrical motors.
Comparison of assigned rooms in Las Vegas and San Francisco hotels. Table 5
compares the mean number of assigned rooms and suites between hotels in Las Vegas (in
March 2002) and in San Francisco (in March 1998). Las Vegas GRAs clean one more
room per day compared with their colleagues in San Francisco in 1998. The rooms they
clean are also more often suites; on average they clean 3 more suites per day than San
Francisco room cleaners. The total number of assigned rooms requiring special efforts is
also higher for GRAs in Las Vegas if Jacuzzis are included, although checkouts and VIP
or rush rooms were more frequently assigned in San Francisco. The differences reported
here are based on a survey of San Francisco hotels before the number of assigned rooms
was decreased by 1 room (or 7 percent) in new contracts negotiated in 1999. Therefore,
the data presented here suggest that GRAs in Las Vegas carry an about 14 percent higher
room quota than their colleagues in San Francisco.
Frequency of specific work tasks (Question 12). An even more detailed assessment
of the current physical workload was performed at the task level. In focus groups, guest
room attendants developed a list of common work tasks and job problems which they felt
determined their workload beyond the number of rooms, beds, or guests. These tasks or
problems are listed in Question 12. Guest room attendants were asked how often these
items usually occur.
Table 6 shows the average frequency of each work task or problem per day for each
hotel and across all hotels. The 10 most frequently occurring problems in across all
hotels were "Clean large glass or mirror doors" (on average 10.7 times per day) followed
by "call in from each room" (9.4 times per day), "Problems dusting high or low areas in
room" (9.1 times per day), "Clean marble sinks" (9.0 times per day) and "Lots of garbage
left in the room" (8.1 times per day), "Restock missing supplies on cart" (7.7 times per
day), "Bathrooms very wet and dirty" (7.7 times per day), "clean chrome or brass
fixtures" (7.2 times per day), "Ashtrays in room need cleaning" (7.1 times per day), "food
left in room on tables or carpet" (6.9 times per day) or "Extra scrubbing required in
bathroom" (6.6 times per day), in that order.
In this study we did not measure the duration of time required to complete any of
these tasks. However, experience from hotels in San Francisco suggest that these tasks

29
may substantially contribute to the average time needed to complete cleaning a unit.
Based on data from San Francisco hotels the following items represent the most time
consuming tasks: "Restock missing supplies on cart" (about 16 minutes each time),
dealing with bathrooms that are "very wet or dirty" or "require extra scrubbing" (12.7
minutes each), "need to travel to another floor" (11.8 minutes each time), and "Do not
disturb sign on door" (10.7 minutes) requiring a return visit at a later time.
Combining the frequency and duration of each task can lead to an estimate of extra
work time spent on dealing with each problem. For example, guest room attendants in
San Francisco on average estimated that it takes them 8.8 minutes extra time if they have
to deal with "lots of garbage left in the room." Multiplying this number by the average
number of times this occurs in Las Vegas yields an average of 71 minutes of extra work
each day (8.1 x 8.8). However, these estimates should be interpreted with caution
because they are based on subjective assessments of time and on estimates from hotels in
a different city. Future studies should employ direct observation by researchers to
validate these estimates. Despite these limitations these calculations demonstrate that
these extra tasks or problems may have an important impact on time needed to clean a
certain number of rooms. Clearly the frequency of these extra tasks and problems need to
be considered in setting equitable room quota for hotel room cleaners.
Ergonomic problems (Question 14). The physical workload of guest room
attendants increases when equipment and supplies are inadequate, need repair or
replacement, and when there is no housekeeper to turn to when these or other problems
occur. During focus groups, guest room attendants reported several such recurring
problems that cannot be easily measured in terms of frequency or duration, ten of which
are listed in Question 14. Examples include difficulties with heavy or broken linen carts
or dysfunctional vacuum cleaners. Guest room attendants were asked how much of a
problem each item is in their work. The four answer options were "No problem at all",
"Very little problem", "Somewhat of a problem", and "A big problem".
Table 7 shows the percentage of guest room attendants who reported experiencing
some problem or big problems with these items in their work. The three most frequently
reported problems of this severity were "Linen cart too heavy" (84% of all guest room
attendants), "Heavy bedspreads or comforters" (74%) and "cleaning supplies irritate skin
or eyes" (72%). In addition 62 percent of all guest room attendants reported having some
or big problems with "Vacuum cleaner too heavy," "Vacuum cleaner needs repair"
30
(especially at Hotel C), and "cleaning supplies do not clean well" (especially at Hotel D).
It is interesting to note that specific problems were much less of a problem in certain
hotels, e.g., only 37 percent reported "vacuum cleaner needs repair" at Hotel D as
problematic, indicating a possibility for improvement in other hotels.
Conclusion (current physical workload and ergonomic problems). The number
of rooms assigned varies by hotel and is on average higher than in comparable hotels in
San Francisco. There are also considerable differences in current workload by several
other measures between different hotels. Therefore the number of rooms assigned per
room cleaner per day is insufficient to measure physical workload or to assure appropriate
and equal workload assignments for guest room attendants. Important additional factors
that determine the actual workload of guest room attendants include the number of guests
staying in each room, the number of beds to be made, the need to travel to another floor
or building, cleaning Jacuzzis, marble, glass, and mirrors, the need to restock missing
supplies on cart, garbage and food left in the room, and having to call in from each room,
among other items. The considerable variation between hotels in Las Vegas and the
lower number of rooms assigned to room cleaners in San Francisco indicate a potential
for interventions to reduce physical workload for GRAs in Las Vegas hotels.
3. Change of Physical Workload During the Last 5 Years (Objective 3)
Introduction. Since there is no contractual language specifying the maximum
number of rooms to be cleaned per day or any credits for suites, checkouts and other
special rooms, it is difficult to document the exact degree of an increase in physical
workload during the past five years. However, as described in the previous section,
GRAs reported an increase of the room quota in several hotels during previous years.
Together with structural changes and continuous upgrade of Las Vegas hotel rooms, one
can infer an increase of physical workload in terms of the umber of units to be cleaned
and in terms of specific work tasks related to upgrades. ON the other hand, some work
task may have been reduced. The questionnaire therefore includes 27 questions to assess
any change in physical workload over the last five years. One general question (Question
15f) and 26 task-specific questions (Question 13a-z).
Question 15f. On average, 87 percent of all guest room attendants agreed with the
statement "Over the past few years, my job has become more and more demanding" (94%

31
agreed at Hotel D, 88% at Hotel C, 87% at Hotel A, 84% at Hotel E, and 83 % at Hotel
B). Only 13 percent disagreed. In addition to an increase in room quotas other
explanations for increased workloads could be that the workforce perceives the same job
tasks as more demanding because of aging or ill health. However, an alternative
explanation was offered by guest room attendants in focus groups. They reported that
over the last years they have more extra work to perform in each room because of
upgrading of facilities (e.g., more sheets per bed, more glass or mirror doors) or because
of an increase in trash, food, and room service trays left in the room, and other changes.
Question 13. Question 13 was designed to find out whether such extra tasks or
problems occurred "less," "about the same," or "more" than five years ago. Question 13
lists the same 26 specific work tasks used in Question 12 (see above, table 6) for
measuring the current workload.
Table 8 summarizes the responses to question 13. On average, 4.2 of the 26 tasks are
performed less often than five years ago, 12.4 tasks are performed about as often as
before, and 9.4 tasks are performed more often than five years ago. The greatest number
of tasks required more frequently was reported at Hotel A (10.3 on average) and the
fewest tasks at Hotel B (8 on average).
Table 9 shows in detail for each of the 26 work tasks which percentage of workers
does them more often, and which percentage does them less often. (The percentage of
workers doing these tasks "about the same" is not presented in the table but can be easily
calculated by subtracting the two reported percentages from 100). Across all hotels, 50 to
59 percent of guest room attendants report that lots of garbage is left in the room more
often, possibly reflecting the increase in room service, availability of take-out food,
and/or a change in the behavior of guests over the years. In an advisory group meeting
discussing these preliminary results, guest room attendants commented that other changes
may be even more important, namely recent room upgrades including installation of glass
mirrors and doors, chrome and brass fixtures, and marble sinks to be polished. Other
examples with increasing frequency in all hotels include "Problems with replacement
linens" (35-46%), "Need to put away iron and ironing board" (27-58%), and "Need to
restock missing supplies on linen cart" (28-51%) among others. Changes in the
frequency of job problems varied considerably between hotels indicating a potential for
improvement.

32
Conclusion (change of physical workload during last five years). Although no
longitudinal data are available, the results of this survey and the focus group discussions
suggest that the physical workload of guest room attendants increased during the last five
years. The extent of the increase, the particular tasks involved, and the reasons for the
increase differ between the five hotels studied.
4. Psychosocial Job Factors (Objective 4)
Introduction. The term "psychosocial job factors" is used as a catchall term to
describe a large number of job factors including a host of conditions in the job and work
environment. In general, these include characteristics of the "work organization" in terms
of job content (e.g., job clarity, job control, and psychological or mental job demands),
temporal aspects (e.g., work and rest schedules), interpersonal relationships at work (e.g.,
supervisor-employee relationships and social support), organizational characteristics
(e.g., communication issues), financial aspects (e.g., economic reward in terms of pay or
benefits), and community aspects (e.g., job security, and occupational prestige and
status). These psychosocial job factors are often thought of as "risk factors" that may
pose a threat to health and well-being. Hazardous combinations of these factors are
sometimes referred to as "job stress" or "job strain" and may also have a negative effect
on job satisfaction and productivity.
Questionnaire items were selected from standardized questionnaires in the scientific
literature. Researchers discussed these existing questions with union representatives and
the Research Advisory Council of guest room attendants to select the most appropriate
questions. Some items were selected despite a low immediate relevance for guest room
attendants if these items were useful in constructing standardized scales and summary
scores. Standardized scales are needed to facilitate comparisons with room cleaners in
other cities and other working populations.
The following section of the report describes psychosocial factors in the work
environment of guest room attendants regarding (1) the overall potential of the job (i.e.,
job satisfaction, job security, job promotion, and quality of work), (2) work stress (i.e.,
job strain, time pressure, psychological demands, imbalance between work effort and
rewards), and (3) communication and support within the organization (i.e., problem
solving capacities, social support at work, employee-supervisor and labor-management

33
relations, and responsiveness of unions and management regarding health and safety
issues at work). Responses to questions about psychosocial job factors are not presented
in the same order they were asked in the questionnaire. Rather, responses are presented
in themes displaying individual questionnaire items or standard summary scales which
combine responses of several questions into a single score. Results are summarized in
Tables 12-25 described in detail below.
Potential of the Job
Job satisfaction (Question 20). To assess the overall level of job satisfaction guest
room attendants were asked, "How satisfied are you with your job?"
Table 10 shows the percentage of guest room attendants for each answer by hotel.
Overall, about 55 percent of guest room attendants reported to be "not at all satisfied"
(25%) or "not too satisfied" (30%) with their job, 39 percent were somewhat satisfied,
and 6 percent were very satisfied. Differences between hotels were not statistically
significant. However, satisfaction levels appear considerably lower among GRAs in Las
Vegas compared to San Francisco room cleaners. In the 1998 survey of San Francisco
room cleaners about 21 percent of room cleaners reported to be "not at all satisfied" (3%)
or "not too satisfied" (18%) with their job, 50 percent were somewhat satisfied, and 29
percent were very satisfied. In other worker populations reported levels of job
satisfaction are usually considerable higher than the ones observed among Las Vegas
GRAs. The results warrant further investigation of the underlying reasons for the low
level of job satisfaction in this group. Some reasons could be an increased prevalence of
psychosocial stressors described below.
Job security (Question 15k). Overall, 69 percent of guest room attendants rate their
job security as poor, ranging from 65 percent at Hotel A to 82 percent at Hotel D. (See
Table 11). These rates are considerable higher than those in San Francisco in 1998 where
the average was 48 percent with a range from 34 to 54 percent. Recent layoffs after
September 11, and targeted firing at Hotel D described above may have contributed to
this high level of job insecurity among Las Vegas GRAs.
Undesirable changes in the work situation (Question 15h). Overall, 72 percent of
workers report that they "have experienced" or "expect to experience an undesirable

34
change in my work situation". The percentage ranges from 67% at Hotel A to 82% at
Hotel D. (See Table 11). In San Francisco the overall percentage was 46 percent.
Job promotion prospects (Question 15j, and 15p). Overall, 67 percent of guest
room attendants report that their "job promotion prospects are poor" (Question 15j). This
assessment was shared by the highest percentage of workers at Hotel C (70%), and was
endorsed the least at Hotel A (64%). When workers were asked to consider all their
"efforts and achievements," 40 percent evaluate their "prospects for job advancement" as
"adequate" (Question 15u), ranging from 32 percent at Hotel D to 44 percent at Hotel C
(see Table 11). For comparison, in San Francisco, 61 percent rated their work prospects
as adequate.
Quality of Work (Questions 16a-c, 16g, 16i, 16n). The quality of the type of work
was assessed by questions about repetitiveness (Questions 16b and 16g), skill
development (Questions 16a and 16i), and skill utilization (Questions 16c and 15s).
Table 12 shows the percentage of guest room attendants who "agree" or "strongly
agree" with different statements about the quality of their work. Regarding repetitiveness
of work tasks the majority of guest room attendants (73%) describe their jobs as
"involving doing a lot of things over and over again," less so at Hotel B (66%), and more
so at the other hotels (73-77%). In terms of task variety on the job, on average 51 percent
of guest room attendants report "I get to do a variety of different things on my job",
without any significant difference between hotels. Across all five hotels the majority of
guest room attendants (60%) feel that their jobs require them to "learn new things" and
26% say that they have an "opportunity to develop" their "own special abilities" (skill
development). In terms of being able to apply their skills (skill utilization) an average of
54 percent guest room attendants agree with the statement "My job requires me to be
creative", fewer at Hotel E (46%) and more at the other hotels (54-59%). Room cleaners
in San Francisco reported higher levels of repetitiveness (81% "doing things over and
over again") but also higher levels of skill development (78% learn new things, 53%
develop their own special abilities).
Conclusion (job potential). In general, the occupational potential of guest room
attendants appears to be restricted in all hotels in terms of job security, job promotion
prospects, and the quality of work. While repetitiveness of work was rated similar in Las
Vegas and San Francisco, all other aspects of the quality of work, job security, and
experience or expectations of undesired changes at work were rated considerably worse in

35
Las Vegas hotels. The remarkably low level of job satisfaction among Las Vegas GRAs
may be an expression of these and other working conditions described in this report. The
responses did not vary substantially between hotels with the possible exception of job
security being rated as poor by 75 and 77 percent of employees at Hotel E and Hotel D
compared to 65 and 66 percent at Hotel A and Hotel B, respectively.
Work Stress
Time pressure (Questions 16j, 16n, 15a, and 15d). Time pressure on the job has
been measured with the following four statements: "My job requires working very fast"
(Question 16j), "I have enough time to get my job done" (Question 16n), "I have constant
time pressure due to a heavy workload" (Question 15a), and "I am often pressed to work
overtime" (Question 15d).
Table 13 shows the percentage of guest room attendants agreeing with these
statements about time pressure on the job. An average of 75 percent of all guest room
attendants report that their jobs requires them to work very fast, and 88% report having
constant time pressure due to a heavy workload. On average only 18% of GRAs say that
they have enough time to get the job done with the lowest percentage at Hotel D (14%).
In comparison, an average of 46 percent of San Francisco room cleaners reported to have
enough time to get their job done. Nearly a quarter of GRAs (23%) feel pressed to work
overtime with the highest percentage at Hotel B (30%) and the lowest at Hotel A (19%).
A similar percentage (24%) of hotel room cleaners in San Francisco reported pressure to
work overtime. Therefore, the higher levels of time pressure reported by Las Vegas
GRAs are less likely a result of official overtime work but more likely a reflection of
higher workloads including higher quotas of rooms and suites, and more special features
such as Jacuzzis or shiny surfaces to clean as described above.
It appears that GRAs cope with time pressure and complete assigned rooms by
working longer or through breaks. Table 14 shows that two thirds (66%) of all GRAs
reported skipping or shortening their lunch or break or working longer hours. And 90%
of these say they do this "to make sure I can finish all rooms by the end of the day."
Thirty percent say they do this in order "to avoid discipline, points, or other penalties."
The practice of skipping lunch and breaks and working longer was reported at similar
high levels from all hotels. However, fear of discipline differed significantly between

36
hotels and was highest at Hotel D (39%) and lowest at Hotel E (24%). In focus groups
GRAs reported that management offers small tokens such as buffet coupons as incentives
for cleaning extra rooms (in addition to the regular daily quota). Further it was reported
that room cleaners who agree to clean extra rooms have to personally ask for overtime
pay at some hotels.
Conflicting demands (Questions 16o and 15b). Conflicting demands at work made
by others on guest room attendants were reported by 63 percent of all workers (calculated
from question 16 o: 63 percent = 100 percent minus 37 percent of guest room attendants
saying they are free of conflicting demands). Frequent interruptions and disturbances
during work (Question 15b) were reported by 73 percent of all workers. The highest
percentage of guest room attendants reporting these stressors (or not being free from
them) was found at Hotel D (72 percent reported conflicting demands, and 76 percent
reported frequent interruptions). (See Table 13)
Job Strain: Job stress as the combination of high psychological job demands
(Questions 16j-k,and 16m-o) and low job control (Questions 16d-f, 16h). Stress
researchers commonly measure job stress by asking questions about the psychological or
mental demands of the job together with questions about how much control or influence
workers have over their work, including how and when to do the work. The combination
of high job demands and low job control is often called "job strain" and can lead to stress
and disease (including musculoskeletal and cardiovascular diseases) in employees
working under such conditions.(Bernard, 1997; Karasek and Theorell, 1990; Krause et
al., 1998; Schnall et al., 1994)
Table 15 shows all those questions that have been taken from a standard "Job Content
Questionnaire" (developed by Dr. Karasek and his colleagues in 1985(Karasek, 1985)),
which has been used in many populations. Two sets of questions are asked to measure
job stress in this questionnaire. One set asks about the psychological demands at work
("job demands") and the other set asks about worker control over the job ("job control").
Some responses to these questions have been described above. They are presented again
in this table, but are not being discussed again. Summary scores of all answers are
presented in Tables 16 and 17.
Table 16 shows the average sum score by hotel for all questions about psychological
job demands and, separately, for all questions about job control. Responses were recoded

37
and combined in a way so that higher average values indicate higher job demands or, in
the case of job control, more worker influence. There are statistically significant
differences between the hotels regarding job demands but not regarding job control. The
highest job demands were found at Hotel D (average score of 39.2), the lowest at Hotel E
(average score of 34.5). Job control averaged 56.1 points across hotels.
Table 17 combines the results regarding job demands and job control in a single
measure of job stress called "job strain". The calculation was done as follows. All
workers were evenly split into two groups above and below the median ("middle") value
for job demands. Those workers with a higher than median value were considered having
high job demands, and those workers with a lower than median value as having low job
demands. The same procedure (median split) was used to determine which workers have
high control over their job, and which have low control. A worker is considered to
experience "job strain" if her work can be described as having both high demands and
low control. Table 17 shows the percentage of workers experiencing high job strain by
hotel. A total of 25 percent of workers experience high job strain across all hotels. There
are only slight and statistically not significant differences between the five hotels.
Very high levels of job stress, based on the upper third (tertile) of workers in terms of
job demands and the lower third of workers in terms of control, were reported by 15
percent of all workers. Again, differences between hotels were not statistically
significant.
Comparison of psychological demands and job control in Las Vegas GRAs with
San Francisco GRAs and female public transit operators. Because recent data for the
general population are not available, another high stress occupation in the service sector,
urban public transit operators (Evans, 1994; Krause et al., 1998), was chosen as a
comparison group. Data on San Francisco transit operators was collected between 1993-
and 1995 (Krause et al., 1998; Krause et al., 1997). A within-industry comparison was
made with 1998 data from San Francisco hotel room cleaners. To compare the level of
psychological demands and job control between these groups, the same questionnaire
items and the same cut-points (as reported for Las Vegas) were used for all groups
compared.
Table 18 compares the scores for psychological demands, job control, and job strain
in Las Vegas GRAs with GRAs in San Francisco and female San Francisco public transit
operators. Las Vegas GRAs scored on all scales the least favorable values; that is, they

38
had the highest psychological demands, the lowest control in their jobs, and experienced
the highest level of job strain. While the differences were rather small regarding
psychological demands, they were substantial for job control, where Las Vegas GRAs
scored on average 5 points less than female public transit operators and 7.4 points less
than San Francisco GRAs. To compare the level of job strain of GRAs in Las Vegas to
room cleaners in San Francisco, job strain was recalculated among the comparison groups
using the cut-points that defined the median or tertile split in Las Vegas. Using Las
Vegas as a standard in this way, 13 percent of San Francisco room cleaners experienced
high and 4 percent very high job strain (see Table 18). This means that Las Vegas room
cleaners experience nearly twice as often (1.9 times) high levels of job strain and nearly
four times as often (3.8 times) very high levels of job strain than their colleagues in San
Francisco. The difference is even more striking (3- and 4-fold, respectively) when
comparing Las Vegas GRAs to San Francisco bus drivers, an occupational group with
documented high job stress. Another indicator of job stress, effort/reward imbalance, is
nearly twice as common among Las Vegas GRAs than among San Francisco bus drivers.
Effort-reward imbalance: Job stress as the combination of exerting high work
efforts and receiving low rewards (Question 15). Another questionnaire for measuring
job stress was developed more recently by Dr. Siegrist and has been used in few other
populations at this time.(Siegrist, 1996) It is based on questions about how much
personal effort employees put into their work, with how many physical and psychological
demands they have to cope with, and about how many rewards they receive in return (in
the form of respect from their supervisors, prestige and support at work, job security, job
promotion, or adequate salary). The combination of high efforts and low rewards is often
called "effort-reward imbalance" and can lead to stress and disease (including
cardiovascular disease such as myocardial infarction) in employees working under such
conditions.
Table 19 shows all those questions that have been taken from Dr. Siegrist's standard
"Effort-Reward-Imbalance Questionnaire." Two sets of questions are asked to measure
job stress in this questionnaire. One set asks about the demands and obligations at work
("extrinsic efforts" or "effort") and the other set asks about perceived rewards for these
efforts ("rewards"). Some responses to these questions are described in other parts of this
report, but they are presented again in this table to give a complete list of questions used
in this standardized stress measure. There were significant differences between hotels for
several effort and reward items (indicated by an asterisk in Table 19).

39
Summary scores of all answers to questions listed in Table 19 are presented in Tables
20 and 21.
Table 20 shows the average sum score by hotel for all questions about demands and
obligations at work (efforts) and, separately, for all questions about rewards. Responses
were coded and combined in a way so that higher average values indicate higher efforts
or more rewards. The highest efforts were required at Hotel D (average score of 21.4),
however differences between hotels were small and not statistically significant. Rewards,
on the other hand, were significantly different between hotels: they were highest at Hotel
B (37.2) and Hotel C (36.6), and they were lowest at Hotel D (32.8) and Hotel E (33.5).
There was a tendency for hotels requiring the most effort to provide the least reward for
guest room attendants. This pattern can be considered a stressful effort-reward imbalance
on the group level.
Table 21 combines the results regarding efforts and rewards in a single measure of job
stress called "effort-reward imbalance" for each worker. The calculation was done as
follows. Each worker's score on efforts was divided by her score on rewards and
weighted by the number of questions, so that a value greater than one indicates an
imbalance in terms of high efforts and low rewards. Table 21 shows the percentage of
workers experiencing this effort-reward imbalance, by hotel. Statistical significant
differences were found between hotels. The proportion of workers reporting effort-
reward imbalance is highest at Hotel D (70%) compared to 53-56% in the other hotels.
On average, 57% of GRAs experience effort-reward imbalance in their jobs. The
comparable calculation for San Francisco room cleaners was 31 percent, but in one San
Francisco hotels the percentage of room cleaners with effort-reward imbalance was only
9%.
Conclusion (work stress). More than three quarters of all GRAs experience time
pressure, two-thirds skip lunch or breaks or work longer hours to complete their work.
High levels of job strain were experienced by a quarter of all employees. On average, a
total of 78 percent of guest room attendants experience an imbalance between their work
efforts and rewards. Most indicators of job stress were higher in Las Vegas than in San
Francisco hotel workers. The level of job strain measured by a standard questionnaire was
2-4 times higher among GRAs in Las Vegas than among San Francisco hotel room
cleaners surveyed in 1998. This indicates strong regional differences and /or changes

40
over time in job stress in the hotel industry and also suggests a substantial potential for
improving working conditions for Las Vegas GRAs. Job strain has been shown to be a
major risk factor for several diseases including high blood pressure, myocardial
infarction, musculoskeletal disorders and associated work disability (Krause et al., 2001;
Schnall et al., 2000). Effort-reward imbalance, another indicator for job stress was
reported by 57% of GRAs in Las Vegas compared to 31% in San Francisco.
Respect, Social Support, and Problem Solving at Work
Respect and social support (Questions 16p-x). Respect and support from
supervisors have been important issues in focus group discussions with guest room
attendants. Supervisors are involved in work assignments, quality control, help in dealing
with customers, and in organizing help when equipment and material are missing or need
repair. According to scientific research, social support at work from supervisors and from
coworkers can buffer some of the detrimental health effects associated with job
stress.(Karasek and Theorell, 1990) On the other hand, lack of support, especially lack of
supervisory support and respect, can be the cause of chronic disease, absenteeism, and
occupational injury.(Bongers et al., 1993; Cohen and Syme, 1985; Hemingway et al.,
1997; North et al., 1996) The survey devoted 9 standard questions to measure social
support at work.(Karasek, 1985) Some questions specifically asked about respect and
social support from supervisors (Questions 16p-u). Guest room attendants were
instructed to answer these questions with their immediate supervisors in mind.
Additional questions (Questions 16v-x) about "people I work with" refer to co-workers.
Results are shown in Table 22, for each question, and in Table 23 in the form of summary
scores for each hotel.
Table 22 shows by hotel, the percentage of guest room attendants agreeing with each
of nine different statements about supervisory and co-worker support. At two hotels
(Hotel B and Hotel C) the majority of guest room attendants (50 to 68 percent) feel
supported and respected by their immediate supervisors, but one third to one half do not,
based on the answers to several questions. Supervisory support at Hotel A, Hotel D, and
Hotel E hotels has been rated significantly lower.
Co-workers receive substantially higher ratings than supervisors and 70-88% of room
cleaners perceive them as "friendly," and "competent in doing their jobs." However,

41
Hotel A and Hotel D employees receive lower ratings for coworker support, and score
significantly lower than Hotel C and Hotel E (46-48 versus 57-62 percent) in terms of
agreement with the statement "People I work with are helpful in getting the job done."
Table 23 shows that average sum scores for supervisor and co-worker support differ
significantly between hotels. Supervisory support is highest at Hotel C and Hotel B
(average score of 13.1 and13.0, respectively), followed by Hotel A and Hotel D (both
12.1), and lowest at Hotel E (11.7). Co-worker support is highest at Hotel C and Hotel E
(11.4), followed by Hotel B with an about average score (11.1) and Hotel A and Hotel D
with below average scores of 10.6 and 10.5, respectively.
Overall supervisor support was basically the same at Las Vegas hotels (average score
12.1) than in San Francisco hotels (average score 12.3); co-worker support scored 11.0
equally in both cities.
Problem solving at work (Questions 19a-f, and 16aa-bb). Several questions
addressed experiences of workers when they tried to do something about stressful
problems at work.
Table 24 shows the responses to each question about problem-solving attempts. The
inability to solve problems and the degree of resignation was addressed by two questions.
The statement "I tried to change my work situation but gave up" was considered "Almost
never true" by 38 percent of all guest room attendants, "sometimes true" by 39 percent,
"often true" by 12 percent, and "almost always true" by 12 percent. The statement "I
learned to live with the stress because there was nothing I could do about it" was
considered often or always true by an average of 63 percent of all guest room attendants.
The statement "I had some bad experiences when I made suggestions at work" was
endorsed as often or always true by 20 percent of all GRAs, most frequently at Hotel E
(26%). Differences between hotels for these questions were not statistically significant.
However, significant differences between hotels were found regarding the
cooperation between union and management in problem solving. Overall, about three
quarters of all guest room attendants (76%) "agree" or "strongly agree" with the
statement "The local union and management work well together to solve problems." The
highest level of agreement was found at Hotel A (82%) and Hotel B (83%), about average
at Hotel D (75%) and Hotel E (72%) and considerably lower at Hotel C (63 %). On
average, 88 percent of guest room attendants agree or strongly agree to the statement

42
"The local union in my Hotel Donsiders health and safety (ergonomics) an important
issue." Considerably lower levels of agreement were reported with the statement "The
management in my Hotel Donsiders health and safety (ergonomics) an important issue."
On average, 42 percent agreed with this statement, and there were statistically significant
differences between hotels (56 percent at Hotel E, 44 percent at Hotel A, 40 percent at
Hotel C, 39% at Hotel B, and 33 percent at Hotel D).
Conclusion (respect, social support, and problem solving at work). Respect and
social support from supervisors and coworkers differed significantly between hotels. The
local union and management were rated differently with regard to their commitment to in
health and safety issues: 88% of GRAs agreed that the union considers health and safety
an important issue, but only 42% said that management did so. Support from immediate
supervisors and coworkers was rated similar in Las Vegas and San Francisco.
5. Health Status and Functional Limitations (Objective 5)
Introduction. The health status of guest room attendants was studied by self-report
using standardized questionnaires. The terms "self-reported" or "self-rated" health refer
to the fact that health status is assessed by the individual worker rather than by a
physician or any other outside observer. Scientists often consider self-reported health as
the superior measurement.(Bjorner et al., 1996) In fact, it has been shown in several
studies that self-rated health is a better predictor of mortality than medical doctors'
examinations. This report uses several measurements of health; one questionnaire on
musculoskeletal symptoms developed with guest room attendants in focus groups, one
standard questionnaire on psychosomatic symptoms, and the most widely used Short-
Form-36 Health Survey (SF-36), an abbreviated and updated version of the Medical
Outcomes Study questionnaire which was developed by the Rand Corporation during the
1970's and by John E. Ware in 1990.(Ware and Sherbourne, 1992; Ware et al., 1993)
General Health (Question 21). This question is part of the SF-36 questionnaire.
Guest room attendants were asked "Would you say your health in general is now
excellent, very good, good, fair, or poor?"
Table 25 presents the results in two ways. An average ("mean") sum score based on
each individual's answer is shown for each hotel. A higher score means better health, and

43
the highest possible score is 100. Regarding the standard deviation (SD) given in
brackets, higher values mean a greater variation in health status in the respective group of
workers. There are statistically significant differences in general health between hotels.
General health was highest at Hotel D (average score of 43.3), followed by Hotel C (41.6)
and Hotel A (40.8), Hotel E (36.6), and Hotel B (33.6).
The average health rating of guest room attendants (39.1) is well below the average
health rating of the general US population (72.0). Although this finding is suggestive of
an above average health risk for guest room attendants, conclusive comparisons need to
be based on age- and gender-specific ratings of the working population. The average
rating of their general health by San Francisco hotel room cleaners was 56.0, higher than
in Las Vegas, and also lower than the general working population. The substantially
lower rating of general health among Las Vegas GRAs cannot be due to older age
because the Las Vegas GRAs were on average 6 years younger than those in San
Francisco.
Table 25 also shows, by hotel, the percent and exact number of guest room attendants
at each health level. On average, 4 percent reported their health to be in general
"excellent", 8 percent "very good", 29 percent "good", 44 percent "fair", and 15 percent
"poor." In other words, over half (59%) rated their health to be either fair or poor.
Table 26 shows the results for all health measures derived from the SF-36
questionnaire including general health and physical functioning and others which are
described below. In the different health measures of the SF-36 questionnaire, answers are
combined in a sum score where a higher score means better health, and the highest
possible score is 100 and the lowest possible value is 0. Table 26 shows the average
scores of guest room attendants by hotel for each health measure.
Physical functioning (Questions 23a-j). Physical functioning is measured by a
series of questions assessing if and how much workers are limited by their health in
typical daily activities such as running, lifting groceries, pushing a vacuum cleaner, etc.
There are significant differences in physical functioning between hotels. The highest
(best) score in physical functioning was found at Hotel A (54.2) and Hotel D (52.8),
below average scores at Hotel C (48.3), Hotel E (47.6), and Hotel B (45.8). (See Table
26, second row). Average physical functioning scores (50.0) were considerably lower
than in the San Francisco study (62.1).

44
Role limitations due to physical health problems (Questions 24 a-d). Role
limitations were considered present if the worker, as a result of physical health problems,
"cut down on the amount of time spent on work or other activities," "accomplished less
than she would like", was "limited in the kind of work or activities," or "had difficulty
performing the work or other activities." The best health in terms of absence of these role
limitations was found at Hotel A (average score 39.7), followed by Hotel E (36.6), Hotel
D (34.5), Hotel C (33.2), and Hotel B (29.8). (See Table 26, third row). The average
health score regarding physical functioning was 34.8 in Las Vegas, much lower than the
average score of 61.6 in San Francisco.
Role limitations due to emotional problems (Questions 25 a-c). Role limitations
because of emotional problems such as feeling depressed or anxious were measured
similar to role limitations because of physical health problems. The best health in terms
of absence of these role limitations was found at Hotel A (average score of 44.7), and the
worst at Hotel D (34.8). (See Table 26, fourth row). The average score of this health
measure was much lower in Las Vegas than in San Francisco (40.2 versus 65.5).
Bodily pain during the past 4 weeks (Question 32). Workers were asked, "How
much bodily pain have you had during the past 4 weeks?" with answer options on a 6-
point scale ranging from "none" to "very severe." The best health in terms of absence of
bodily pain was experienced by the workers at Hotel C (37.3), slightly about average
values at Hotel A (34.5), Hotel E (33.9), and below average scores at Hotel D (32.9) and
Hotel B (29.3). (See Table 26, fifth row). The average score of this health measure was
much lower in Las Vegas than in San Francisco (33.5 versus 53.3).
Bodily pain during the past 4 weeks interfering with normal work (Question 36).
Health status measured by bodily pain interfering with work (outside the home or
housework) did not differ significantly between hotels. On average scores (36.8) were
considerably lower than in San Francisco hotels (48.3), indicating more bodily pain
interfering with work among Las Vegas GRAs. (See Table 26, sixth row)
Vitality, energy, and fatigue (Questions 22a-c). General feelings of vitality and
energy or fatigue are important indicators of health. No significant differences were
found between hotels in Las Vegas. (See Table 26, last row). Guest room attendants

45
showed relatively low average scores (36.3) compared with San Francisco hotel room
cleaners (51.5) or the general US population (60.9).
Comparison of self-rated health in Las Vegas guest room attendants with San
Francisco hotel room cleaners, and with the general US population. All general
health measures described above were calculated using a reliable and validated
questionnaire (SF-36) with standardized measures of health and functioning (McDowell
and Newell, 1987, 1996). Therefore it is possible to compare self-rated health and
function to other occupational groups and representative samples of the general US
population who answered the same questions in previous surveys.
Table 27 compares self-rated health of Las Vegas GRAs with the San Francisco hotel
room cleaners and the general adult US population. As said before, the values are scored
on a scale from 0 to 100 with higher values meaning better health. For all health
dimensions measured, the same trend could be observed: The general population
experienced the best health, Las Vegas GRA the worst health, and San Francisco GRA
were in between these two groups. The difference between the Las Vegas GRA and the
two other groups were substantial. On average, Las Vegas GRAs had an 18.7 lower score
than their counterparts in San Francisco and a dramatically 36.6 lower score than the
general population on the six health dimensions.
Psychosomatic symptoms (Questions 26 a-i). Psychosomatic symptoms such as
feeling tense, nervous, easily exhausted, having poor appetite, trouble with sleep, or
frequent headaches are often the result of stress and, if chronically present, can be the
precursor of serious health problems. Question 34 asked guest room attendants how often
they had any of such symptoms during the past year. These questions are not part of the
SF-36 health survey and the responses are combined in a way so that higher scores mean
more psychosomatic symptoms, i.e., worse health.
Table 28 shows the psychosomatic symptom score by hotel. No significant
differences were found between hotels. However, on average, Las Vegas GRAs suffered
from about 21 percent more psychosomatic symptoms than those in San Francisco
(average score 27.0 versus 22.4).
Musculoskelatal pain (Questions 33 a-l). Guest room attendants were asked how
much pain they experienced in different parts of their body during the past four weeks.

46
Answer options ranged from none to very severe on a 6 point rating scale for each of 12
different body regions. Results are shown by hotel in Table 29, and by age group in
Table 30.
Table 29 shows the percentage of guest room attendants who experienced
musculoskeletal pain during the last four weeks by body region and by hotel. Severe or
very severe pain was experienced by 50% or more GRAs in the lower back (62%), upper
back (59%), feet or ankles (56%), upper arms or shoulders (54%), and hips and legs (each
50%). Severe or very severe pain was reported also in the neck (43 %), the hands (43%),
and the knees (44%). Significant differences between hotels were found for pain in
hands, lower arms and elbows, head, upper back, and hips. Severe or very severe pain in
hands was reported by 43% of GRAs, most frequently at Hotel B (48%) and least
frequently at Hotel D (39%). Severe or very severe pain in the upper back was
experienced most frequently at Hotel B (66%), and least frequently at Hotel A (55%).
The relatively older population of hotel room cleaners in San Francisco reported
much less severe or very severe pain in the musculoskeletal system, on average 26% in
hands, 21% in upper backs, 24% in lower back and a maximum of 31% in the shoulders.
Table 30 shows the percentage of guest room attendants who experienced
musculoskeletal pain during the last four weeks by body region and by age group. Pain
severity was compared for 4 age groups, GRAs under 40 years, 40-49 years, 50-59 years,
and 60 or more years old. Statistically significant differences between age groups were
found for pain in Hands, head, upper back, lower back, hips, and feet and ankles (p <
.05). Marginally significant differences were found for Lower arms and knees (p < .10).
A close examination of this table shows that, with the exception of knee pain, older
employees aged 50 or more report more frequently no or very mild pain compared to
middle aged (40-49) and younger employees. Similarly, severe or very severe pain of the
upper back, lower back, or feet and ankles is significantly more prevalent among the
younger age groups. In other words, there is no indication that the high prevalence of
muskuloskeletal pain in GRAs is due to age differences.
Taking medication for pain at work during the last 4 weeks (Question 35). 83
percent of all GRAs took some pain medication (for example Aspirin, Motrin, Ibuprofen,
Advil, Tylenol) during the last 4 weeks for pain they had at work. The percentage was
nearly the same across all hotels, with 80 percent at Hotel D up to 87% at Hotel B. (See
Table 31).

47
Work-related pain (Questions 37 a-e). Guest room attendants were asked
specifically about pain or discomfort which they experienced as work-related, i.e.,
"caused or made worse by their work as a room cleaner." Such work-related pain or
discomfort was experienced by 78 percent of all guest room attendants during the last
year.
Table 32 shows the percentage of guest room attendants experiencing work-related
pain or discomfort by hotel. The percentage was highest at Hotel E (84%), lowest at
Hotel C (74%) and about average in the other hotels. Nearly all workers (96%) reported
that this pain began after starting their current job. 32% of all workers with work-related
pain reported this pain to their supervisor or somebody else in management. 62% of
workers visited a doctor because of this work-related pain or discomfort. 57 % took some
time off from work during the last year. The number of days off work because of this
work-related pain is presented in the next section on work-related disability.
Conclusion (health status). Significant differences in health between the five types
of hotels were found for several health measures. Further analyses are needed to
determine how much of these differences are caused by differences in age or physical
workload and psychosocial working conditions, which also vary across hotels. More than
three quarters of guest room attendants reported work-related pain or discomfort during
the past 12 months which was severe enough to visit a doctor (in 62% of all cases) and to
take time off from work (in 32% of all cases). 83% of all GRAs reported taking pain
medication during the last 4 weeks for pain they had at work. The general health status of
guest room attendants in Las Vegas appears to be considerably worse than that of hotel
room cleaners in San Francisco and even more so compared to the general US population.
6. Work-related Injury and Disability (Objective 6)
Introduction. In this section, work disability is measured as the number of self-
reported days off work because of (a) work-related pain in general (Question 37 d-e), and
(b) work-related injury or illness formally reported to workers' compensation (Questions
42). In the tables below the number and percent of workers who missed work is shown
for each hotel. In addition, the average number of days lost by those workers who missed
any workdays because of work-related pain or injuries is presented, separately for sick
and vacation days as well as combined. Finally, the total number of work days lost per
100 guest room attendants in each hotel is shown at the bottom of Tables 32 and 33. This

48
standardized number should be used to compare the total number of workdays lost
between hotels.
Workdays lost during the last year because of work-related pain (Questions 37
d-e). Guest room attendants were asked specifically about pain or discomfort which they
experienced as work-related, i.e., "caused or made worse by their work as a room
cleaner." As mentioned earlier in the discussion of Table 32, such work-related pain or
discomfort was experienced by 78% of all guest room attendants during the last year.
More than half of them (57%) missed one or more workdays because of this work-related
pain or discomfort.
Table 33 summarizes the results on the number of self-reported workdays lost due to
work-related pain or discomfort. The average number of sick days reported per worker
with at least one sick day because of work-related pain was 7.7 days. The average
number of vacation days taken because of work-related pain was 10.7 days per worker
with at least one vacation day taken. The total number of days lost (sick and vacation
days because of work-related pain) per 100 workers during the last year was on average
506 days, highest at Hotel B (661 days), followed by Hotel E (640 days), Hotel A (552
days), Hotel C (378), and Hotel D (289 days). Work-related lost time differs significantly
between hotels. For example, Hotel B experienced 2.3 times more lost workdays per 100
guest room attendants in the last year than Hotel D because of work-related pain or
discomfort.
Workdays lost during the last year because of workers' compensation injuries
(Question 42). Guest room attendants were asked how many work-related injuries or
illnesses they formally reported to workers' compensation during the last year (Question
40). They were also asked how many work days they lost during the last year because of
such work-related injury or illness (Question 43).
Table 34 shows the frequency of formally reported work-related injury or illness and
the associated number of lost workdays for each hotel. 21% of all guest room attendants
formally reported a workers' compensation injury during the last year, 30 percent at Hotel
A, 20 percent at Hotel E, 19% at Hotel B, and 16 percent at Hotel C and Hotel D. The
average number of workdays lost per worker with reported lost-time injury was 9.6 days,
highest at Hotel E (20.5 days), below average at Hotel A (7.0 days), and about average at
the other hotels. To take into account the fact that the number of workers and

49
respondents to the survey differed between hotels, comparisons between hotels should be
based on the standardized number of lost workdays per 100 responding workers. The
total number of workdays lost per 100 workers during the last year was on average 197
days, highest at Hotel E (409 days per 100 workers), slightly above average at Hotel A
(210 days), and relatively low at Hotel B (157 days), Hotel D (150 days), and Hotel C
(146 days).
The percentage of workers formally reporting a work-related injury in San Francisco
(23%) and the average number of lost workdays per 100 room cleaners there (201 days)
were slightly higher than in Las Vegas.
Under-reporting of work-related injury and illness. More than three quarters
(78% in Las Vegas, 77% in San Francisco) of all guest room attendants reported work-
related pain during the last year, however, only 32% (50 % in San Francisco) reported
this pain to their supervisors or management. However, only 21% (23% in San
Francisco) of all workers formally reported a work-related injury during the last year.
(See Table 34)
The reasons for this apparent under-reporting of potentially compensable work-related
pain had not been addressed in the earlier San Francisco study. In the Las Vegas study
GRAs were asked directly if they had a work-related injury or illness that they did not
report (Question 38).
As Table 35 shows, 168 GRAs (19%) answered yes to this question. The reasons
given for not reporting included "I did not know how" (17%), "I was afraid" (23% on
average, and 31% or twice as many at Hotel D compared to 15% at Hotel C), "I thought it
would be too much trouble" (39%), and other reasons (29%) not yet analyzed.
In focus groups workers frequently reported of punitive experiences after reporting an
work-related injury, having to take drug tests before receiving medical care, or
discounting of their pain and health care needs by their direct supervisors. To investigate
this issue further, question 41 of the survey asked GRAs about their experiences after
reporting an injury or illness. As Table 35 shows, 33% of GRAs answered that they had
to take a drug test, but this practice differed significantly between hotels, ranging from
13% at Hotel A to 89% at Hotel E. 89% of GRAs were taken to a clinic or doctor. Only
46% of GRAs say they got well before returning to work. After returning to work 36%

50
missed additional days of work because of their injury. 21 % of GRAs reported to have
received a warning or other discipline for missing work. These responses show that
GRAs experience important barriers at work for reporting work-related injury and illness.
Additional barriers for reporting work-related injuries occur in the contact with
medical care providers (see Table 36). 39% of workers reporting a work-related injury
said that workers' compensation did not pay for their medical care. Disbelief by medical
providers and the need to pay medical bills without delay were some of the given reasons
that discouraged workers from formal reporting of their injuries.
Conclusion (Work disability). More than three quarters (78% in Las Vegas, 77% in
San Francisco) of all guest room attendants reported work-related pain during the last
year, however only 32% (50 % in San Francisco) reported this pain to their supervisors or
management, and only 21% (23% in San Francisco) of all workers had a formally
reported work-related injury during the last year. Several reasons for this apparent
underreporting of potentially compensable work-related pain were given by GRAs in Las
Vegas including punitive actions by the employer, discouragement by medical providers,
and the need to pay medical bills. This can be expected to cause substantial cost-shifting
from employer liability insurance into health insurance or employee out-of pocket
expenses. Workdays lost because of work-related pain in general, and because of
formally reported workers' compensation injuries or illnesses specifically, varied between
the different hotels. Further analyses are needed to determine how much of these
differences are caused by differences in physical workload and psychosocial working
conditions.
7. Blood Pressure Screening (Objective 7)
Overall participation in blood pressure screening. 83.2 percent (783 out of 941) of
questionnaire survey participants had their resting blood pressure checked either during
the questionnaire survey or during the ambulatory blood pressure study. Another 98
GRAs had their blood pressure taken during the ambulatory blood pressure study but did
not participate in the survey. However, these participants completed a shortened
questionnaire during their blood pressure training session. In total, 881 (783+98) GRAs
participated in any blood pressure screenings.

51
Prevalence of hypertension. The prevalence of hypertension was assessed by
several methods:
(1) Hypertension based on self-report. As shown in Table 37, 221 survey responders
reported either having received a doctors diagnosis of hypertension (i.e., answered "yes"
to question 30 "Have you ever been told by a doctor that you have high blood pressure?")
or reported taking any ant-hypertensive drugs (i.e., answered "yes" to question 31 "Are
you currently taking any medication to lower your blood pressure?"). Based on these
questions 23.5 % (221 out of 941) had hypertension. In the subgroup of participants who
also volunteered to have their blood pressure taken during the survey, 26.1 % (76 out of
290) reported high blood pressure.
(2) Hypertension based on resting blood pressure measurement during the
questionnaire survey. 26.6% (77 out of 290) who volunteered to have their resting blood
pressure taken during the survey had elevated blood pressure.
(3) Hypertension based on both self-report and/or resting blood pressure
measurement during the survey. 39.3 % (114 out of 290) had elevated blood pressure
based on doctor's diagnosis, medication, or resting blood pressure measurement.
Additional methods to calculate the prevalence of hypertension based on all screened
GRAs require the merging of information from the questionnaire, resting blood pressure
during survey administration, and ambulatory blood pressure measurements. These
analyses will be conducted and reported at a later complete report.
Conclusion (hypertension). The combination of self-report and actual measurement
among the 290 GRAs with complete information from the survey and resting blood
pressure checks (Method 3) shows that 39% of GRAs in Las Vegas have hypertension.
For comparison, 25% of the adult US population has high blood pressure.
8. Associations Between Work Conditions, General Health, and Severe Pain
(Objective 8)
Tables 38 and 39 show the impact of selected job factors on the probability of
reporting "fair" or "poor" general health (Table 38) and severe or very severe pain (Table
39).

52
The impact of each factor is measured by odds ratios, which means that the odds of ill
health are compared between individuals with high and low scores on any risk factor.
Although not identical, odds ratios approximate relative risks. An odds ratio higher than 1
indicates a higher risk of ill health, conversely, an odds ratio lower than 1 indicates a
lower risk. For example, an odds ratio of 1.5 for a risk factor means that persons with
this risk factor are one and a half times (or 50%) more likely to experience ill health,
compared to persons who do not have this risk factor (the reference group). In other
words these persons experience a 1.5-fold increased risk for ill health (a relative risk of
1.5). All analyses were statistically adjusted for age of the GRA, i.e., age was taken into
account when determining the impact of other risk factors.
Physical workload (number of rooms, beds, buildings, floors) and general health.
Physical workload was measured by (1) numbers of rooms to clean, (2) numbers of beds
to make, (3) number of buildings, and (4) number of floors to travel per day. In this
analysis two or three groups are compared with regard to their health. Cleaning more than
15 or more rooms per day was associated with a 1.3-fold or 30% higher risk of low self-
reported health compared with room cleaners who cleaned 14 rooms or less. Similarly,
making more than 18 beds per day was associated with a 1.43-fold or 43% higher risk of
fair or poor health. Traveling 3 buildings was associated with a 2.42-fold risk, and
traveling with a 1.87-fold higher risk of having fair or poor health. The age-adjusted
associations for buildings, floors, and beds were statistically significant (p<0.05), and
number of rooms showed a marginally significant association with ill health (p<0.10).
Time pressure (skipping breaks) and general health. Time pressure was measured by
skipping or shortening of breaks or working longer hours in order to complete work
assignments. GRA who skipped or shortened their breaks had a 1.65-fold or 65% higher
risk of fair or poor health.
Low job control and general health. Low control over one's job was also associated
with ill health. GRAs who scored in the lowest tertile of the job control scale were 1.5-
fold or 50% more likely to report fair or poor health than GRAs in the highest tertile.
High psychological job demands, job strain, and general health. Psychological
demands and job strain, the combination of low job control and high job demands,
showed no statistical significant association with general health.

53
Place of birth, language, and general health. Regarding demographic factors, both
place of birth and language were associated with ill health. Being born outside the USA
increased the risk for being at fair or poor health 1.7-fold or 70%. Compared to native
English speakers, Spanish speakers were almost 3 times more likely to suffer from fair or
poor general health.
Physical workload (number of rooms, beds, buildings, and floors) and severe pain.
Cleaning more than 14 rooms per day increased the likelihood of severe pain 1.25-fold or
25%, however this association was not statistically significant. Similarly, making more
than 18 beds per day slightly increased the risk of pain, but this may represent a chance
finding, because the difference was not statistically significant. Strong and statistically
significant relationships were found between severe pain and the number of buildings
(age-adjusted odds ratio 3.86), and the number of floors (age-adjusted odds ratio of 1.87)
traveled each day.
Time pressure (skipping breaks) and severe pain. The report of severe or very severe
pain increased 2.36-fold or 236% with time pressure.
High psychological demands and severe pain. The frequency of reporting of severe or
very severe pain increased 1.75-fold or 175% with high psychological demands.
Low job control and severe pain. The frequency of reporting of severe or very severe
pain increased 1.67-fold or 167% with having low job control.
Job strain and severe pain. GRAs with the combination of high psychological demands
and low job control (i.e., high job strain) experienced severe pain 1.58 times or 158%
more often than GRAs with low job strain.
Place of birth, language, and general health. Like for self-reported ill general health,
people who were born outside the US and who were Spanish speakers were at higher risk
for severe or very severe pain. The odds ratios were 1.49 for being born outside the USA
and 2.65 for being a Spanish speaker.
Conclusion (association between work and health): For Las Vegas GRAs, physical
workload is associated with ill general health and, to a lesser degree, with experiencing
severe pain. For example GRAs cleaning more than 14 rooms are 30 % more likely to

54
suffer from fair or poor health, and 25% more likely to experience severe or very severe
pain during the past 4 weeks. Making more than 18 beds per day increases the risk of fair
or poor health by 43%. Having to travel between 3 buildings increased the risk of ill
health nearly 2.5-fold, and traveling 3 floors per day was associated with a nearly 2-fold
risk. These factors were also strongly associated with severe pain: a nearly 4-fold risk for
travelling 3 buildings, and an about 2-fold risk for travelling 3 floors per day.
Two psychosocial job factors, time pressure and low job control, increased the risk of
ill health by 65% and 50%, respectively. All psychosocial workplace factors analyzed in
this section were strongly associated with severe pain. The report of severe or very
severe pain increased 2.36-fold or 236% with time pressure, 1.75-fold or 175% with high
psychological demands, 1.67 or 167% with having low job control, and 1.58 or 158%
with job strain.
These results suggest that physical workload, time pressure, low job control, high
psychological demands, and high job stress all increase the risk of ill health or severe pain
in Las Vegas GRAs, regardless of age. Although these analyses need to be repeated in a
longitudinal (prospective) study in order to establish causality, the findings are consistent
with the scientific literature showing that biomechanical and psychosocial stressors can
cause pain and chronic disease (Bernard, 1997; Davis and Heaney, 2000; Schnall et al.,
2000; Schnall et al., 1994). The findings of this study clearly suggest that the relatively
high levels of poor health and severe pain among Las Vegas GRAs, compared to those in
San Francisco or to the general US population, are at least in part attributable to the
relatively high physical workload, time pressure, and other job stressors described in this
study. All these job factors are amenable to change, therefore indicating a considerable
potential for job redesign, workplace health promotion, and disease prevention.

55
ACKNOWLEDGEMENTS
Funding for the study and this report was provided by the Hotel Employees and
Restaurant Employees International Union (HERE), Culinary Workers Union, Local 226.
Administrative support was provided by the University of California at Berkeley and San
Francisco, and by the University of Nevada at Las Vegas.
We gratefully acknowledge the following research assistants from the University of
Nevada, Las Vegas (UNLV), the Community College of Southern Nevada (CCSN), and
other campuses, for their invaluable help in survey administration, translation,
anthropometric measurements, and training of guest room attendants in performing
ambulatory blood pressure measurements:
Marcos Avitia (UNLV)
Connie Ayala (UNLV)
Francisco Barragan
Veronica Barragan (CCSN)
Monsef Benhoud (UNLV)
Laura Contreras (CCSN)
Lindsay Game (UNLV)
Lizette Hernandez
Elizabeth Herrera (UNLV)
Yvonne Hui (UNLV)
Ana Kostova (UNLV)
Kyung Lee (UNLV)
Alberto Linch (UNLV)
Liu Liu (UNLV)
Nancy Macias (UNLV)
Todd Mastry (UNLV)
Dan McCue (UNLV)
Robin Miller (UNLV)
Elizabeth Parga
Carlos Rodriquez (UNLV)

56
Laila Rong (UNLV)
Roger Roots (UNLV)
Soyoung Ryu
Jun Park
Jonathan Sadow (UMass)
Ricardo Santillan (UNLV)
Betty Silva (UNLV)
Roberto Soracco (UNLV)
Yvonne Sun (UNLV)
Nicole Tanguay (UNLV)
Irma Varela-Wynants (Antioch University)
Sarah-Marie Vergara
Tina Wininger (UNLV)
Meg Wu (UNLV)
Jessica Zamoyski (UNLV)
Special thanks goes to Cheri A. Young, Ph.D., Assistant Professor of Hotel Management
from the William F. Harrah College of Hotel Administration, University of Nevada, Las
Vegas, who recruited and helped supervise these research assistants in cooperation with
Pam Tau Lee from the University of California at Berkeley.
We also thank Dr. Paul Landsbergis, Assistant Professor, Department of Community and
Preventive Medicine, Mount Sinai School of Medicine, New York, and Dr. Peter Schnall,
Associate Professor of Medicine, University of California at Irvine, for their helpful
advice regarding procedures for the ambulatory blood pressure measurement.
We thank the OMRON Inc. for the donation of instruments to measure ambulatory blood
pressure.
We thank all Guest Room Attendants who participated in the study, served at the
Research Advisory Board, participated in focus groups, and generously shared their
experience with each other and the research team.

57
Finally, we thank the members, representatives, and leaders of the Hotel Employees and
Restaurant Employees International Union (HERE), Culinary Workers Union, Local 226,
who initiated this collaborative project, for their trust, active participation, and
willingness to support this scientific investigation led by an independent academic
research team.

58
REFERENCES
American Hotel and Motel Association (1997). 1996 lodging industry profile.
Washington, D.C.
Bernard, B. P., Ed. (1997). Musculoskeletal disorders and workplace factors. DHHS
(NIOSH) Publication No. 97-141. Cincinnati, "U.S. Department of Health and
Human Services, National Institute for Occupational Safety and Health".
Bjorner, J. B., T. S. Kristensen, et al. (1996). Self-Rated Health: a useful concept in
research, prevention and clinical medicine. Stockholm, Forskningsradsnamnden,
Swedish Council for Planning and Coordination of Research.
Bongers, P. M., C. R. de Winter, et al. (1993). “Psychosocial factors at work and
musculoskeletal disease.” Scand J Work Environ Health 19(5): 297-312.
Cohen, S. and S. L. Syme, Eds. (1985). Social support and health. Orlando, FL,
Academic Press.
Davis, K. G. and C. A. Heaney (2000). “The relationship between psychosocial work
characteristics and low back pain: underlying methodological issues.” Clin
Biomech (Bristol, Avon) 15(6): 389-406.
Evans, G. (1994). “Working on the hot seat: Urban bus operators.” Accid Anal and Prev
26(2): 181-193.
Grunfeld, B. and K. Noreik (1992). “[Long-term sick-leave patients in Oslo. A follow-up
study].” Tidsskr Nor Laegeforen 112(2): 215-8.
Hemingway, H., M. J. Shipley, et al. (1997). “Sickness absence from back pain,
psychosocial work characteristics and employment grade among office workers.”
Scand J Work Environ Health 23(2): 121-9.
Judge, K., J. A. Mulligan, et al. (1998). “Income inequality and population health.” Soc
Sci Med 46(4-5): 567-79.
Kaplan, G. A., E. R. Pamuk, et al. (1996). “Inequality in income and mortality in the
United States: analysis of mortality and potential pathways [see comments].” Bmj
312(7037): 999-1003.
Karasek, R. (1985). Job content questionnaire. Los Angeles, Department of Industrial and
Systems Engineering, University of Southern California.
Karasek, R. and T. Theorell (1990). Healthy work: Stress, productivity, and the
reconstruction of working life. New York, Basic Books, Harper Collins
Publishers.

59
Krause, N., L. K. Dasinger, et al. (2001). “Psychosocial job factors and return-to-work
after compensated low back injury: a disability phase-specific analysis.” Am J Ind
Med 40(4): 374-92.
Krause, N., D. Ragland, et al. (1998). “Psychosocial job factors, physical workload, and
incidence of work-related spinal injury: a 5- year prospective study of urban
transit operators.” Spine 23(23): 2507-16.
Krause, N., D. R. Ragland, et al. (1997). “Psychosocial job factors associated with back
and neck pain in public transit operators.” Scand J Work Environ Health 23(3):
179-86.
Krause, N., P. Tau Lee, et al. (1999). Working conditions and health of San Francisco
hotel room cleaners. Report to the Hotel Employees and Restaurant Employees
International Union. Berkeley, California, School of Public Health at the
University of California: 79.
Lynch, J., N. Krause, et al. (1997). “Workplace conditions, socioeconomic status, and the
risk of mortality and acute myocardial infarction: the Kuopio Ischemic Heart
Disease Risk Factor Study.” Am J Public Health 87(4): 617-22.
Lynch, J. W., G. A. Kaplan, et al. (1998). “Income inequality and mortality in
metropolitan areas of the United States.” Am J Public Health 88(7): 1074-80.
Mackenbach, J. P. (1992). “Socio-economic health differences in The Netherlands: a
review of recent empirical findings.” Soc Sci Med 34(3): 213-26.
McDowell, I. and C. Newell (1987, 1996). Measuring Health: A guide to rating scales
and questionnaires. New York, Oxford University.
North, F., S. L. Syme, et al. (1993). “Explaining socioeconomic differences in sickness
absence: the Whitehall II Study.” Bmj 306(6874): 361-6.
North, F. M., S. L. Syme, et al. (1996). “Psychosocial work environment and sickness
absence among British civil servants: the Whitehall II study [see comments]
[published erratum appears in Am J Public Health 1996 Aug; 86(8 Pt 1):1093].”
Am J Public Health 86(3): 332-40.
Schnall, P. L., K. Belkic, et al., Eds. (2000). The workplace and cardiovascular disease.
State of the Art Reviews in Occupational Medicine. Philadelphia, Hanley &
Belfus.
Schnall, P. L., P. A. Landsbergis, et al. (1994). “Job strain and cardiovascular disease.”
Ann Rev of Public Health 15: 381-411.
Siegrist, J. (1996). “Adverse health effects of high-effort/low-reward conditions.” J
Occup Health Psychol 1(1): 27-41.

60
Syme, S. L. (1986). Social determinants of health and disease. Maxcy- Rosenau public
health and preventive medicine, 12th Edition. M. J. Rosenau, J. M. Last and K. F.
Maxcy. Norwalk, Conn., Appleton-Century-Crofts: 953-70.
Tsuji, I., Y. Imai, et al. (1997). “Proposal of reference values for home blood pressure
measurement: prognostic criteria based on a prospective observation of the
general population in Ohasama, Japan.” Am J Hypertens 10(4 Pt 1): 409-18.
Ware, J. E., Jr. and C. D. Sherbourne (1992). “The MOS 36-Item Short-Form Health
Survey (SF-36): I. Conceptual framework and item selection.” Med. Care 30(6):
473-483.
Ware, J. E., K. K. Snow, et al. (1993). SF-36 health survey : manual and interpretation
guide. Boston, The Health Institute, New England Medical Center.
Weisser, B., T. Mengden, et al. (2000). “Normal values of blood pressure self-
measurement in view of the 1999 World Health Organization-International
Society of Hypertension guidelines.” Am J Hypertens 13(8): 940-3.

TABLE 1. Participation Rates by Hotel.
� Hotel A Hotel B Hotel C Hotel D Hotel E Totals
Eligible room cleaners (n) 345 283 280 256 112 1276
Participants (n) 271 228 197 141 104 941
Participation rate (%) 79 81 70 55 93 74

TABLE 2. Characteristics of Study Participants by Hotel.
� Hotel A Hotel B Hotel C Hotel D Hotel E Totals
�
Characteristic�
%or
Mean
nor
(SD)
%or
Mean
nor
(SD)
%or
Mean
nor
(SD)
%or
Mean
nor
(SD)
%or
Mean
nor
(SD)
%or
Mean
nor
(SD)
Female gender* 100 % 264 99 % 212 96 % 184 99 % 134 100 98 99 % 892
Age in years* � � � � �
Average (SD) 41.8 (10.5) 40.9 (8.4) 43.2 (10.0) 39.5 (9.0) 43.4 (9.1) 41.7 (9.6)
Age groups*
< 40 43 % 113 45 % 97 39 % 74 49 % 68 34 % 33 42 % 385
40 – 49 32 % 84 40 % 86 33 % 62 36 % 49 40 % 39 35 % 320
50 – 59 20 % 53 14 % 31 22 % 41 13 % 18 27 % 26 19 % 169
≥ 60 5 % 13 1 % 3 7 % 13 2 % 3 0 % 0 4 % 32
Ethnicity*
African American 2 % 5 2 % 5 10 % 19 4 % 6 16 % 16 6 % 51
Native American 1 % 2 0 % 1 0 % 0 1 % 1 0 % 0 0 % 4
Latino 77 % 204 90 % 199 66 % 127 71 % 98 70 % 71 76 % 699
Filipino 9 % 24 4 % 8 2 % 4 5 % 7 3 % 3 5 % 46
Asian 2 % 6 0 % 1 10 % 20 10 % 14 1 % 1 5 % 42
White 8 % 21 3 % 7 7 % 13 5 % 7 6 % 6 6 % 54
Other 1 % 2 0 % 1 4 % 8 4 % 5 5 % 5 2 % 21

TABLE 2 (cont.). Characteristics of Study Participants by Hotel.
Native language*
Cantonese 0 % 0 0 % 0 2 % 3 0 % 0 0 % 0 0 % 3
English 10 % 28 3 % 6 15 % 29 12 % 17 20 % 20 11 % 100
Mandarin 2 % 4 0 % 1 1 % 2 0 % 0 0 % 0 1 % 7
Russian 1 % 2 0 % 1 0 % 0 0 % 0 1 % 1 0 % 4
Serbo-Croatian 0 % 0 2 % 5 4 % 7 0 % 0 0 % 0 1 % 12
Spanish 75 % 200 90 % 199 66 % 126 71 % 98 70 % 70 75 % 693
Tagalog 8 % 21 3 % 7 2 % 4 5 % 7 4 % 4 5 % 43
Vietnamese 1 % 2 0 % 0 2 % 4 0 % 0 0 % 0 1 % 6
Other 4 % 10 1 % 3 9 % 17 12 % 17 5 % 5 6 % 52
Born outside the USA* 83 % 221 92 % 204 82 % 159 85 % 117 79 % 80 85 % 781
Years of education* 9.5 (3.6) 8.8 (3.6) 9.6 (3.6) 9.2 (3.5) 9.3 (3.8) 9.3 (3.6)
Family income, $ per monthbefore taxes*
2120 (899) 2266 (1008) 2061 (970) 2185 (900) 1880 (1177) 2127 (978)
Homeowners* 59 % 158 68 % 147 62 % 119 47 % 63 55 % 56 60 % 543
Household Size
Adults 2.8 (1.4) 3.0 (1.4) 3.1 (1.5) 2.9 (1.3) 3.2 (1.4) 3.0 (1.4)
Children(*) 2.3 (1.1) 2.4 (1.2) 2.2 (1.2) 2.6 (1.2) 2.5 (1.4) 2.4 (1.2)
% of Households with oneor more children
94 % 256 97 % 222 65 % 187 92 % 130 94 % 98 95 % 893
% of Households withpersons needing child,elder, or disability care*
61 % 164 67 % 152 55 % 109 59 % 83 49 % 51 59 % 559
Number of dependentsneeding care
1.9 (0.8) 2.0 (1.1) 2.02 (1.4) 1.7 (0.9) 2.3 (1.6) 2 (1.1)

TABLE 2 (cont.). Characteristics of Study Participants by Hotel.
Years as a room cleaner
Current hotel* 5.7 (4.0) 5.5 (3.0) 8.4 (5.9) 3.8 (2.8) 9.0 (5.5) 6.3 (4.6)
Other hotels* 1.7 (3.1) 1.4 (2.9) 0.7 (2.5) 1.9 (4.1) 1.4 (2.9) 1.4 (3.1)
Total* 7.4 (5.2) 6.9 (4.4) 9.2 (6.5) 5.6 (5.0) 10.4 (6.2) 7.7 (5.6)
Work status*
Full-time (40+ hours) 94 % 238 95 % 210 90 % 164 91 % 114 85 % 80 92 % 806
Part-time (<40 hours) 6 % 16 5 % 10 10 % 18 9 % 11 15 % 14 8 % 69
Not working 1 % 2 0 % 0 2 % 3 2 % 2 1 % 1 1 % 8
Average work hours per week
Full-time 42.4 (9.4) 42.0 (8.0) 41.1 (6.3) 43.6 (11.2) 42.0 (8.8) 42.2 8.7)
Part-time* 15.7 (11.8) 8.0 (0.0) 22.6 (12.7) 21.7 (13.2) 18.4 (12.6) 17.9 (12.3)
Working an additional job 3 % 8 4 % 9 3 % 6 4 % 5 7 % 7 4 % 35
(*) p < .10* p < .05

TABLE 3. Number of Rooms and Beds During Last Work Day, by Hotel.�1
� Hotel A Hotel B Hotel C Hotel D Hotel E Totals
Characteristic� Mean (SD) Mean (SD) Mean (SD) Mean (SD) Mean (SD) Mean (SD)
Total number of rooms andsuites*
13.8 (4.0) 15.2 (3.0) 15.6 (2.3) 17.1 (7.6) 15.8 (4.8) 15.2 (4.4)
Regular rooms* 11.9 (5.1) 13.7 (2.6) 14.0 (2.3) 5.6 (6.3) 12.9 (5.0) 12.0 (5.1)
Suites* 1.9 (3.9) 1.5 (2.0) 1.6 (1.5) 11.6 (4.2) 2.9 (3.9) 3.2 (4.6)
Total number of special rooms 10.7 (7.0) 10.3 (6.5) 10.3 (6.4) 9.2 (5.8) 10.1 (6.4) 10.2 (6.5)
Checkouts* 5.9 (3.2) 5.7 (3.0) 6.9 (3.6) 5.3 (2.4) 6.4 (4.2) 6.0 (3.3)
VIP or Rush* 1.3 (2.0) 0.4 (0.9) 0.8 (1.3) 1.2 (2.4) 1.5 (2.2) 1.0 (1.8)
Rooms with Jacuzzi* 3.4 (5.2) 4.2 (5.4) 2.6 (4.3) 2.6 (4.7) 2.2 (3.7) 3.2 (4.9)
Total number of beds made* 15.8 (5.1) 22.9 (7.4) 19.5 (6.4) 18.1 (6.3) 22.4 (6.9) 19.4 (7.0)
King* 7.3 (2.4) 4.8 (2.7) 6.6 (4.0) 6.3 (2.9) 5.8 (2.9) 6.2 (3.1)
Queen* 7.6 (5.1) 17.2 (8.1) 12.1 (7.0) 11.2 (6.7) 15.9 (7.3) 12.4 (7.8)
Rollaway, Crib or Sofa 0.9 (1.4) 0.9 (1.8) 0.8 (1.4) 0.5 (0.8) 0.7 (1.1) 0.8 (1.4)
Number of bathrooms* 13.1 (3.4) 15.1 (1.9) 15.7 (1.0) 12.4 (3.0) 16.5 (3.0) 14.4 (2.9)
* p < .051 Full-time employees, n = 799

TABLE 4. Number of Floors or Buildings Traveled During a Typical Work Day, by Hotel.
� Hotel A Hotel B Hotel C Hotel D Hotel E Totals
Characteristic� % n % n % n % n % n % n
Number of Floors*
1 Floor 71 % 184 34 % 76 20 % 39 16 % 22 12 % 12 36 % 333
2 Floors 26 % 69 48 % 106 55 % 105 68 % 94 43 % 43 46 % 417
3 or More Floors 3 % 8 18 % 40 25 % 48 16 % 22 45 % 45 18 % 163
Number of Buildings*
1 Building 93 % 241 89 % 187 87 % 164 89 % 122 55 % 55 86 % 769
2 Buildings 6 % 16 5 % 11 9 % 16 9 % 13 30 % 30 10 % 86
3 or More Buildings 0 % 1 5 % 11 4 % 8 1 % 2 15 % 15 4 % 37
* p < .05
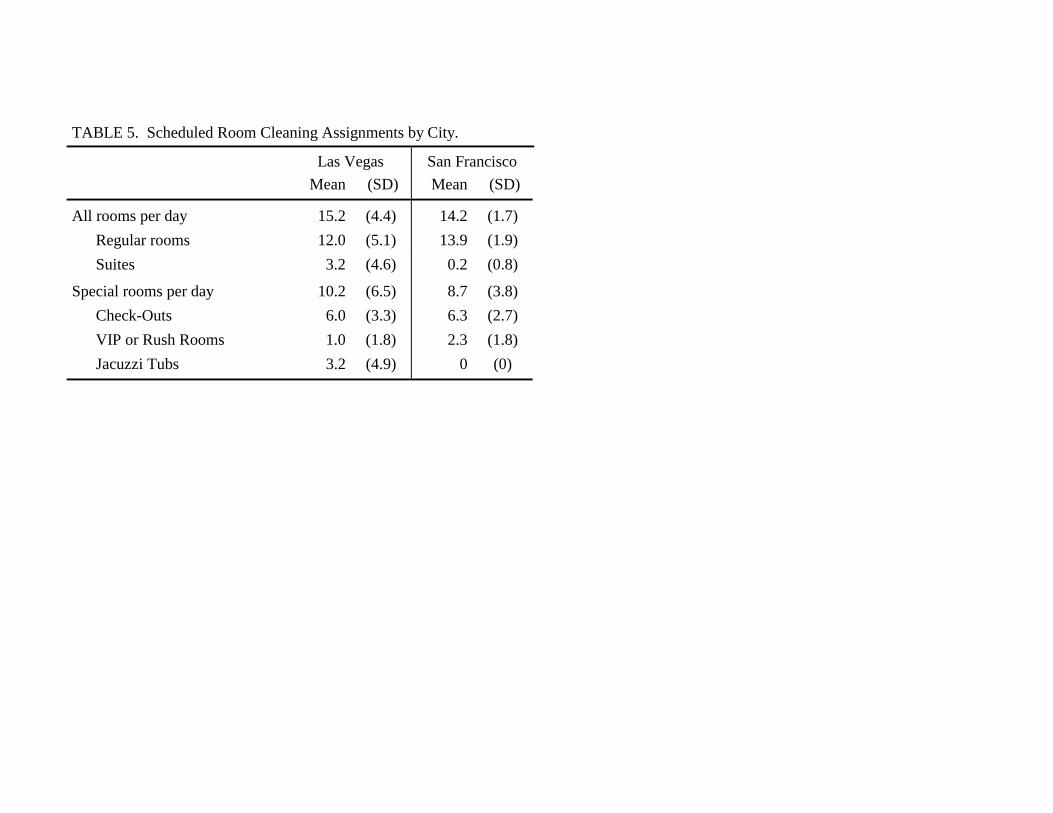
�
TABLE 5. Scheduled Room Cleaning Assignments by City.
� Las Vegas San Francisco
� Mean (SD) Mean (SD)
All rooms per day 15.2 (4.4) 14.2 (1.7)
Regular rooms 12.0 (5.1) 13.9 (1.9)
Suites 3.2 (4.6) 0.2 (0.8)
Special rooms per day 10.2 (6.5) 8.7 (3.8)
Check-Outs 6.0 (3.3) 6.3 (2.7)
VIP or Rush Rooms 1.0 (1.8) 2.3 (1.8)
Jacuzzi Tubs 3.2 (4.9) 0 (0)

TABLE 6. Usual Frequency of Work Tasks Per Day.
�
Average Number of Times the Problem Occurs Per Day
AverageFrequencyPer Day1
� Hotel A Hotel B Hotel C Hotel D Hotel E Across Hotels
Task or Problem� Mean (SD) Mean (SD) Mean (SD) Mean (SD) Mean (SD) Mean (SD)
Problems with replacement linens* 3.0 (4.3) 4.1 (5.1) 4.6 (5.2) 3.4 (4.4) 3.7 (5.0) 3.7 (4.8)
Room needs extra linens like robes, etc. 2.6 (3.9) 2.5 (4.3) 2.9 (4.4) 2.6 (3.6) 2.9 (4.3) 2.7 (4.1)
Coffee pot in room needs cleaning* 0.9 (3.0) 0.4 (2.4) 0.8 (3.2) 2.4 (4.7) 3.0 (4.6) 1.3 (3.6)
Put away iron and ironing board* 5.9 (5.1) 7.7 (5.9) 7.4 (5.8) 5.0 (4.8) 2.6 (4.1) 6.1 (5.5)
Room service trays left in room(*) 5.3 (4.5) 4.4 (4.5) 5.2 (4.4) 4.8 (3.8) 4.1 (4.3) 4.9 (4.4)
Lots of garbage left in room* 7.5 (5.3) 8.5 (5.8) 9.9 (5.7) 6.1 (4.9) 8.3 (6.6) 8.1 (5.7)
Ashtrays in room need cleaning* 6.3 (6.2) 8.3 (6.2) 7.7 (7.2) 5.0 (5.9) 8.8 (6.9) 7.1 (6.5)
Food left in room on tables or carpet* 6.5 (5.2) 7.6 (5.8) 7.5 (5.9) 5.6 (4.8) 7.2 (6.2) 6.9 (5.6)
Extra scrubbing required in the bathroom* 5.8 (5.4) 6.5 (6.3) 8.6 (6.5) 4.9 (5.0) 8.0 (6.9) 6.6 (6.1)
Bathroom very wet or dirty* 6.8 (5.3) 8.7 (6.0) 8.8 (6.1) 6.4 (5.0) 7.6 (6.3) 7.7 (5.8)
Restock missing supplies on cart* 7.1 (5.4) 9.4 (6.3) 8.1 (6.0) 6.4 (5.3) 6.2 (7.1) 7.7 (6.0)
Problems dusting high or low areas in room* 8.2 (5.9) 10.7 (6.4) 9.6 (6.6) 7.6 (5.9) 9.2 (6.9) 9.1 (6.4)
Do not disturb sign on door* 4.8 (4.3) 6.0 (5.1) 5.8 (5.0) 5.0 (3.9) 4.0 (4.4) 5.3 (4.6)
Deep cleaning of room required* 5.9 (5.4) 5.8 (6.1) 6.7 (6.3) 4.3 (4.9) 7.0 (6.6) 5.9 (5.9)
Need to report a problem to someone else 2.5 (3.6) 2.5 (4.3) 2.4 (4.2) 2.5 (3.7) 3.2 (4.9) 2.5 (4.1)
Make extra beds 2.1 (3.3) 2.0 (3.5) 2.6 (4.1) 1.8 (3.1) 1.7 (3.0) 2.1 (3.5)
Clean Jacuzzi* 3.2 (5.0) 3.4 (4.8) 2.2 (4.0) 1.3 (2.8) 2.1 (3.9) 2.6 (4.4)
Travel to another floor or building* 2.2 (3.7) 2.8 (4.4) 3.0 (4.5) 2.8 (3.7) 3.8 (5.1) 2.7 (4.2)

TABLE 6 (cont.). Usual Frequency of Work Tasks Per Day.
Clean VIP or rush rooms* 2.2 (3.2) 0.8 (1.9) 1.7 (2.7) 1.3 (2.4) 2.1 (2.8) 1.6 (2.7)
Clean large glass or mirror doors* 9.2 (5.3) 11.7 (6.4) 11.8 (5.8) 9.9 (5.1) 11.2 (6.8) 10.7 (5.9)
Clean marble sinks* 9.0 (5.8) 9.7 (7.2) 10.6 (7.1) 6.9 (6.3) 7.6 (7.6) 9.0 (6.8)
Clean chrome or brass fixtures* 7.1 (6.0) 5.9 (6.8) 9.3 (7.4) 5.7 (6.2) 8.7 (7.5) 7.2 (6.9)
Elevator not working* 1.8 (4.1) 0.8 (2.6) 2.5 (5.0) 1.5 (3.2) 1.6 (4.4) 1.6 (3.9)
Count linens* 4.9 (6.1) 2.1 (5.0) 4.1 (6.7) 1.7 (4.1) 1.0 (3.3) 3.1 (5.6)
Call in from each room* 7.7 (6.5) 9.4 (7.5) 11.7 (6.7) 9.3 (5.8) 9.7 (7.6) 9.4 (6.9)
Put three sheets on bed* 12.5 (2.9) 2.1 (3.0) 3.1 (3.7) 2.0 (3.7) 5.1 (6.2) 5.7 (5.8)
(*) p < .10* p < .051 Average number of times the task or problem occurs per day, across all hotels

TABLE 7. Ergonomic Problems by Hotel.�1
� Hotel A Hotel B Hotel C Hotel D Hotel E Totals
� % % % % % %
Linen cart too heavy 87 84 80 82 87 84
Linen cart broken* 43 52 52 39 63 49
Linen cart difficult to stock 47 43 44 43 45 44
Heavy bedspreads or comforters on beds* 86 63 83 51 79 74
Cleaning supplies don’t clean well* 44 62 68 83 69 62
Cleaning supplies irritate skin or eyes 69 69 76 79 72 72
Vacuum cleaner too heavy* 57 66 74 44 64 62
Vacuum cleaner needs repair* 66 62 73 37 70 62
Vacuum cleaner cord too short* 38 20 40 15 34 30
No squeegie* 36 33 48 42 36 39
No mop* 13 48 40 46 15 32
Moving furniture* 38 41 50 61 22 43
(*) p < .10* p < .051 Shown is the percentage of room cleaners reporting that it is “somewhat of a problem” or “a big problem;” the remaining room cleaners
reported “no problem at all” or “very little problem.”

TABLE 8. Average Number of Work Tasks Performed Compared to Previous Five Years, by Hotel.
� Hotel A Hotel B Hotel C Hotel D Hotel E Totals
Characteristic� Mean (SD) Mean (SD) Mean (SD) Mean (SD) Mean (SD) Mean (SD)
“Do it less” (*) 4.0 (4.6) 4.5 (4.6) 3.6 (3.9) 4.9 (4.5) 4.6 (5.0) 4.2 (4.5)
“Do it about the same” (*) 11.7 (7.2) 13.5 (7.9) 12.5 (7.1) 11.7 (6.9) 12.5 (6.9) 12.4 (7.3)
“Do it more”* 10.3 (7.6) 8.0 (7.1) 9.9 (7.2) 9.4 (6.8) 8.9 (7.2) 9.4 (7.3)
(*) p < .10* p < .05

TABLE 9. Changes in Work Tasks Compared to Previous Five Years, by Hotel.�1
� Hotel A Hotel B Hotel C Hotel D Hotel E Totals
� % % % % % %
Problems with replacement linens
“Do it less” 13 16 14 11 16 14
“Do it more” 39 35 43 46 40 40Room needs extra linens like robes, etc.*
“Do it less” 18 28 21 20 18 21
“Do it more” 29 16 28 36 26 26Coffee pot in room needs cleaning*
“Do it less” 54 63 58 53 24 53
“Do it more” 13 7 7 17 31 14Put away iron and ironing board*
“Do it less” 7 8 7 13 24 10
“Do it more” 58 45 50 30 27 46Room service trays left in room*
“Do it less” 6 14 6 2 10 8
“Do it more” 53 32 38 52 46 44Lots of garbage left in room(*)
“Do it less” 5 2 3 2 7 4
“Do it more” 58 50 59 58 56 56
Ashtrays in room need cleaning(*)
“Do it less” 26 16 25 25 18 22
“Do it more” 34 38 38 32 49 37
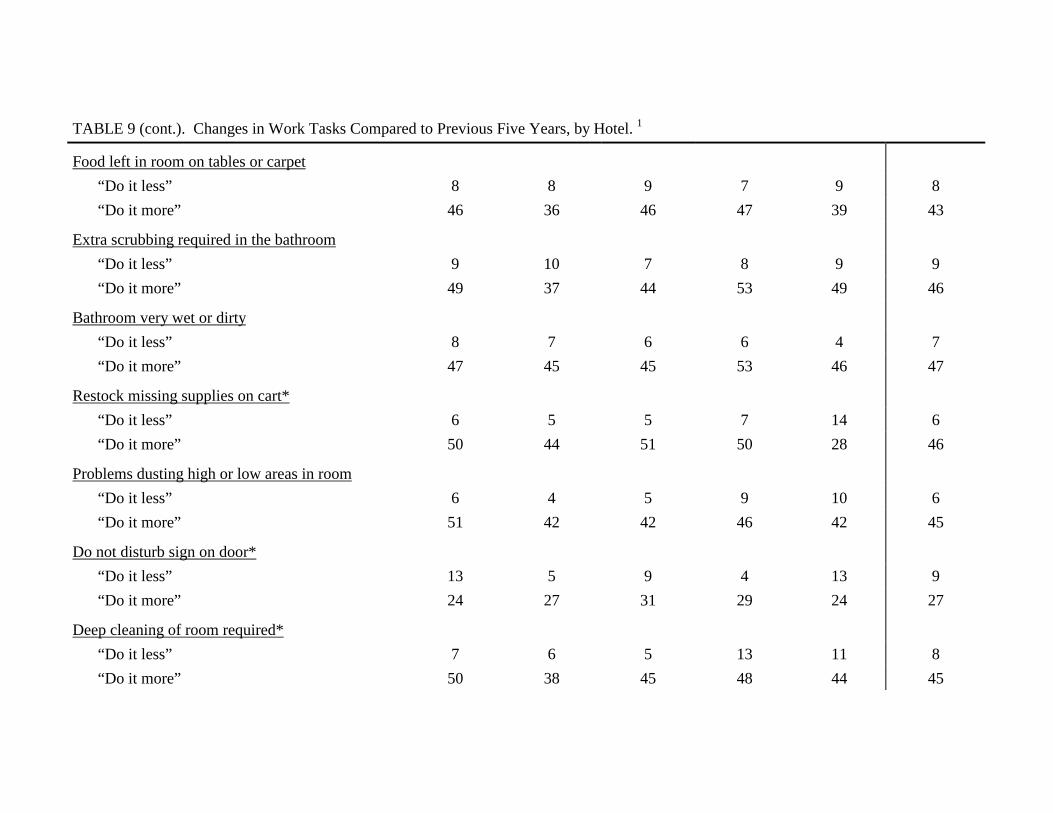
TABLE 9 (cont.). Changes in Work Tasks Compared to Previous Five Years, by Hotel.�1
Food left in room on tables or carpet
“Do it less” 8 8 9 7 9 8
“Do it more” 46 36 46 47 39 43
Extra scrubbing required in the bathroom
“Do it less” 9 10 7 8 9 9
“Do it more” 49 37 44 53 49 46
Bathroom very wet or dirty
“Do it less” 8 7 6 6 4 7
“Do it more” 47 45 45 53 46 47
Restock missing supplies on cart*
“Do it less” 6 5 5 7 14 6
“Do it more” 50 44 51 50 28 46
Problems dusting high or low areas in room
“Do it less” 6 4 5 9 10 6
“Do it more” 51 42 42 46 42 45
Do not disturb sign on door*
“Do it less” 13 5 9 4 13 9
“Do it more” 24 27 31 29 24 27
Deep cleaning of room required*
“Do it less” 7 6 5 13 11 8
“Do it more” 50 38 45 48 44 45

TABLE 9 (cont.). Changes in Work Tasks Compared to Previous Five Years, by Hotel.�1
Report a problem to someone else
“Do it less” 20 23 20 12 19 19
“Do it more” 25 23 25 22 31 25
Make extra beds(*)
“Do it less” 15 17 17 19 19 17
“Do it more” 37 23 30 28 24 30
Clean Jacuzzi*
“Do it less” 32 20 7 45 33 25
“Do it more” 27 27 25 15 20 24
Travel to another floor or building*
“Do it less” 19 16 10 19 17 16
“Do it more” 30 33 47 51 38 38
Clean VIP or rush rooms*
“Do it less” 12 20 10 28 20 17
“Do it more” 41 17 34 23 18 28
Clean large glass or mirror doors*
“Do it less” 8 13 6 5 5 8
“Do it more” 46 42 40 53 43 45
Clean marble sinks*
“Do it less” 14 23 16 33 29 21
“Do it more” 38 29 36 28 28 33
Clean chrome or brass fixtures
“Do it less” 24 26 17 29 19 23
“Do it more” 26 24 33 25 21 26

TABLE 9 (cont.). Changes in Work Tasks Compared to Previous Five Years, by Hotel.�1
Elevator not working*
“Do it less” 39 42 32 28 26 35
“Do it more” 20 16 26 26 20 21
Count linens*
“Do it less” 34 41 29 46 48 38
“Do it more” 23 18 32 13 10 21
Call in from each room*
“Do it less” 21 15 10 13 21 16
“Do it more” 30 31 52 50 32 38
Put three sheets on bed*
“Do it less” 1 27 14 36 29 18
“Do it more” 63 16 25 17 32 34
(*) p < .10* p < .051 Shown is the percentage of room cleaners responding “I ‘Do it more’” or “I ‘Do it less’” to the question “How have these tasks or problems
changed over the past 5 years?”

TABLE 10. Job Satisfaction by Hotel.�1
� Hotel A Hotel B Hotel C Hotel D Hotel E Totals
� % % % % % %
Not at all satisfied 30 19 23 28 21 25
Not too satisfied 27 33 31 33 26 30
Somewhat satisfied 36 42 39 35 48 39
Very satisfied 7 6 7 4 6 6
1 Shown is the percentage of room cleaners responding to the question “How satisfied are you with your job?”

TABLE 11. Job Potential by Hotel.�1
� Hotel A Hotel B Hotel C Hotel D Hotel E Totals
� % % % % % %
Job Security
“My job security is poor.”* 65 % 66 % 72 % 77 % 75 % 69 %
Undesirable Work Changes
“I have experienced or I expect to experiencean undesirable change in my work situation.”*
67 % 69 % 73 % 82 % 79 % 72 %
Job Promotion Prospects
“My job promotion prospects are poor.” 64 % 67 % 70 % 67 % 69 % 67 %
“Considering all my efforts and achievements,my prospects for job advancement areadequate.”
39 % 43 % 44 % 32 % 38 % 40 %
* p-value < 0.051 Shown is the percentage of room cleaners reporting that they agree with the statement; the remaining room cleaners disagreed with the
statement.

TABLE 12. Quality of Work by Hotel.
� Hotel A Hotel B Hotel C Hotel D Hotel E Totals
� % % % % % %
Repetitiveness 1
“My job involves doing a lot of things over andover again.” (*)
73 66 76 77 74 73
“I get to do a variety of different things on my job.” 52 50 52 51 55 51
Skill Development 1
“My job requires that I learn new things.” (*) 59 56 60 71 57 60
“I have an opportunity to develop my own specialabilities.”
29 23 28 20 32 26
Skill Utilization
“My job requires me to be creative.” 1 54 54 57 59 46 54
“My current occupational position adequatelyreflects my education and training.” 2 (*)
50 52 59 45 43 51
(*) p < .10* p < .051 Shown is the percentage of room cleaners reporting that they “strongly agree” or “agree” with the statement; the remaining room cleaners
reported “disagree” or “strongly disagree.”2 Shown is the percentage of room cleaners reporting that they agree with the statement; the remaining room cleaners disagreed with the
statement.

TABLE 13. Time Pressure and Conflicting Demands at Work, by Hotel.
� Hotel A Hotel B Hotel C Hotel D Hotel E Totals
� % % % % % %
Time Pressure
“My job requires working very fast.” 1* 77 69 82 83 62 75
“I have enough time to get the job done.” 1 19 17 20 14 19 18
“I have constant time pressure due to a heavy workload.” 2 (*)
90 87 88 90 79 88
“I am often pressed to work overtime.” 2 (*) 19 30 22 22 23 23
Conflicting Demands
“I am free from conflicting demands that othersmake on me.” 1 (*)
37 36 44 28 42 37
“I have many interruptions and disturbances in myjob.” 2
72 75 72 76 72 73
(*) p < .10* p < .051 Shown is the percentage of room cleaners reporting that they “strongly agree” or “agree” with the statement; the remaining room cleaners
reported “disagree” or “strongly disagree.”2 Shown is the percentage of room cleaners reporting that they agree with the statement; the remaining room cleaners disagreed with the
statement.

TABLE 14. Skip Lunch or Breaks, or Work Longer to Complete Assigned Rooms.
� Hotel A Hotel B Hotel C Hotel D Hotel E Totals
Characteristic� % n % n % n % n % n % n
I skipped or shortened lunchor break or worked longerhours to complete assignedrooms in last work week
71% (189) 61% (133) 63% (122) 70% (97) 65% (66) 66% (607)
Reason:
To make sure I canfinish all rooms by endof day*
94% (177) 86% (114) 91% (111) 88% (85) 89 (59) 90% (546)
To avoid discipline,points or other penalties
30% (57) 27% (36) 30% (36) 39% (38) 24% (16) 30% (183)
Other reason* 6% (12) 6% (8) 9% (11) 15% (15) 11% (7) 9% (53)
* p < .05
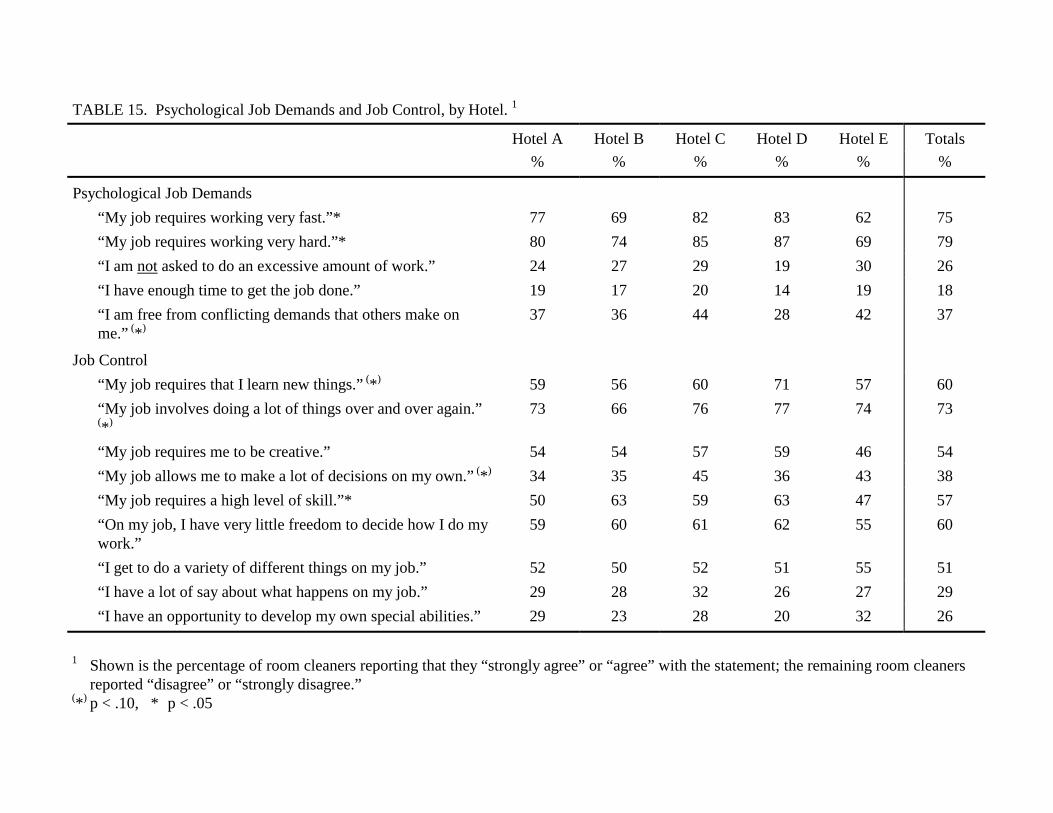
TABLE 15. Psychological Job Demands and Job Control, by Hotel.�1
� Hotel A Hotel B Hotel C Hotel D Hotel E Totals
� % % % % % %
Psychological Job Demands�
“My job requires working very fast.”* 77 69 82 83 62 75
“My job requires working very hard.”* 80 74 85 87 69 79
“I am not asked to do an excessive amount of work.” 24 27 29 19 30 26
“I have enough time to get the job done.” 19 17 20 14 19 18
“I am free from conflicting demands that others make onme.” (*)
37 36 44 28 42 37
Job Control
“My job requires that I learn new things.” (*) 59 56 60 71 57 60
“My job involves doing a lot of things over and over again.”(*)
73 66 76 77 74 73
“My job requires me to be creative.” 54 54 57 59 46 54
“My job allows me to make a lot of decisions on my own.” (*) 34 35 45 36 43 38
“My job requires a high level of skill.”* 50 63 59 63 47 57
“On my job, I have very little freedom to decide how I do mywork.”
59 60 61 62 55 60
“I get to do a variety of different things on my job.” 52 50 52 51 55 51
“I have a lot of say about what happens on my job.” 29 28 32 26 27 29
“I have an opportunity to develop my own special abilities.” 29 23 28 20 32 26
1 Shown is the percentage of room cleaners reporting that they “strongly agree” or “agree” with the statement; the remaining room cleanersreported “disagree” or “strongly disagree.”
(*) p < .10, * p < .05

TABLE 16. Average Scores for Psychological Job Demands and Job Control, by Hotel.
� Hotel A Hotel B Hotel C Hotel D Hotel E Totals
Characteristic� Mean (SD) Mean (SD) Mean (SD) Mean (SD) Mean (SD) Mean (SD)
Psychological Job Demands 1* 36.6 (7.0) 35.9 (7.2) 36.9 (6.6) 39.2 (6.9) 34.5 (6.6) 36.6 (7.0)
Job Control 2 55.9 (10.6) 56.3 (10.1) 56.3 (9.4) 56.5 (9.6) 55.5 (11.0) 56.1 (10.1)
* p < .051 Range 5 - 20, higher scores = higher psychological job demands. The psychological job demands value is a composite score of 5 items ratedon a 4-point scale. See Table 15 for a listing of the 5 items.
2 Range 9 - 36, higher scores = more job control. The job control value is a composite score of 9 items rated on a 4-point scale. See Table 15for a listing of the 9 items.

TABLE 17. High Levels of Job Strain by Hotel. (n = 881)
� Hotel A Hotel B Hotel C Hotel D Hotel E Totals
� % % % % % % (n)
High job strain 1 27 27 24 25 22 25 (223)
Very high job strain 2 15 17 13 14 14 15 (132)
1 High job strain is defined as the combination of high psychological job demands and low job control; high = upper 50th percentile, low =lower 50th percentile (median split), based on cut-points in Las Vegas.
2 Very high job strain is defined as the combination of very high psychological job demands and very low job control; very high = uppertertile, very low = lower tertile, based on cut-points in Las Vegas.

TABLE 18. Psychological Demands, Job Control, and Job Strain: Comparison of Las Vegas Room Cleaners, SanFrancisco Room Cleaners, and San Francisco Bus Drivers
� San Francisco BusDrivers
(n=235)
San FranciscoRoom Cleaners
(n=255)
Las Vegas RoomCleaners
(n=905)
Mean (SD) Mean (SD) Mean (SD)
Psychological Demands 34.0 (6.6) 35.1 (6.4) 36.6 (7.0)
Job Control 61.1 (10.3) 63.5 (12.5) 56.1 (10.1)
High Job Strain1 8% 13% 25%
Very High Job Strain 2 4% 4% 15%
Effort-Reward Imbalance 3 --- 31% 57%
1 High job strain is defined as the combination of high psychological job demands and low job control; high = upper 50th percentile, low =lower 50th percentile (median split), based on cut-points in Las Vegas.
2 Very high job strain is defined as the combination of very high psychological job demands and very low job control; very high = uppertertile, very low = lower tertile, based on cut-points in Las Vegas.
3 Effort-reward imbalance is defined as the combination of high effort and low reward at work (ratio >1). Because of slightly differentcomputation methods used for San Francisco and Las Vegas room cleaners, the comparability of the results is limited.

TABLE 19. Work Effort and Reward, by Hotel.�1
� Hotel A Hotel B Hotel C Hotel D Hotel E Totals
� % % % % % %
Effort
“I have constant time pressure due to a heavy workload.” (*)
90 87 88 90 79 88
“I have many interruptions and disturbances in myjob.”
71 75 73 76 72 73
“I have a lot of responsibility in my job.” 90 90 93 92 88 91
“I am often pressed to work overtime.” (*) 19 30 22 22 23 23
“My job is physically demanding.” (*) 89 90 94 94 87 91
“Over the past few years, my job has become moreand more demanding.”*
87 83 88 94 84 87
Reward
“I receive the respect I deserve from mysupervisors.”*
44 52 55 40 40 47
“I receive the respect I deserve from my co-workers.”
71 74 74 76 70 73
“I experience adequate support in difficultsituations.”
44 44 48 44 41 45
“I am treated unfairly at work.”* 63 56 58 69 73 62
“I have experienced or I expect to experience anundesirable change in my work situation.”*
67 69 73 82 79 72
“My job promotion prospects are poor.” 64 67 70 67 69 67
“My job security is poor.”* 65 66 72 77 75 69
“My current occupational position adequatelyreflects my education and training.” (*)
50 52 59 45 43 51
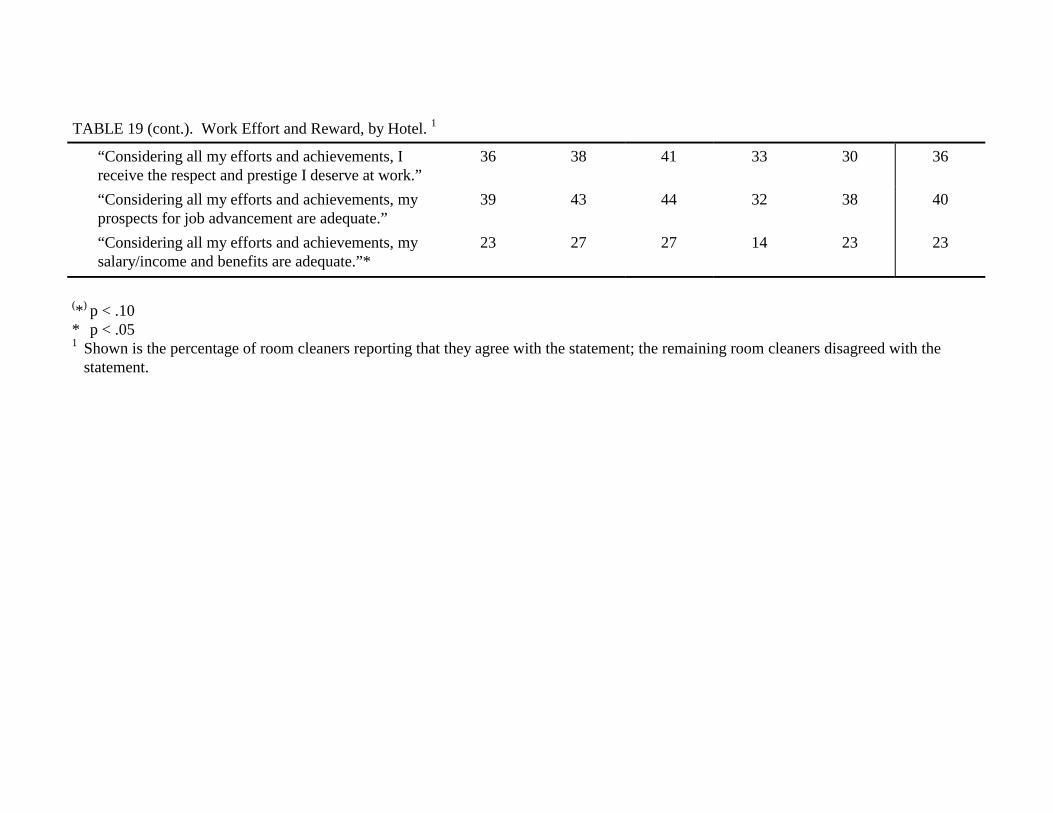
TABLE 19 (cont.). Work Effort and Reward, by Hotel.�1
“Considering all my efforts and achievements, Ireceive the respect and prestige I deserve at work.”
36 38 41 33 30 36
“Considering all my efforts and achievements, myprospects for job advancement are adequate.”
39 43 44 32 38 40
“Considering all my efforts and achievements, mysalary/income and benefits are adequate.”*
23 27 27 14 23 23
(*) p < .10* p < .051 Shown is the percentage of room cleaners reporting that they agree with the statement; the remaining room cleaners disagreed with the
statement.

�
TABLE 20. Average Scores for Work Effort and Reward, by Hotel.
� Hotel A Hotel B Hotel C Hotel D Hotel E Totals
Characteristic� Mean (SD) Mean (SD) Mean (SD) Mean (SD) Mean (SD) Mean (SD)
Effort 1 20.6 (6.1) 21.1 (5.9) 20.4 (5.9) 21.4 (5.8) 20.8 (6.4) 20.8 (6.0)
Reward 2* 35.3 (13.7) 37.2 (12.5) 36.6 (12.1) 32.8 (11.2) 33.5 (13.7) 35.4 (12.8)
* p < .051 Range 6 - 30, higher scores = higher effort at work. The effort score is a composite of 6 items rated on a 5-point scale (from 1-5). See Table19 for a listing of the 6 items.
2 Range 11 - 55, higher scores = higher reward at work. The reward score is a composite of 11 items rated on a 5-point scale (from 1-5). SeeTable 19 for a listing of the 11 items.

TABLE 21. Percentage of Room Cleaners With Work Effort-Reward Imbalance by Hotel.�1
� Hotel A Hotel B Hotel C Hotel D Hotel E Totals
� % % % % % %
Effort-Reward Imbalance* 57 53 54 70 56 57
* p < .051 Effort-Reward Imbalance is the combination of high effort and low reward at work.

TABLE 22. Supervisor and Co-Worker Support, by Hotel.�1
� Hotel A Hotel B Hotel C Hotel D Hotel E Totals
� % % % % % %
Supervisor Support
“My supervisor is concerned about the welfare of thoseunder him (her).*
34.8 50.2 53.2 33.6 33.0 42.1
“My supervisor pays attention to what I am saying.” 54.7 59.5 65.1 51.9 52.1 57.4
“My supervisor is helpful in getting the job done.”* 40.4 52.4 51.6 34.1 28.7 43.5
“My supervisor is respectful to those under her.* 57.8 67.9 64.4 55.6 46.9 60.1
“My supervisor shows favoritism in assigning work.” 57.1 52.8 51.9 59.7 59.2 55.7
Co-Worker Support
“People I work with are competent in doing their jobs.” 78.5 82.5 83.7 75.4 85.2 80.8
“People I work with take a personal interest in me.” 40.3 44.1 49.5 41.1 52.0 44.6
“People I work with are friendly.”* 70.0 73.8 87.8 76.9 84.0 77.2
“People I work with are helpful in getting the job done.”* 45.6 50.9 61.5 47.7 56.5 51.7
(*) p < .10* p < .051 Shown is the percentage of room cleaners reporting that they “strongly agree” or “agree” with the statement; the remaining room cleaners
reported “disagree” or “strongly disagree.”

�
TABLE 23. Average Scores for Supervisor Support and Co-Worker Support, by Hotel.
� Hotel A Hotel B Hotel C Hotel D Hotel E Totals
� Mean (SD) Mean (SD) Mean (SD) Mean (SD) Mean (SD) Mean (SD)
Supervisor Support 1* 11.7 (3.6) 12.8 (3.9) 12.8 (3.5) 11.6 (3.6) 11.3 (3.6) 12.1 (3.7)
Co-Worker Support 2* 10.6 (2.6) 11.1 (2.9) 11.4 (2.2) 10.5 (2.6) 11.4 (2.4) 11.0 (2.6)
* p < .051 Range 4 - 16, higher scores = more supervisor support. The supervisor support score is a composite of 4 items rated on a 4-point scale from
1-4. See Table 22 for a listing of these items (the first 4 statements under supervisor support heading).2 Range 4 - 16, higher scores = more co-worker support. The co-worker support score is a composite of 4 items rated on a 4-point scale from
1-4. See Table 22 for a listing of the 4 items.

TABLE 24. Problem Solving at Work by Hotel.�1
� Hotel A Hotel B Hotel C Hotel D Hotel E Totals
� % % % % % %
“I tried to change my work situation but gave up.”
Almost never or sometimes 74 % 76 % 75 % 79 % 81 % 76 %
Often or almost always 26 % 24 % 25 % 21 % 19 % 24 %
“I was encouraged to say what was bothering me atwork.”
Almost never or sometimes 83 % 87 % 82 % 80 % 76 % 83 %
Often or almost always 17 % 13 % 18 % 20 % 24 % 17 %
“I learned to live with the stress because there wasnothing I could do about it.”
Almost never or sometimes 35 % 39 % 37 % 42 % 36 % 37 %
Often or almost always 65 % 61 % 63 % 58 % 64 % 63 %
“I was usually able to solve the problem.”
Almost never or sometimes 78 % 81 % 80 % 80 % 72 % 79 %
Often or almost always 22 % 19 % 20 % 20 % 28 % 21 %
“I had some bad experiences when I madesuggestions on how to improve my work.”
Almost never or sometimes 80 % 82 % 82 % 82 % 74 % 80 %
Often or almost always 20 % 18 % 18 % 18 % 26 % 20 %
“When I complained about the problem, thingsimproved.”
Almost never or sometimes 87 % 87 % 88 % 91 % 82 % 87 %
Often or almost always 13 % 13 % 12 % 9 % 18 % 13 %

TABLE 24 (cont.). Problem Solving at Work by Hotel.�1
“The local union and local management work welltogether to solve problems.” *
Strongly agree or agree 82 % 83 % 63 % 75 % 72 % 76 %
Disagree or strongly disagree 18 % 17 % 37 % 25 % 28 % 24 %
“The local union in my hotel considers health andsafety (ergonomics) an important issue.”
Strongly agree or agree 90 % 88 % 84 % 91 % 88 % 88 %
Disagree or strongly disagree 10 % 12 % 16 % 9 % 12 % 12 %
“The management in my hotel considers health andsafety (ergonomics) an important issue.”2*
Strongly agree or agree 44 % 39 % 40 % 33 % 56 % 42 %
Disagree or strongly disagree 56 % 61 % 60 % 67 % 44 % 58 %
* p < .051 Shown is the percentage of room cleaners responding to the question “When you think about all the stressful problems on your job, what
were your experiences when you tried to do something about it?”2 Shown is the percentage of room cleaners responding to the question “For each statement below, check the box that comes closest to
describing your job situation.”

TABLE 25. Self-Rated General Health in Room Cleaners by Hotel.
� Hotel A Hotel B Hotel C Hotel D Hotel E Totals
�
Characteristic�
%or
Mean
nor
(SD)
%or
Mean
nor
(SD)
%or
Mean
nor
(SD)
%or
Mean
nor
(SD)
%or
Mean
nor
(SD)
%or
Mean
nor
(SD)
General health(Average score) 1
40.8 (27.8) 33.6 (26.1) 41.6 (28.1) 43.3 (25.3) 36.6 (30.7) 39.1 (27.6)
General health 2*
Excellent 5 % 14 3 % 6 6 % 12 3 % 4 4 % 4 4 % 40
Very Good 7 % 18 6 % 13 8 % 16 9 % 12 11 % 11 8 % 70
Good 32 % 86 22 % 50 29 % 56 36 % 49 25 % 25 29 % 266
Fair 42 % 112 50 % 113 45 % 89 45 % 61 35 % 36 44 % 411
Poor 14 % 37 19 % 42 12 % 23 7 % 10 25 % 26 15 % 138
* p < .051 All values are transformed to a 0-to-100 scale with higher values representing better health.2 Shown is the percentage and number of room cleaners responding to the question “Would you say your health in general is now excellent,
very good, good, fair, or poor?”

TABLE 26. Self-rated Health According to the Short-Form-36 Health Survey (SF-36) by Hotel.�1
� Hotel A Hotel B Hotel C Hotel D Hotel E Totals
Characteristic� Mean (SD) Mean (SD) Mean (SD) Mean (SD) Mean (SD) Mean (SD)
General health* 40.8 (27.8) 33.6 (26.1) 41.6 (28.1) 43.3 (25.3) 36.6 (30.7) 39.1 (27.6)
Physical functioning* 54.2 (28.1) 45.8 (25.8) 48.3 (27.1) 52.8 (26.3) 47.6 (28.3) 50.0 (27.2)
Role limitations due tophysical health problems(*)
39.7 (39.4) 29.8 (37.3) 33.2 (38.2) 34.5 (38.0) 36.6 (38.0) 34.8 (38.4)
Role limitations due toemotional problems(*)
44.7 (39.5) 37.3 (40.0) 42.2 (37.0) 34.8 (40.8) 37.8 (40.7) 40.2 (39.6)
Bodily pain during the past 4weeks(*)
34.5 (27.9) 29.3 (25.1) 37.3 (28.9) 32.9 (25.7) 33.9 (27.1) 33.5 (27.1)
Bodily pain during the past 4weeks that interferes withnormal work
37.7 (23.8) 33.6 (22.4) 39.9 (26.6) 36.0 (22.8) 36.4 (23.3) 36.8 (23.9)
Vitality, energy or fatigue 35.4 (21.4) 36.3 (21.1) 37.4 (22.7) 36.3 (19.1) 36.8 (21.9) 36.3 (21.3)
(*) p < .10* p < .051 All values are transformed to a 0-to-100 scale with higher values representing better health.
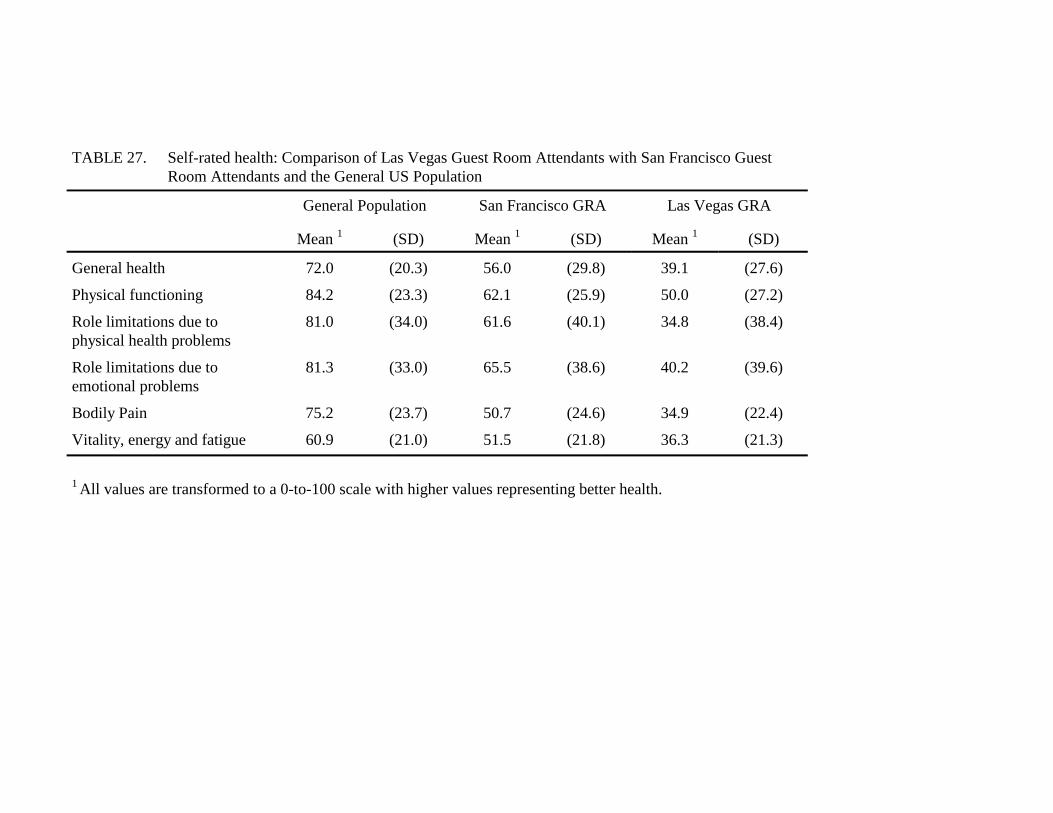
TABLE 27. Self-rated health: Comparison of Las Vegas Guest Room Attendants with San Francisco GuestRoom Attendants and the General US Population
� General Population San Francisco GRA Las Vegas GRA
Mean�1 (SD) Mean�1 (SD) Mean�1 (SD)
General health 72.0 (20.3) 56.0 (29.8) 39.1 (27.6)
Physical functioning 84.2 (23.3) 62.1 (25.9) 50.0 (27.2)
Role limitations due tophysical health problems
81.0 (34.0) 61.6 (40.1) 34.8 (38.4)
Role limitations due toemotional problems
81.3 (33.0) 65.5 (38.6) 40.2 (39.6)
Bodily Pain 75.2 (23.7) 50.7 (24.6) 34.9 (22.4)
Vitality, energy and fatigue 60.9 (21.0) 51.5 (21.8) 36.3 (21.3)
1 All values are transformed to a 0-to-100 scale with higher values representing better health.

TABLE 28. Psychosomatic Symptom Scores by Hotel.
� Hotel A Hotel B Hotel C Hotel D Hotel E Totals
� Mean (SD) Mean (SD) Mean (SD) Mean (SD) Mean (SD) Mean (SD)
Psychosomatic symptoms score 26.5 (6.6) 28.4 (5.5) 26.6 (6.2) 27.0 (5.7) 27.0 (6.4) 27.1 (6.1)
1 All values are transformed to a 0-to-100 scale with higher values representing better health.

TABLE 29. Musculoskeletal Pain During the Past 4 Weeks by Body Part and Hotel.�1
Hotel A Hotel B Hotel C Hotel D Hotel E Totals
% % % % % %
Hands, Wrists, Fingers*
None or very mild 23 14 28 22 14 21
Mild or moderate 33 38 34 39 41 36
Severe or very severe 44 48 39 38 44 43
Lower Arms, Elbows*
None or very mild 26 17 33 24 19 24
Mild or moderate 40 35 35 39 38 38
Severe or very severe 34 47 32 37 43 38
Upper Arms, Shoulders
None or very mild 15 12 16 16 11 14
Mild or moderate 35 29 34 29 30 32
Severe or very severe 50 59 50 56 59 54
Head*
None or very mild 30 20 27 30 27 27
Mild or moderate 32 42 43 42 32 38
Severe or very severe 38 38 30 28 41 35
Chest or Abdomen
None or very mild 46 37 50 49 39 44
Mild or moderate 33 39 34 30 33 34
Severe or very severe 20 25 16 21 28 21
Neck
None or very mild 25 20 28 32 20 25
Mild or moderate 33 32 31 32 32 32
Severe or very severe 42 47 41 35 48 43
Upper Back*
None or very mild 17 8 20 11 12 14
Mild or moderate 28 26 23 28 33 27
Severe or very severe 55 66 57 62 56 59
Lower Back
None or very mild 11 6 13 13 11 10
Mild or moderate 28 29 27 22 34 28
Severe or very severe 61 65 61 65 55 62

TABLE 29 (cont.). Musculoskeletal Pain During the Past 4 Weeks by Body Part and Hotel.�1
Hips*
None or very mild 25 17 34 24 22 24
Mild or moderate 27 29 17 25 32 26
Severe or very severe 48 54 49 51 46 50
Knees
None or very mild 22 23 30 26 23 25
Mild or moderate 31 33 31 35 29 32
Severe or very severe 47 44 39 39 48 44
Legs
None or very mild 16 16 19 15 14 16
Mild or moderate 33 32 28 39 38 33
Severe or very severe 50 52 53 46 47 50
Feet, Ankles
None or very mild 19 13 20 13 13 16
Mild or moderate 27 32 21 28 31 27
Severe or very severe 54 55 59 59 56 56
* p < .051 Shown is the percentage of room cleaners responding to the question “How much pain have
you experienced in the following parts of your body during the past 4 weeks?”
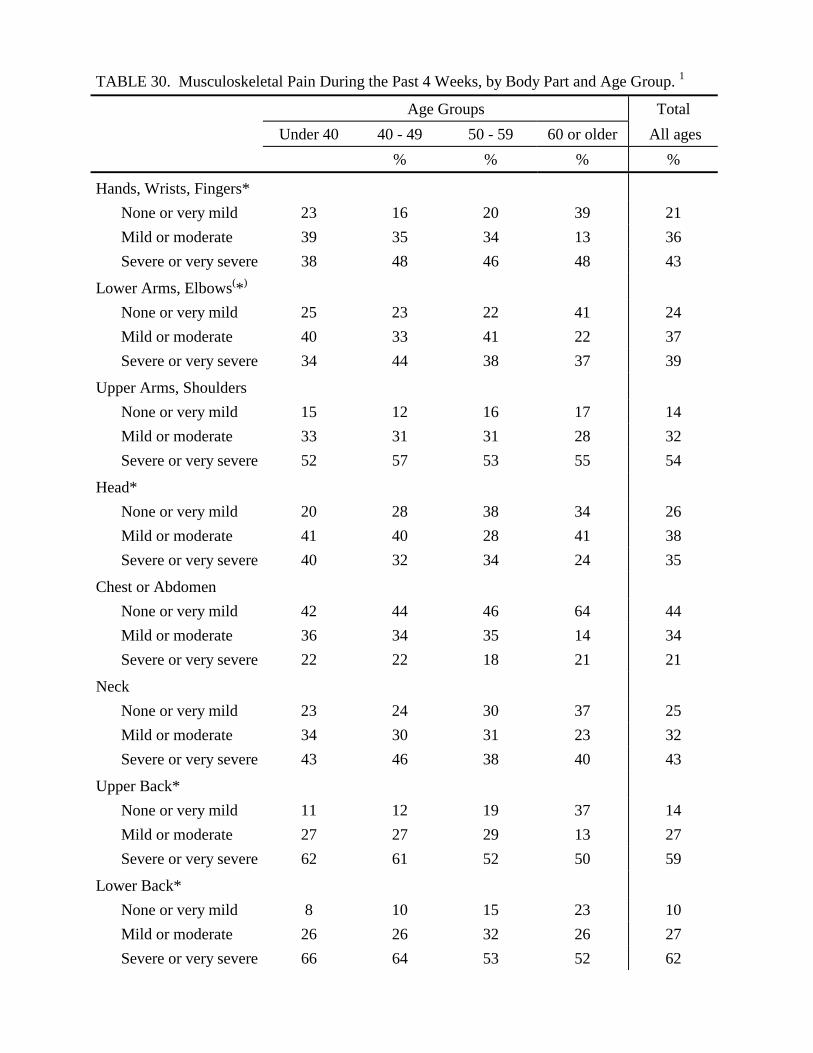
TABLE 30. Musculoskeletal Pain During the Past 4 Weeks, by Body Part and Age Group.�1�
Age Groups Total
Under 40 40 - 49 50 - 59 60 or older All ages
% % % %
Hands, Wrists, Fingers*
None or very mild 23 16 20 39 21
Mild or moderate 39 35 34 13 36
Severe or very severe 38 48 46 48 43
Lower Arms, Elbows(*)
None or very mild 25 23 22 41 24
Mild or moderate 40 33 41 22 37
Severe or very severe 34 44 38 37 39
Upper Arms, Shoulders
None or very mild 15 12 16 17 14
Mild or moderate 33 31 31 28 32
Severe or very severe 52 57 53 55 54
Head*
None or very mild 20 28 38 34 26
Mild or moderate 41 40 28 41 38
Severe or very severe 40 32 34 24 35
Chest or Abdomen
None or very mild 42 44 46 64 44
Mild or moderate 36 34 35 14 34
Severe or very severe 22 22 18 21 21
Neck
None or very mild 23 24 30 37 25
Mild or moderate 34 30 31 23 32
Severe or very severe 43 46 38 40 43
Upper Back*
None or very mild 11 12 19 37 14
Mild or moderate 27 27 29 13 27
Severe or very severe 62 61 52 50 59
Lower Back*
None or very mild 8 10 15 23 10
Mild or moderate 26 26 32 26 27
Severe or very severe 66 64 53 52 62

TABLE 30 (cont.). Musculoskeletal Pain During the Past 4 Weeks, by Body Part and Age Group.1�
Hips*
None or very mild 23 20 33 30 24
Mild or moderate 29 24 23 26 26
Severe or very severe 48 57 45 44 50
Knees(*)
None or very mild 26 22 24 28 24
Mild or moderate 36 29 29 17 32
Severe or very severe 38 49 47 55 44
Legs
None or very mild 14 16 20 23 16
Mild or moderate 36 33 30 23 33
Severe or very severe 49 52 50 53 50
Feet, Ankles*
None or very mild 14 15 22 28 16
Mild or moderate 31 24 26 24 27
Severe or very severe 56 61 52 48 57
(*) p < .10* p < .051 Shown is the percentage of room cleaners in each age group and over all ages responding to thequestion “How much pain have you experienced in the following parts of your body during thepast 4 weeks?”

TABLE 31. Took Pain Medication During the Last Four Weeks, by Hotel.
� Hotel A Hotel B Hotel C Hotel D Hotel E Totals
� % % % % % %
Took Pain Medication (Aspirin, Ibuprofen, etc.) 84 87 81 80 83 83

TABLE 32. Work Related Pain, Discomfort or Injuries During the Past 12 Months, by Hotel. (n = 913)
� Hotel A Hotel B Hotel C Hotel D Hotel E Totals
Characteristic� % n % n % n % n % n % n
Had pain/discomfortbelieved to be caused ormade worse by work
77 % 200 79 % 173 74 % 142 79 % 109 84 % 86 78 % 710
Pain/discomfort beganafter current job started
98 % 192 95 % 164 93 % 130 94 % 101 96 % 78 96 % 665 1
Reported thepain/discomfort tosupervisor or othermanagement
34 % 67 28 % 48 31 % 43 32 % 34 34 % 29 32 % 221 3
Visited doctor about thepain/discomfort
66 % 130 65 % 107 59 % 82 55 % 59 61 % 52 62 % 430 2
Called in sick or usedvacation day because ofthis pain/discomfort
63 % 126 55 % 96 56 % 80 47 % 51 57 % 49 57 % 402 4
1 A total of 695 persons responded to this question2 A total of 692 persons responded to this question3 A total of 698 persons responded to this question4 A total of 710 persons responded to this question

TABLE 33. Work Days Missed Because of Work-Related Pain or Discomfort During the Past 12 Months.
� Hotel A Hotel B Hotel C Hotel D Hotel E Totals
�
Characteristic�
%or
Mean
nor
(SD)
%or
Mean
nor
(SD)
%or
Mean
nor
(SD)
%or
Mean
nor
(SD)
%or
Mean
nor
(SD)
%or
Mean
nor
(SD)
Called in sick(*) 58 % 114 50 % 77 46 % 64 43 % 46 52 % 37 50 % 338 1
Number of sick daystaken
7.6 (10.5) 10.5 (21.6) 5.5 (6.0) 6.2 (14.0) 7.4 (11.0) 7.7 (13.7)
Used vacation days* 27 % 53 34 % 56 30 % 42 11 % 12 38 % 30 28 % 193 2
Number of vacationdays taken
9.8 (6.7) 11.1 (9.4) 11.5 (7.0) 10.4 (7.8) 10.4 (7.1) 10.7 (7.7)
Total number of workdayslost per 100 workers/year*
552 661 378 289 640 506
(*) p < .10* p < .051 A total of 670 persons responded to this question2 A total of 684 persons responded to this question

TABLE 34. Reported Work-Related Injury or Illness During the Last 12 Months. (n = 880)
� Hotel A Hotel B Hotel C Hotel D Hotel E Totals
�
Characteristic�
%or
Mean
nor
(SD)
%or
Mean
nor
(SD)
%or
Mean
nor
(SD)
%or
Mean
nor
(SD)
%or
Mean
nor
(SD)
%or
Mean
nor
(SD)
Reported work-relatedinjury or illness to workers’compensation*
30 % 75 19 % 40 16 % 29 16 % 21 20 % 19 21 % 184
Average number ofinjuries reported
1.6 (1.0) 1.5 (0.8) 1.3 (0.7) 1.2 (0.4) 1.7 (1.0) 1.5 (0.9)
Days missed because ofreported injury or illness
7.0 (13.5) 9.3 (19.6) 8.7 (27.2) 8.9 (28.0) 20.5 (28.3) 9.6 (21.3)
Days missed because ofreported injury or illness per100 workers*
210 157 146 150 409 197
* p < .05

TABLE 35. Barriers to Reporting Work-Related Injuries or Illnesses.
� Hotel A Hotel B Hotel C Hotel D Hotel E Totals
� % n % n % n % n % n % n
Had a work-related injury orillness but did not report it
17 % 44 21 % 46 18 %� 33 21 % 29 16 % 16 19 % 168 1
Not reported because:
“I didn’t know how.” 14 % 6 17 % 8 18 % 6 21 % 6 19 % 3 17 % 29
“I was afraid.” 25 % 11 22 % 10 15 % 5 31 % 9 25 % 4 23 % 39
“I thought it would be toomuch trouble.”
34 % 15 41 % 19 39 % 13 38 % 11 44 % 7 39 % 65
Other 30 % 13 24 % 11 30 % 10 28 % 8 44 % 7 29 % 49
If reported Work-related injuryor illness:
Had to take a drug test whenthe injury or illness wasreported*
13 % 9 30 % 11 34 % 10 52 % 11 89 % 17 33 % 58 2
Got taken to health careprovider or clinic
92 % 68 83 % 29 86 % 25 90 % 19 89 % 17 89 % 158 3
Got well before returning towork
47 % 34 54 % 20 36 % 10 33 % 7 53 % 10 46 % 81 3
After returning to work,missed additional days ofwork because of the injury
38 % 27 41 % 15 43 % 12 11 % 2 33 % 6 36 % 62 4
Got a warning or otherdiscipline for missing work
26 % 19 28 % 10 8 % 2 14 % 3 18 % 3 21 % 37 5

TABLE 35 (cont.). Barriers to Reporting Work-Related Injuries or Illnesses.
Workers compensation claim notaccepted
38 % 26 64 % 18 33 % 7 50 % 8 33 % 5 43 % 64 6
Declined claim was notappealed
78 % 14 93 % 13 100 % 5 100 % 5 100 % 4 89 % 41 7
Appeal not made because:
“I did not know I could.” 50 % 7 62 % 8 40 % 2 80 % 4 50 % 2 56 % 23
“I received information onlyin English.”
0 % 0 15 % 2 0 % 0 20 % 1 25 % 1 10 % 4
* p < .051 A total of 891 persons responded to this question2 A total of 175 persons responded to this question3 A total of 178 persons responded to this question4 A total of 174 persons responded to this question5 A total of 173 persons responded to this question6 A total of 149 persons responded to this question7 A total of 46 persons responded to this question

TABLE 36. Workers Compensation Payment of Medical Care Expenses for Reported Work-Related Injury or Illness (n = 166)
� Hotel A Hotel B Hotel C Hotel D Hotel E Totals
Characteristic� % n % n % n % n % n % n
Workers’ Compensation paid formedical care*
73 % 51 39 % 13 52 % 13 60 % 12 72 % 13 61 % 102
Workers’ Compensation did notpay for medical care*
27 % 19 61 % 20 48 % 12 40 % 8 28 % 5 39 % 64
Reason given:
“I did not file a claim.” 32 % 6 20 % 4 50 % 6 38 % 3 40 % 2 33 % 21
“I went to a doctor that wasnot approved.”
21 % 4 10 % 2 0 % 0 0 % 0 0 % 0 9 % 6
“I filed the claim too late.” 5 % 1 5 % 1 8 % 1 0 % 0 20 % 1 6 % 4
“They said my injury wasnot related to this job.”
16 % 3 0 % 0 0 % 0 13 % 1 20 % 1 8 % 5
“They said I did not provemy injury was work-related.”
16 % 3 15 % 3 0 % 0 13 % 1 20 % 1 13 % 8
“I needed medical bills paidso I filed with my healthinsurance.”
5 % 1 15 % 3 8 % 1 13 % 1 40 % 2 13 % 8
* p < .05

TABLE 37. Hypertension Among Room Cleaners. (n = 913)
� Hotel A Hotel B Hotel C Hotel D Hotel E Totals
� % % % % % %
Doctor diagnosed high blood pressure(*) 28 % 22 % 19 % 16 % 30 % 23 %
Taking blood pressure medication
Yes 45 % 49 % 57 % 38 % 58 % 49 %
No 55 % 51 % 43 % 62 % 47 % 51 %
(*) p < .10

Table 38. Age-Adjusted Risk Factors for Self-Reported Fair or Poor Health(SF-36 scale), n = 872
Risk Factor nAdjusted
Odds Ratio95% Confidence
Interval
No. rooms cleaned per day 820
14 or less 1 Reference15 or more (*) 1.30 0.96 – 1.75
No. beds made per day 819
18 or less 1 Reference19 or more * 1.43 1.08 – 1.90
No. of Buildings 850
1 1 Reference2 1.11 0.70 – 1.773* 2.42 1.03 – 5.72
No. of Floors 870
1 1 Reference2 1.14 0.85 – 1.543* 1.87 1.24 – 2.82
Lunch or breaks skipped orshortened to finish rooms
809
No 1 ReferenceYes* 1.65 1.22 – 2.23
Psychological demands 800
Low 1 ReferenceMedium 0.88 0.62 – 1.24High 0.94 0.66 – 1.33
Job control 798
High 1 ReferenceMedium 1.24 0.88 – 1.73Low* 1.50 1.05 – 2.13
Job strain 791
No 1 ReferenceYes 0.89 0.60 – 1.32
Effort/Reward Imbalance 815
No 1 ReferenceYes* 2.56 1.92 – 3.42
(*) p < .10* p < .05

Table 39. Age-Adjusted Risk Factors for Self-Reported Severe or Very Severe Pain(SF-36 scale), n = 872
Risk Factor nAdjusted
Odds Ratio95% Confidence
Interval
No. rooms cleaned per day 814
14 or less 1 Reference15 or more 1.25 0.92 – 1.68
No. beds made per day 813
18 or less 1 Reference19 or more 1.13 0.86 – 1.49
No. of Buildings 844
1 1 Reference2 1.02 0.64 – 1.623* 3.86 1.63 – 9.12
No. of Floors 863
1 1 Reference2 0.90 0.68 – 1.223* 1.84 1.24 – 2.73
Lunch or breaks skipped orshortened to finish rooms
802
No 1 ReferenceYes* 2.36 1.73 – 3.24
Psychological demands 790
Low 1 ReferenceMedium 1.09 0.77 – 1.55High* 1.75 1.23 – 2.50
Job control 789
High 1 ReferenceMedium (*) 1.40 1.00 – 1.95Low* 1.67 1.18 – 2.37
Job strain 782
No 1 ReferenceYes* 1.58 1.07 – 2.34
Effort/Reward Imbalance 808
No 1 ReferenceYes* 4.53 3.33 – 6.16
(*) p < .10* p < .05