health and safety in the waste sector in great britain, · pdf filesummary the information in...
TRANSCRIPT
This document is available from www.hse.gov.uk/statistics/ Page 1 of 14
Health and Safety Executive
Health and safety in the Waste sector in Great Britain, 2017
Contents
Summary 2
Introduction 3
Work-related illness and workplace injury in the waste sector 4
Work-related illness 4
Work related illness by illness type 6
Workplace injury 7
Fatal injuries 7
Non-fatal injuries to workers 8
Enforcement 10
Annex 1: Sources and definitions used 11
Annex 2: Data tables 12

This document is available from www.hse.gov.uk/statistics/ Page 2 of 14
Summary The information in this document relates to health and safety statistics for 2016. The document can be found at: www.hse.gov.uk/statistics/industry/waste-recycling/waste-recycling.pdf
6,000 workers suffering from a
work-related illness each year (LFS)
14 fatal injuries to workers in 2016/17
(RIDDOR)
5,000 non-fatal injuries to workers each year (LFS)
Work-related ill health by illness type
(Source: LFS annual average estimate 2009/10-2011/12, 2013/14-2016/17)
Fatal injuries to workers by most common accident kinds (Source: Fatal injuries reportable under RIDDOR, 2012/13-2016/17
Non-fatal injuries to employees by most common accident kinds (Source: Non-fatal injuries reported under RIDDOR 2014/15-2016/17)
Note: LFS: Labour Force Survey (annual average estimates in 2009/10-2011/12, 2013/14-2016/17 for illness; 2010/11-2016/17
for injury). Illness estimates include both new and longstanding cases.
RIDDOR: Reporting of Injuries Diseases and Dangerous Occurrences Regulations The most common accident kinds included in the charts above are those that account for 10% or more of injuries

This document is available from www.hse.gov.uk/statistics/ Page 3 of 14
Introduction This report provides a profile of workplace health and safety for workers in the waste sector.
For this report, the waste sector has been defined with reference to the Standard Industrial Classification (SIC), an internationally agreed classification of industries
1 and includes the following activities:
Waste collection, treatment and disposal activities; materials recovery (SIC 38).
Some activities associated with waste fall outside of this definition of the waste sector. Most notably the wholesale of waste and scrap
2 (including collecting, sorting, separating, stripping of used goods) is an
industry that is often associated with the waste sector, but within the Standard Industrial Classification is classified in the wholesale and retail trade sector. The wholesale of waste and scrap industry is small relative to the waste sector: statistics show the contribution of the wholesale of waste and scrap to the totality of work-related illness and injury in the combined sector (including both waste and wholesale of waste and scrap) to be small. Further, the rate of illness and injury is broadly similar for the combined industry group and the waste sector on its own. Therefore, statistics in this report are mostly presented for the waste sector only (SIC38) and do not include wholesale of waste and scrap. The waste sector accounts for around 0.4% of the jobs in Great Britain
3 . This report considers the current
health and safety situation for the waste sector, with a focus on the scale and profile of work-related illness and injury in workers in the sector. The main source of data used within this report comes from the Labour Force Survey, a large scale, nationally representative survey of households. This is the most comprehensive data source for both work-related illness and workplace injury. For work-related illness, the Labour Force Survey data in this report is supplemented with data from a medical surveillance scheme (THOR), while for injuries this survey data is supplemented with data from statutory notifications of workplace injuries under the Reporting of Injuries, Diseases and Dangerous Occurrence Regulations (RIDDOR) to ensure as complete a picture as possible. More details on these (and other) data sources can be found at Annex 1.
1 See www.ons.gov.uk/methodology/classificationsandstandards/ukstandardindustrialclassificationofeconomicactivities/uksic2007 for
more details. The ‘Waste’ sector is defined by Division 38 of the 2007 Standard Industrial Classification. 2 Wholesale of waste and scrap industry is defined as class 46.77 within the 2007 Standard Industrial Classification
3 Annual Population Survey, 2012-2016
This document is available from www.hse.gov.uk/statistics/ Page 4 of 14
Work-related illness and workplace injury in the waste sector
Work-related illness
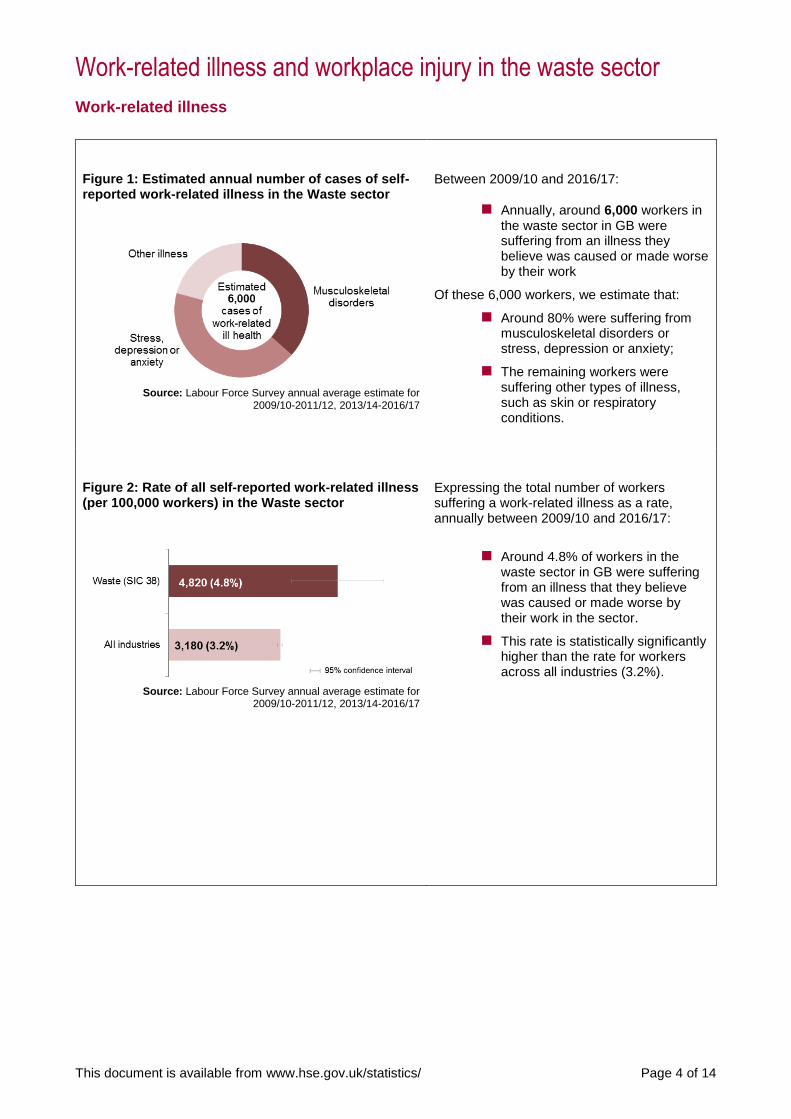
Figure 1: Estimated annual number of cases of self-reported work-related illness in the Waste sector
Source: Labour Force Survey annual average estimate for
2009/10-2011/12, 2013/14-2016/17
Between 2009/10 and 2016/17:
Annually, around 6,000 workers in the waste sector in GB were suffering from an illness they believe was caused or made worse by their work
Of these 6,000 workers, we estimate that:
Around 80% were suffering from musculoskeletal disorders or stress, depression or anxiety;
The remaining workers were suffering other types of illness, such as skin or respiratory conditions.
Figure 2: Rate of all self-reported work-related illness (per 100,000 workers) in the Waste sector
Source: Labour Force Survey annual average estimate for
2009/10-2011/12, 2013/14-2016/17
Expressing the total number of workers suffering a work-related illness as a rate, annually between 2009/10 and 2016/17:
Around 4.8% of workers in the
waste sector in GB were suffering from an illness that they believe was caused or made worse by their work in the sector.
This rate is statistically significantly higher than the rate for workers across all industries (3.2%).

This document is available from www.hse.gov.uk/statistics/ Page 5 of 14
Figure 3: Comparison of the rate of all self-reported work-related illness (per 100,000 workers) in the Waste sector with selected industries
Source: Labour Force Survey, annual average estimate for
2009/10-2011/12, 2013/14-2016/17
Comparing the rate of self-reported work-related illness in the waste sector with other selected industries, between 2009/10 and 2016/17:
The rate in the waste sector is of a
similar order to that in Human health and Social work activities which has the highest illness rate of all the main industry sectors.
While the rate in the Waste sector appears higher than the rate in the Agriculture sector, the difference is not statistically significantly (i.e. the difference may be due to sampling error that results from surveying a sample rather than the full population)
The rate in the Waste sector is statistically significantly higher than the rate in the Manufacturing and Construction sectors.
This document is available from www.hse.gov.uk/statistics/ Page 6 of 14
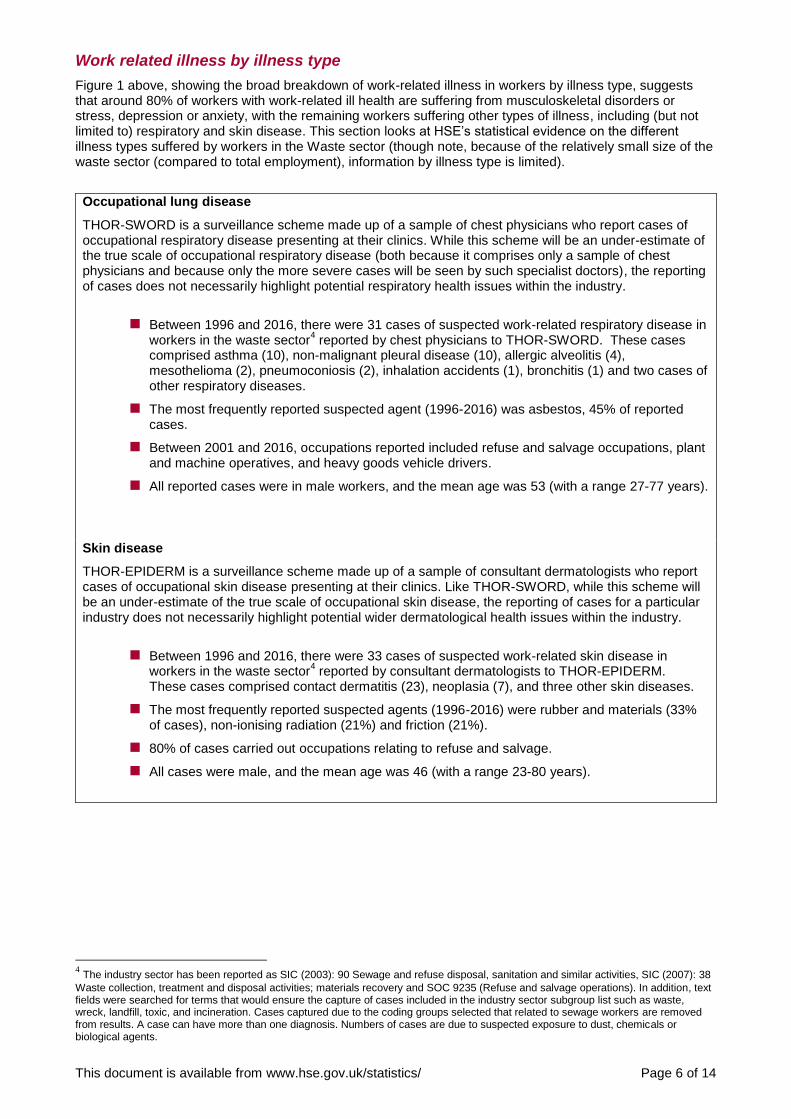
Work related illness by illness type
Figure 1 above, showing the broad breakdown of work-related illness in workers by illness type, suggests that around 80% of workers with work-related ill health are suffering from musculoskeletal disorders or stress, depression or anxiety, with the remaining workers suffering other types of illness, including (but not limited to) respiratory and skin disease. This section looks at HSE’s statistical evidence on the different illness types suffered by workers in the Waste sector (though note, because of the relatively small size of the waste sector (compared to total employment), information by illness type is limited).
Occupational lung disease
THOR-SWORD is a surveillance scheme made up of a sample of chest physicians who report cases of occupational respiratory disease presenting at their clinics. While this scheme will be an under-estimate of the true scale of occupational respiratory disease (both because it comprises only a sample of chest physicians and because only the more severe cases will be seen by such specialist doctors), the reporting of cases does not necessarily highlight potential respiratory health issues within the industry.
Between 1996 and 2016, there were 31 cases of suspected work-related respiratory disease in
workers in the waste sector4 reported by chest physicians to THOR-SWORD. These cases
comprised asthma (10), non-malignant pleural disease (10), allergic alveolitis (4), mesothelioma (2), pneumoconiosis (2), inhalation accidents (1), bronchitis (1) and two cases of other respiratory diseases.
The most frequently reported suspected agent (1996-2016) was asbestos, 45% of reported cases.
Between 2001 and 2016, occupations reported included refuse and salvage occupations, plant and machine operatives, and heavy goods vehicle drivers.
All reported cases were in male workers, and the mean age was 53 (with a range 27-77 years).
Skin disease
THOR-EPIDERM is a surveillance scheme made up of a sample of consultant dermatologists who report cases of occupational skin disease presenting at their clinics. Like THOR-SWORD, while this scheme will be an under-estimate of the true scale of occupational skin disease, the reporting of cases for a particular industry does not necessarily highlight potential wider dermatological health issues within the industry.
Between 1996 and 2016, there were 33 cases of suspected work-related skin disease in
workers in the waste sector4 reported by consultant dermatologists to THOR-EPIDERM.
These cases comprised contact dermatitis (23), neoplasia (7), and three other skin diseases.
The most frequently reported suspected agents (1996-2016) were rubber and materials (33% of cases), non-ionising radiation (21%) and friction (21%).
80% of cases carried out occupations relating to refuse and salvage.
All cases were male, and the mean age was 46 (with a range 23-80 years).
4 The industry sector has been reported as SIC (2003): 90 Sewage and refuse disposal, sanitation and similar activities, SIC (2007): 38
Waste collection, treatment and disposal activities; materials recovery and SOC 9235 (Refuse and salvage operations). In addition, text fields were searched for terms that would ensure the capture of cases included in the industry sector subgroup list such as waste, wreck, landfill, toxic, and incineration. Cases captured due to the coding groups selected that related to sewage workers are removed from results. A case can have more than one diagnosis. Numbers of cases are due to suspected exposure to dust, chemicals or biological agents.
This document is available from www.hse.gov.uk/statistics/ Page 7 of 14
Workplace injury
Fatal injuries
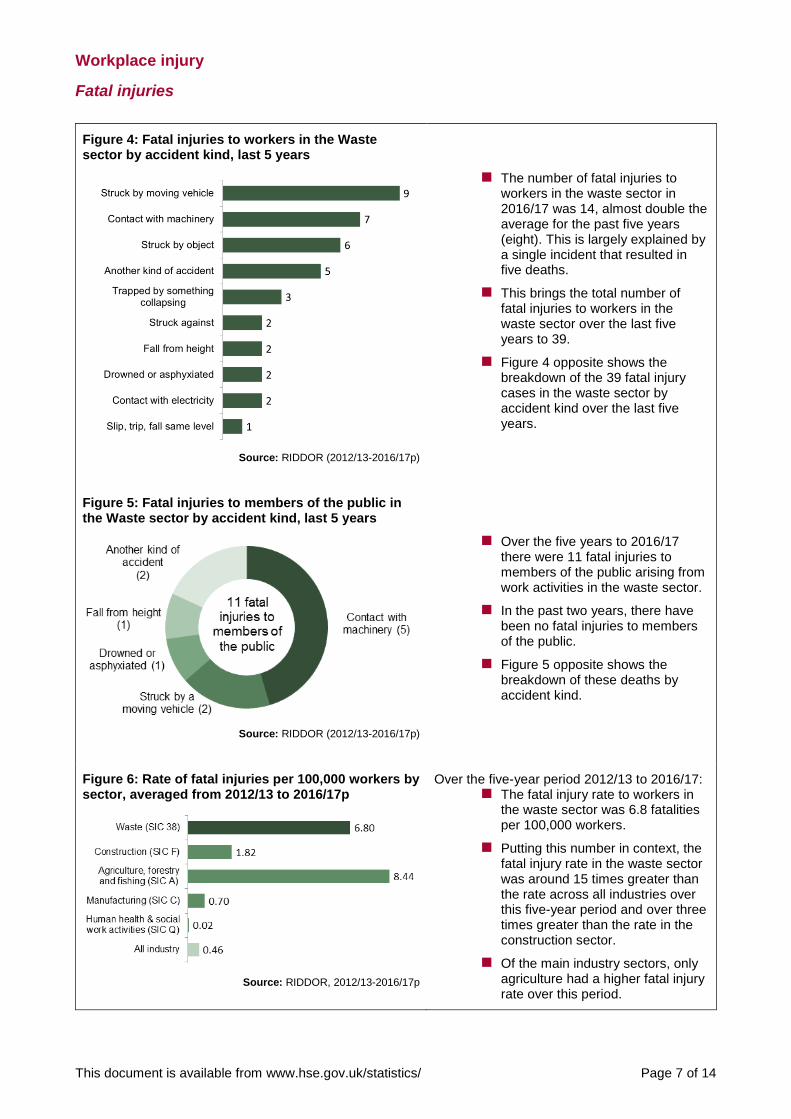
Figure 4: Fatal injuries to workers in the Waste sector by accident kind, last 5 years
Source: RIDDOR (2012/13-2016/17p)
The number of fatal injuries to workers in the waste sector in 2016/17 was 14, almost double the average for the past five years (eight). This is largely explained by a single incident that resulted in five deaths.
This brings the total number of fatal injuries to workers in the waste sector over the last five years to 39.
Figure 4 opposite shows the breakdown of the 39 fatal injury cases in the waste sector by accident kind over the last five years.
Figure 5: Fatal injuries to members of the public in the Waste sector by accident kind, last 5 years
Source: RIDDOR (2012/13-2016/17p)
Over the five years to 2016/17
there were 11 fatal injuries to members of the public arising from work activities in the waste sector.
In the past two years, there have been no fatal injuries to members of the public.
Figure 5 opposite shows the breakdown of these deaths by accident kind.
Figure 6: Rate of fatal injuries per 100,000 workers by sector, averaged from 2012/13 to 2016/17p
Source: RIDDOR, 2012/13-2016/17p
Over the five-year period 2012/13 to 2016/17: The fatal injury rate to workers in
the waste sector was 6.8 fatalities per 100,000 workers.
Putting this number in context, the fatal injury rate in the waste sector was around 15 times greater than the rate across all industries over this five-year period and over three times greater than the rate in the construction sector.
Of the main industry sectors, only agriculture had a higher fatal injury rate over this period.
This document is available from www.hse.gov.uk/statistics/ Page 8 of 14
Non-fatal injuries to workers
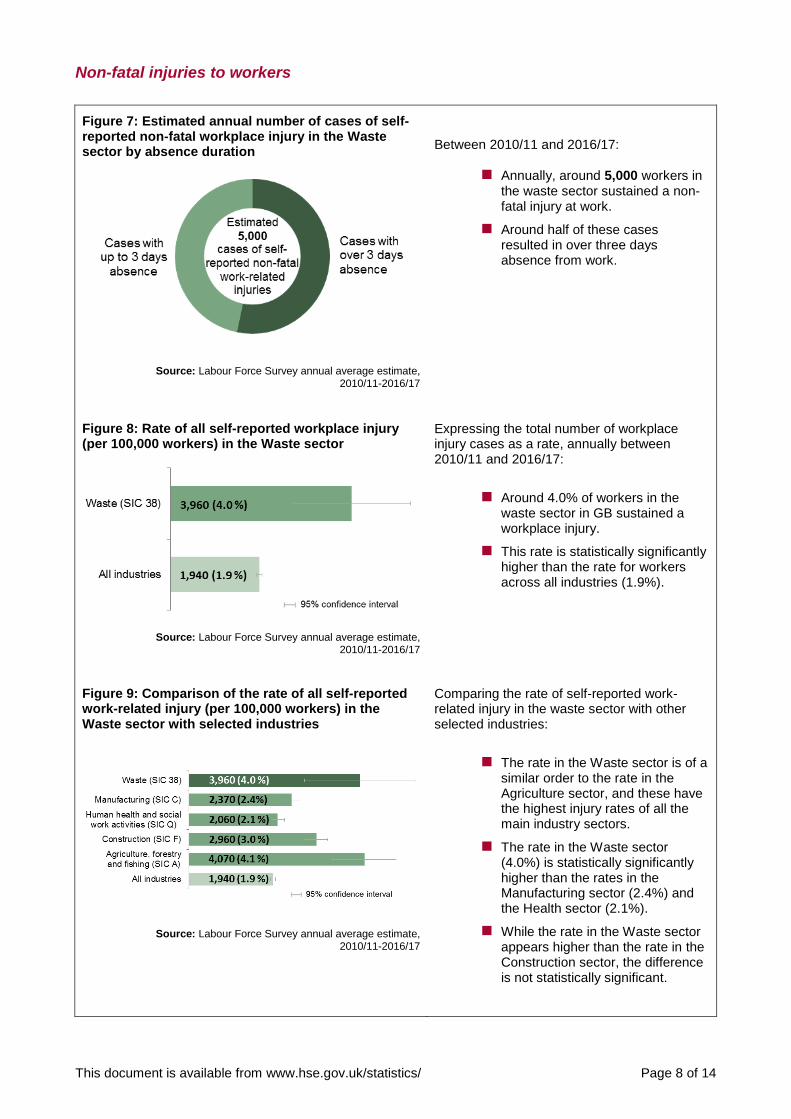
Figure 7: Estimated annual number of cases of self-reported non-fatal workplace injury in the Waste sector by absence duration
Source: Labour Force Survey annual average estimate,
2010/11-2016/17
Between 2010/11 and 2016/17:
Annually, around 5,000 workers in the waste sector sustained a non-fatal injury at work.
Around half of these cases resulted in over three days absence from work.
Figure 8: Rate of all self-reported workplace injury (per 100,000 workers) in the Waste sector
Source: Labour Force Survey annual average estimate, 2010/11-2016/17
Expressing the total number of workplace injury cases as a rate, annually between 2010/11 and 2016/17:
Around 4.0% of workers in the
waste sector in GB sustained a workplace injury.
This rate is statistically significantly higher than the rate for workers across all industries (1.9%).
Figure 9: Comparison of the rate of all self-reported work-related injury (per 100,000 workers) in the Waste sector with selected industries
Source: Labour Force Survey annual average estimate,
2010/11-2016/17
Comparing the rate of self-reported work-related injury in the waste sector with other selected industries:
The rate in the Waste sector is of a
similar order to the rate in the Agriculture sector, and these have the highest injury rates of all the main industry sectors.
The rate in the Waste sector (4.0%) is statistically significantly higher than the rates in the Manufacturing sector (2.4%) and the Health sector (2.1%).
While the rate in the Waste sector appears higher than the rate in the Construction sector, the difference is not statistically significant.

This document is available from www.hse.gov.uk/statistics/ Page 9 of 14
The survey estimates of non-fatal workplace injury numbers presented above give the best indication of the scale of workplace injury within the sector. A further source of intelligence on workplace non-fatal injuries comes from statutory notifications from employers under the ‘Reporting of Injuries, Diseases and Dangerous Occurrence’ regulations (RIDDOR) which requires employers to report certain specified workplace injuries and injuries resulting in more than 7 days absence from work. However, RIDDOR data need to be interpreted with care since it is known that non-fatal injuries are substantially under-reported
5 , especially for
the self-employed. Variations in reporting rates both between industries and over time make such comparisons difficult. However, RIDDOR (as a data source) may sometimes be useful in providing analysis at a detailed level not available through the LFS, mainly around the type of accident itself.
Figure 10: Employer reported non-fatal injuries to employees in the Waste sector
Source: RIDDOR 2016/17p
Provisional figures show 1,859 employer reported non-fatal injuries to employees in the waste sector in 2016/17.
Reported non-fatal injuries are
categorised as either specified (a pre-defined list of certain injury types and includes for example fractures, amputations, serious burns
6) or as resulting in over 7-
days absence from work.
Around a quarter of the injury reports in 2015/16 were for specified injuries.
Figure 11: Employer reported non-fatal injuries to employees in the Waste sector by accident kind
Source: RIDDOR 2016/17p
In 2016/17, about a third of non-fatal accidents were due to slips, trips or falls, and a further third accounted for lifting and handling accidents. This is a similar pattern to earlier years.
Figure 11 shows that there is a marked difference in the accident kind profile between specified injuries and over 7-day injuries. In particular:
Over half of all specified injuries were accounted for by slips, trips and falls (42%) and falls from height (15%).
For over-7-day injuries the proportion of injuries accounted for by these accident kinds were lower (26% and 5% respectively).
5 It is estimated that, across all industries, around a half of all reportable non-fatal injury to employees are actually reported, with the
self-employed reporting a much smaller proportion. 6 For the full list of specified injuries, see www.hse.gov.uk/riddor/reportable-incidents.htm
This document is available from www.hse.gov.uk/statistics/ Page 10 of 14
Enforcement
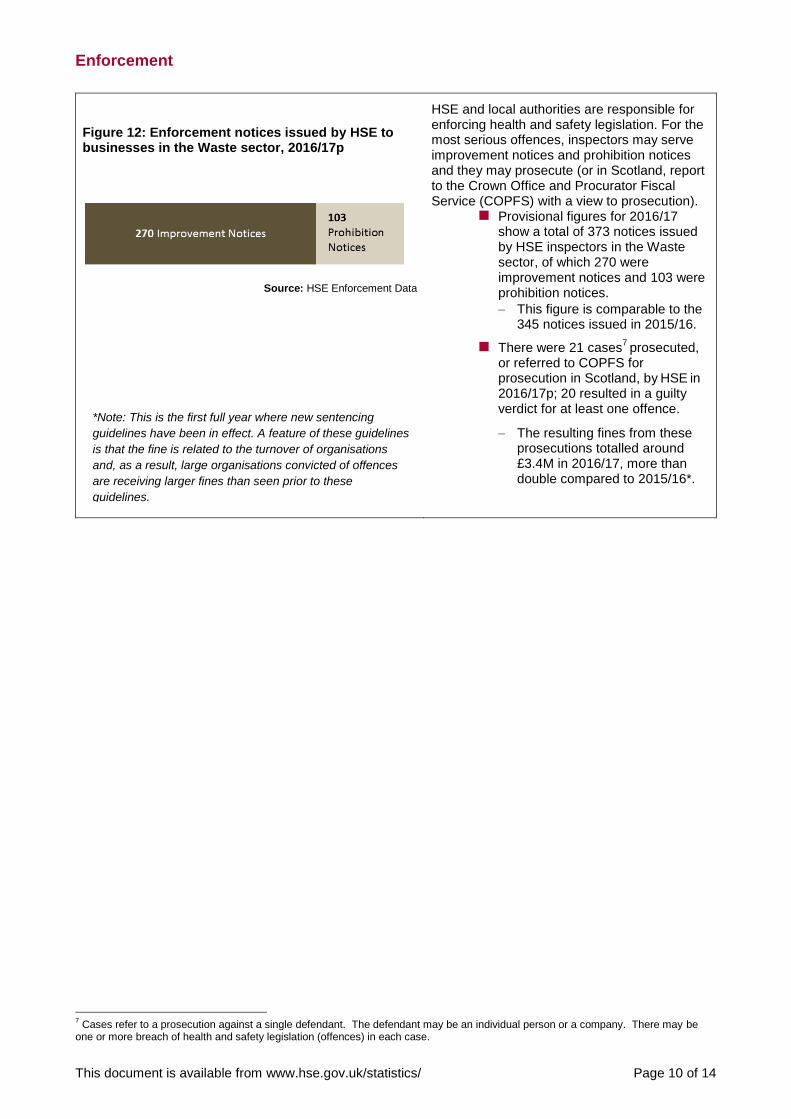
Figure 12: Enforcement notices issued by HSE to businesses in the Waste sector, 2016/17p
Source: HSE Enforcement Data
HSE and local authorities are responsible for enforcing health and safety legislation. For the most serious offences, inspectors may serve improvement notices and prohibition notices and they may prosecute (or in Scotland, report to the Crown Office and Procurator Fiscal Service (COPFS) with a view to prosecution).
Provisional figures for 2016/17 show a total of 373 notices issued by HSE inspectors in the Waste sector, of which 270 were improvement notices and 103 were prohibition notices.
This figure is comparable to the 345 notices issued in 2015/16.
There were 21 cases7 prosecuted,
or referred to COPFS for prosecution in Scotland, by
HSE
in
2016/17p; 20 resulted in a guilty verdict for at least one offence.
The resulting fines from these prosecutions totalled around £3.4M in 2016/17, more than double compared to 2015/16*.
7 Cases refer to a prosecution against a single defendant. The defendant may be an individual person or a company. There may be
one or more breach of health and safety legislation (offences) in each case.
*Note: This is the first full year where new sentencing
guidelines have been in effect. A feature of these guidelines
is that the fine is related to the turnover of organisations
and, as a result, large organisations convicted of offences
are receiving larger fines than seen prior to these
guidelines.
This document is available from www.hse.gov.uk/statistics/ Page 11 of 14
Annex 1: Sources and definitions used
The Labour Force Survey (LFS)
The LFS is a national survey run by the Office for National Statistics of currently around 37,000 households
each quarter. HSE commissions annual questions in the LFS to gain a view of self-reported work-related
illness and workplace injury based on individuals’ perceptions. The analysis and interpretation of these data
are the sole responsibility of HSE.
Self-reported work-related illness: People who have conditions which they think have been caused or made worse by their current or past work, as estimated from the LFS. Estimated total cases include long-standing as well as new cases. New cases consist of those who first became aware of their illness in the last 12 months. Self-reported injuries: Workplace injuries sustained as a result of a non-road traffic accident, as estimated by the LFS.
Specialist physician and general practitioner surveillance schemes (THOR)
Cases of work-related respiratory and skin disease are reported by specialist physicians within The Health
and Occupation Reporting network (THOR) surveillance schemes. RIDDOR The Reporting of Injuries, Diseases and Dangerous Occurrences Regulations (as amended), under which fatal and defined non-fatal injuries to workers and members of the public are reported by employers. Certain types of work-related injury are not reportable under RIDDOR, hence excluded from these figures. Particular exclusions include fatalities and injuries to the armed forces and injuries from work-related road collisions. HSE Enforcement data The main enforcing authorities are HSE and local authorities. In Scotland, HSE and local authorities investigate potential offences but cannot institute legal proceedings and the Crown Office and Procurator Fiscal Service (COPFS) makes the final decision whether to institute legal proceedings and which offences are taken.
Enforcement notices cover improvement, prohibition and deferred prohibition. Offences prosecuted refer to individual breaches of health and safety legislation; a prosecution case may include more than one offence. Where prosecution statistics are allocated against a particular year, unless otherwise stated, the year relates to the date of final hearing with a known outcome. They exclude those cases not completed, for example adjourned.
Rate per 100,000: The number of annual injuries or cases of ill health per 100,000 employees or workers 95% confidence interval: The range of values which we are 95% confident contains the true value, in the absence of bias. This reflects the potential error that results from surveying a sample rather than the entire population Statistical significance: A difference between two sample estimates is described as ‘statistically significant’ if there is a less than 5% chance that it is due to sampling error alone. For more information, see www.hse.gov.uk/statistics/sources.pdf

This document is available from www.hse.gov.uk/statistics/ Page 12 of 14
Annex 2: Data tables Labour Force Survey data presented in this report draws on previously unpublished data since it was necessary to combine seven years’ worth of data together to enable average annual estimates of sufficient reliability. These seven year average data tables are re-produced below. Table 1: Estimated prevalence and rates of self-reported illness caused or made worse by current or most recent job, by industry, for people working in the last 12 months, averaged 2009/10-2011/12, 2013/14- 2016/17 (Source: LFS)
Notes: * Sample numbers too small to provide reliable estimates. Figures in italics are estimates based on fewer than 30 sample cases (or 40 sample costs for days lost estimates). No ill health data collected in 2012/13.

This document is available from www.hse.gov.uk/statistics/ Page 13 of 14
Table 2: Estimated incidence and rates of self-reported workplace non-fatal injury sustained in current or most recent job, by industry, for people working in the last 12 months, averaged 2010/11-2016/17 (Source: LFS)
Notes: * Sample numbers too small to provide reliable estimates. Figures in italics are estimates based on fewer than 30 sample cases (or 40 sample costs for days lost estimates). No ill health data collected in 2012/13.
RIDDOR data published in this report can mostly be found at: www.hse.gov.uk/statistics/tables

© Crown copyright If you wish to reuse this information visit www.hse.gov.uk/copyright.htm for details.
First published 11/17.
Published by the Health and Safety Executive V1 11/17
National Statistics
National Statistics status means that official statistics meet the highest standards of trustworthiness, quality and public value.
All official statistics should comply with the Code of Practice for Official Statistics. They are awarded National Statistics status following an assessment by the Authority’s regulatory arm. The Authority considers whether the statistics meet the highest standards of Code compliance, including the value they add to public decisions and debate.
It is Health and Safety Executive’s responsibility to maintain compliance with the standards expected by National Statistics. If we become concerned about whether these statistics are still meeting the appropriate standards, we will discuss any concerns with the Authority promptly. National Statistics status can be removed at any point when the highest standards are not maintained, and reinstated when standards are restored.
An account of how the figures are used for statistical purposes can be found at www.hse.gov.uk/statistics/sources.htm .
For information regarding the quality guidelines used for statistics within HSE see www.hse.gov.uk/statistics/about/quality-guidelines.htm
A revisions policy and log can be seen at www.hse.gov.uk/statistics/about/revisions/
Additional data tables can be found at www.hse.gov.uk/statistics/tables/.
Last updated: November 2017
Next update: October 2018
General enquiries: Statistician [email protected]
Journalists/media enquiries only: www.hse.gov.uk/contact/contact.htm