health and nutrition effects of cash crop production in developing countries: a comparative analysis
TRANSCRIPT

Sot. Sci. Med. Vol. 35, No. 5, pp. 689497, 1992 0277-9536/92 $5.00 + 0.00 Printed in Great Britain Pergamon Press Ltd
HEALTH AND NUTRITION EFFECTS OF CASH CROP PRODUCTION IN DEVELOPING COUNTRIES:
A COMPARATIVE ANALYSIS
EILEEN KENNEDY, HOWARTH BOUIS and JOACHIM VON BRAUN
Food Consumption and Nutrition Division, International Food Policy Research Institute, 1776 Massachusetts Avenue, NW, Washington, DC 20036, U.S.A.
Abstract-The paper presents results of a comparative analysis of the health and nutritional effects of cash crop production in 6 countries-The Gambia, Guatemala, Kenya, Malawi, the Philippines, and Rwanda. The 6 country case studies were conducted during the same time period and used a similar, although not identical, research protocol. Participation in cash crop schemes resulted in increases in household income. Short-term increases in household income did not result in a decrease in the incidence of illness in preschool-aged children nor in the total time that preschoolers were ill. Increases in household income did result in increases in the preschooler’s energy consumption; however, the income/calorie consumption links, although significant, were weak. The household income gains did not have an immediate or large impact on preschooler nutritional status. While, in the longer term, increases in income may bring about improvements in preschooler health, in the short term, it appears that increases in income must be accompanied by improvements in the health environment in order to have a significant effect in reducing preschooler morbidity and improving child nutritional status.
Key words--cash crop, nutritional status, morbidity, preschoolers
INTRODUCTION
The impact of cash crop production on child health and nutrition is one of the more controversial issues in debates on agricultural and food policy in develop- ing countries. Some studies have found that, as households move from subsistence food production to the production of crops for sale in both domestic and export markets, the health and nutritional well- being of preschoolers declines [ 141. Meanwhile, other studies have found a neutral or even a positive link between cash crop production and preschooler health and nutrition [S-lo].
Reasons given for the reported negative impact of cash crop production include reductions in household production of food crops; increased food prices; loss of household access to land due to changing tenure relations; household expenditure patterns favoring durable consumer goods, or greater diversity in foods eaten rather than more calories per se; biases against children in the distribution of calories within households; and in- creases in women’s time allocated to crop production, at the expense of time in child care and food preparation.
The positive effects of commercial agriculture ap- pear strong where the shift to cash crops is associated with increases in women’s incomes and greater com- munity investment in health and social services [ll, 121.
Cash cropping schemes are designed to generate higher incomes for participating households. How- ever, few studies have provided detailed, empirical
evidence on the processes through which increases in income from cash crop production affect the health and nutritional status of preschool children. That income-mediated effect can be achieved in two ways. First, by increasing expenditures on health-related goods and services, increased incomes can reduce child morbidity, improving nutritional status as a result. For example, expenditures on more sanitary housing or improved water sources via construction of rain vats can decrease certain types of illness. Similarly, expenditures on immunizations and de- worming can lead to direct health benefits. Second, higher incomes can lead to reduced activity levels and greater household expenditures on food, producing higher individual nutrient intakes and improved nu- tritional status directly, or indirectly through better maternal nutrition during pregnancy and lactation. Improved nutritional status, in turn, leads to better health.
Using data from case studies of cash cropping schemes in 6 countries-The Gambia, Kenya, Malawi, the Philippines, Rwanda, and Guatemala [ 13-16]-this paper provides a comparative analysis of the processes through which income from cash crop production affects the health and nutritional status of preschool-aged children (less than 6 years). The analysis attempts to identify the key factors that influence child welfare in both the short and the long term. In doing so, the analysis presented should assist policymakers in the design of more appropriate cash cropping projects and policies to ensure improve- ments in preschooler health and nutrition along with growth in household incomes.
689

690 EILEEN KENNEDY et al
STUDY SITES
The 6 study sites were selected to reflect diversity in geographical area as well as diversity in the type of cash crop examined. The Gambia case study evaluated the effects of the Jahally-Pacharr irrigated smallholder rice project. The study area was located 300 km east of Banjul on the south bank of the River Gambia. The main subsistence crops in the area were millet, sorghum, and rice. The effects of the new rice cultivation under modern irrigation were compared to the subsistence crops. A total of 214 sample households were surveyed twice in the period 1984/1985.
The Guatemala case study focused on the effects of cultivation of nontraditional vegetable export crops for farmers participating in the Cuatro Pinos farmers cooperative located in the Western High- lands of the country. The population in the study area is mostly of indigenous origin (Maya). The area had traditionally grown maize and beans which was now being replaced by snow peas, cauliflower, and, to a lesser extent, other vegetables. Two surveys were conducted in 1983 and 1985 involving 399
households. The Kenya research was conducted in South
Nyanza District in the southwestern part of the country. The study site was undergoing a transition from maize to sugarcane production with most of the sugarcane produced by 6000 smallholders under contract to a government owned factory. The study conducted from June 1984 to March 1987 included 617 households interviewed up to 8 times during the survey period.
The Philippines site was also an area undergoing a transition from maize to sugarcane cultivation and was located in the southern island of Mindanao in Bukidnon province. Although most of the sugarcane supplied to the Bukidnon Sugar Company was provided from haciendas, a large majority of sugar- cane-producing farms were smallholders. The research conducted in 1984/1985 included a sample of 448 smallholder and landless laborer households interviewed 4 times at 4-month intervals.
The Malawi research was conducted in the southern part of the country in the Zomba area. The study site was involved in maize and tobacco cultiva- tion. The research was conducted in 1986/1987 in 6 villages with a sample of 208 households.
Although the 6 study sites were diverse as far as cash crop of interest and the geographical location, there were some commonalities. All of the areas were experiencing rapid commercialization of semi- subsistence agriculture and therefore the studies were able to evaluate the process of commercialization as well as the health and nutrition effects. The cash crop cultivation in each of the study sites was primarily done by smallholders; the sample house- holds in each of these locations is representative of both cash cropping and noncash cropping farm
households. Finally, in each of the study locations, preschooler malnutrition levels were high; in most study locations, 2&40% of the preschooolers were moderately and severely malnourished (based on weight-for-age).
METHODS
The survey protocols used for the study, although similar, are not identical. Figure 1 provides a sche- matic representation of the conceptualization that was used to guide the design of the individual studies. Given the range of effects that had been attributed to the commercialization of agriculture from prior stud- ies, it was important to trace the linkages between entry into cash crop production, household level effects, and, ultimately, the impacts on child health and nutritional status [l-6]. At the household level, there were three main pathways through which com- mercial agriculture were hypothesized to influence household income and food consumption; these in- cluded the effect of cash cropping on household agricultural production, the demand for hired labor and the impact on household allocation of time, and other resources. These household-level effects trans- lated into effects for the individual preschooler’s nutritional status primarily through the impacts on the preschooler caloric consumption, weaning pat- terns, and morbidity. Therefore, the survey protocols for each of the 6 case studies were designed to provide information on each of these key linkages.
The survey protocols used for the case studies, although similar, are not identical in that the specific approaches used were tailored somewhat to reflect the local context. However, a comparative analysis of the 6 case studies was envisioned from the inception of this research and, therefore, each of the studies was designed so that certain information would be avail- able from the individual surveys. This information included household income by source, household expenditure patterns, household energy consumption and/or preschooler caloric consumption, weaning and child-feeding patterns, and preschooler morbid- ity and nutritional status. Although the specific methods used are described in detail in the individual study reports, a brief description of the types of methods used is provided below [7-IO, 14, 151.
A variety of techniques were used to collect data at the community, household, and individual levels. Food and nonfood price data were collected through- out the survey period by locally recruited and trained enumerators. These price data were supplemented by information on food and nonfood expenditures col- lected from a 7-day recall on purchases and food used from household supplies. Data on income by sources and by earners were collected either bimonthly or quarterly throughout the survey.
Agricultural production data. including labor and other inputs by crop, were collected using recall techniques.

Cash crop production in developing countries
I
691
Household factors
- Agricultural production
Cash crop production
1
Demand for labor Household allocation of time
Women’s time
Household food intake
Household income
I T
Cash in-kind c Women-controlled income
--I Individual factors
weight
Child’s caloric intake
\
Time devoted to child care
1 1 i
Child growth * + Morbidity patterns of child
Mortality
Fig. 1. Some linkages between cash crop production and nutritional status at household and intrahouse- hold levels.
Recall methods were used to solicit information on women’s reproductive history; time allocation pat- terns for women were assessed using a 24-hr recall of the prior day’s activities, solicited at least four times during the study.
Household food consumption and nutrient calcu- lations in the Philippines and Kenya are based on a 24-hr recall method collected four times over the survey period; in addition, household caloric availability was also calculated by deriving energy consumption from a 7-day period food expenditure recall questionnaire. In both Kenya and the Philippines, energy consump- tion of the preschool-aged child was derived from the 24-hr recall of prior day’s food consumption as reported by the primary caretaker (usually the mother), collected 4 times during the survey.
In Malawi, the household and individual food consumption was based on a weighed food intake conducted by the enumerator during a 12-hr period in which they were present in the household.
In Guatemala, information on household energy consumption only is available, based on a 7-day recall of food use for consumption from purchased and from own produced supplies. For The Gambia and Rwanda, the household energy consumption information is based on day-by-day recalls over 7 days of household food consumed and additional ‘snack-food’ surveys with individual mothers and their children.
Morbidity information for women and children was derived by recall. The period of recall for the morbidity questionnaire varied. The Kenya, Malawi and the Philippines case studies used a 2-week recall of illness. The Gambia and Rwanda studies used a l-month morbidity recall and, in the case of Rwanda, a l-week recall in addition, in order to check on recall-period-dependent differences in morbidity data. For the purpose of the analysis below, the l-month recall data are used. The Guatemala study included information only on the incidence of illness.
692 EILEEN KENNEDY et al.
There is a concern that the quality of recall infor- mation deteriorates as the length of the recall period increases. This is not confirmed in the Rwanda case in comparing l-week recall data to the l-month recall morbidity data. However, in the analyses pre- sented, emphasis is placed on a comparison of cash cropping and noncash cropping households in the same study sites using the same method. Whatever bias is contained in the survey instruments is assumed to be similar for the cash cropping and non cash cropping samples.
Information was collected on specific symptoms of illness, including fever and diarrhea. Diarrhea was defined as 4 or more loose stools present in a 24-hr period.
Weights and lengths for preschoolers were measured directly as were the weights and heights of women within the household.
Preschooler feeding and weaning patterns were solicited by recall of the mother.
Ordinary least squares are used for the regression equations.
RESULTS
Incomes
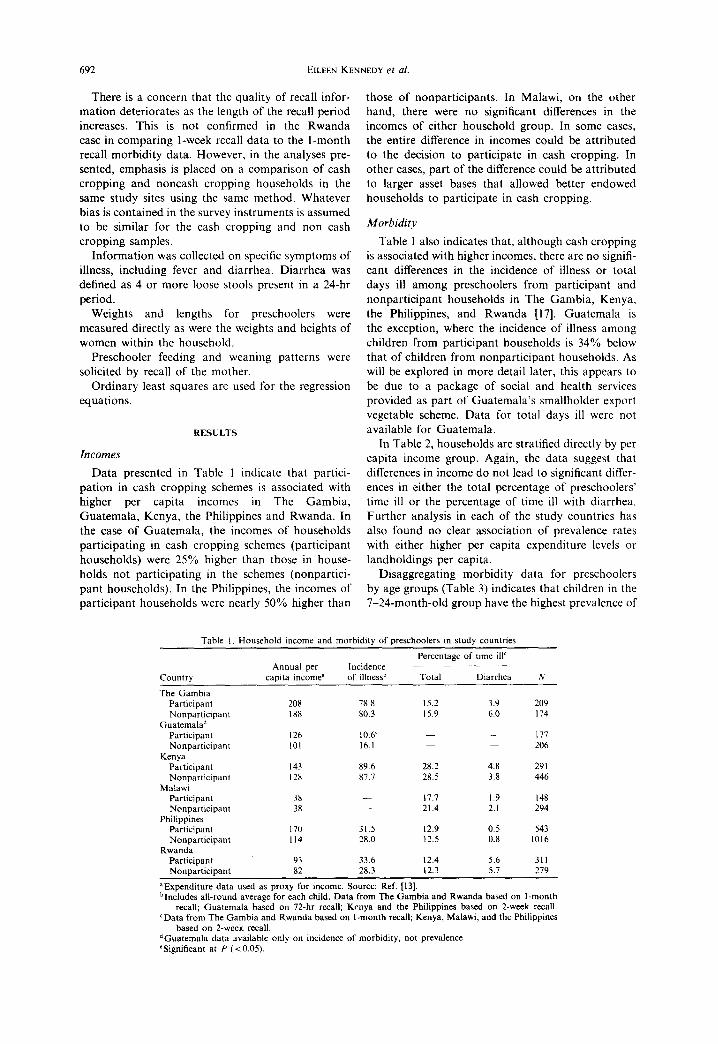
Data presented in Table 1 indicate that partici- pation in cash cropping schemes is associated with higher per capita incomes in The Gambia, Guatemala, Kenya, the Philippines and Rwanda. In the case of Guatemala, the incomes of households participating in cash cropping schemes (participant households) were 25% higher than those in house- holds not participating in the schemes (nonpartici- pant households). In the Philippines, the incomes of participant households were nearly 50% higher than
those of nonparticipants. In Malawi, on the other hand, there were no significant differences in the incomes of either household group. In some cases, the entire difference in incomes could be attributed to the decision to participate in cash cropping. In other cases, part of the difference could be attributed to larger asset bases that allowed better endowed households to participate in cash cropping.
Morbidity
Table 1 also indicates that, although cash cropping is associated with higher incomes, there are no signifi- cant differences in the incidence of illness or total days ill among preschoolers from participant and nonparticipant households in The Gambia, Kenya, the Philippines, and Rwanda [17]. Guatemala is the exception, where the incidence of illness among children from participant households is 34% below that of children from nonparticipant households. As will be explored in more detail later, this appears to be due to a package of social and health services provided as part of Guatemala’s smallholder export vegetable scheme. Data for total days ill were not available for Guatemala.
In Table 2, households are stratified directly by per capita income group. Again, the data suggest that differences in income do not lead to significant differ- ences in either the total percentage of preschoolers’ time ill or the percentage of time ill with diarrhea. Further analysis in each of the study countries has also found no clear association of prevalence rates with either higher per capita expenditure levels or landholdings per capita.
Disaggregating morbidity data for preschoolers by age groups (Table 3) indicates that children in the 7-24-month-old group have the highest prevalence of
Table I, Household income and morbtdi:v of Dreschoolers in study countries
Country
The Gambia Participant Nonparticipant
Guatemalad Participant Nonparticipant
Kenya Participant Nonparticipant
Malaw Participant Nonparticipant
Philippines Participant Nonparticipant
Rwanda Participant Nonoarticioant
Annual per capita income”
208 I88
126 101
143 I28
38 38
170 II4
93 82
Incidence of illnessb
78.8 80.3
10.6’ 16.1
89.6 87.7
31.5 28.0
33.6 28.3
Percentage of time ill’ _____
Total Diarrhea N
15.2 3.9 209 15.9 6.0 174
177 206
28.2 4.8 291 28.5 3.8 446
17.7 I.9 I48 21.4 2.1 294
12.9 0.5 543 12.5 0.8 1016
12.4 5.6 311 12.3 5.7 279
“Expenditure data used as proxy for income. Source: Ref. [l3]. bIncludes all-round average for each child. Data from The Gambia and Rwanda based on l-month
recall; Guatemala based on 72-hr recall; Kenya and the Philippines based on 2-week recall. CData from The Gambia and Rwanda based on I-month recall; Kenya, Malawi, and the Philippines
based on 2-week recall. dGuatemala data available only on incidence of morbidity, not prevalence. eSignificant at P (CO.05).

Cash crop production in developing countries 693
Table 2. Percentage of time ill, total illness, and diarrhea among Table 3. Percentage of preschoolers’ total time ill, by age of child, preschoolers, by per capita income tercile by scheme participants and nonparticipants
Total illness Diarrhea CL-6 7-24 25-36 3748 49-72 Country Income tercile (%) (%) N Country months months months months months
The Gambia 1 16.9 5.4 120 Gambia 2 16.0 5.0 145 Participant 14.4 20.9 16.7 12.5 12.1 3 13.3 4.1 118 Nonparticipant 15.1 27.0 17.0 9.1 8.8
Kenya I 27.1 4.0 531 Kenya 2 28.7 4.0 421 Participant 28.6 31.7 26.5 27.3 26.3 3 29.5 4.3 456 Nonparticipant 25.5 35.6 26.8 24.5 26.3
Malawi 1 20.4 1.4 152 Malawi 2 19.6 2.3 152 Participant 17.2 23.6 19.4 16.5 13.9 3 20.6 2.5 138 Nonparticipant 28.0 25.8 22.8 18.9 13.9
Philippines 1 12.6 0.8 512 Philippines 2 13.0 0.8 520 Participant 23.3 16.8 13.0 11.8 9.1 3 12.2 0.6 527 Nonparticipant 6.1 19.1 12.9 9.3 10.0
Rwanda I 13.9 7.1 213 Rwanda 2 9.9 4.8 199 Participant 19.2 11.7 7.8 8.0 3 13.3 4.7 178 Nonparticipant - 15.6 12.2 13.6 9.6
disease. This finding may be attributed to the poor weaning practices which normally begin with children in this age group. Even where breast milk substitutes are nutritionally comparable, their preparation often introduce new pathogens into the child’s diet. The increasing mobility of children in this age group may also expose them to other new sources of illness. Again, however, the data indicate no definite pattern of morbidity between participant and nonparticipant preschoolers in each age group.
is not a significant determinant of the incidence of
illness, the participation dummy in Guatemala could be interpreted to mean that the health and social component provided services that reduced morbidity in a non-income mediated manner. However, it should be emphasized that this health/social welfare component was provided by income generated from the cash cropping cooperative and, therefore, the availability of this service is indirectly income-related.
Results from the multivariate analysis of morbidity presented in Table 4 reinforce the finding that income is not associated with preschooler morbidity. The regression coefficient for income is not significant as evaluated at the (P < 0.05) level in any of the 6 country studies [18]. The separate scheme partici- pation dummy variable included in the morbidity model also suggests no negative effect of participation in cash cropping schemes on child health. The partici- pation coefficient was not significant in any of the cases, with the exception of Guatemala, where the impact of participation in cash cropping schemes on child health is significant and reduces morbidity. Guatemala is the only one of the present 6 case studies which had a social service/health component as part of the cash cropping scheme. Since income
Multivariate analysis again shows child age to be a significant determinant of illness, reinforcing the results in Table 3. In all countries except Guatemala, as children get older, they are less likely to be sick [19]. Mother’s schooling had no significant influence on preschooler morbidity; however, that result may be due more to the fact that education levels for women in each study country, except the Philippines, were invariably low. Higher levels of education, providing more variation in the data, could result in a more significant, positive effect on child health.
Nutritional status
Critics of cash cropping schemes often argue that increases in a mother’s labor allocated to cash crop production can lead to the early weaning of children and/or the early introduction of solid foods, limiting
Table 4. Selected coefficients for relationship between program participation, socioeconomic variables, and preschooler’s morbidity (all preschoolers)
Preschoolers’ total time ill Independent variable The Gambia Guatemala Kenya Malawi Philippines Rwanda
Household incomeb -6.0&05’ -0.2M4 - 1.60-05 6.89-03 7.ltI-04 I.1843 -0.899d (-0.87) (-0.20) (0.50) (1.67) (1.60)
Mother’s schooling NA NA -0.25 - 8.8&04 -2.28-03 -0.59 (- 1.18) ( - 0.04) (1;:;;) (-1.27)
Age of child (in months) -2.5&03 -0.5144 -0.16 -0.20 -0.21 (- 6.42) (-0.073) (-4.52) (-5.41) (-7.21) ( - 4.00)
Household size -0.36 5.8845 - 2.05 (2.35) (0.0) (-0.98) 1
Participation dummy (I = participant) 5.3143 -0.432 0.29 1.80 3.22 4.1 (0.33) (-2.86) (0.20) (1.33) (0.29) (1.73)
Sample size 561 477 994 425 626 585
sEquals all-round average for total time ill, except for Guatemala, where analysis is based on a probit analysis of incidence of illness. “Total household expenditures used as a proxy for income for The Gambia, Guatemala, the Philippines, and Rwanda. cRegression coefficients from ordinary least squares regression. “Numbers in parentheses are t-statistics. NA = not available.

694 EILEEN KENNEDY et al
Table 5. Child age at weaning and first introduction of solid foods
Age weaned” Age solid Country (age in months) food introduced”
The Gambia Participants 4.5 Nonparticipants 4.1
Guatemala Participants 16.2 Nonparticipants 16.2
Kenya Participants 19.1 5.6 Nonparticipants 20.2 6.0
Philippines Participants 14.2 5.5 Nonparticipants 13.7 4.x
Rwanda Participants 23.5 1.2 Nonparticipants 21.2 6.6
‘Average age in months when mother stopped breast-feeding com- pletely. If never breast-fed. age weaned = 0.
“Age in months when child was given any food other than breast milk.
the growth of children in participant households [4]. To the contrary, the data in Table 5 show no significant differences in weaning age between partici- pant and nonparticipant households. In all case studies, breast-feeding occurs for an extended period. with the average age weaned ranging from 14 to 24 months. The age at which the first solid foods are introduced also does not differ between children in participant and nonparticipant households. With the exception of the Rwanda case, children in all the study countries receive solids within the normally recommended 4-6-month time period [20].
Anthropometric indicators of preschooler nutri- tional status-such as Z-scores for height/age, weight/age, and weight/height measurements [21]- show no significant difference, on average, for preschoolers from participant and nonparticipant households (Table 6). Z-Scores stratified by per capita income terciles also show no significant differ- ence in nutritional status between children in the lowest and highest income groups (Table 7). How- ever, there is a tendency for children in the upper
Table 6. Z-scores for preschooler height/age, weight/age, and weight/height (all-round average)
All-round average .___
Country Height/age Weight/age Weight/height
The Gambia Participants -1.11 -1.16 -0.60 Nonparticipants - 1.30 - 1.33 -0.68
Guatemala Participants -2.84 - I .66 0.21 Nonparticipants ~ 3.00 - 1.74 0.22
Kenya Participants ~ I .6S -1.13 -0.16 NonpartIcipants - 1.73 -1.11 -0.09
Malawi Participants -2 25 -I 45 -0.06 Nonparticipants -2.24 ~ 1.43 - 0.05
Philippmes Participants -2.01 - I.51 -0.63 Nonparticipants -2.12 - I.55 -0.61
Rwanda Participants ~ I .33 -0.58 0.25 Nonparticipants ~ I.66 -0.72 0.27
“These are means of two surveys, one conducted during season of scarcity (February), the other after the harvest (July).
income tercile to have a better Z-score than children in the bottom tercile. This is true for both participant and nonparticipant households for each of the three indicators. Stratification of households by expendi- ture and landholding terciles again showed no signifi- cant differences in the nutritional status of children between household groups [22].
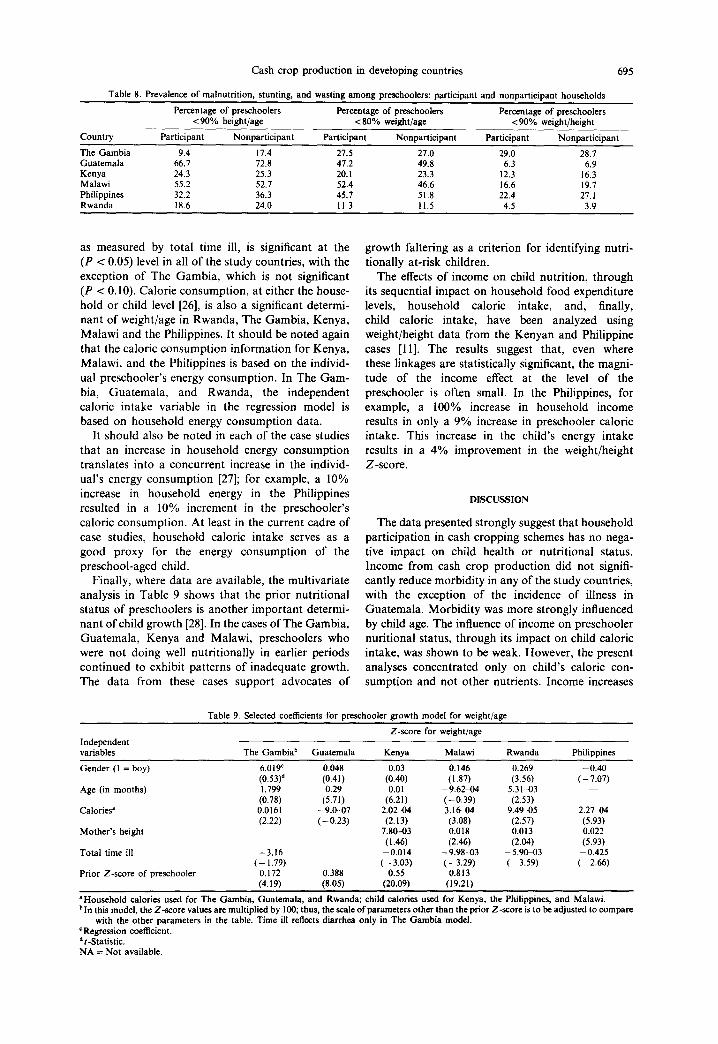
With the exception of The Gambia case, prevalence rates of stunting [23], wasting [24], and weight/age less than 80% of standard also show no significant differences between participants and nonparticipants (Table 8). However, in The Gambia, preschoolers from the participant households are less stunted than nonparticipant households. Among preschoolers in both groups in The Gambia, there is generally more wasting than stunting when compared to the other study countries.
Table 9 presents a multivariate analysis of preschooler growth using weight/age as the depen- dent variable [25]. The coefficient for child morbidity,
Table 7. Z-scores (preschooler height/age) by income tercile: partiapant and nonparticipant households
Country
The Gambia
Guatemala
Kenya
Malawi
Philippines
Rwanda
Participants Nonparticipants Income per ~~ ~~ ~~~ ~~~~ ~~ ~~~ ~~
capita tercile Mean Z-score N Mean Z-score iv
I - 1.05 35 - 1.64 43 2 -1.31 61 - I .23 36 3 -0.86 42 -0.9x 36 I -2.93 178 ~ 3.02 130 2 - 2.88 178 -3.15 I31 3 -2.68 146 - 2.75 92 I - I .46 95 ~ I .73 194 2 -1.54 83 - I.58 156 3 - I .63 107 - 1.87 81 I -2.24 35 -2.26 I17 2 -2.62 56 - 2.45 96 3 - 1.90 57 - I .96 XI I -2.23 I25 -2.18 371 2 -2.22 I57 -2.11 356 3 - 1.77 255 -2.06 257 I - 1.59 90 - 1.61 I50 2 - 1.26 126 -1.54 II7 3 -1.23 I38 - 1.97 69
Cash crop production in developing countries 695
Table 8. Prevalence of malnutrition, stunting, and wasting among preschoolers: participant and nonparticipant households
Percentage of preschoolers Percentage of preschoolers Percentage of preschoolers < 90% height/age < 80% weight/age ~90% weight/height
Country Participant Nonparticipant Participant Nonparticipant Participant Nonparticipant
The Gambia 9.4 17.4 27.5 27.0 29.0 28.7 Guatemala 66.7 72.8 47.2 49.8 6.3 6.9 Kenya 24.3 25.3 20. I 23.3 12.3 16.3 Malawi 55.2 52.7 52.4 46.6 16.6 19.7 Philippines 32.2 36.3 45.7 51.8 22.4 27.1 Rwanda 18.6 24.0 11.3 11.5 4.5 3.9
as measured by total time ill, is significant at the (P < 0.05) level in all of the study countries, with the exception of The Gambia, which is not significant (P < 0.10). Calorie consumption, at either the house- hold or child level [26], is also a significant determi- nant of weight/age in Rwanda, The Gambia, Kenya, Malawi and the Philippines. It should be noted again that the caloric consumption information for Kenya, Malawi, and the Philippines is based on the individ- ual preschooler’s energy consumption. In The Gam- bia, Guatemala, and Rwanda, the independent caloric intake variable in the regression model is based on household energy consumption data.
It should also be noted in each of the case studies that an increase in household energy consumption translates into a concurrent increase in the individ- ual’s energy consumption [27]; for example, a 10% increase in household energy in the Philippines resulted in a 10% increment in the preschooler’s caloric consumption. At least in the current cadre of case studies, household caloric intake serves as a good proxy for the energy consumption of the preschool-aged child.
Finally, where data are available, the multivariate analysis in Table 9 shows that the prior nutritional status of preschoolers is another important determi- nant of child growth [28]. In the cases of The Gambia, Guatemala, Kenya and Malawi, preschoolers who were not doing well nutritionally in earlier periods continued to exhibit patterns of inadequate growth. The data from these cases support advocates of
growth faltering as a criterion for identifying nutri- tionally at-risk children.
The effects of income on child nutrition, through its sequential impact on household food expenditure levels, household caloric intake, and, finally, child caloric intake, have been analyzed using weight/height data from the Kenyan and Philippine cases [ll]. The results suggest that, even where these linkages are statistically significant, the magni- tude of the income effect at the level of the preschooler is often small. In the Philippines, for example, a 100% increase in household income results in only a 9% increase in preschooler caloric intake. This increase in the child’s energy intake results in a 4% improvement in the weight/height Z-score.
DISCUSSION
The data presented strongly suggest that household participation in cash cropping schemes has no nega- tive impact on child health or nutritional status. Income from cash crop production did not signifi- cantly reduce morbidity in any of the study countries, with the exception of the incidence of illness in Guatemala. Morbidity was more strongly influenced by child age. The influence of income on preschooler nuritional status, through its impact on child caloric intake, was shown to be weak. However, the present analyses concentrated only on child’s caloric con- sumption and not other nutrients. Income increases
Independent variables
Table 9. Selected coefficients for preschooler growth model for weight/age
Z-score for weight/age
The Gambiab Guatemala Kenya Malawi Rwanda Philiooines
Gender (I = boy) 6.019’ 0.048 0.03 0.146 0.269 -0.40 (0.53)d (0.41) (0.40) (1.87) (3.56) ( - 7.07)
Age (in months) 1.799 0.29 0.01 -9.62+4 5.31-03 (0.78) (5.71) (6.21) (-0.39) (2.53)
Calories’ 0.0161 -9.0-07 2.02-04 3.16-04 9.4W-05 2.2744 (2.22) (-0.23) (2.13) (3.08) (2.57) (5.93)
Mother’s height 7.80-03 0.018 0.013 0.022 (1.46) (2.46) (2.04) (5.93)
Total time ill -3.16 -0.014 -9.98-03 - 5.9W3 -0.425 (-1.79) (-3.03) (- 3.29) (- 3.59) (-2.66)
Prior Z-score of preschooler 0.172 0.388 0.55 0.813 (4.19) (8.05) (20.09) (19.21)
‘Household calories used for The Gambia, Guatemala, and Rwanda; child calories used for Kenya, the Philippines, and Malawi. bin this model, the Z-score values are multiplied by 100; thus, the scale of parameters other than the prior Z-score is to be adjusted to compare
with the other parameters in the table. Time ill reflects diarrhea only in The Gambia model. ‘Regression coefficient. *r-Statistic. NA = Not available.

696 EILEEN KENNEDY et al.
could influence diet quality--either positively or negatively-which, in turn, could offset nutritional status. There were no apparent negative effects of cash crop participation on child feeding practices in any of the study countries. Morbidity, caloric intake levels, and prior nutritional status were particularly important determinants of the current nutritional status of preschoolers.
It may seem counterintuitive that increases in income from participation in cash cropping schemes have not been found to improve preschooler health directly. As incomes rise in developing countries, there is a general tendency for households to spend a slightly higher proportion of their incomes on nonfood items, including health-related goods and services [29]. Although households did spend incre- mental income on food, they tended to buy more expensive sources of calories.
Using data from the current case studies, Bouis [27] found that household expenditure on health-related items, such as health care, education, and housing, increases with incomes in all study countries as well. Households tended to spend more of their additional incomes on housing than on health and education. However, the share of total budget expenditure on these items remains quite small; in no country did expenditures on either health care, education, or housing, on average, exceed 3% of the total average household budget.
In addition, while some types of health-oriented expenditures produce short-term returns, such as money spent on deworming or other preventative health items, other expenditures may produce effects that influence health only in the long term. Increased expenditures on the education of girls, for example, may ultimately result in changes in fertility patterns, affecting neonatal outcome and, ultimately, infant health. Investment in housing may also provide simi- lar long-term health benefits. These long-term effects of increased incomes on health, while potentially important, could not be identified in the current analysis because of the relatively short time frame of each of the case studies presented.
At each of the study sites, the health and sanitation environment is poor, and infant mortality and malnu- trition rates are high. While, in the longer term, increases in income may bring about improvements in preschooler health, in the short-term, it appears that increases in income must be accompanied by improvements in the health environment in order to have a significant effect on preschooler morbidity. While incomes are important. there are complemen- tarities between increased incomes and an improved health environment which should be stressed to maxi- mize the impact of cash cropping schemes on overall welfare.
In the Guatemala cash cropping example, where planners included a program of investment in com- munity health and social services out of the coopera- tive scheme’s profits, the lower incidence of morbidity
associated with participation in cash cropping schemes may be indicative of those complementari- ties. To emphasize again, Guatemala was the only study site where there was a significantly lower incidence of morbidity in cash cropping households.
The effect of cash crop production on preschooler growth has been found to be weak in terms of the linkages between income and caloric consumption. The data from the case studies provide no ready explanation for that result. One plausible explanation is that, because malnutrition is endemic in each of the study countries, households may fail to recognize nutritional problems in their children since they appear similar to other children in the community. Even where income is not a constraint, if primary caretakers have no perception of nutritional need, they would be unlikely to allocate more food to their children.
Data for older children between the ages of 6 and 10 years, obtained in the cases of The Gambia and Guatemala, indicate that increases in household caloric intake have a positive impact on the growth of these older children [7. 141. In addition, in younger children, who have been shown to have a greater total time ill, repeated bouts of illness will lead to more anorexia. If chronically sick preschoolers feel satiated before their ‘true‘ caloric needs have been met, house- holds again might not perceive the children’s ad- ditional food needs. Clearly what is needed in this situation is additional calories, and more impor- tantly, extra protein consumption to facilitate ‘catch up’ growth in the preschoolers. Older children are
both less likely to become ill and are more able to rely on themselves to achieve their food needs.
The cash cropping schemes studied here have been shown to lead to higher household incomes. While the results of those income gains do not have an immediate or large impact on preschooler health and nutrition, neither do they have a negative impact. Their long-term implications may be more beneficial. On the other hand, the analysis above identifies other factors that have a more immediate impact on preschooler health and nutrition. Gains in health and nutrition may be obtained in the short term through investment in community health and sanitation infra- structure, the education of households to recognize nutritional problems and improve feeding practices, and the promotion of other child nurturing practices. By addressing those factors, policymakers can im- prove the design of cash cropping projects and other policies to ensure more immediate improvements in child welfare in the process of achieving higher incomes through investment in cash crop production.
REFERENCES
1. Fleuret P. and Fleuret A. Nutrition, consumption, and agricultural change. Hum. Organiz. 39, 250, 1980.
2. Dewey K. Commentary-Agricultural development, diet, and nutrition. Ecol. Food Nutrition 8. 265-213, 1979.

Cash crop production in developing countries 697
3. Hernandez M., Hidalgo C. P. et al. Effect of economic growth on nutrition in a typical community. Ecol. Food Nutrition 4, 283-291, 1974.
4. Tinker I. New Technologies for FoodChain Activities: The 17. Imperative of Equity for- Women. U.S. Agency for International Development, Office of Women in Devel- opment, Washington, DC, 1979. 18.
5.
6.
7.
8.
9.
10.
11.
12.
13.
14.
15.
16.
Rabeneck S. The-determinants of protein-energy malnu- trition among preschool children in Kenya with respect to cash cropping and self-sufficiency in staple food production. Ph.D. dissertation, Cornell University, 1982. Harvey P. and Heywood P. Nutrition and Growth in Simbu, Vol. 4. Simbu Provincial Government, Office of Environment and Conservation, Papua New Guinea, 1983. von Braun J., Puetz D. and Webb P. Irrigation technol- ogy and commercialization of rice in The Gambia: Effects on income and nutrition. Research Report 75. International Food Policy Research Institute, Washing- ton, DC, 1989. Bouis H. and Haddad L. Agricul~uralCommercialization, Nutrition, and the Rural Poor: A Study of Philippine Farm Households. Lynne Reinner, Boulder, CO, 1990. Kennedy E. and Cogill B. Income and nutritional effects of the commercialization of agriculture in southwestern Kenya. Research Report 63. International Food Policy Research Institute, Washington, DC, 1987. Kennedv E. The effects of sugarcane production on food security; health, and nutrition in Kenya: A longitudinal analysis. Research Report 78. International Food Policy Research Institute, Washington, DC, 1989. von Braun J., Kennedy E., Bouis H., Peters P. and Herrera G. Commercialization of Smallholder Agricul- ture: A Comparative Analysis of the Eflects on Household- level Food Security and Nutrition and Implications for Policy. International Food Policy Research Institute, Washington, DC, 1988. Kennedy E. and Peters P. Household Food Security and Child Nutrition: The Implication of Income and Gender of Household Head. International Food Policy Research Institute, Washington, DC, 1991. The studies in The Gambia, Guatemala, Kenya, the Philippines, and Rwanda were carried out by the Inter- national Food Policy Research Institute during the period 1984 to 1987 (Refs [7-10, 14, 161). von Braun J., Immink M. and Hotchkiss D. Non- traditional export crops in Guatemala: effects on pro- duction, income. and nutrition. Research Report 73. International Food Policy Research Institute, Washing- ton, DC, 1989. Peters P. E. and Herrera G. Cashcropping, food security, and nutrition: The effects of agricultural commercializa- tion among smallholders in Malawi, Harvard Institute for International Development, Cambridge, MA, 1989. von Braun J., de Haen H. and Blanken J. Commercial- ization of agriculture under population pressure: effects
19.
20.
21.
22.
23.
24.
25.
26.
27.
28.
29.
on production, consumption, and nutrition in Rwanda. Research Report 85. International Food Policy Research Institute, Washington, DC, 1991. The high incidence rates for preschoolers in The Gambia and Kenya are due largely to the high prevalence of malaria in those countries. Similar findings resulted from regressions on data for children less than 36 months of age. It should be noted that an aging sample of preschoolers is biased toward more healthy children, since many of the very sick children may have already died. Based on UNICEF recommended child-feeding prac- tices, see UNICEF. Child survival: Four key elements. UNICEF NEWS. Issue 118. New York. 1983. Z-score calculated as:
Z-score =
(actual measurement - 50 percentile standard)
standard deviation of the standard
Based on National Center for Health Statistics (NCHS) growth standards. NCHS Growth Curves for Children: BirthhlByears. Vital and Health Statistics Series 11, No. 165, Washington, DC, 1977. In the Philippines, younger preschoolers from higher- income participating households got a better start; they were significantly taller than other preschoolers, How- ever, they got sicker more often so that they did not sustain these initial gains. Less than 90% of the standard height/age measure using NCHS standards (Ref. [21]). Less than 90% of the standard weight/height measure using NCHS standards (Ref. [21]). Growth models were also estimated using the height/age and weight/height measures as dependent variables. The results of these models, while not identical to those using the weight/age variable, are similar and are not pre- sented. The calorie variable presented in Table 9 represents household-level consumption in the case of The Gambia, Guatemala, and Rwanda; child calorie consumption is used in Kenya, Malawi and the Philippines. Bouis H. Consumption effects for the poor when agricul- ture commercializes. In Commercialization of Agriculture and Nutrition (Edited by von Braun J. and Kennedy E.). International Food Policy Research Institute, Washing- ton, DC, (forthcoming). In The Gambia, prior weight information ofpreschoolers was available to construct Z-scores, while the Guatemala, Kenya, and Malawi cases represented longi- tudinal studies of nutritional status which varied in length between 12 and 30 months. Alderman H. The Effect of Food Price and Income Changes on the Acquisition of Food by Low-income Households. International Food Policy Research Insti- tute, Washington, DC, 1986.