health and health services in the northern cape: key issues
TRANSCRIPT

Health and health services in the Northern
Cape: Key issues

Overview
• Northern Cape in the context of South Africa overall
• Between districts in Northern Cape

Key indicators
• Northern Cape has the third lowest poverty level (24% compared with SA average of 33%)
• Northern Cape has the third lowest percentage of population living in rural area (17%; SA 43%), but the lowest population density (3 people per km2 compared to average of 40)
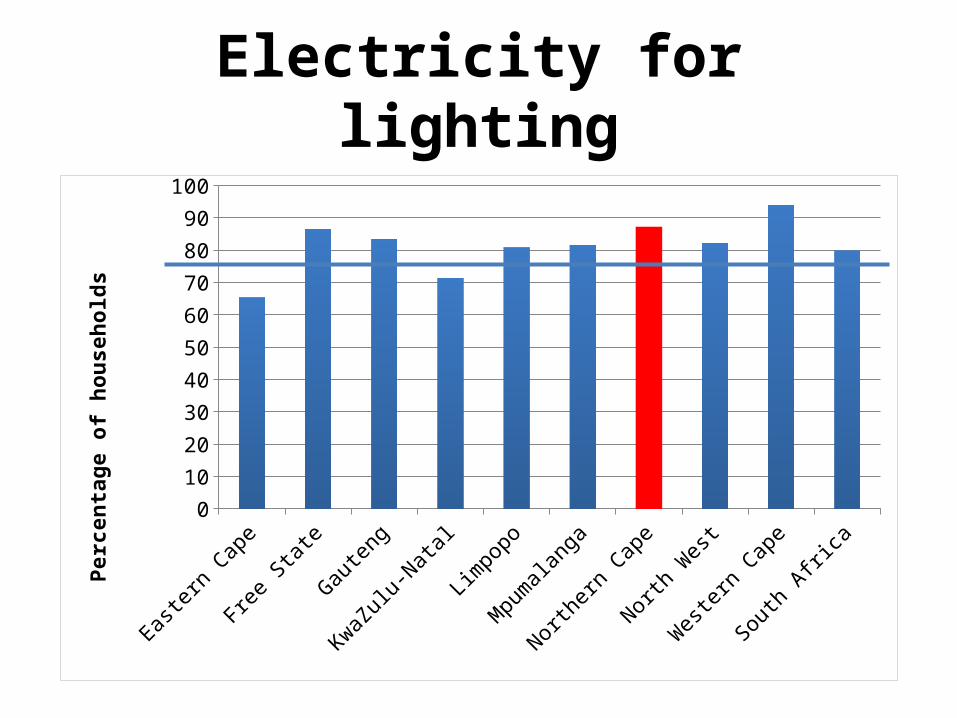
Electricity for lighting
Easte
rn Cape
Free S
tate
Gauten
g
KwaZulu-N
atal
Limpopo
Mpumalanga
Northern
Cape
North W
est
West
ern Cap
e
South Afric
a0
10
20
30
40
50
60
70
80
90
100
Perc
enta
ge o
f hou
seho
lds

Piped water
Easte
rn Cape
Free S
tate
Gauten
g
KwaZulu-N
atal
Limpopo
Mpumalanga
Northern
Cape
North W
est
West
ern Cap
e
South Afric
a0
10
20
30
40
50
60
70
80
90
100
Perc
enta
ge o
f hou
seho
lds

Flush toilet
Easte
rn Cape
Free S
tate
Gauten
g
KwaZulu-N
atal
Limpopo
Mpumalanga
Northern
Cape
North W
est
West
ern Cap
e
South Afric
a0
10
20
30
40
50
60
70
80
90
100
Perc
enta
ge o
f hou
seho
lds

Infant deaths (less than 1 year)
Easte
rn Cape
Free S
tate
Gauten
g
KwaZulu-N
atal
Limpopo
Mpumalanga
Northern
Cape
North W
est
West
ern Cap
e
South Afric
a0
10
20
30
40
50
60
70
Infa
nt d
eath
s per
100
0 liv
e bi
rths

Deaths in children less than 5 years
Easte
rn Cape
Free S
tate
Gauten
g
KwaZulu-N
atal
Limpopo
Mpumalanga
Northern
Cape
North W
est
West
ern Cap
e
South Afric
a0
10
20
30
40
50
60
70
80
90
100
Und
er 5
dea
ths p
er 1
000
live
birt
hs

Government health spending
Easte
rn Cape
Free S
tate
Gauten
g
KwaZulu-N
atal
Limpopo
Mpumalanga
Northern
Cape
North W
est
West
ern Cap
e
South Afric
a0
500
1000
1500
2000
2500
Gove
rnm
ent s
pend
ing
on h
ealth
per
per
son

Doctors working for public sector
Easte
rn Cape
Free S
tate
Gauten
g
KwaZulu-N
atal
Limpopo
Mpumalanga
Northern
Cape
North W
est
West
ern Cap
e
South Afric
a0
5
10
15
20
25
30
35
40
45
Doct
ors p
er 1
00,0
00 p
eopl
e

Private hospitals

Public hospitals= District hospitals
= Regional hospitals
= Provincial or national hospitals
