haynesville global access...
TRANSCRIPT

HGAPHaynesville Global Access
Pipeline
Tellurian Midstream Group | April 2018

Cautionary statements
The information in this presentation includes “forward-looking statements” within the meaning of
Section 27A of the Securities Act of 1933, as amended, and Section 21E of the Securities Exchange
Act of 1934, as amended. All statements other than statements of historical fact are forward-looking
statements. The words “anticipate,” “assume,” “believe,” “budget,” “estimate,” “expect,”
“forecast,” “initial,” “intend,” “may,” “plan,” “potential,” “project,” “should,” “will,” “would,” and
similar expressions are intended to identify forward-looking statements. The forward-looking
statements in this presentation relate to, among other things, future contracts, contract terms and
margins, our business and prospects, future costs, prices, financial results, liquidity and financing,
regulatory and permitting developments, future demand and supply affecting LNG and general
energy markets and the closing of, and the achievement of anticipated benefits from, our natural
gas property acquisition.
Our forward-looking statements are based on assumptions and analyses made by us in light of our
experience and our perception of historical trends, current conditions, expected future
developments, and other factors that we believe are appropriate under the circumstances. These
statements are subject to numerous known and unknown risks and uncertainties, which may cause
actual results to be materially different from any future results or performance expressed or implied
by the forward-looking statements. These risks and uncertainties include those described in the “Risk
Factors” section of Exhibit 99.1 to our Current Report on Form 8-K/A filed with the Securities and
Exchange Commission (the “SEC”) on March 15, 2017 and other filings with the SEC, which are
incorporated by reference in this presentation. Many of the forward-looking statements in this
presentation relate to events or developments anticipated to occur numerous years in the future,
which increases the likelihood that actual results will differ materially from those indicated in such
forward-looking statements. In addition, the acquisition, exploration and development of natural
gas properties involve numerous risks and uncertainties, including the risks that we will assume
unanticipated liabilities associated with the assets to be acquired and that the performance of the
assets will not meet our expectations due to operational, geologic, regulatory, midstream or other
issues. It is possible that the acquisition will not be completed on the terms or at the time expected,
or at all.
The forward-looking statements made in or in connection with this presentation speak only as of the
date hereof. Although we may from time to time voluntarily update our prior forward-looking
statements, we disclaim any commitment to do so except as required by securities laws.
This presentation contains information about projected EBITDA of Tellurian. EBITDA is not a financial
measure determined in accordance with U.S. generally accepted accounting principles (“GAAP”),
should not be viewed as a substitute for any financial measure determined in accordance with
GAAP and is not necessarily comparable to similarly titled measures reported by other companies. It
would not be possible without unreasonable efforts to reconcile the projected non-GAAP
information presented herein to net income, the most directly comparable GAAP financial
measure. Similarly, projected future cash flows as set forth herein may differ from cash flows
determined in accordance with GAAP.
Reserves and resourcesEstimates of non-proved reserves or resources are based on more limited information, and are
subject to significantly greater risk of not being produced, than proved reserves.
Non-GAAP financial measuresForward looking statements
2

Who we are

Building a low-cost global gas business
4
Pipeline
Liquefaction
Marketing
Upstream 11,620 acres in the Haynesville with 1.4 Tcf resource
~$7 billion(1) of pipeline infrastructure projects in development
~$15 billion of liquefaction infrastructure in development
International delivery of LNG cargoes started in 2017
Driftwood Holdings partnership – integrated, low-cost
Note: (1) HGAP and PGAP projects are in early stages and remain under review.
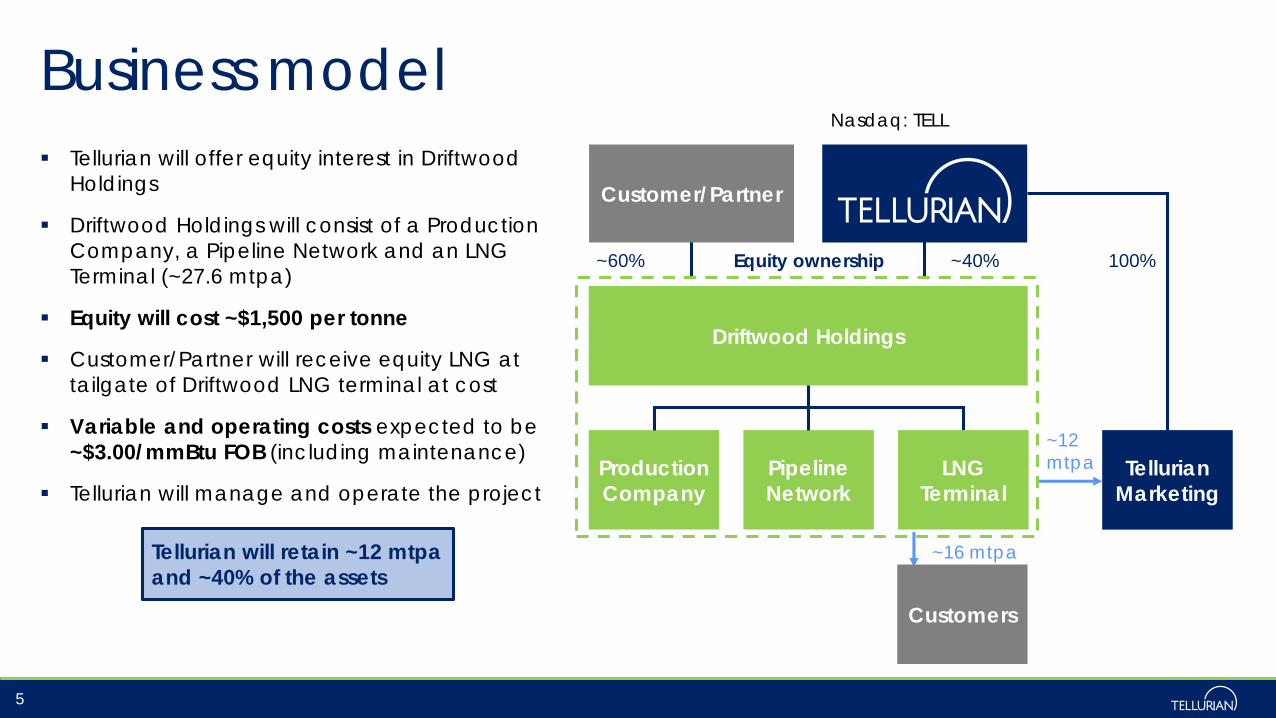
▪ Tellurian will offer equity interest in Driftwood
Holdings
▪ Driftwood Holdings will consist of a Production
Company, a Pipeline Network and an LNG
Terminal (~27.6 mtpa)
▪ Equity will cost ~$1,500 per tonne
▪ Customer/Partner will receive equity LNG at
tailgate of Driftwood LNG terminal at cost
▪ Variable and operating costs expected to be
~$3.00/mmBtu FOB (including maintenance)
▪ Tellurian will manage and operate the project
Business model
5
Tellurian
Marketing
Pipeline
Network
Production
Company
Equity ownership ~40%
~16 mtpa
~12 mtpa
Customer/Partner
~60%
Customers
100%
Nasdaq: TELL
LNG
Terminal
Tellurian will retain ~12 mtpa
and ~40% of the assets
Driftwood Holdings
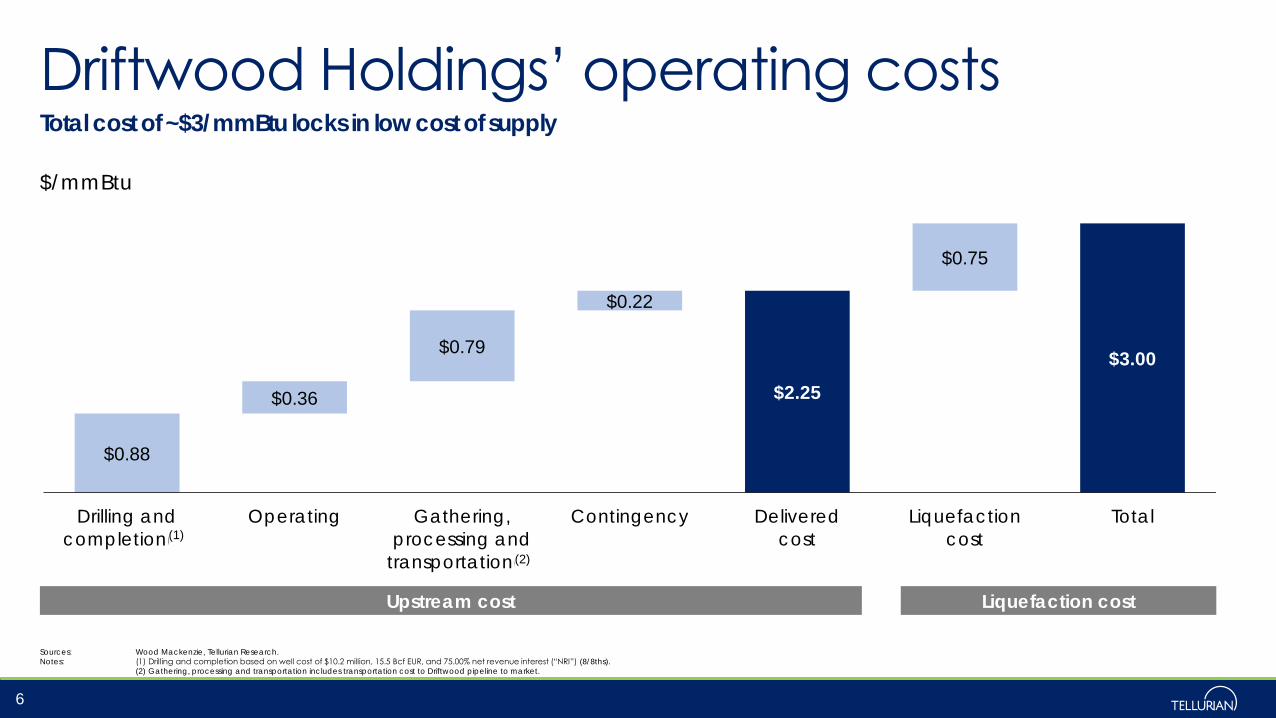
Driftwood Holdings’ operating costsTotal cost of ~$3/mmBtu locks in low cost of supply
$0.88
$0.36
$0.79
$0.22
$2.25
$0.75
$3.00
Drilling and
completion(1)
Operating Gathering,
processing and
transportation(2)
Contingency Delivered
cost
Liquefaction
cost
Total
Sources: Wood Mackenzie, Tellurian Research.
Notes: (1) Drilling and completion based on well cost of $10.2 million, 15.5 Bcf EUR, and 75.00% net revenue interest (“NRI”) (8/8ths).
(2) Gathering, processing and transportation includes transportation cost to Driftwood pipeline to market.
6
Upstream cost
$/mmBtu
Liquefaction cost
(1)
(2)
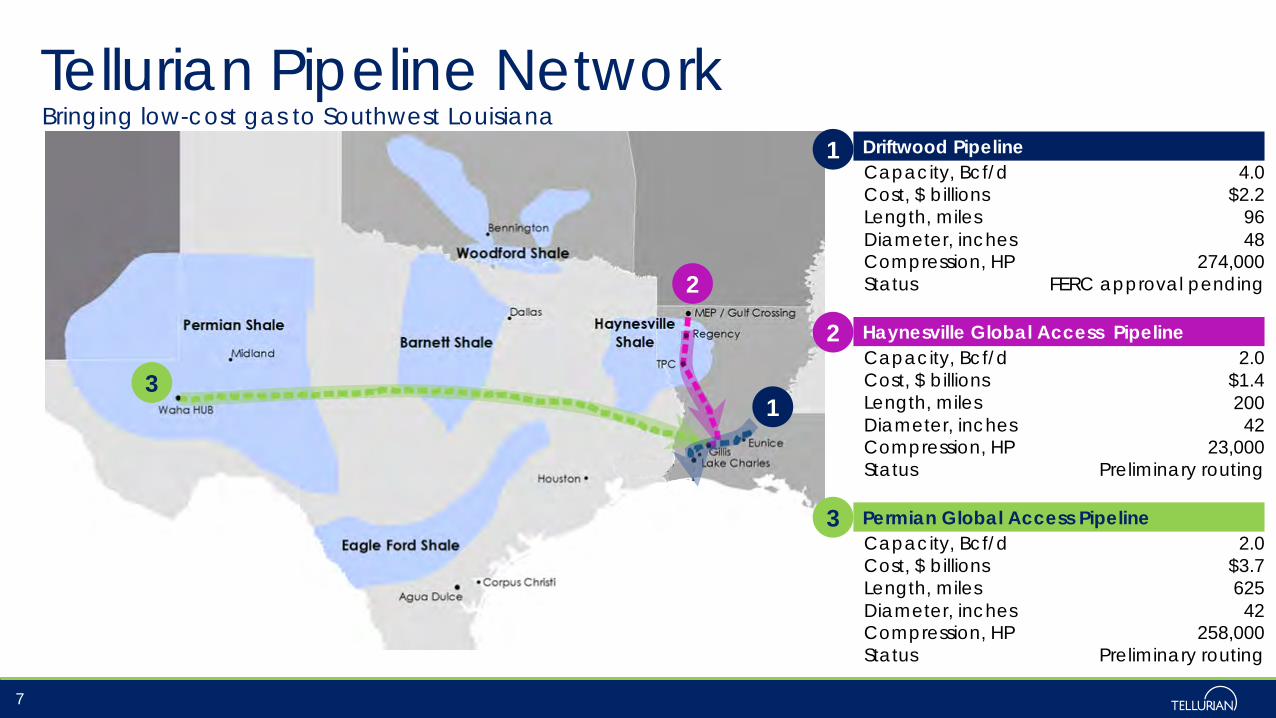
Tellurian Pipeline Network
7
Driftwood Pipeline
Capacity, Bcf/d 4.0Cost, $ billions $2.2 Length, miles 96
Diameter, inches 48Compression, HP 274,000Status FERC approval pending
Haynesville Global Access Pipeline
Capacity, Bcf/d 2.0Cost, $ billions $1.4Length, miles 200Diameter, inches 42Compression, HP 23,000Status Preliminary routing
Permian Global Access Pipeline
Capacity, Bcf/d 2.0Cost, $ billions $3.7Length, miles 625
Diameter, inches 42Compression, HP 258,000Status Preliminary routing
Bringing low-cost gas to Southwest Louisiana
1
2
3
1
2
3
Southwest Louisiana The Big Short
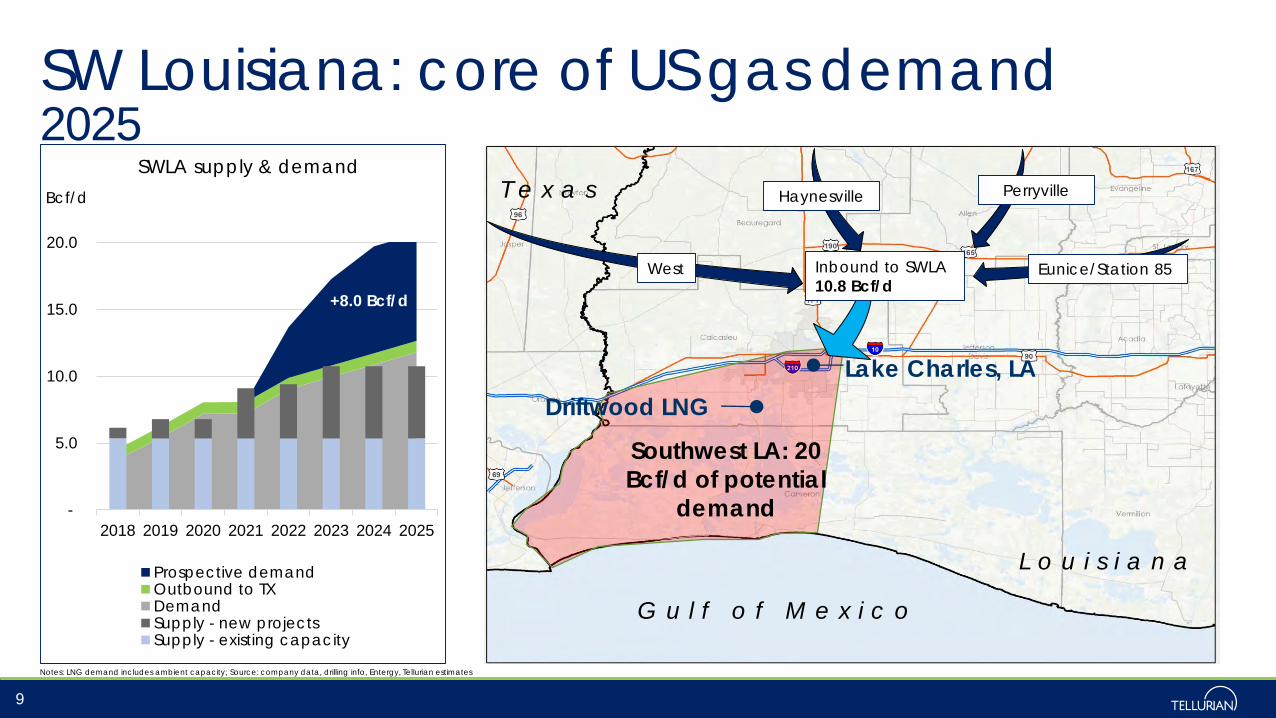
SW Louisiana: core of US gas demand2025
Notes: LNG demand includes ambient capacity; Source: company data, drilling info, Entergy, Tellurian estimates
9
-
5.0
10.0
15.0
20.0
2018 2019 2020 2021 2022 2023 2024 2025
Bcf/d
SWLA supply & demand
Prospective demandOutbound to TXDemandSupply - new projectsSupply - existing capacity
+8.0 Bcf/d
L o u i s i a n a
T e x a s
G u l f o f M e x i c o
Driftwood LNG
Lake Charles, LA
Southwest LA: 20
Bcf/d of potential
demand
Perryville
Eunice/Station 85
Haynesville
West Inbound to SWLA
10.8 Bcf/d
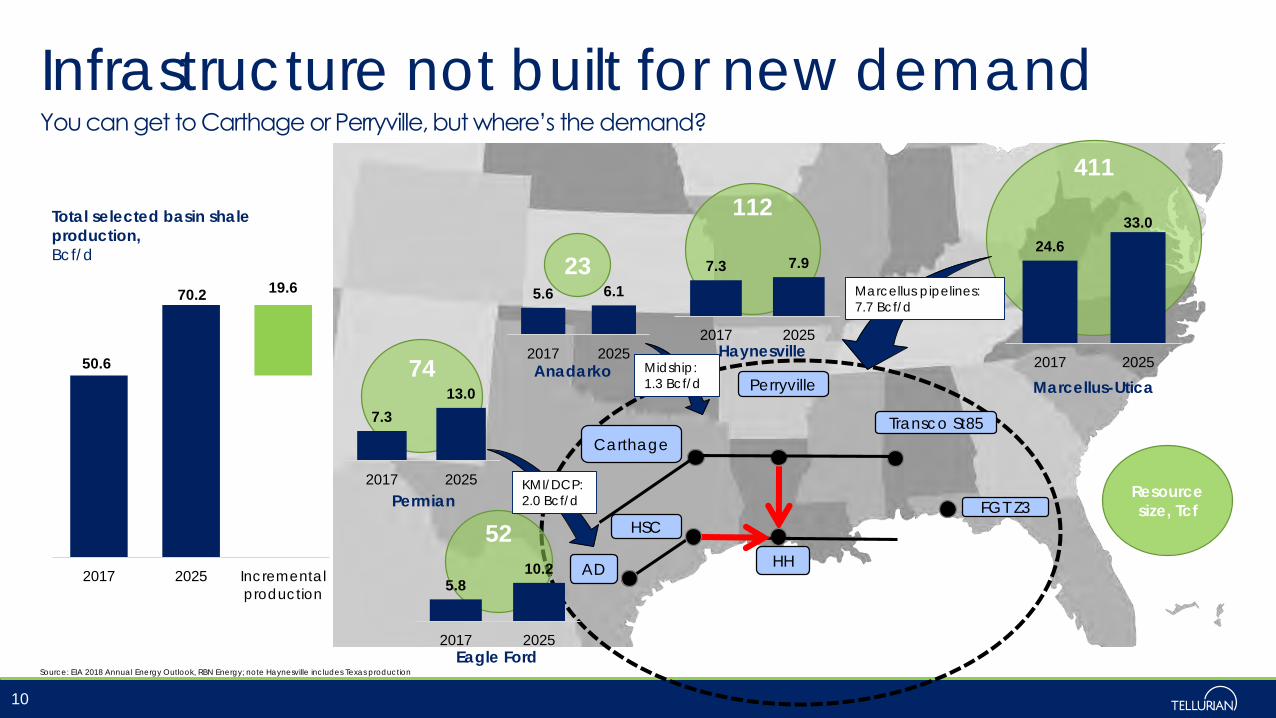
Infrastructure not built for new demandYou can get to Carthage or Perryville, but where’s the demand?
Source: EIA 2018 Annual Energy Outlook, RBN Energy; note Haynesville includes Texas production
10
Carthage
Perryville
Transco St85
FGT Z3
HSC
HHAD
411
Marcellus-Utica
24.6
33.0
2017 202574
Permian
7.3
13.0
2017 2025
Anadarko
5.6 6.1
2017 2025
23
52
Eagle Ford
5.810.2
2017 2025
112
7.3 7.9
2017 2025Haynesville
50.6
70.219.6
2017 2025 Incremental
production
Total selected basin shale
production,
Bcf/d
Resource
size, Tcf
Marcellus pipelines:
7.7 Bcf/d
Midship:
1.3 Bcf/d
KMI/DCP:
2.0 Bcf/d

Market opportunity emerging for HGAP
0
1,000,000
2,000,000
3,000,000
4,000,000
5,000,000
6,000,000
7,000,000
8,000,000
9,000,000
mmBtu/d Pipeline capacity between Perryville & Eunice/Gillis
Pipeline capacity
Contracted capacity
Pipeline throughput
Capacity increases resulting from ANR, Texas Gas, Transco, Columbia Gulf, and Tennessee Gas system reversals
0
2,000,000
4,000,000
6,000,000
8,000,000
10,000,000
12,000,000
14,000,000
16,000,000
mmBtu/d Pipeline capacity between Carthage & Perryville
Pipeline capacity
Contracted capacity
Pipeline throughput
Current Haynseville production
(EIA)
Rolloffs from existing pipes, combined with limited capacity from Perryville to SWLA, make HGAP attractive
11
Capacity decrease results from contract roll offs on Gulf Crossing, MEP, Tiger, Regency, Enable (Line CP) and Gulf South
expansion
Source: Gas Supply Consulting
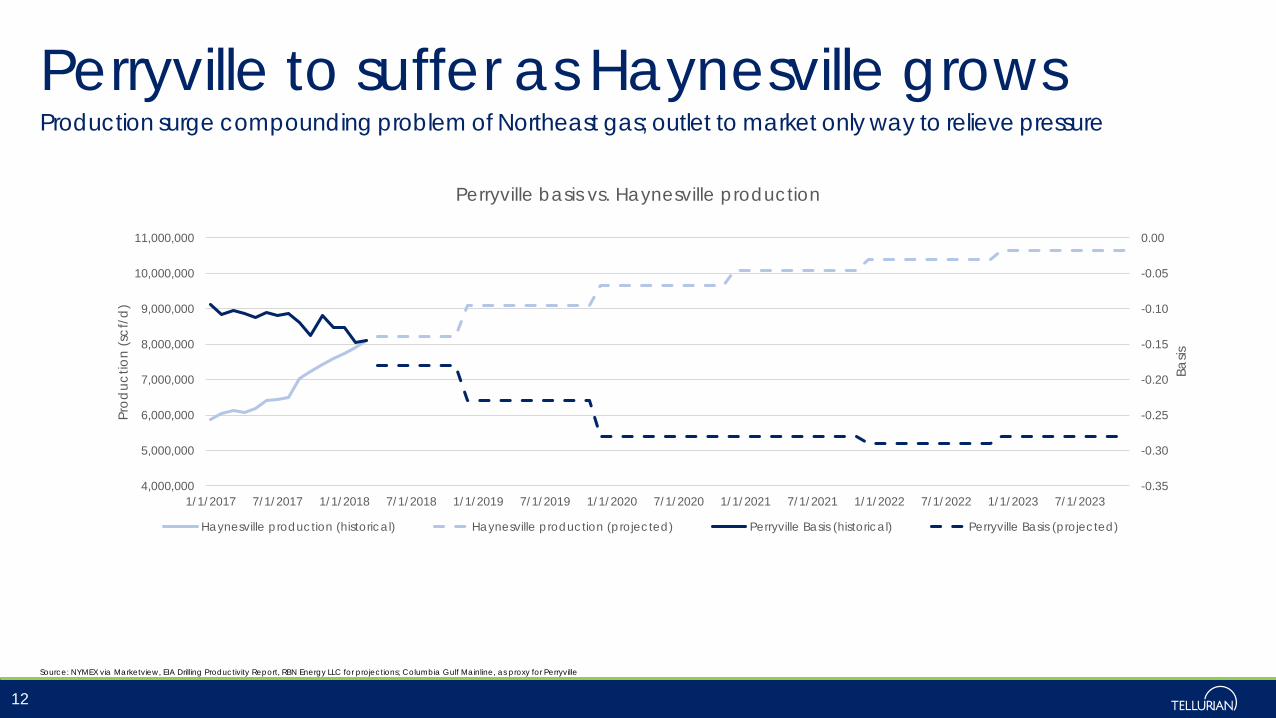
Perryville to suffer as Haynesville growsProduction surge compounding problem of Northeast gas; outlet to market only way to relieve pressure
Source: NYMEX via Marketview, EIA Drilling Productivity Report, RBN Energy LLC for projections; Columbia Gulf Mainline, as proxy for Perryville
12
-0.35
-0.30
-0.25
-0.20
-0.15
-0.10
-0.05
0.00
4,000,000
5,000,000
6,000,000
7,000,000
8,000,000
9,000,000
10,000,000
11,000,000
1/1/2017 7/1/2017 1/1/2018 7/1/2018 1/1/2019 7/1/2019 1/1/2020 7/1/2020 1/1/2021 7/1/2021 1/1/2022 7/1/2022 1/1/2023 7/1/2023
Ba
sis
Pro
du
ctio
n (
scf/
d)
Perryville basis vs. Haynesville production
Haynesville production (historical) Haynesville production (projected) Perryville Basis (historical) Perryville Basis (projected)

Louisiana gas flows and basis 2023
Haynesville* S&D (bcf/d):Production: 8.0Demand: 0.2 Net Outflows: 7.8
South Louisiana S&D (bcf/d):Production: 2.6Demand: 4.1 Net Inflows: 1.5Imbalance -0.6
1.0
3.59.0
1.5
*Haynesville, Bossier, Cotton Valley (Terryville) – Louisiana only
Perryville S&D (bcf/d):Production: 0.0Demand: 0.2 Net Inflows: 0.2
6.8
3.6
5.5
-$0.28
TCO
-$0.41
Haynesville*
East TexasTransco St 85
Perryville
South LA
Katy/Ship
-$0.25
2.2
4.1
1.7
3.8
-$0.05
13
5.5Pipeline at
capacity
(1.0)
1.0
3.0
5.0
7.0
9.0
11.0
13.0
15.0
2015 2016 2017 2018 2019 2020 2021 2022 2023 2024 2025
Bcf/d
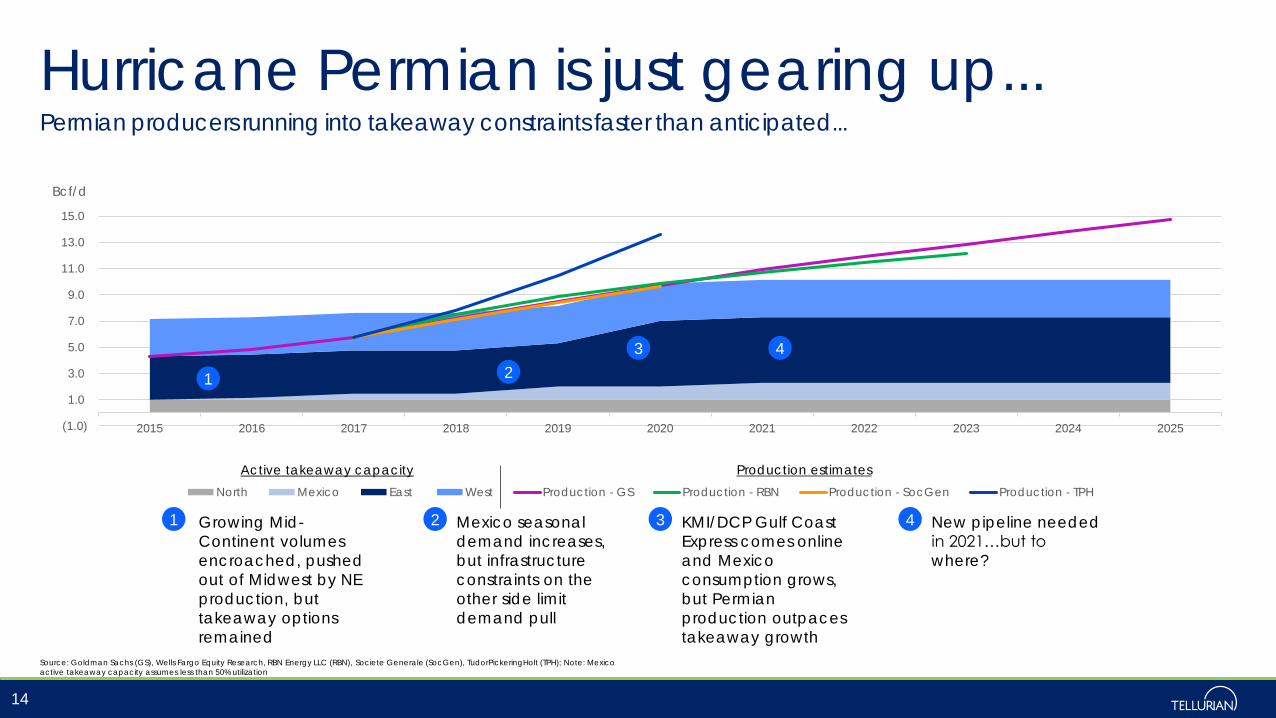
North Mexico East West Production - GS Production - RBN Production - SocGen Production - TPH
Hurricane Permian is just gearing up...Permian producers running into takeaway constraints faster than anticipated...
Source: Goldman Sachs (GS), Wells Fargo Equity Research, RBN Energy LLC (RBN), Societe Generale (SocGen), TudorPickeringHolt (TPH); Note: Mexico
active takeaway capacity assumes less than 50% utilization
Growing Mid-
Continent volumes
encroached, pushed
out of Midwest by NE
production, but
takeaway options
remained
Mexico seasonal
demand increases,
but infrastructure
constraints on the
other side limit
demand pull
KMI/DCP Gulf Coast
Express comes online
and Mexico
consumption grows,
but Permian
production outpaces
takeaway growth
New pipeline needed
in 2021…but to
where?
1 2 3 4
1 2
3 4
14
Active takeaway capacity Production estimates

Waha
Hub
South LAKaty/Ship
Agua Dulce
Haynesville
Perryville
Transco St 85
Corpus
Sabine PassCameronDriftwood
?
-$0.26
-$0.25
-$0.28
$-.05
Freeport
...and will impact Texas Gulf Coast hardest2023
15

HSC basis moving in anticipation of PermianBackwardated market shows impact of Permian gas coming via intrastates, Agua Dulce
Source: Bloomberg as of 3/15/2018
16
-0.31
-0.28
-0.24
-0.20
-0.16
-0.12
-0.08
-0.04
-0.01
0.03
0.07
0.11
0.15
1/1
0/2
016
7/5
/201
6
12/2
8/2
016
6/2
3/2
017
12/1
6/2
017
6/1
0/2
018
12/4
/20
18
5/2
9/2
019
11/2
2/2
019
5/1
6/2
020
11/8
/20
20
$/m
mB
tu
Rolling forward curve of HOUS SHIP CHANNEL APR18
Actuals Curve as of: 28-Feb-2018 Curve as of: 29-Dec-2017
Curve as of: 30-Jun-2017 Curve as of: 30-Dec-2016 6M Moving Average as of 28-Feb-2018

SummaryBloomberg, EIA, RBN see a wall of gas that needs to find a market
▪ US dry gas production to hit 100 Bcf/d in next ten years
― Marcellus/Utica, Permian and Eagle Ford to provide growth of 18 Bcf/d
― Highly sensitive to increases in oil price
▪ Market needs at least 14-18 Bcf/d of LNG exports to balance; currently only 10 Bcf/d operating or under construction
▪ SW Louisiana is the center of US natural gas demand growth for the next decade
― Driven by LNG, favorable permitting/sites, and petrochemical growth
▪ $170 bn of infrastructure needed to bring new production to demand
▪ Even with recently built infrastructure, you still have a last mile problem: you can get close, but cannot get to market
▪ Rock and a hard place:
― Northeast, Permian production growth crowding out other production
― Basis eroding almost everywhere until infrastructure can get in place
― Getting to demand first will be key to maximizing revenue
Source: EIA AEO 2018, Reference Case; RBN Energy, LLC; Bloomberg New Energy Finance
17
HGAPMaps & Rates
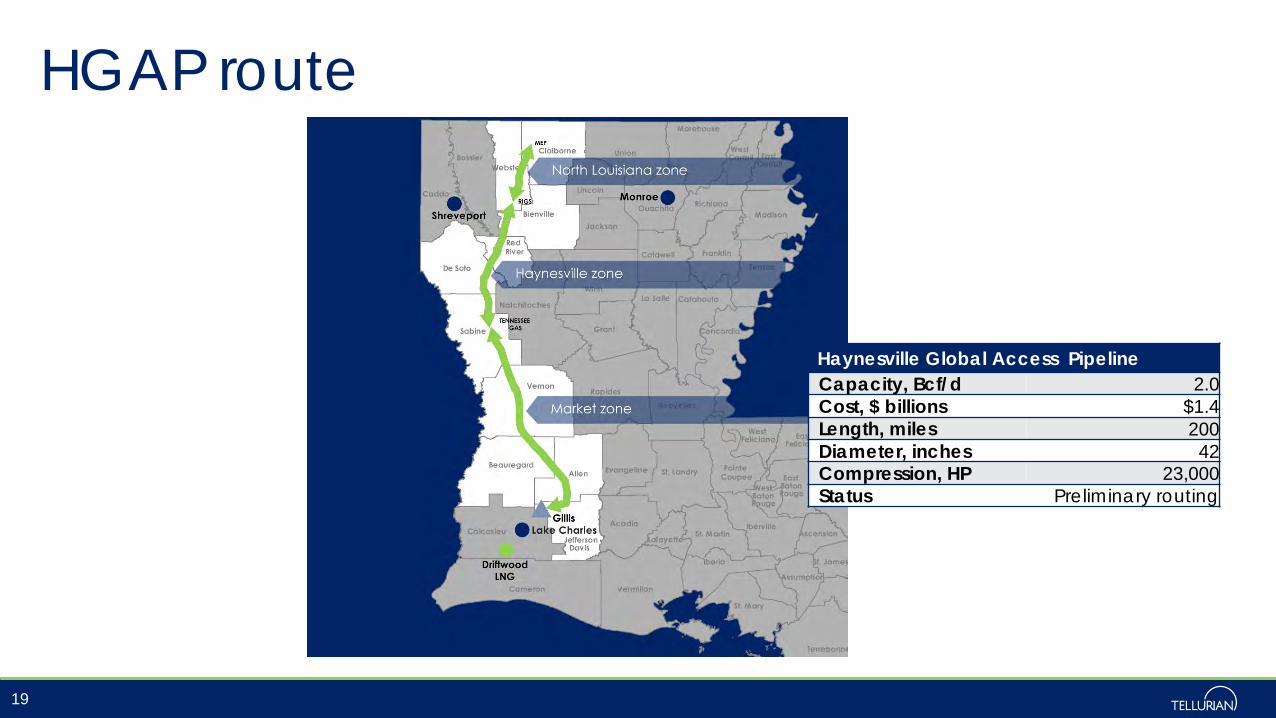
HGAP route
19
Haynesville Global Access Pipeline
Capacity, Bcf/d 2.0Cost, $ billions $1.4Length, miles 200Diameter, inches 42Compression, HP 23,000Status Preliminary routing

HGAP receipts
20
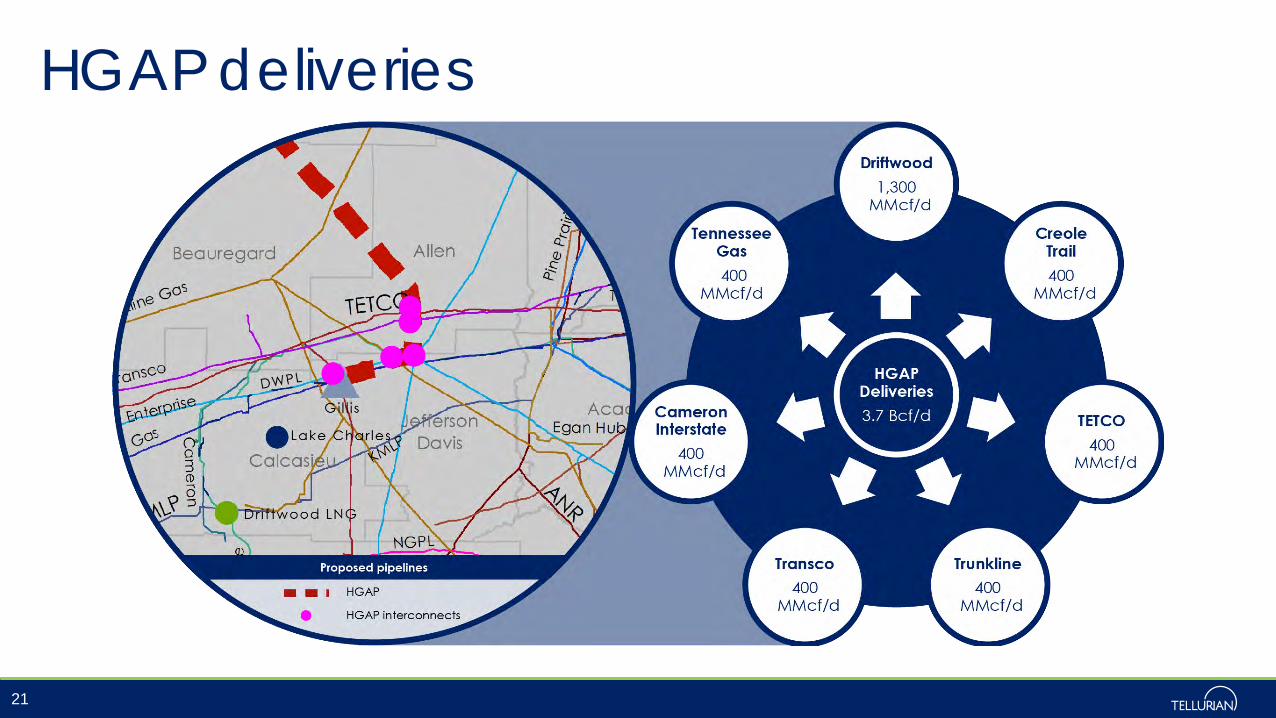
HGAP deliveries
21

▪ Negotiated rates for higher firm transportation service
▪ Shipper classes
― Standard: 100,000 – 249,999 Dth/d
― Anchor: 250,000 – 499,999 Dth/d
― Foundation: 500,000+ Dth/d
▪ Term:
― 10 years for Anchor, Standard shippers
― 20 years for Foundation shippers
Rates
22

Thank you