hawaiian telcom public presentation to lenders · ability to develop and launch new products and...
TRANSCRIPT

March 31, 2008
Hawaiian TelcomPublic Presentation to Lenders

2
ForwardForward--Looking StatementsLooking Statements
Certain of the statements and predictions contained in this presentation constitute forward-looking statements within the meaning of the Private Securities Litigation Reform Act. In particular, any statements, projections or estimates that include or reference the words “believes,” “anticipates,” “plans,”“intends,” “expects,” “will,” or any similar expression fall within the safe harbor for forward-looking statements contained in the Reform Act. Actual results or outcomes may differ materially from those indicated or suggested by any such forward-looking statement for a variety of reasons, including but not limited to, Hawaiian Telcom’s ability to maintain its market position in communications services, including wireless, wireline and Internet services; general economic trends affecting the purchase or supply of communication services; world and national events that may affect the ability to provide services; changes in the regulatory environment; any rulings, orders or decrees that may be issued by any court or arbitrator; restrictions imposed under various credit facilities and debt instruments; work stoppages caused by labor disputes; adjustments resulting from year-end audit procedures; and Hawaiian Telcom’s ability to develop and launch new products and services. More information on potential risks and uncertainties is available in recent filings with the Securities and Exchange Commission, including Hawaiian Telcom’s Form 10-K report. The forward-looking statements included in this presentation represent estimates as of the date on the first slide. It is anticipated that subsequent events and developments will cause estimates to change.

3
AgendaAgenda
Company Overview Steve CooperCEO
Operating Trends Robert ReichSVP & interim CFO
Products and Initiatives Lester ChuVP Strategy & Business Development
Regulatory Update Alan OshimaSVP & General Counsel
Financial Review Robert Reich SVP & interim CFO
Public Q&A

Company OverviewCompany OverviewSteve Cooper, Chief Executive OfficerSteve Cooper, Chief Executive Officer

5
Name Position ExperienceSteve Cooper Chief Executive Officer More than 35 years of management leadership
experience: Chairman of Kroll Zolfo Cooper, a pre-eminent advisory and management firm
Kevin Nystrom Chief Operating Officer More than 20 years experience in restructuring and financial management: Kroll Zolfo Cooper, Deloitte & Touche, ICG Communications
Robert Reich SVP, interim Chief Financial Officer
More than 20 years in finance, treasury and audit: Controller & Treasurer McLeodUSA, Canadian National Railway; Deloitte & Touche
Jeff Hoffman VP, Financial Planning & Analysis
More than 15 years: Madison River Communications
Lester Chu VP, Strategy & Business Development
More than 20 years in telecom industry: VP Strategy & Business Development Verizon SuperPages; Exec. Director BusDev GTE
Alan Oshima SVP, General Counsel More than 30 years specializing in public utilities: Founding partner of local firm Oshima Chun Fong & Chung, LLP.
Loren Tobey VP, Chief Information Officer More than 30 years: CIO at NextiraOne; Williams Communications; Trident Data Systems; US Air Force
Michael Brown SVP, Sales & Marketing More than 20 years: NextiraOne, VoxpathNetworks, Lucent Technologies
Management TeamManagement Team

6
Company OverviewCompany Overview
What Happened? • Post cutover company became internally focused
Data integrity and flow through issues required management to focus on systems stabilization effortsBearingPoint settlement and Accenture transition further delayedability to rollout new products and servicesCustomer experience and company brand impacted
What are we doing about it?• Systems stabilization progress has been made
Remediation efforts largely completedPerformance and reliability improved
• New products and services are being rolled out• Refocus and reorganize our dedicated and
committed employees

7
Company Overview Company Overview (cont.)(cont.)
Where do we go from here?• Organizational Structure
Evolution to a customer-centric organization
• Product & ServicesEvaluate and simplify product and service offeringsFocus on providing profitable offerings which meet customer needs
• InfrastructureBetter integrate infrastructure to be inclusive of people, processes and systemsImprove and simplify customer experience & service delivery
• Metrics & MeasurementDevelop a flexible, accessible, meaningful suite of financial and operational reports to drive success

Operating TrendsOperating TrendsRobert Reich, SVP & interim Chief Financial OfficerRobert Reich, SVP & interim Chief Financial Officer

9
407 400 390 380 369 358 346 338 328
239 238 236 235 234 237 235 235 232
79 84 89 92 90 91 90 91 92
0
180
360
540
720
900
4Q'05 1Q'06 2Q'06 3Q'06 4Q'06 1Q'07 2Q'07 3Q'07 4Q'07
Residential Business HSI
725 723 716 708 693 686 671 664 652
Retail Connections TrendsRetail Connections Trends
Total retail connections (000s)
Average quarterly retail connection decline of 1.3% over the pasAverage quarterly retail connection decline of 1.3% over the past 8 t 8 quartersquarters
___________________________Note: % numbers outlined above are QoQ.
Residential
5.8% 6.8% 3.4% (2.2%) 0.7% (1.0%) 1.3% 0.7%
Business
HIS
(0.2%) (1.1%) (0.4%) (0.5%) 1.3% (0.6%) (0.4%)
(1.6%) (2.5%) (2.6%) (3.0%) (3.1%) (3.4%) (2.0%) (3.0%)
(1.1%)
Total (0.3%) (1.0%) (1.1%) (2.0%) (1.1%) (2.1%) (1.0%) (1.8%)
HSI
Residential
5.8% 6.8% 3.4% (2.2%) 0.7% (1.0%) 1.3% 0.7%
Business
HIS
(0.2%) (1.1%) (0.4%) (0.5%) 1.3% (0.6%) (0.4%)
(1.6%) (2.5%) (2.6%) (3.0%) (3.1%) (3.4%) (2.0%) (3.0%)
(1.1%)
Total (0.3%) (1.0%) (1.1%) (2.0%) (1.1%) (2.1%) (1.0%) (1.8%)
Residential
5.8% 6.8% 3.4% (2.2%) 0.7% (1.0%) 1.3% 0.7%
Business
HIS
(0.2%) (1.1%) (0.4%) (0.5%) 1.3% (0.6%) (0.4%)
(1.6%) (2.5%) (2.6%) (3.0%) (3.1%) (3.4%) (2.0%) (3.0%)
(1.1%)
Total (0.3%) (1.0%) (1.1%) (2.0%) (1.1%) (2.1%) (1.0%) (1.8%)
HSI

10
Access Line TrendsAccess Line Trends
Access line trends generally in line with other service providerAccess line trends generally in line with other service providerss
___________________________Note: Peer group consists of ILEC line results from AT&T, Cincinnati Bell, Embarq, Qwest, Verizon.
4Q'05 1Q'06 2Q'06 3Q'06 4Q'06 1Q'07 2Q'07 3Q'07 4Q'07 Average
Decline - Y-o-Y:Hawaiian Telcom NA NA (5.3%) (5.5%) (6.6%) (6.9%) (7.3%) (6.9%) (7.0%) (6.5%)Clean-up of Non-Pay Disconnects NA NA NA NA NA (1.1%) (0.3%) (0.1%) (0.8%) NANormalized for Non-Pay NA NA NA NA NA (5.8%) (6.9%) (6.8%) (6.2%) NAPeer Group Average NA NA (6.6%) (6.9%) (7.1%) (6.9%) (7.0%) (7.3%) (7.4%) (7.0%)
Difference NA NA 1.3% 1.4% 0.5% 1.1% 0.1% 0.4% 1.2% 0.5%
Decline - Q-o-Q:Hawaiian Telcom (0.9%) (1.1%) (2.0%) (1.8%) (2.0%) (1.4%) (2.3%) (1.4%) (2.2%) (1.7%)Clean-up of Non-Pay Disconnects NA NA NA NA NA (1.2%) (0.3%) (0.1%) (0.9%) NANormalized for Non-Pay NA NA NA NA NA (0.2%) (2.0%) (1.3%) (1.3%) NAPeer Group Average (1.5%) (1.9%) (1.9%) (1.8%) (1.7%) (1.6%) (2.0%) (2.0%) (1.9%) (1.8%)
Difference 0.6% 0.8% (0.1%) 0.0% (0.3%) 1.5% 0.1% 0.7% 0.6% 0.1%
11
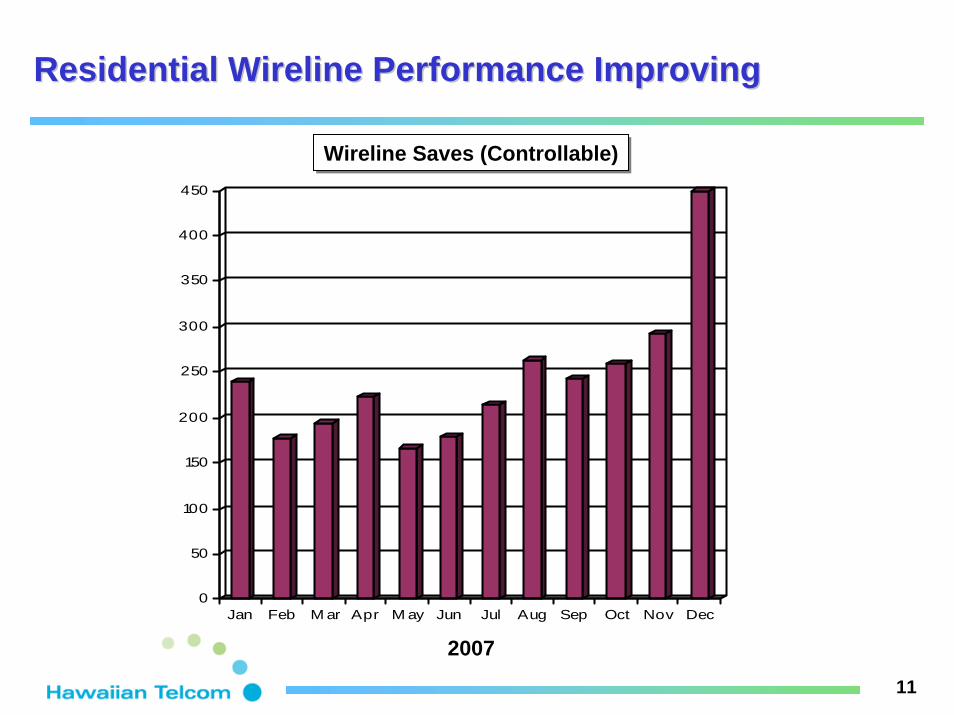
Residential Wireline Performance ImprovingResidential Wireline Performance Improving
0
50
100
150
200
250
300
350
400
450
Jan Feb M ar Apr M ay Jun Jul Aug Sep Oct Nov Dec
Wireline Saves (Controllable)Wireline Saves (Controllable)
2007

12
HighHigh--Speed InternetSpeed Internet
HSI Lines (000s):
79 84 89 92 90 91 90 91
% Penetration of primary residential & business access lines% Penetration of primary residential & business access lines
92
% Penetration
13% 14%15% 16% 16% 16% 16% 17% 17%
0%
5%
10%
15%
20%
4Q'05 1Q'06 2Q'06 3Q'06 4Q'06 1Q'07 2Q'07 3Q'07 4Q'07

13
Residential HSI Performance ImprovingResidential HSI Performance Improving
-1,500
-1,000
-500
0
500
1,000
1,500
Q1'07 Q2'07 Q3'07 Q4'07
High Speed Internet Net AddsHigh Speed Internet Net Adds
0
50
10 0
150
2 0 0
2 50
3 0 0
3 50
Jan Feb Mar Apr May Jun Jul Aug Sep Oct Nov Dec
High Speed Internet Saves (Controllable)High Speed Internet Saves (Controllable)
2007

14
0
5,000
10,000
15,000
20,000
25,000
30,000
Jan Feb Mar Apr May Jun Jul Aug Sep Oct Nov Dec
Residential Bundle PerformanceResidential Bundle Performance
BundleMarketing
Blitz
Launched 7MB / 11MB
HSI
Reduced$55.95
3MB Bundle
$65.95Bundle
Relaunch
OTWC$56.10 Bundle
2007
2.0% of Access Lines
2.0% of Access Lines
8.0% of Access Lines
8.0% of Access Lines

15
Stabilizing & Improving SystemsStabilizing & Improving Systems
Substantial progress in the stabilization of the systems has been made over the last twelve months
Notable operational and systems improvements
• Improved billing performance
• Enhanced Self-Service capabilities
• Redefined collections management including automated “suspend and restore”
• Completed the remediation initiatives
• Delivery of new products to include international LD and 7/11 Mbps HSI
Significant Operations/Systems Improvements
Finalizeddata center relocation
Monthly releases
instituted
Dec‘07
August‘07
May‘07
April ‘07
Jan‘08
October‘07
Billing defect levels reduced by 82% from June
’07 levels
Completed BearingPoint to
Accenture transition
Next Gen HSI implemented
Nov‘07
Product level Synccomplete
ACC Remediation
complete
Begin rollout of simplified
product structure
May‘08
16
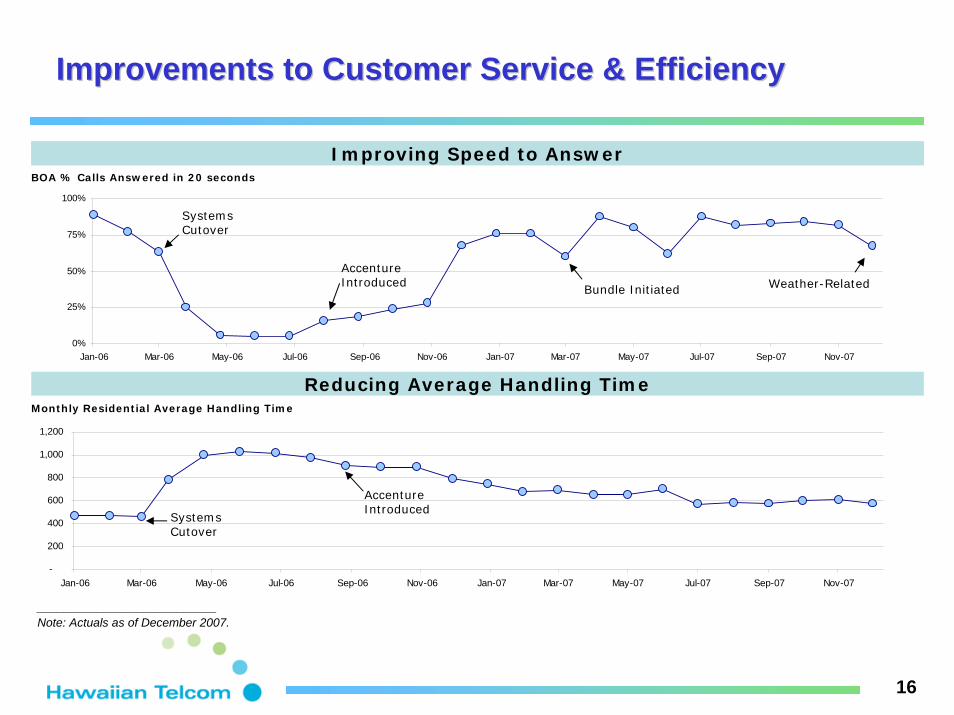
Improvements to Customer Service & EfficiencyImprovements to Customer Service & Efficiency
Meeting PUC Service Requirements
___________________________Note: Actuals as of December 2007.
BOA % Calls Answered in 20 seconds
Improving Speed to Answer
-
200
400
600
800
1,000
1,200
Jan-06 Mar-06 May-06 Jul-06 Sep-06 Nov-06 Jan-07 Mar-07 May-07 Jul-07 Sep-07 Nov-07
0%
25%
50%
75%
100%
Jan-06 Mar-06 May-06 Jul-06 Sep-06 Nov-06 Jan-07 Mar-07 May-07 Jul-07 Sep-07 Nov-07
AccentureIntroduced
Bundle Initiated
AccentureIntroduced
SystemsCutover
SystemsCutover
Monthly Residential Average Handling Time
Weather-Related
Reducing Average Handling Time
17
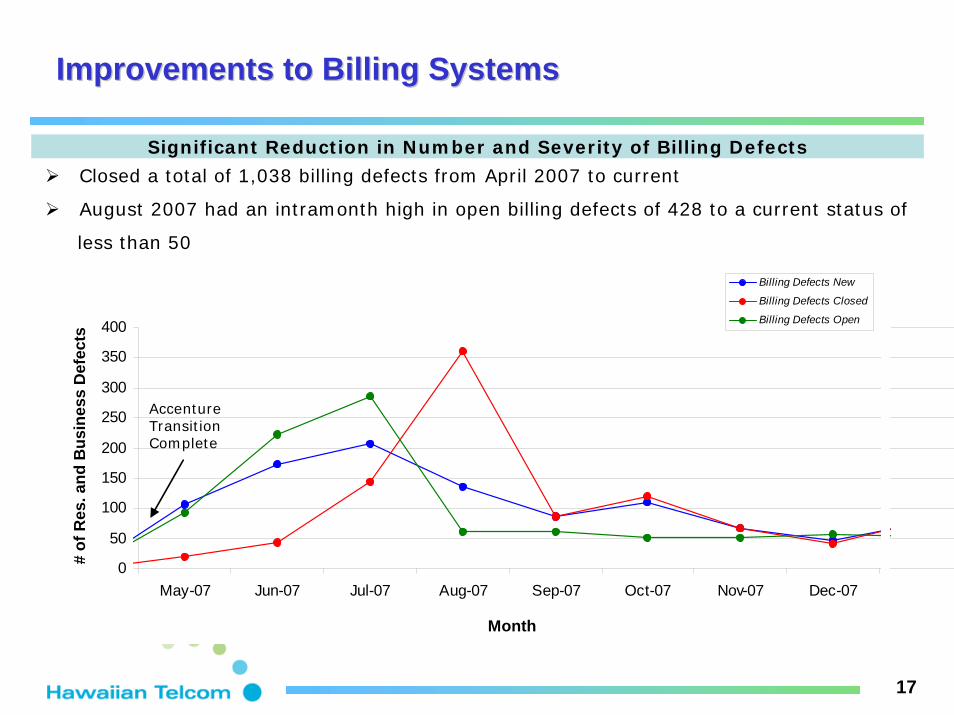
Improvements to Billing SystemsImprovements to Billing Systems
Significant Reduction in Number and Severity of Billing Defects
Closed a total of 1,038 billing defects from April 2007 to current
August 2007 had an intramonth high in open billing defects of 428 to a current status of
less than 50
0
50
100
150
200
250
300
350
400
May-07 Jun-07 Jul-07 Aug-07 Sep-07 Oct-07 Nov-07 Dec-07
Month
# of
Def
ects Accenture
TransitionComplete
# of
Res
. and
Bus
ines
s D
efec
ts
Month
Billing Defects New
Billing Defects Closed
Billing Defects Open

New Product Strategy & InitiativesNew Product Strategy & InitiativesLester Chu, VP Strategy & Business DevelopmentLester Chu, VP Strategy & Business Development

19
Advanced Network Infrastructure Deployed In 2007Advanced Network Infrastructure Deployed In 2007
Network Enhancements ImpactInstalled MPLS backbone with state-wide reach
Backbone for the future; enabled launch of 7MB / 11MB HSI and Ethernet in 2007
With MPLS, enables state-wide launch of QOS-based VoIP and messaging services
Expanded NOC managed services Hawaiian Telcom operates the only NOC in Hawaii, focused solely on Hawaii customers
Added survivable inter-island rings Only Hawaii service provider to offer route diversity and survivable rings between islands
Installed Nortel VoIP core switch
Once completed in 2008, provides improved speed and performance for high speed internet
Initiated conversion of services on ATM to MPLS backbone
Hawaiian Telcom Is Now Able To Offer Services And Features Statewide That Others CannotHawaiian Telcom Is Now Able To Offer Services And Features Statewide That Others Cannot

20
Product Migration StrategyProduct Migration StrategyHawaiian Telcom As Fast FollowerHawaiian Telcom As Fast Follower
Accelerates growthEnables integrated features Applications drive revenues and stickiness
Enha
nced
Cus
tom
er V
alue
Migrates legacy servicesEnables richer feature setLower service delivery cost
Focus is on retentionBundle to improve “value”Improve customer experience
IP-Based ServicesIP-Based Services
NextGen OffersNextGen Offers
Legacy ServicesLegacy Services
Product Migration Enables Differentiated Offers For Both Segments – Especially Business Product Migration Enables Differentiated Offers For Both Segments – Especially Business
Consumer Business Consumer Business Consumer BusinessVoice Voice 7MB,11MB HSI High Speed DIA Video Find Me / Follow Me LD LD Unified Messg Ethernet Cons VoIP Unified Comm3MB HSI 3MB HSI IP VPN 3 Screens Multimedia Conf
Centrex Managed Svcs Enhanced Call CtrsData Network SIP Services Wireless Open DevVoice Trunking IP Centrex Managed Apps
21
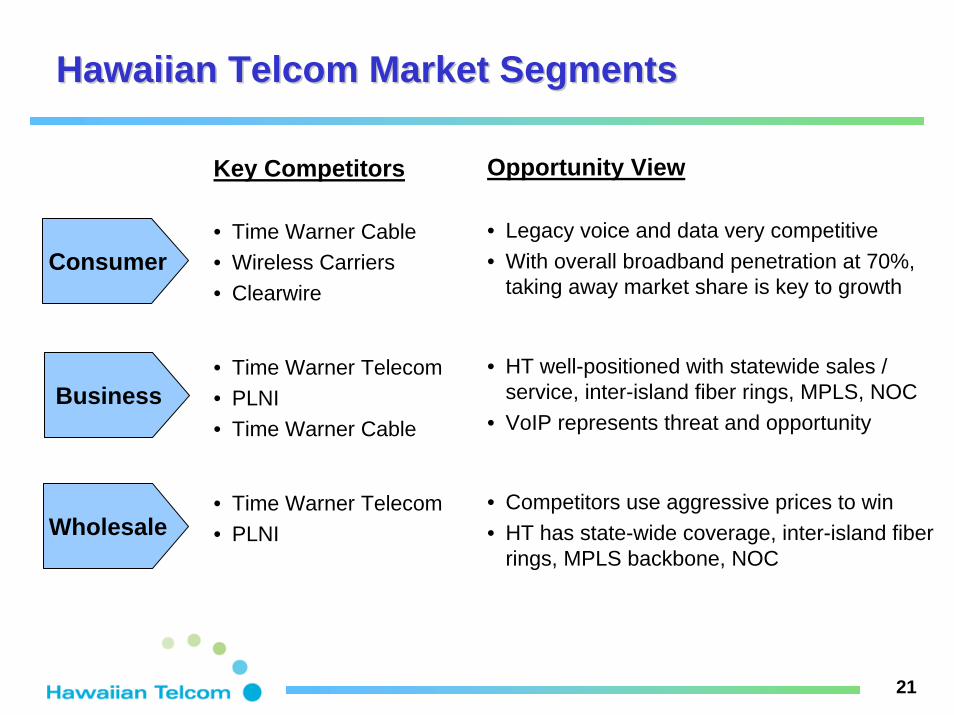
Hawaiian Telcom Market SegmentsHawaiian Telcom Market Segments
Consumer
Key Competitors
• Time Warner Cable• Wireless Carriers• Clearwire
• Time Warner Telecom• PLNI• Time Warner Cable
• Time Warner Telecom• PLNI
Opportunity View
• Legacy voice and data very competitive• With overall broadband penetration at 70%,
taking away market share is key to growth
• HT well-positioned with statewide sales / service, inter-island fiber rings, MPLS, NOC
• VoIP represents threat and opportunity
• Competitors use aggressive prices to win• HT has state-wide coverage, inter-island fiber
rings, MPLS backbone, NOC
Business
Wholesale
22
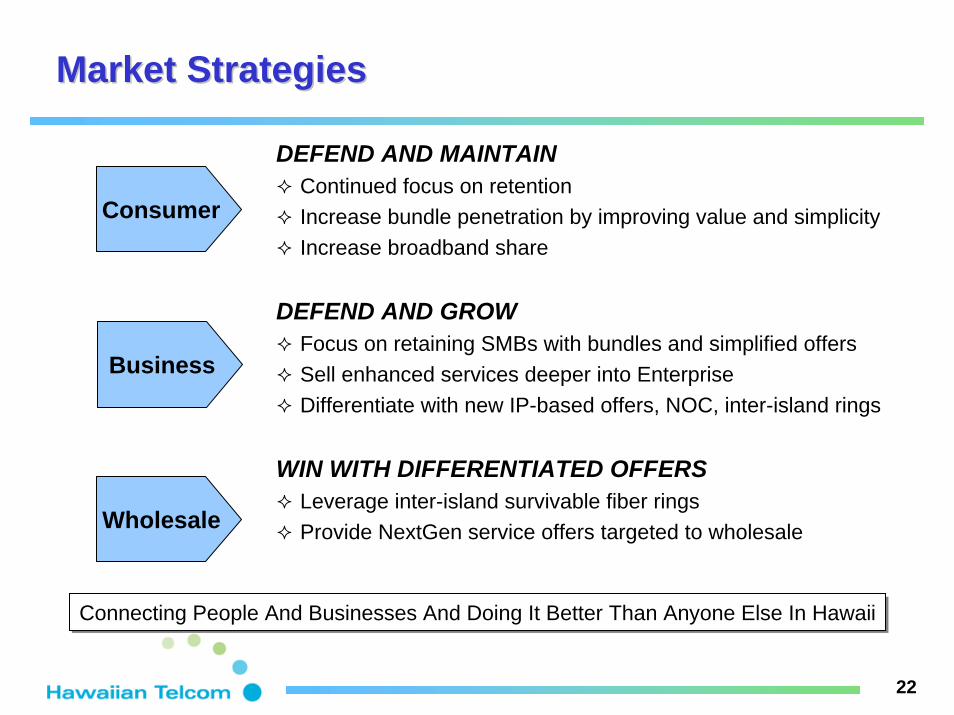
Market StrategiesMarket Strategies
DEFEND AND MAINTAINContinued focus on retentionIncrease bundle penetration by improving value and simplicityIncrease broadband share
DEFEND AND GROWFocus on retaining SMBs with bundles and simplified offersSell enhanced services deeper into EnterpriseDifferentiate with new IP-based offers, NOC, inter-island rings
WIN WITH DIFFERENTIATED OFFERSLeverage inter-island survivable fiber ringsProvide NextGen service offers targeted to wholesale
Connecting People And Businesses And Doing It Better Than Anyone Else In HawaiiConnecting People And Businesses And Doing It Better Than Anyone Else In Hawaii
Consumer
Business
Wholesale

Regulatory UpdateRegulatory UpdateAlan Oshima, SVP & General CounselAlan Oshima, SVP & General Counsel

24
Regulatory UpdateRegulatory Update
PUC Service Quality Investigation
Credit Revolver Increase Proceeding
Federal USF Waivers
FCC Pricing Flexibility Filing
State Department of Commerce and Consumer Affairs Video Franchise

Financial ReviewFinancial ReviewRobert Reich, SVP & interim Chief Financial OfficerRobert Reich, SVP & interim Chief Financial Officer

26
Fourth Quarter 2007 ResultsFourth Quarter 2007 Results
($ in millions) 4Q06 3Q07 4Q07 Q-o-Q Y-o-Y
Revenues $124.6 $120.4 $116.4 (3.3%) (6.6%)
Operating Expenses, excluding D&A $83.2 $80.2 $86.8 (8.3%) (4.4%)
Adjusted EBITDA $41.5 $40.2 $29.6 (26.5%) (28.7%)% Margin 33.3% 33.4% 25.4%
Non-Recurring Costs 9.9 7.1 12.1 (70.2%) (23.0%)
EBITDA $31.6 $33.1 $17.4 (47.3%) (44.8%)% Margin 25.4% 27.5% 15.0%
Credit Agreement LTM EBITDA NM $217.5 $190.1 (12.6%) NM
Capital Expenditures $22.9 $27.6 $27.7 (0.3%) (21.0%)
F/(U)

27
Full Year 2007 ResultsFull Year 2007 Results
F/(U)($ in millions) 2006 2007 Y-o-Y
Revenues $503.1 $483.7 (3.9%)
Operating Expenses, excluding D&A $347.1 $326.3 6.0%
Adjusted EBITDA $156.0 $157.3 0.8%% Margin 31.0% 32.5%
Non-Recurring Costs 47.1 37.2 21.0%
EBITDA $108.9 $120.1 10.3%% Margin 21.6% 24.8%
Credit Agreement LTM EBITDA NM $190.1 NM
Capital Expenditures $106.9 $97.6 8.6%

28
CapitalizationCapitalization
($ in millions)12/31/07 Prepayment Drawdown Pro Forma
Cash $281.2 ($261.0) $83.0 $103.2
Revolving Credit Facility (L+225/250) $57.0 ($50.0) $83.0 $90.0Term Loan C (L+225) $695.7 ($211.0) $0.0 $484.7
Total Secured Debt $752.7 ($261.0) $83.0 $574.7
Senior Floating Rate Notes $150.0 $0.0 $0.0 $150.09.75% Senior Fixed Rate Notes $200.0 $0.0 $0.0 $200.0
Total Senior Debt $350.0 $0.0 $0.0 $350.012.5% Senior Subordinated Notes $150.0 $0.0 $0.0 $150.0
Total Debt $1,252.7 ($261.0) $83.0 $1,074.7
Financial Highlights (LTM)Credit Agreement EBITDA $190.1 $190.1
Credit StatisticsNet Secured Debt / Credit Agreement EBITDA 2.5x 2.5xNet Senior Debt / Credit Agreement EBITDA 4.3x 4.3xTotal Net Debt / Credit Agreement EBITDA 5.1x 5.1x
Pro Forma for Prepayment & Drawdown

29
$64.6 $62.8
$22.7 $11.7
$23.0$19.6
20%21%
$-
$20.0
$40.0
$60.0
$80.0
$100.0
$120.0
2006 20070%
5%10%
15%
20%
25%30%
35%
Network Back Office & IT Other CapEx % of Revenues
$106.9$97.6
Capital ExpendituresCapital Expenditures
Total CapEx (mil.)

Public Q&APublic Q&A