haul & load – practical cost reduction - … · purpose and goal a test where’s the money?...
TRANSCRIPT

Haul & Load – Practical Cost ReductionVolvo Construction Equipment
� Purpose and Goal
� A Test
� Where’s the Money?
� Examples of practical cost improvement ‘today’
� Examples of practical cost improvement for ‘tomorrow’
� Conclusion
Course Agenda
Course Purpose� Quick-hitting ideas to improve productivity
or lower costs in your current mobile fleet.
� Important ! This is an open dialogue not a lecture.
Practical Cost ReductionHaul & Load
Course Goal� Take home at least 2-3 ideas for basic but
significant process improvement in your operations.
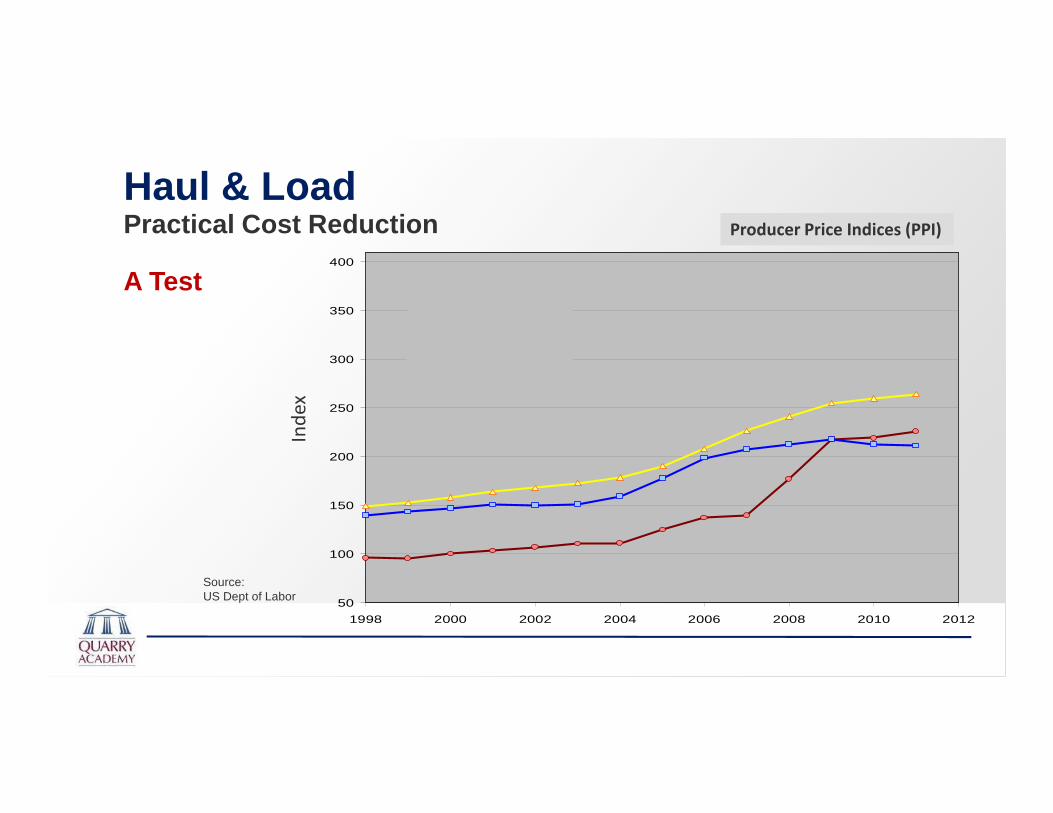
A Test
Practical Cost ReductionHaul & Load
50
100
150
200
250
300
350
400
1998 2000 2002 2004 2006 2008 2010 2012
Prepared Asphalt
RMC
Crushed Stone
Producer Price Indices (PPI)
Source: US Dept of Labor
Index
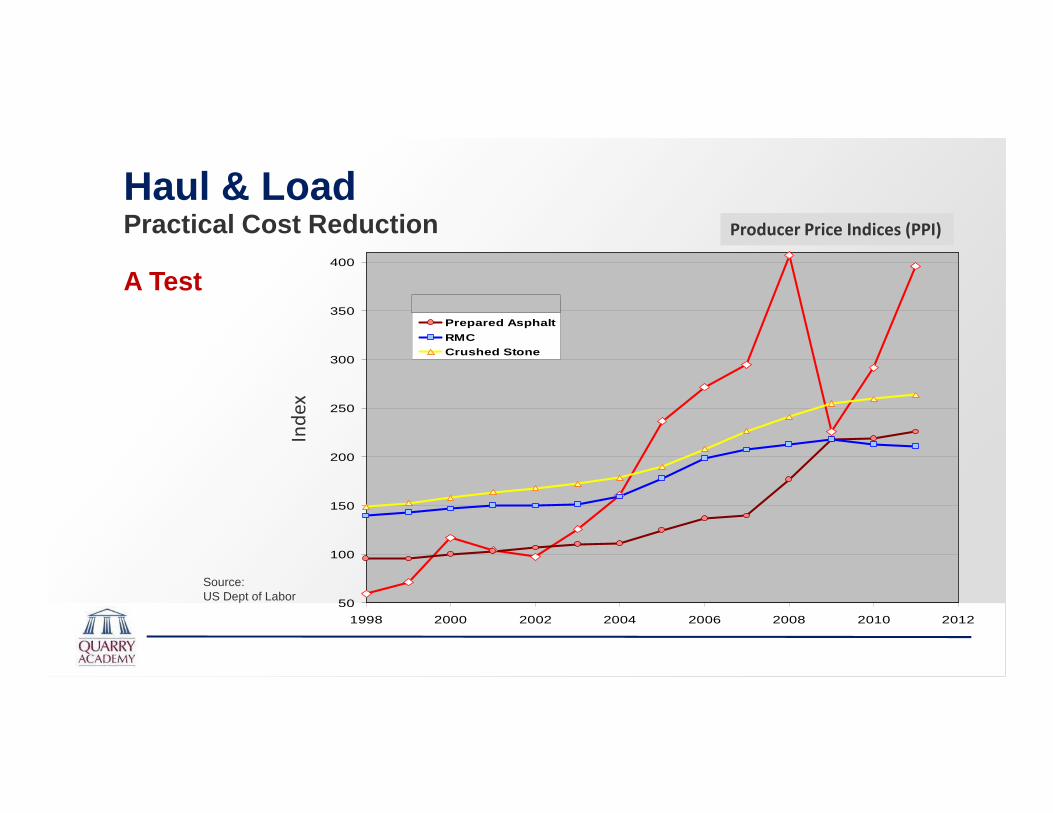
A Test
Practical Cost ReductionHaul & Load
Producer Price Indices (PPI)
Index
50
100
150
200
250
300
350
400
1998 2000 2002 2004 2006 2008 2010 2012
DieselPrepared Asphalt
RMCCrushed Stone
Source: US Dept of Labor

Managing Costs� Business viability or Out of Business
� Competitive advantage ?
Practical Cost ReductionHaul & Load
Ways to improve operationally� Change what you do ,
� Change how you do it,
� Change what you use to do it
Conclusion� Prices >> Moving in the right direction
� Cost >> Moving also and with higher fluctuation
- Considering the tough market, your priority needs to be on what you can do “today” or in the short term.
- Success in this area should create breathing space for more long-term or structural improvements to your operations.
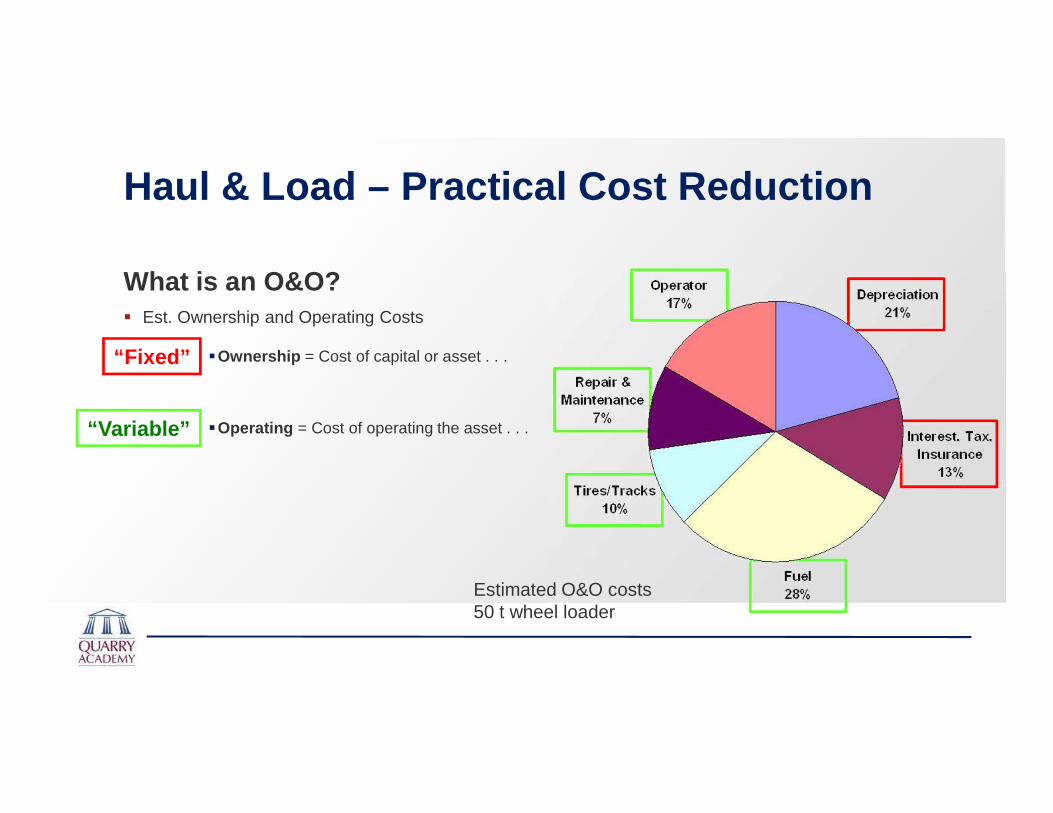
What is an O&O?
Haul & Load – Practical Cost Reduction
“Fixed”
“Variable”
� Est. Ownership and Operating Costs
�Ownership = Cost of capital or asset . . .
�Operating = Cost of operating the asset . . .
Estimated O&O costs50 t wheel loader
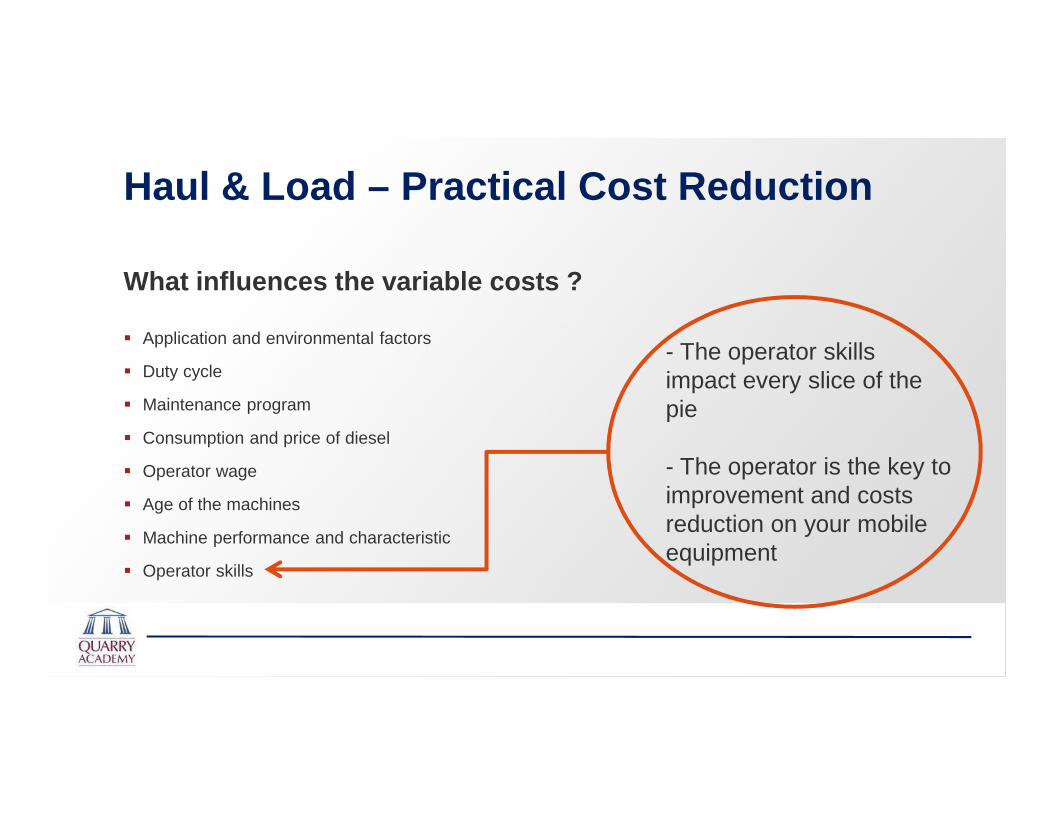
What influences the variable costs ?
Haul & Load – Practical Cost Reduction
� Application and environmental factors
� Duty cycle
� Maintenance program
� Consumption and price of diesel
� Operator wage
� Age of the machines
� Machine performance and characteristic
� Operator skills
- The operator skills impact every slice of the pie
- The operator is the key to improvement and costs reduction on your mobile equipment
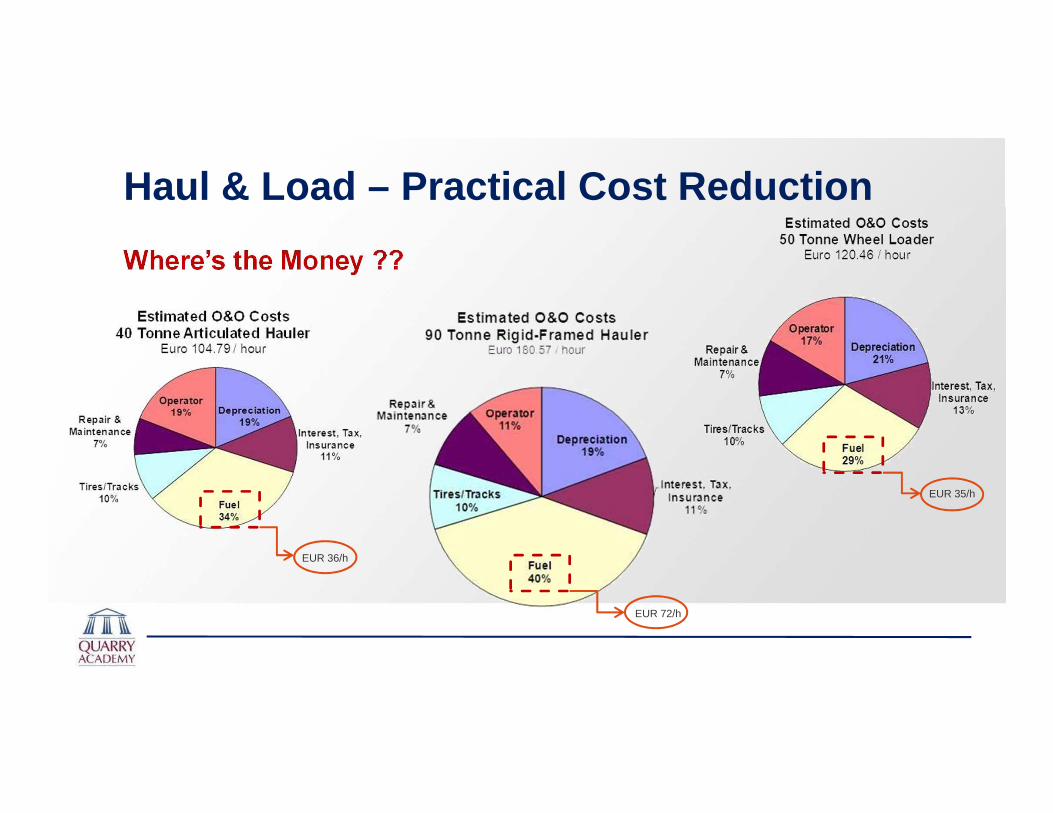
Where’s the Money ??
Haul & Load – Practical Cost Reduction
EUR 36/h
EUR 72/h
EUR 35/h
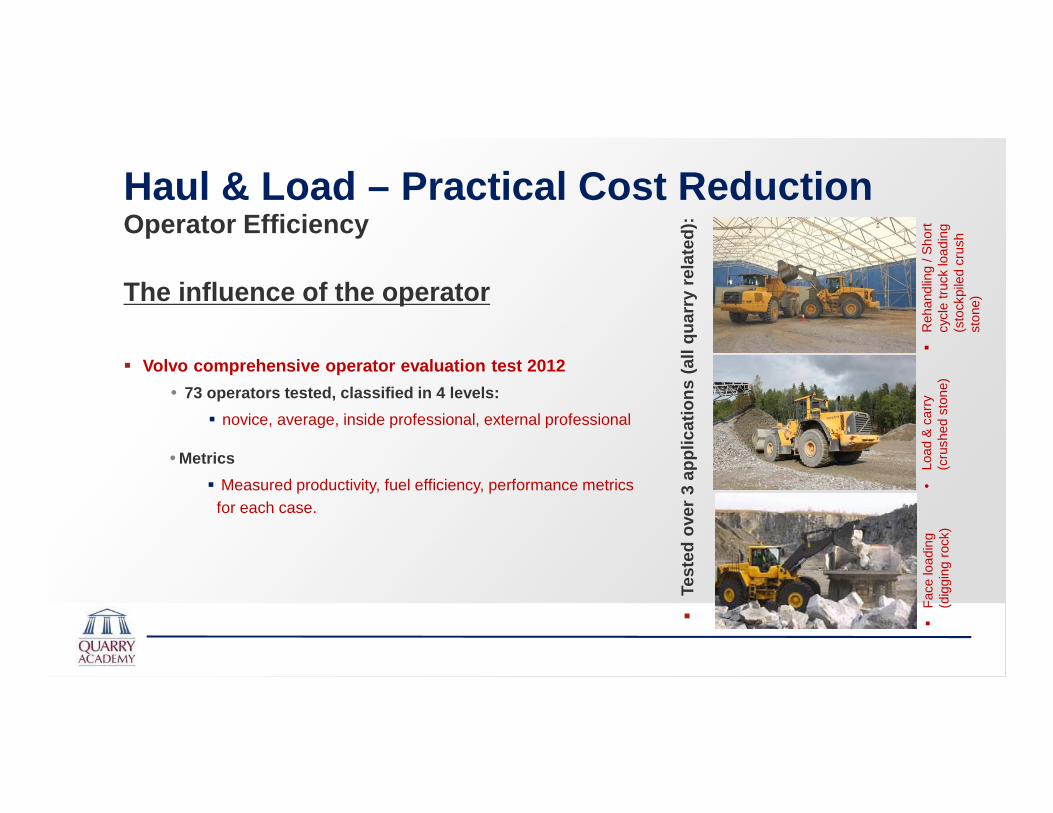
The influence of the operator
Haul & Load – Practical Cost ReductionOperator Efficiency
� Volvo comprehensive operator evaluation test 2012
• 73 operators tested, classified in 4 levels:
� novice, average, inside professional, external professional
�Te
sted
ove
r 3
appl
icat
ions
(al
l qua
rry
rela
ted)
:
• Metrics
� Measured productivity, fuel efficiency, performance metrics for each case.
�R
ehan
dlin
g/ S
hort
cy
cle
truc
k lo
adin
g (s
tock
pile
d cr
ush
ston
e)
•Lo
ad &
car
ry
(cru
shed
sto
ne)
�F
ace
load
ing
(dig
ging
roc
k)
0 100 200 300 400 500 600 700 800 9000
5
10
15
20
25
ton/h
ton/
l
SLC rock
EP
IPIA
IR
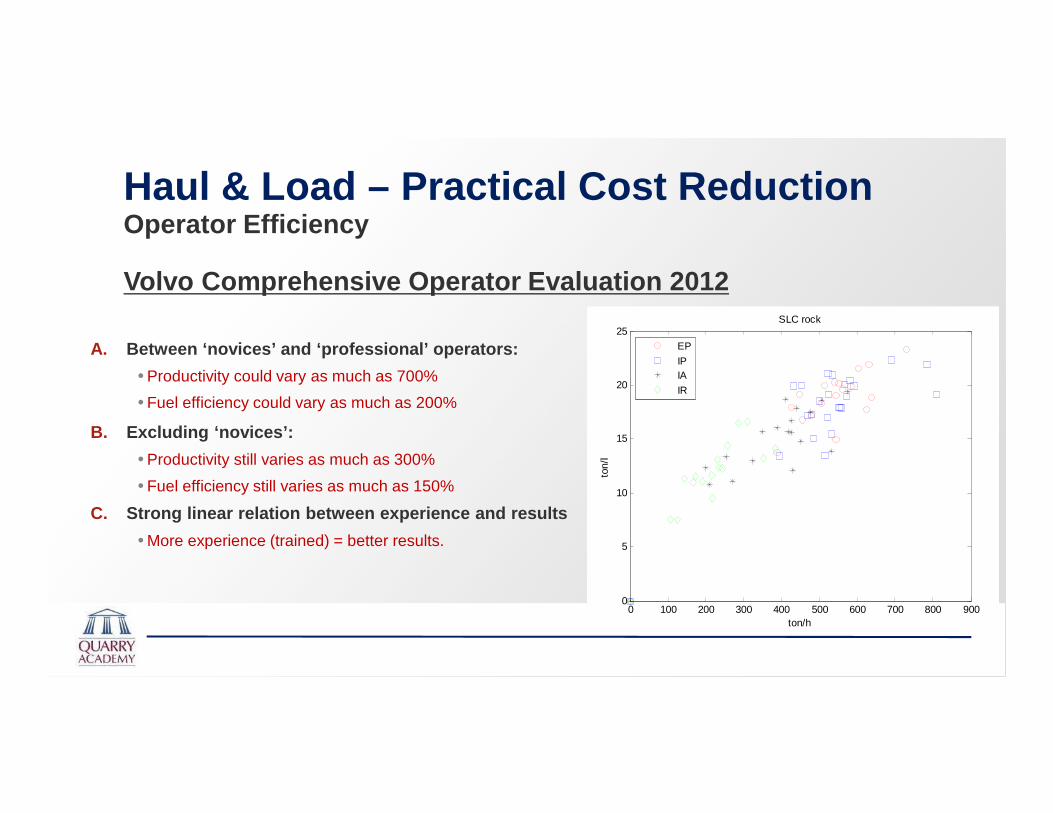
Volvo Comprehensive Operator Evaluation 2012
Haul & Load – Practical Cost ReductionOperator Efficiency
A. Between ‘novices’ and ‘professional’ operators:
• Productivity could vary as much as 700%
• Fuel efficiency could vary as much as 200%
B. Excluding ‘novices’:
• Productivity still varies as much as 300%
• Fuel efficiency still varies as much as 150%
C. Strong linear relation between experience and resul ts
• More experience (trained) = better results.
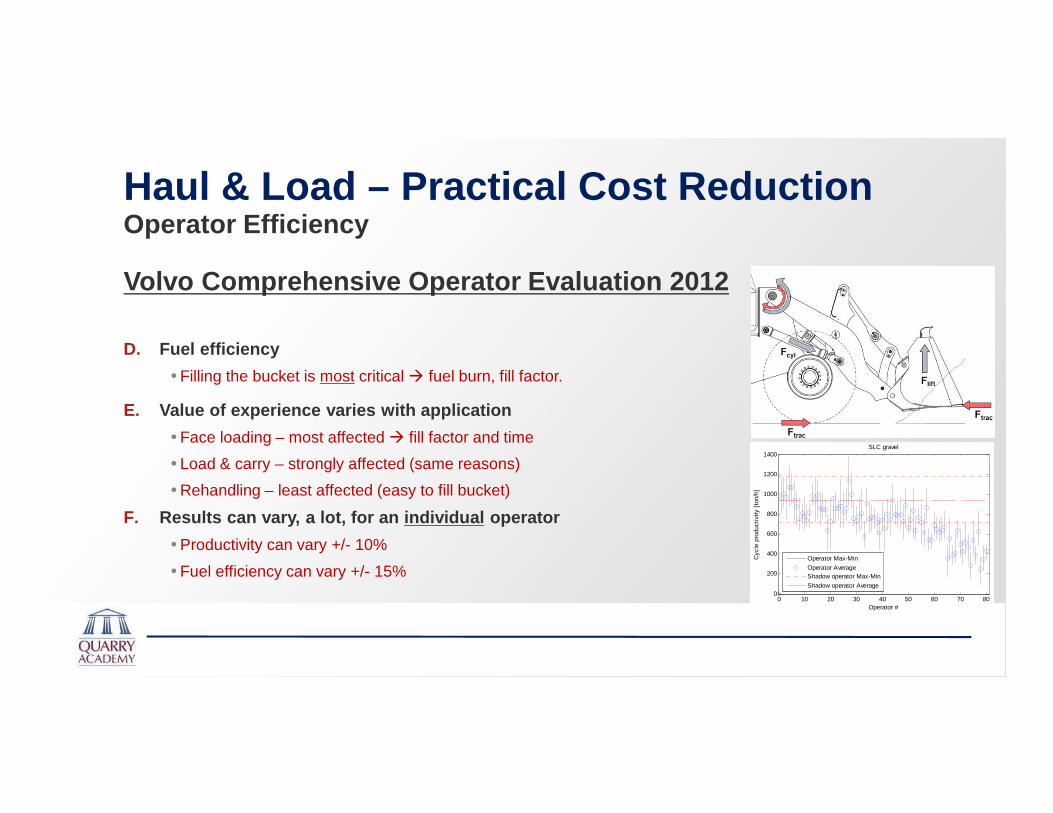
Volvo Comprehensive Operator Evaluation 2012
Haul & Load – Practical Cost ReductionOperator Efficiency
D. Fuel efficiency
• Filling the bucket is most critical � fuel burn, fill factor.
0 10 20 30 40 50 60 70 800
200
400
600
800
1000
1200
1400
Operator #
Cyc
le p
rodu
ctiv
ity [
ton/
h]
SLC gravel
Operator Max-Min
Operator AverageShadow operator Max-Min
Shadow operator Average
E. Value of experience varies with application
• Face loading – most affected � fill factor and time
• Load & carry – strongly affected (same reasons)
• Rehandling – least affected (easy to fill bucket)
F. Results can vary, a lot, for an individual operator
• Productivity can vary +/- 10%
• Fuel efficiency can vary +/- 15%
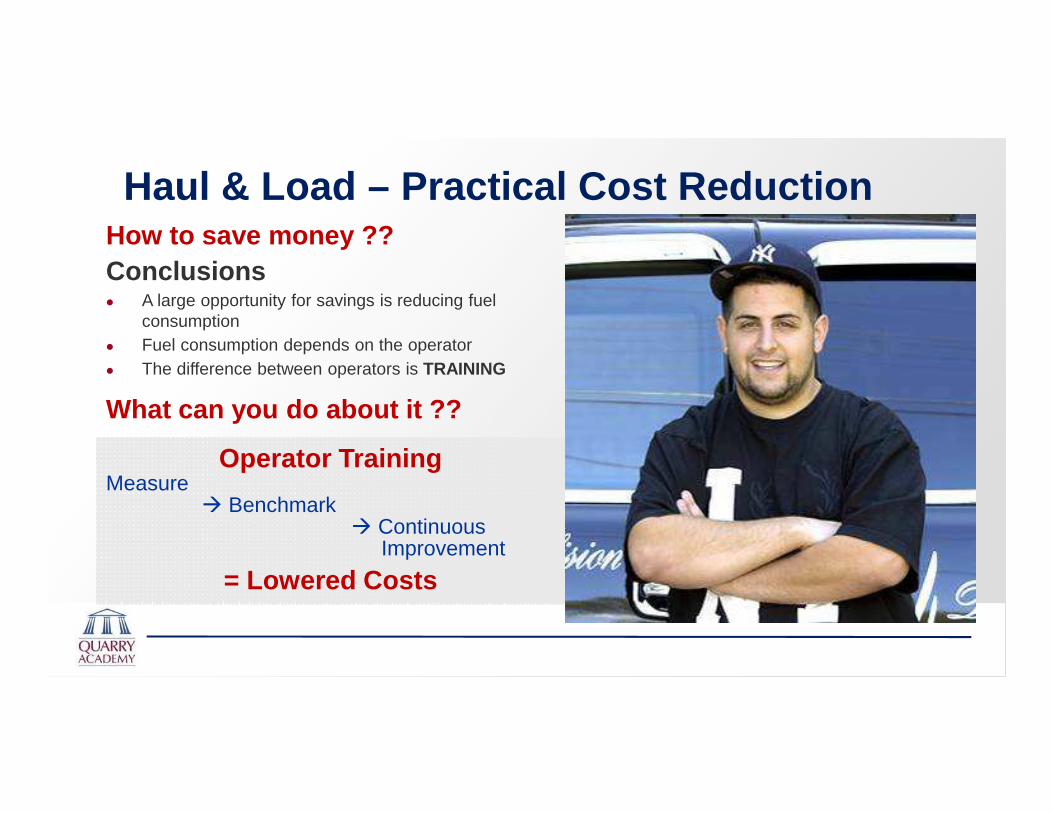
How to save money ??
Haul & Load – Practical Cost Reduction
Conclusions� A large opportunity for savings is reducing fuel
consumption� Fuel consumption depends on the operator� The difference between operators is TRAINING
Operator TrainingMeasure
� Benchmark� Continuous
Improvement
= Lowered Costs
What can you do about it ??
Haul & Load – Practical Cost Reduction
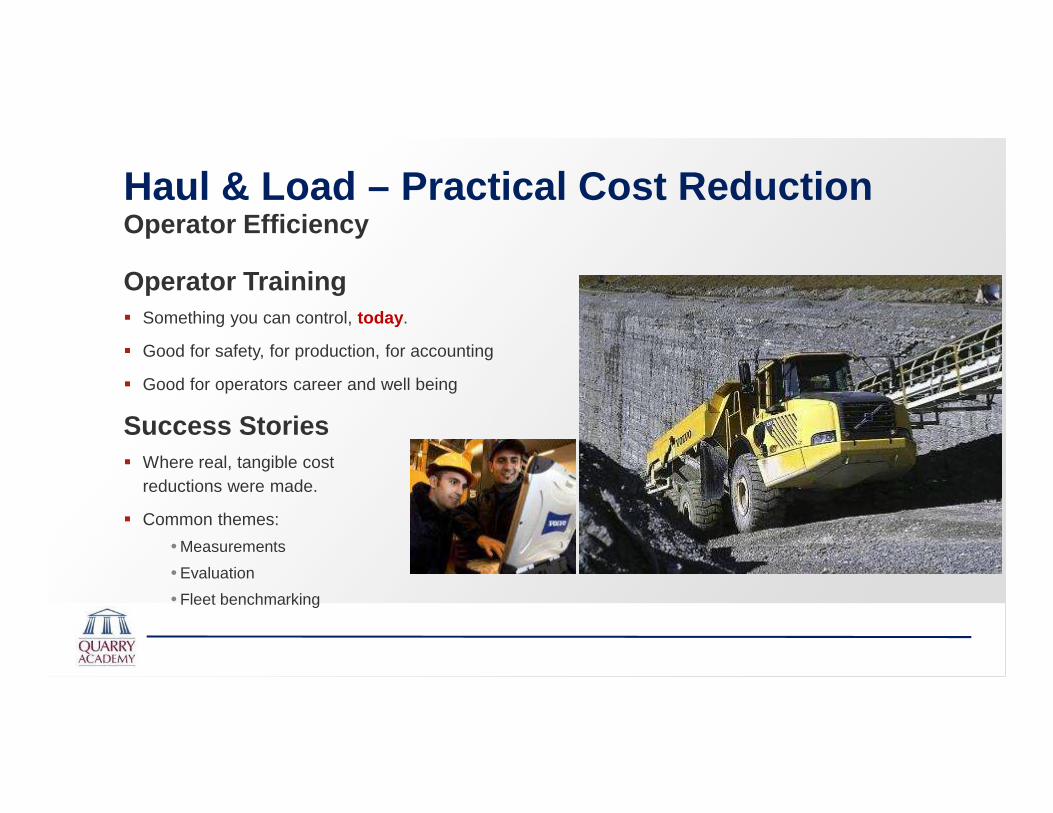
Operator Training� Something you can control, today .
� Good for safety, for production, for accounting
� Good for operators career and well being
Success Stories� Where real, tangible cost
reductions were made.
� Common themes:
• Measurements
• Evaluation
• Fleet benchmarking
Operator Efficiency
Haul & Load – Practical Cost Reduction
Example #1 Sand Plant – 5 wheel loaders (L110)� Cost improvement desired by owner
Operator Efficiency
� Actions Taken
• Contacted the local dealer
• Reviewed machine data history
• Made a plan
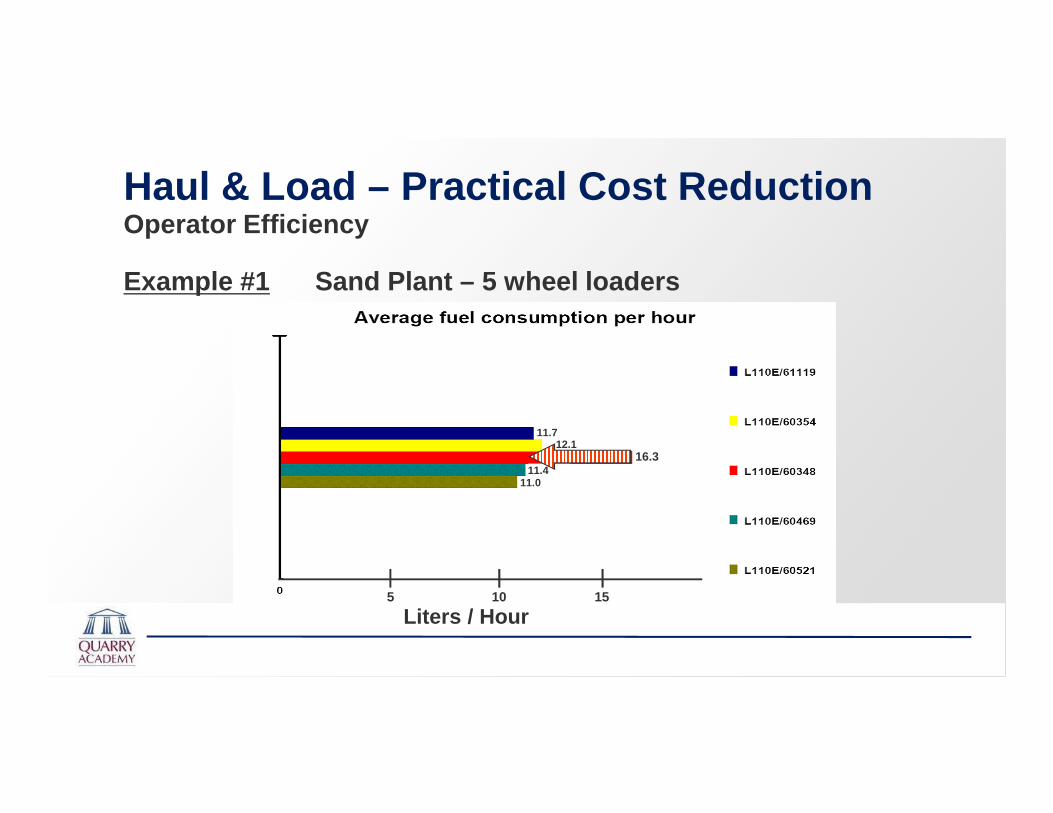
Example #1 Sand Plant – 5 wheel loaders
Liters / Hour
12.111.7
16.311.4
11.0
105 15
Haul & Load – Practical Cost ReductionOperator Efficiency
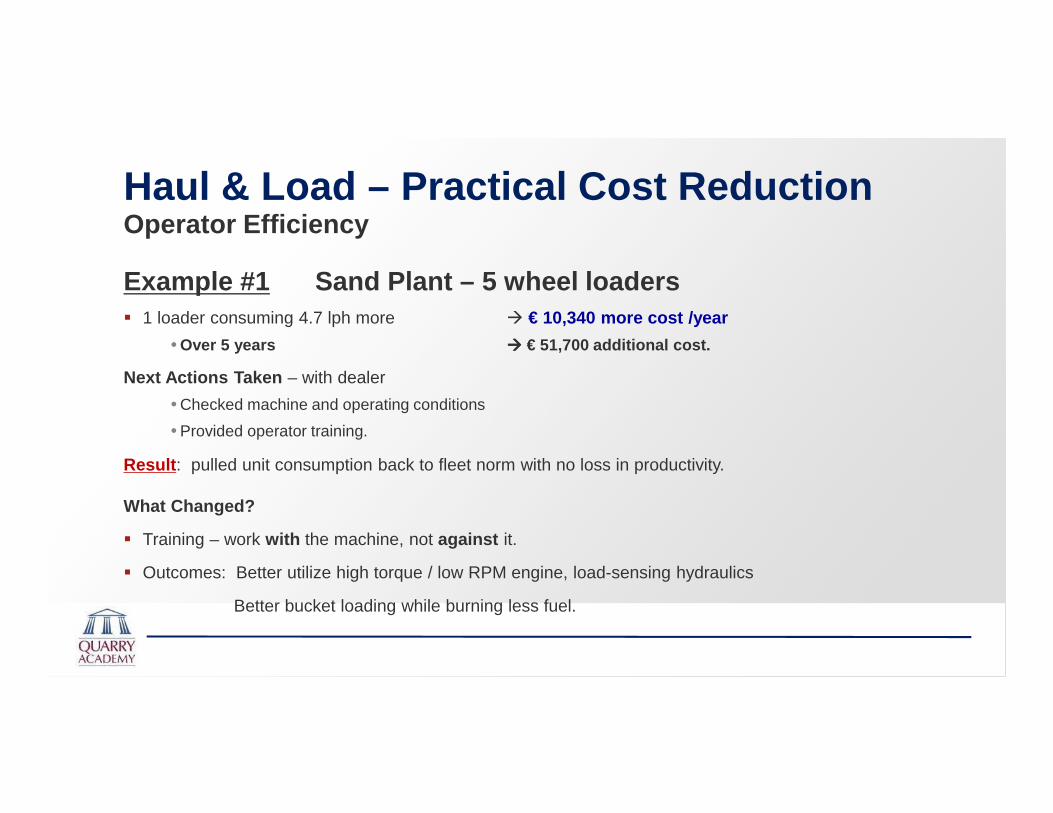
Example #1 Sand Plant – 5 wheel loaders� 1 loader consuming 4.7 lph more � € 10,340 more cost /year
• Over 5 years ���� € 51,700 additional cost.
Haul & Load – Practical Cost ReductionOperator Efficiency
Next Actions Taken – with dealer
• Checked machine and operating conditions
• Provided operator training.
What Changed?
� Training – work with the machine, not against it.
� Outcomes: Better utilize high torque / low RPM engine, load-sensing hydraulics
Better bucket loading while burning less fuel.
Result : pulled unit consumption back to fleet norm with no loss in productivity.
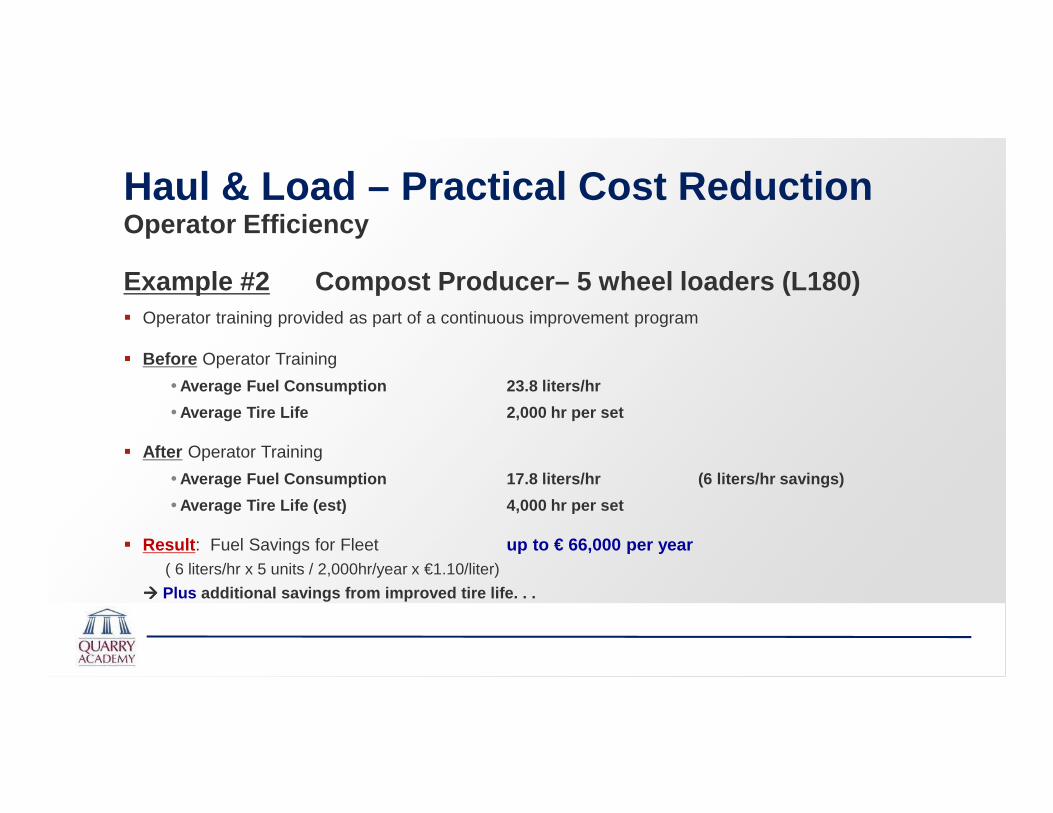
Example #2 Compost Producer– 5 wheel loaders (L180)� Operator training provided as part of a continuous improvement program
Haul & Load – Practical Cost ReductionOperator Efficiency
� Before Operator Training
• Average Fuel Consumption 23.8 liters/hr
• Average Tire Life 2,000 hr per set
� After Operator Training
• Average Fuel Consumption 17.8 liters/hr (6 liters/hr s avings)
• Average Tire Life (est) 4,000 hr per set
� Result : Fuel Savings for Fleet up to € 66,000 per year( 6 liters/hr x 5 units / 2,000hr/year x €1.10/liter)
���� Plus additional savings from improved tire life. . .
Example #2 Compost Producer– 5 wheel loadersWhat Changed?
Haul & Load – Practical Cost ReductionOperator Efficiency
� Recurring “pedal to the metal” mentality
• Expensive in fuel and noise, but
• Also tire life and component life.
� Utilized on-board data
• Targeted the training
• Validated the improvement
• Quantified the improvement.
� facts-based business case, not opinion.
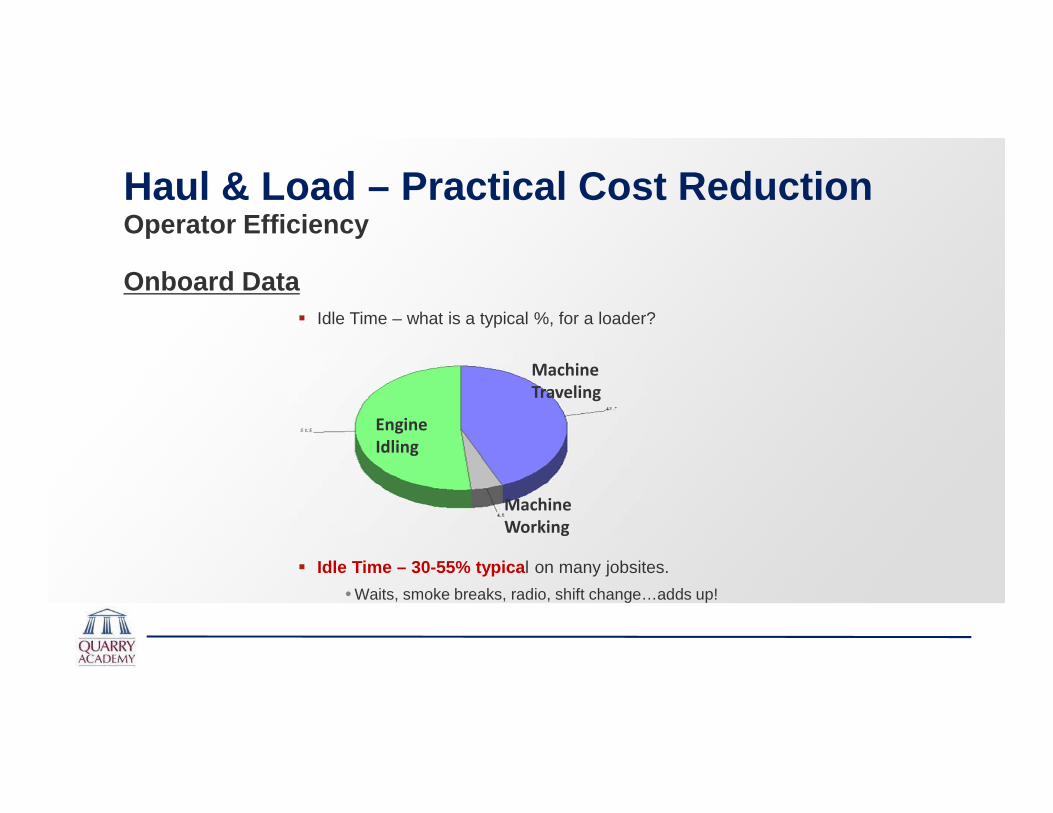
Onboard Data
Engine
Idling
Machine
Working
Machine
Traveling
� Idle Time – 30-55% typica l on many jobsites.
• Waits, smoke breaks, radio, shift change…adds up!
� Idle Time – what is a typical %, for a loader?
Haul & Load – Practical Cost ReductionOperator Efficiency
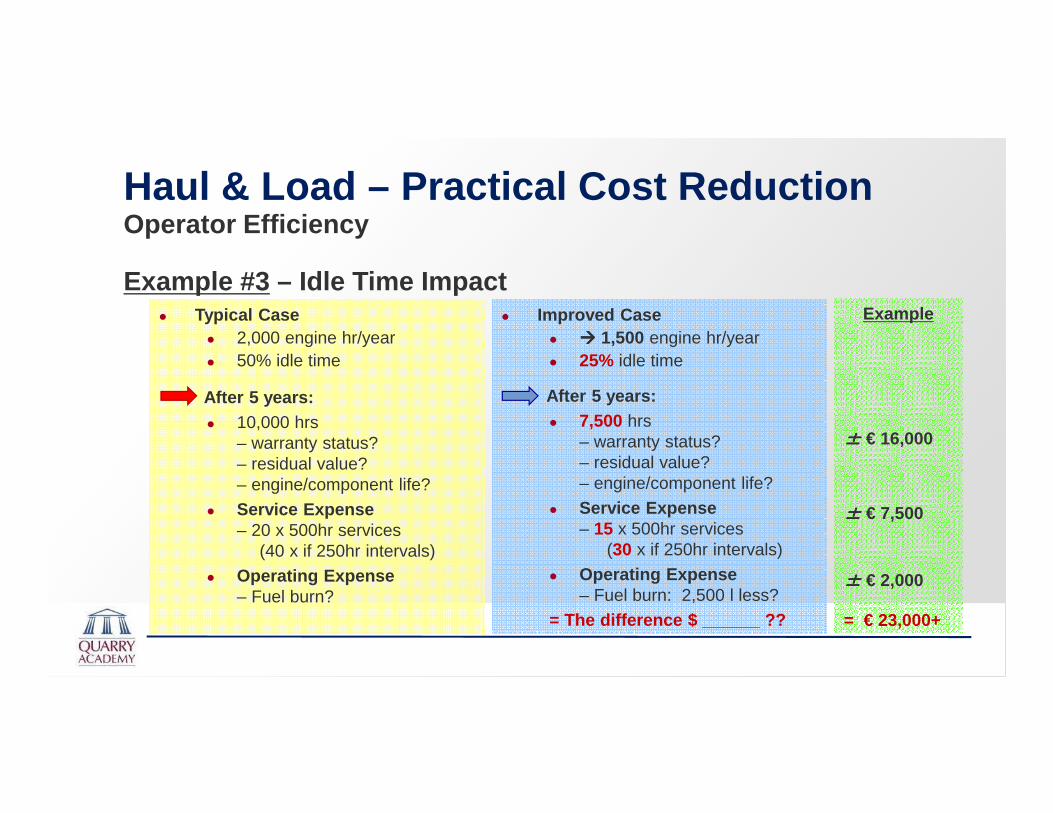
Example #3 – Idle Time Impact� Improved Case
� ���� 1,500 engine hr/year� 25% idle time
After 5 years:� 7,500 hrs
– warranty status? – residual value?– engine/component life?
� Service Expense– 15 x 500hr services
(30 x if 250hr intervals)� Operating Expense
– Fuel burn: 2,500 l less?= The difference $ ______ ??
Example
±±±± € 16,000
±±±± € 7,500
±±±± € 2,000
= € 23,000+
� Typical Case� 2,000 engine hr/year� 50% idle time
After 5 years:� 10,000 hrs
– warranty status? – residual value?– engine/component life?
� Service Expense– 20 x 500hr services
(40 x if 250hr intervals)� Operating Expense
– Fuel burn?
Haul & Load – Practical Cost ReductionOperator Efficiency

� Working with grapples, busy jobsite, 3 shift operation
• Remote-monitoring showed 30% idle time.
Example #4 – Recycling Yard – 3 excavators (EC290)
Haul & Load – Practical Cost ReductionOperator Efficiency
� The owner made an operator incentive plan , to share any fuel savings over a 90 day test period .
Results
15% reduction in idle time� saved 11.4 liters/machine/day � 3,078 liters over the test period.
Reduced max engine RPM and utilized the auto-idle fe ature� saved 18.9 liters/machine/day � 5,103 liters over the test period.
Total = 8,181 liters less over 90 days � € 8,999 saved (€ 1.10/liter)
� extrapolate to 1 year = € 35,996. . . extrapolate to 5 years = € 179,982.
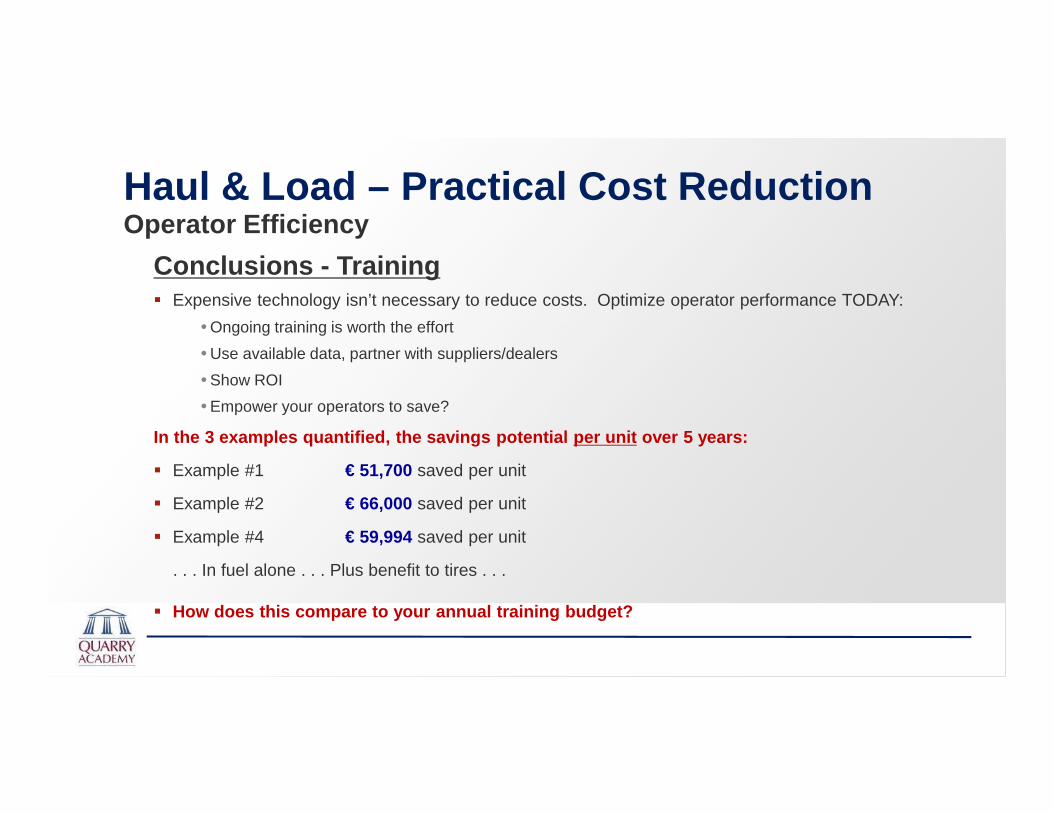
� Expensive technology isn’t necessary to reduce costs. Optimize operator performance TODAY:
• Ongoing training is worth the effort
• Use available data, partner with suppliers/dealers
• Show ROI
• Empower your operators to save?
Conclusions - Training
Haul & Load – Practical Cost ReductionOperator Efficiency
In the 3 examples quantified, the savings potential per unit over 5 years:
� Example #1 € 51,700 saved per unit
� Example #2 € 66,000 saved per unit
� Example #4 € 59,994 saved per unit
. . . In fuel alone . . . Plus benefit to tires . . .
� How does this compare to your annual training budge t?

Managing Costs� Business viability or Out of Business
� Competitive advantage ?
Practical Cost ReductionHaul & Load
Ways to improve operationally� Change what you do ,
� Change how you do it,
� Change what you use to do it
Conclusion� Prices >> Moving in the right direction
� Cost >> Moving also and with higher fluctuation
NEXT !!
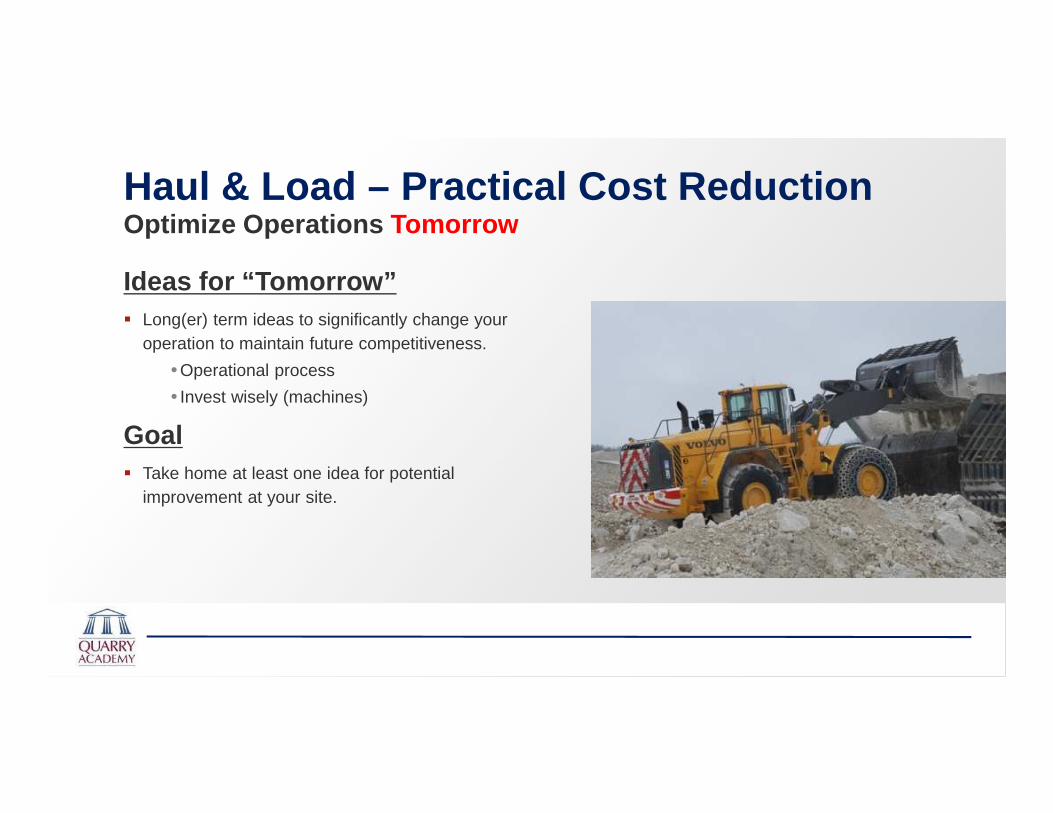
Haul & Load – Practical Cost ReductionOptimize Operations Tomorrow
Ideas for “Tomorrow”� Long(er) term ideas to significantly change your
operation to maintain future competitiveness.
• Operational process
• Invest wisely (machines)
Goal� Take home at least one idea for potential
improvement at your site.

Haul & Load – Practical Cost ReductionOptimize Operations
Example #5 – Truck Loading
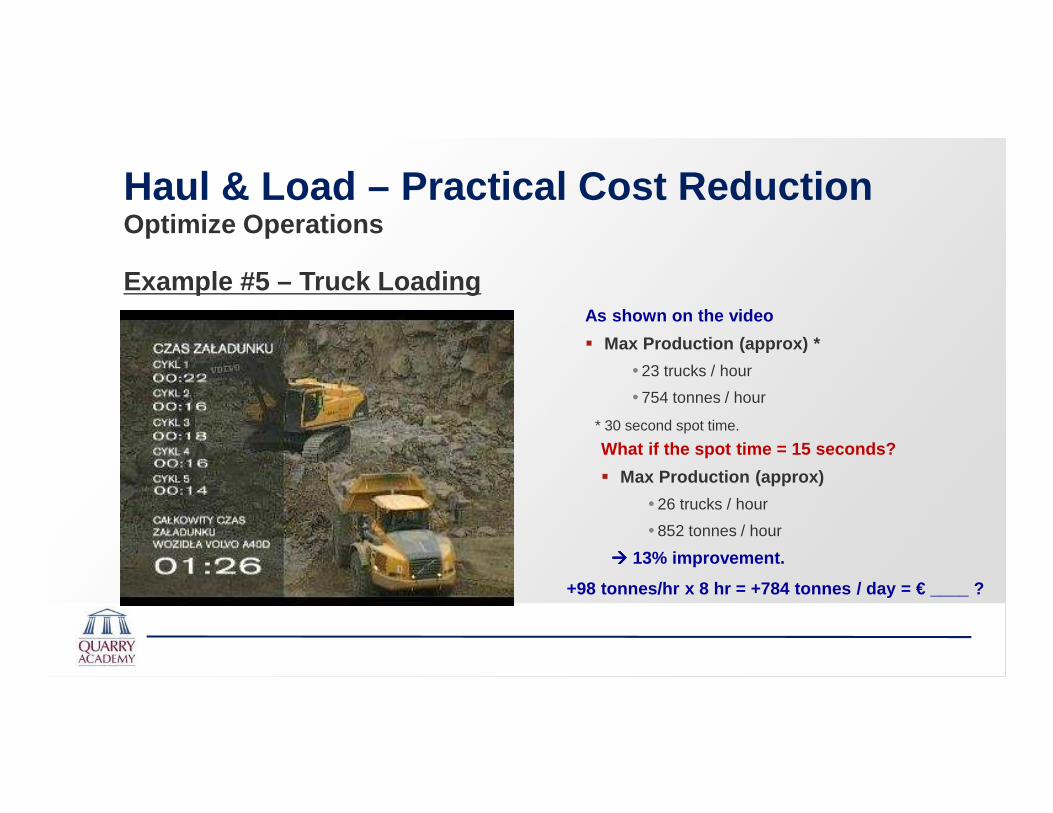
Haul & Load – Practical Cost ReductionOptimize Operations
Example #5 – Truck LoadingAs shown on the video
� Max Production (approx) *
• 23 trucks / hour
• 754 tonnes / hour
* 30 second spot time.
+98 tonnes/hr x 8 hr = +784 tonnes / day = € ____ ?
What if the spot time = 15 seconds?
� Max Production (approx)
• 26 trucks / hour
• 852 tonnes / hour
���� 13% improvement.
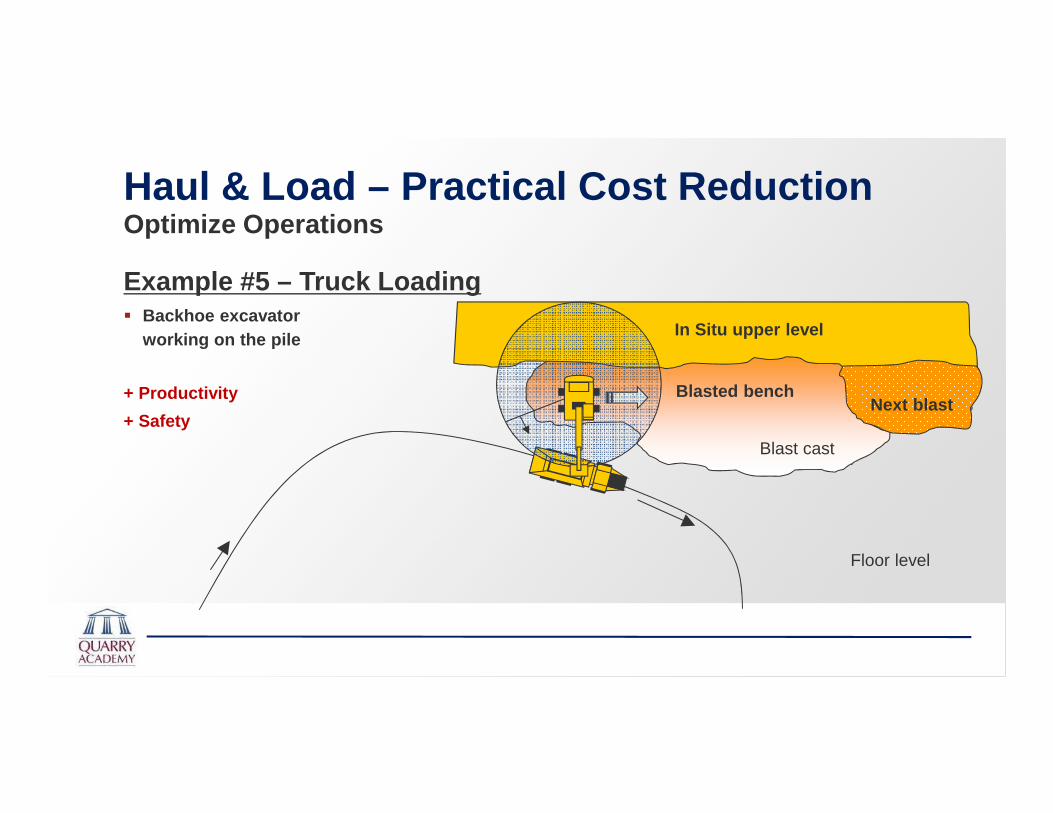
Haul & Load – Practical Cost ReductionOptimize Operations
Example #5 – Truck Loading
In Situ upper level
Blasted bench
Blast cast
Floor level
Next blast
� Backhoe excavatorworking on the pile
+ Productivity
+ Safety
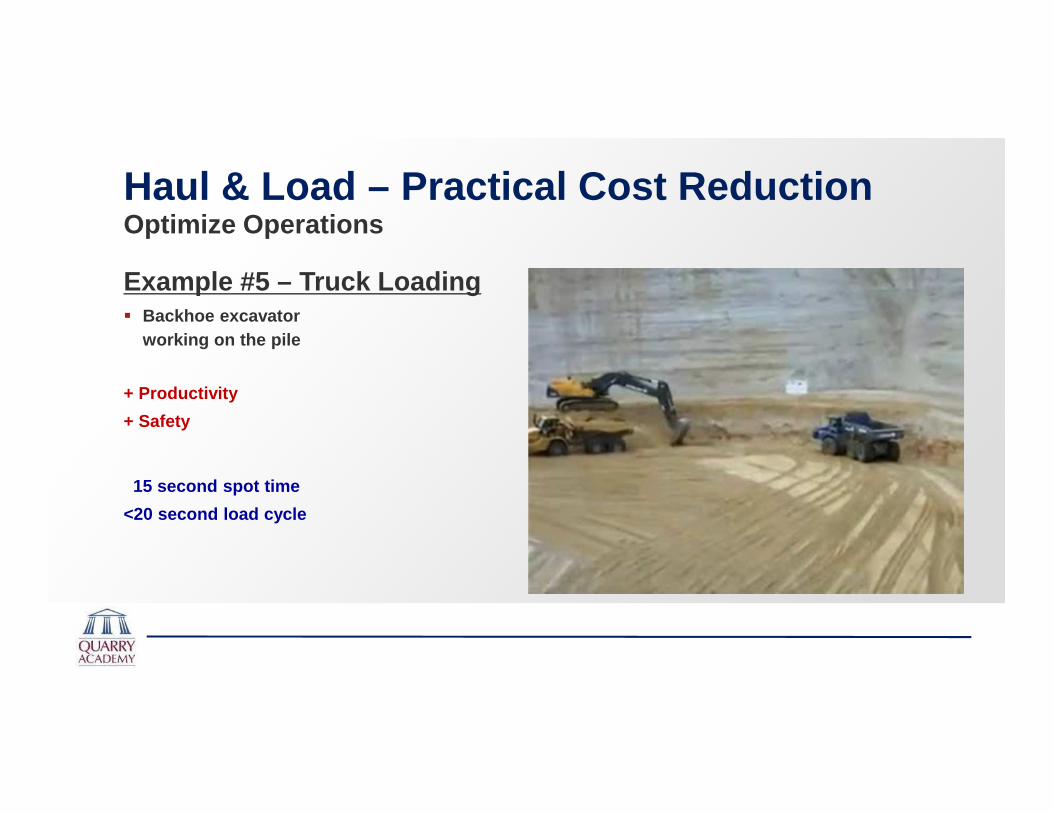
Haul & Load – Practical Cost ReductionOptimize Operations
Example #5 – Truck Loading� Backhoe excavator
working on the pile
+ Productivity
+ Safety
15 second spot time
<20 second load cycle
Haul & Load – Practical Cost ReductionOptimize Operations
Example #6 – Truck Payload� How many passes is best?
Haul & Load – Practical Cost ReductionOptimize Operations
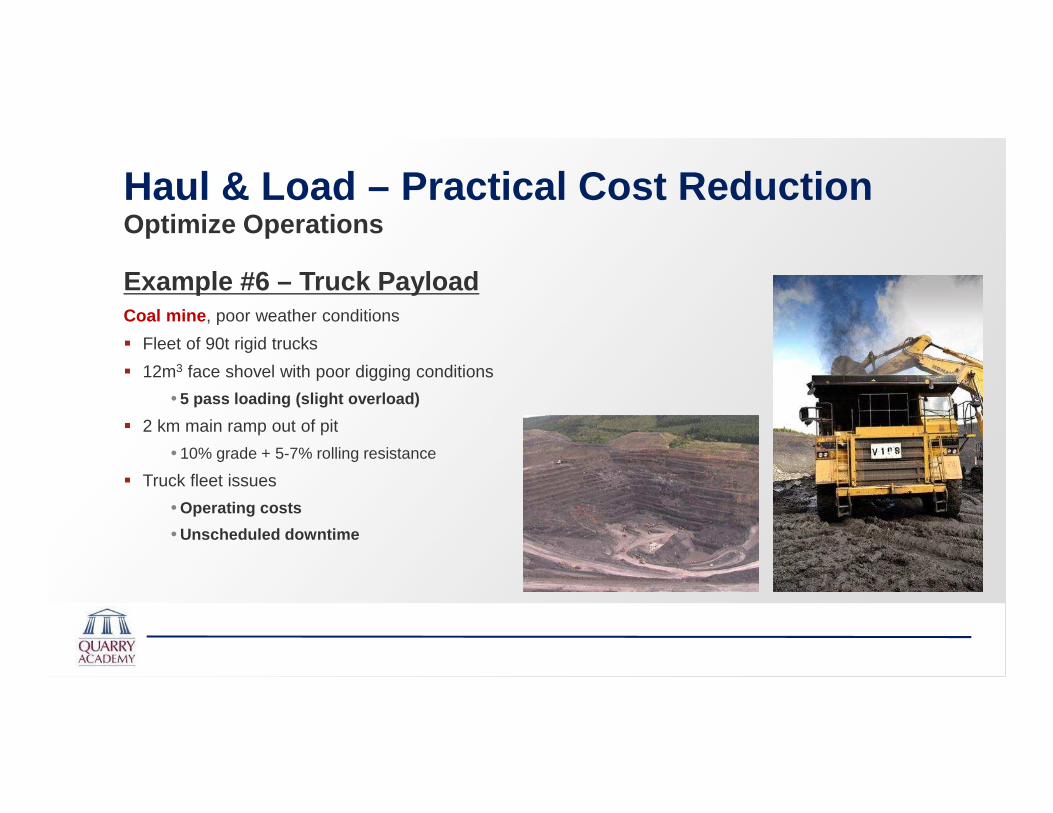
Example #6 – Truck PayloadCoal mine , poor weather conditions
� Fleet of 90t rigid trucks
� 12m3 face shovel with poor digging conditions
• 5 pass loading (slight overload)
� 2 km main ramp out of pit
• 10% grade + 5-7% rolling resistance
� Truck fleet issues
• Operating costs
• Unscheduled downtime

Haul & Load – Practical Cost ReductionOptimize Operations
Example #6 – Truck Payload
Haul & Load – Practical Cost ReductionOptimize Operations
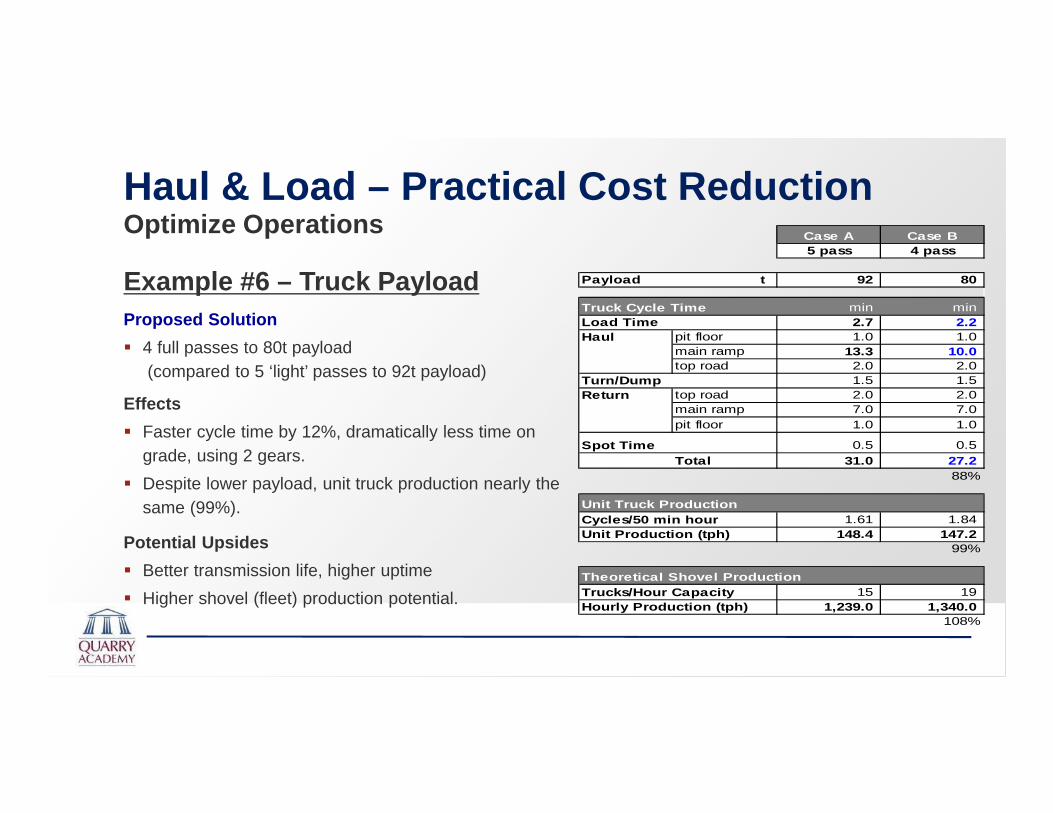
Example #6 – Truck PayloadProposed Solution
� 4 full passes to 80t payload(compared to 5 ‘light’ passes to 92t payload)
Case A Case B5 pass 4 pass
Payload t 92 80
Truck Cycle Time min minLoad Time 2.7 2.2 Haul pit floor 1.0 1.0
main ramp 13.3 10.0 top road 2.0 2.0
Turn/Dump 1.5 1.5 Return top road 2.0 2.0
main ramp 7.0 7.0 pit floor 1.0 1.0
Spot Time 0.5 0.5 Total 31.0 27.2
88%
Unit Truck ProductionCycles/50 min hour 1.61 1.84 Unit Production (tph) 148.4 147.2
99%
Theoretical Shovel ProductionTrucks/Hour Capacity 15 19 Hourly Production (tph) 1,239.0 1,340.0
108%
Effects
� Faster cycle time by 12%, dramatically less time on grade, using 2 gears.
� Despite lower payload, unit truck production nearly the same (99%).
Potential Upsides
� Better transmission life, higher uptime
� Higher shovel (fleet) production potential.
Haul & Load – Practical Cost ReductionOptimize Operations
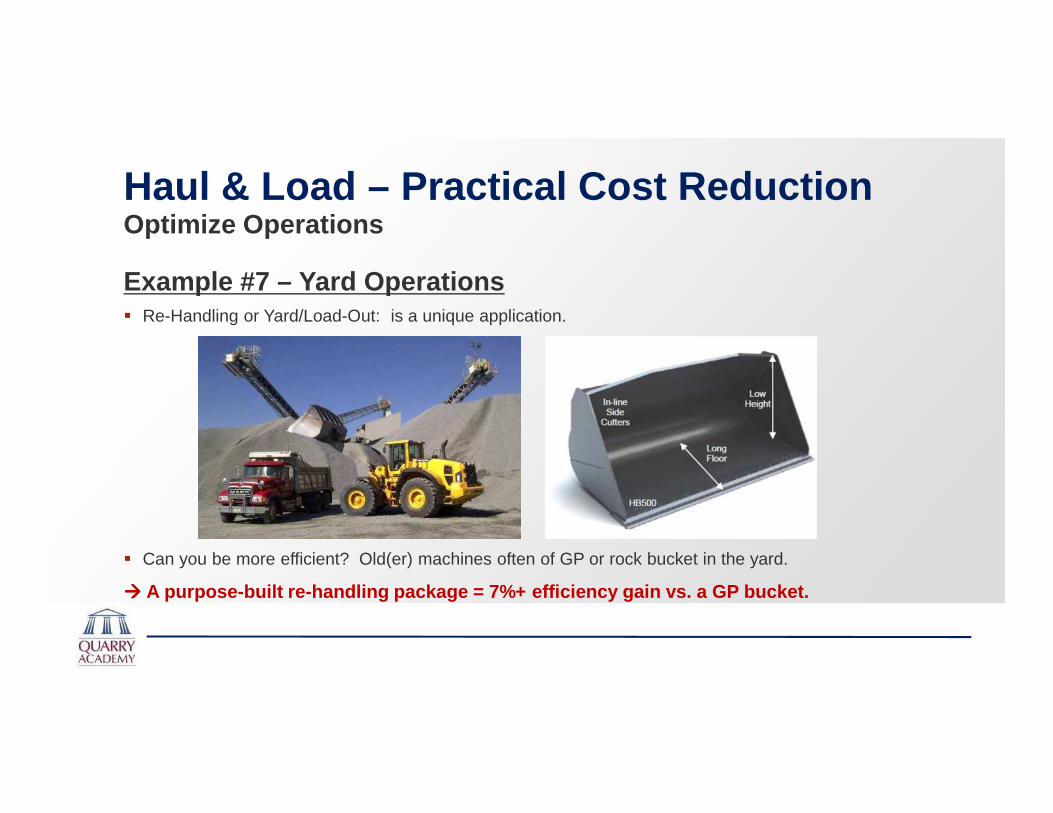
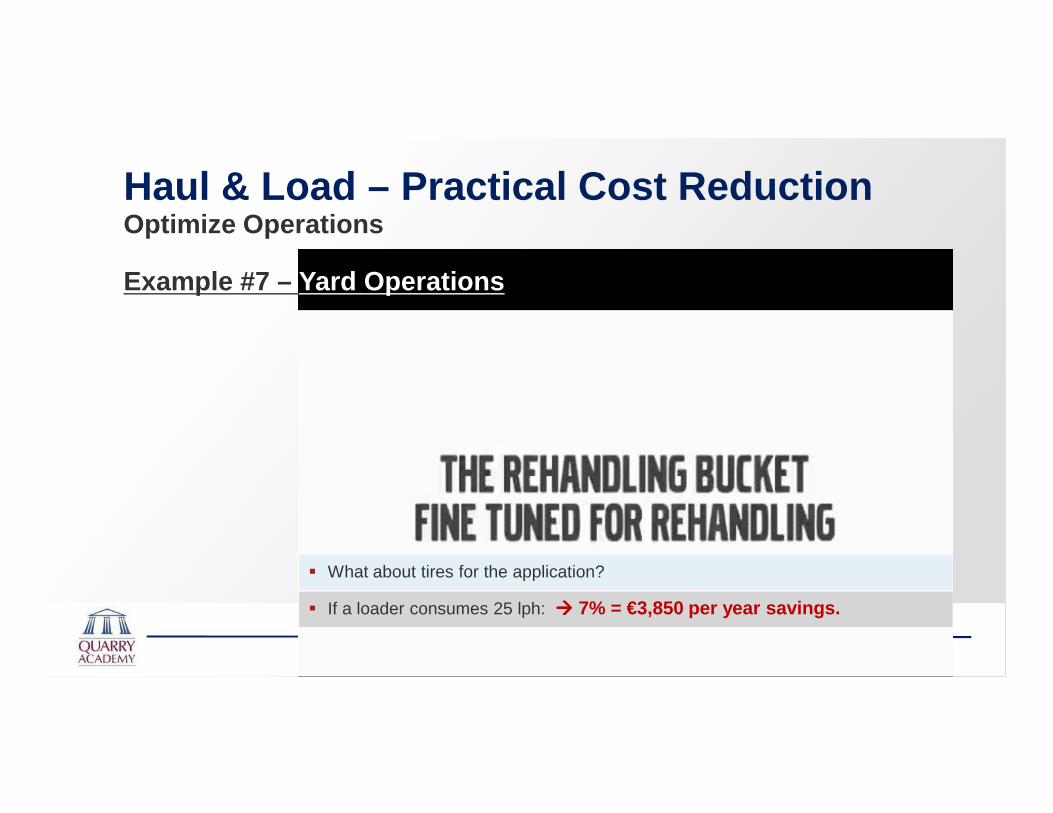
Example #7 – Yard Operations� Re-Handling or Yard/Load-Out: is a unique application.
� Can you be more efficient? Old(er) machines often of GP or rock bucket in the yard.
���� A purpose-built re-handling package = 7%+ efficienc y gain vs. a GP bucket.
Haul & Load – Practical Cost ReductionOptimize Operations
Example #7 – Yard Operations
� If a loader consumes 25 lph: ���� 7% = €3,850 per year savings.
� What about tires for the application?
Haul & Load – Practical Cost ReductionOptimize Operations
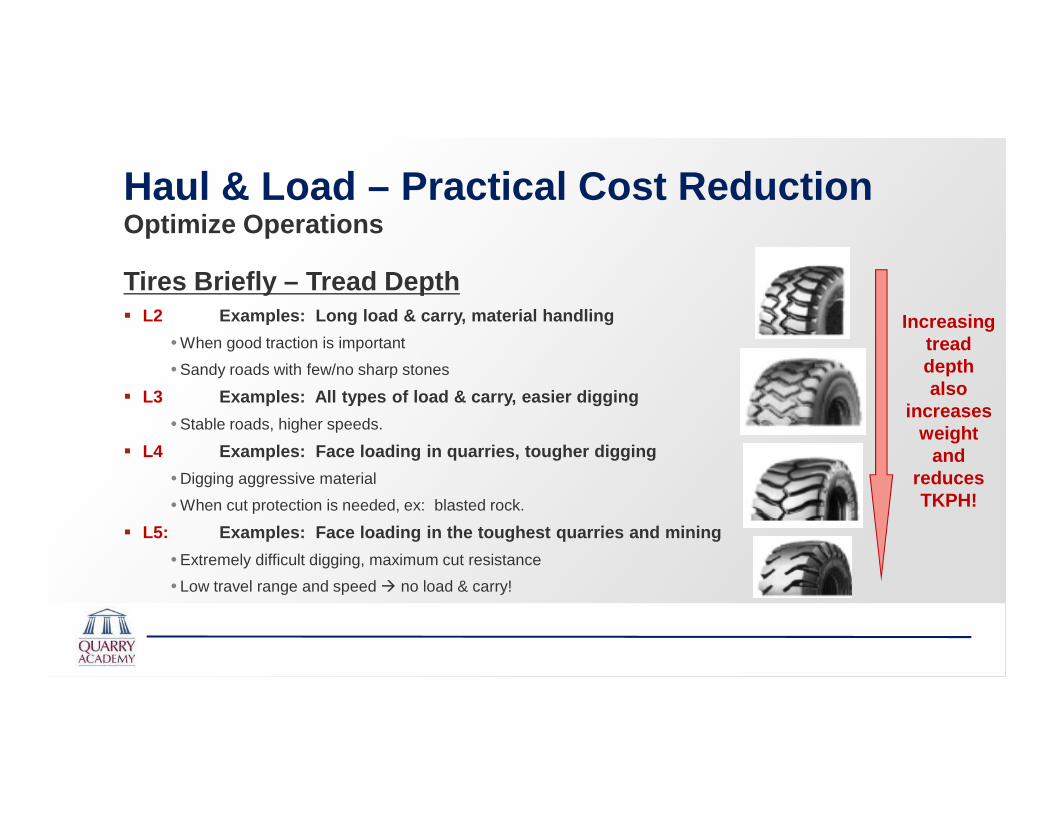
Tires Briefly – Tread Depth� L2 Examples: Long load & carry, material handling
• When good traction is important
• Sandy roads with few/no sharp stones
� L3 Examples: All types of load & carry, easier diggin g
• Stable roads, higher speeds.
� L4 Examples: Face loading in quarries, tougher diggin g
• Digging aggressive material
• When cut protection is needed, ex: blasted rock.
� L5: Examples: Face loading in the toughest quarries an d mining
• Extremely difficult digging, maximum cut resistance
• Low travel range and speed � no load & carry!
Increasing tread depth also
increases weight
and reduces TKPH!
Haul & Load – Practical Cost ReductionOptimize Operations
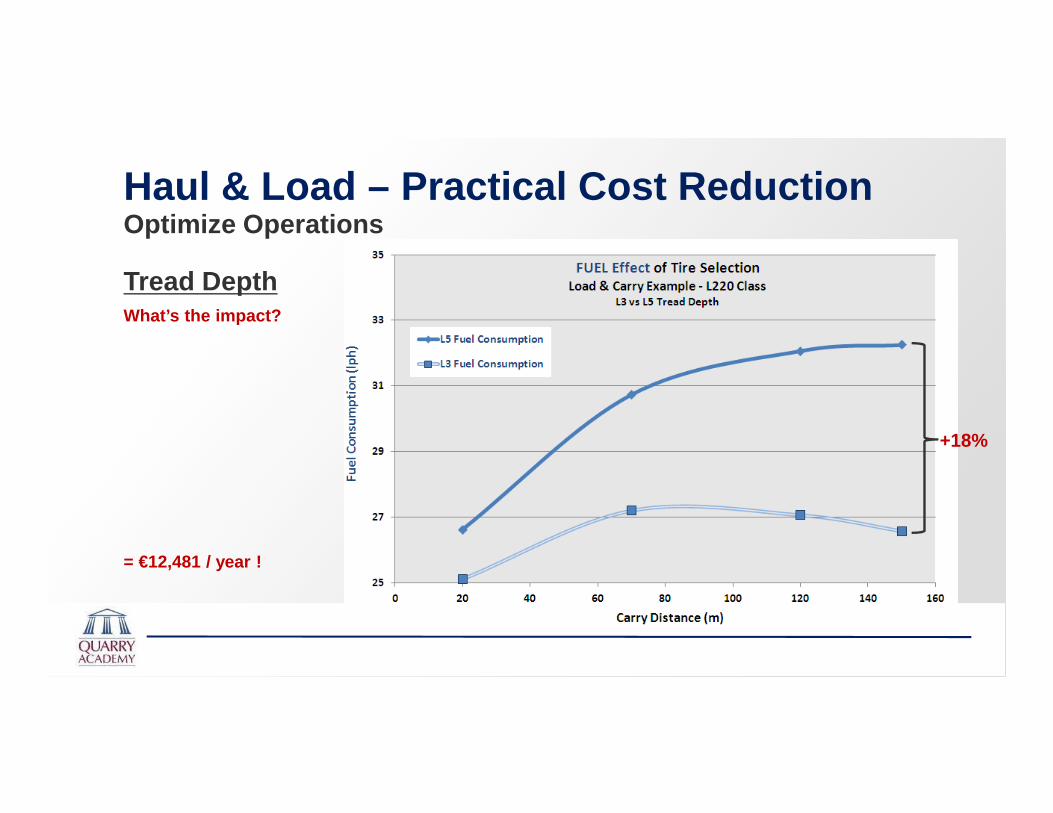
Tread Depth
+18%
What’s the impact?
= €12,481 / year !
Haul & Load – Practical Cost ReductionOptimize Operations
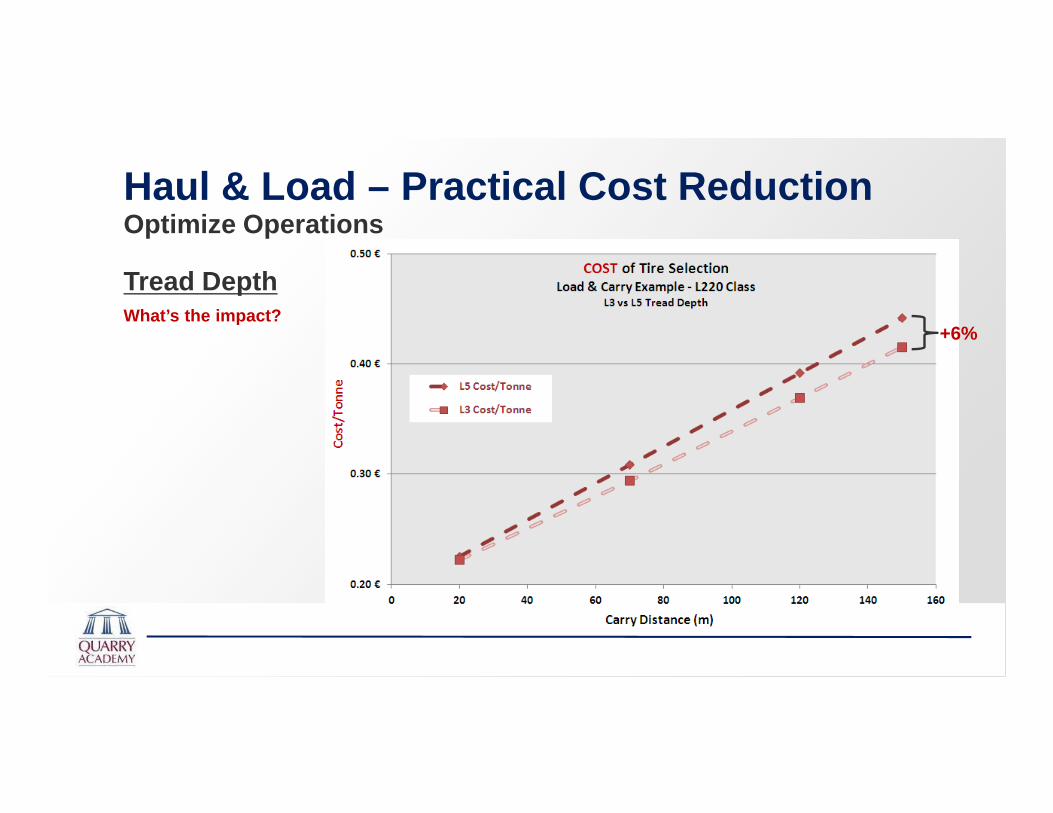
Tread Depth
+6%What’s the impact?
Haul & Load – Practical Cost ReductionOptimize Operations
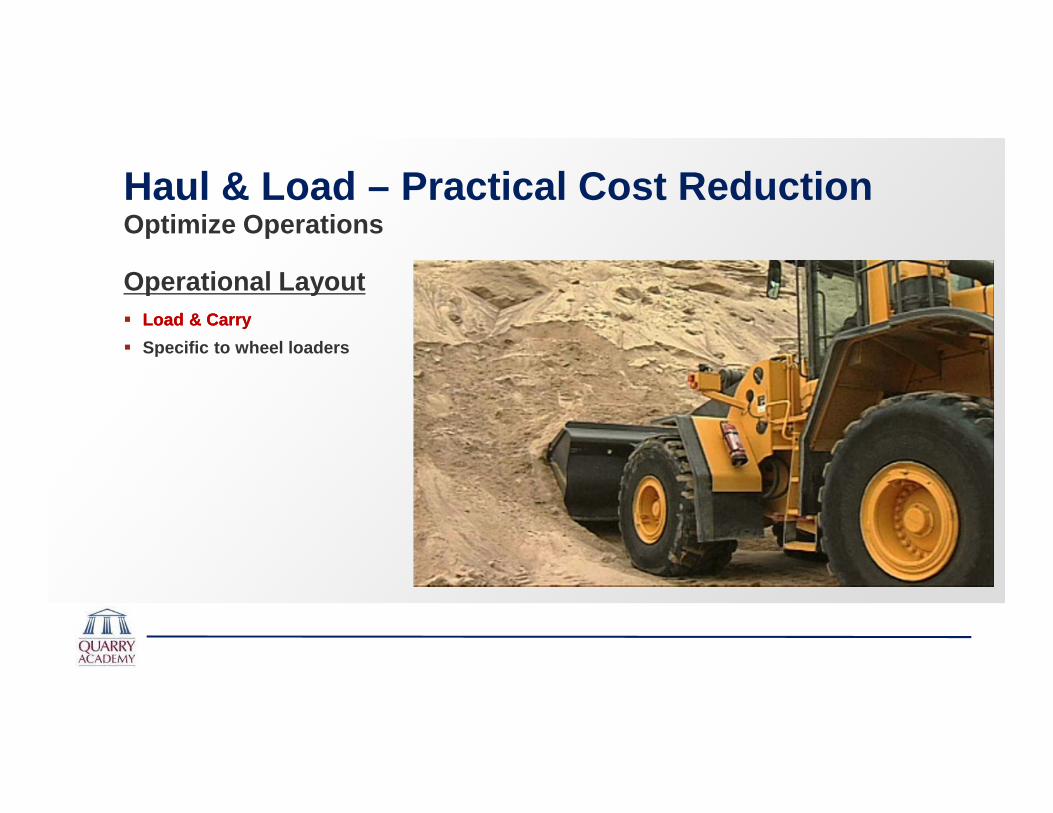
Operational Layout� Load & Carry� Load & Carry
� Specific to wheel loaders

Haul & Load – Practical Cost ReductionOptimize Operations
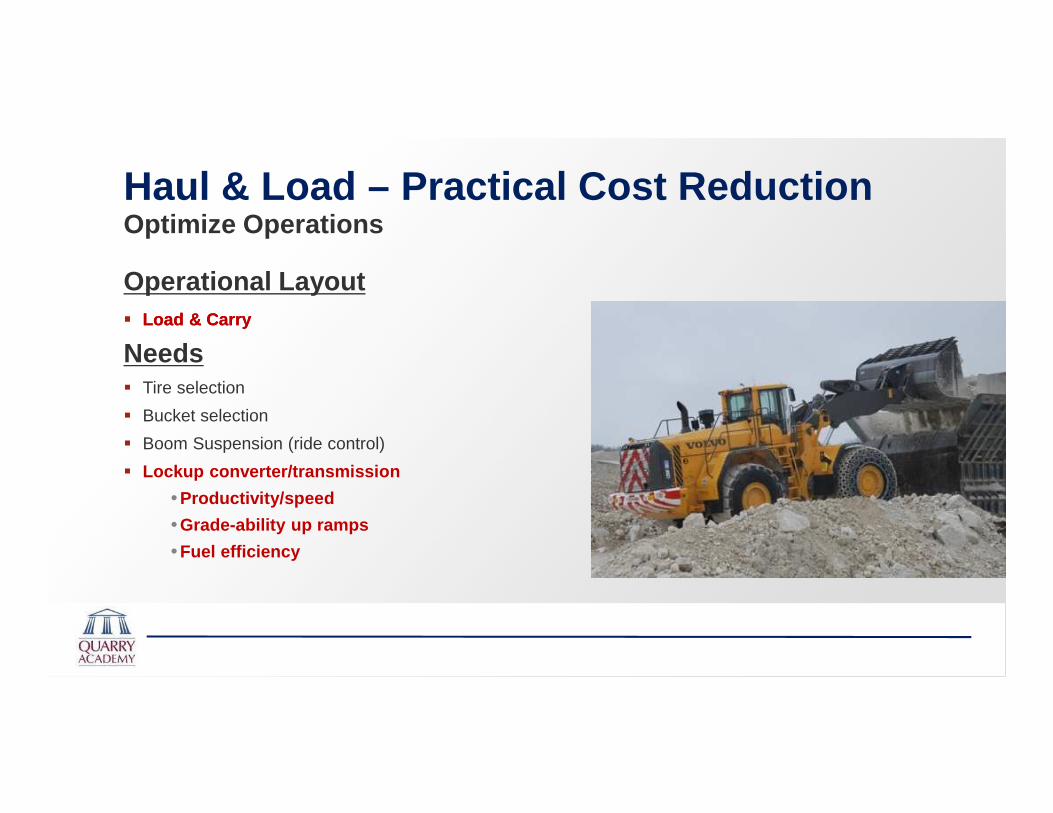
Operational Layout� Load & Carry� Load & Carry
� Specific to wheel loaders
� Tire selection
� Bucket selection
� Boom Suspension (ride control)
Needs

Haul & Load – Practical Cost ReductionOptimize Operations
Example #8 - Load & Carry Test� Volvo L120F - with and without BSS
� Road 60m one-way, 12% grade at end
� Carrying clay/gravel, 1.9 SG
� Faster cycle time
� Higher productivity
� Better fuel efficiency
� Better fill factor
Outcomes
100% 100% 100% 100%
116%
109%
92% 87%95%
111%
50%
60%
70%
80%
90%
100%
110%
120%
Cycle Time (s)
Fuel Consumption (L/h)
Productivity (t/h)
Fuel Efficiency (t/L)
Bucket Fill Factor (%)
BSS ON BSS OFF
Lower is Better Higher is Better
Haul & Load – Practical Cost ReductionOptimize Operations
Operational Layout� Load & Carry� Load & Carry
� Tire selection
� Bucket selection
� Boom Suspension (ride control)
� Lockup converter/transmission
• Productivity/speed
• Grade-ability up ramps
• Fuel efficiency
Needs
Haul & Load – Practical Cost ReductionOptimize Operations
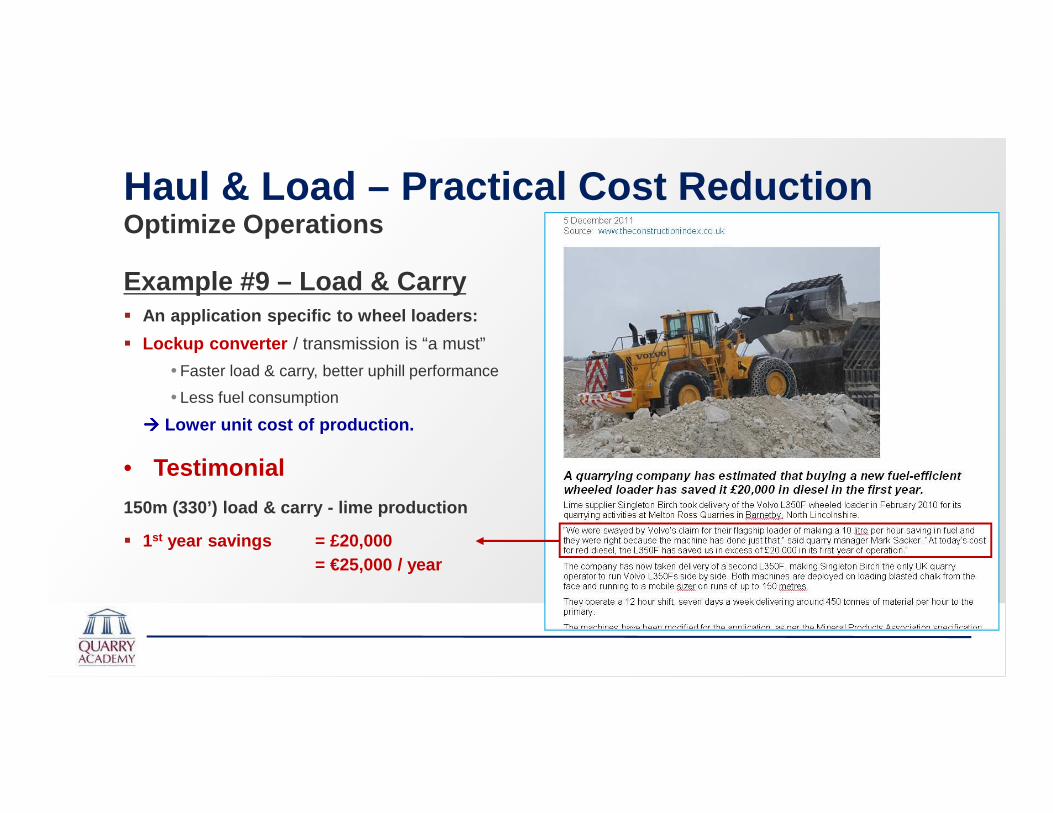
Example #9 – Load & Carry� An application specific to wheel loaders:
� Lockup converter / transmission is “a must”
• Faster load & carry, better uphill performance
• Less fuel consumption
���� Lower unit cost of production.
150m (330’) load & carry - lime production
� 1st year savings = £20,000 = €25,000 / year
• Testimonial
Haul & Load – Practical Cost ReductionOptimize Operations
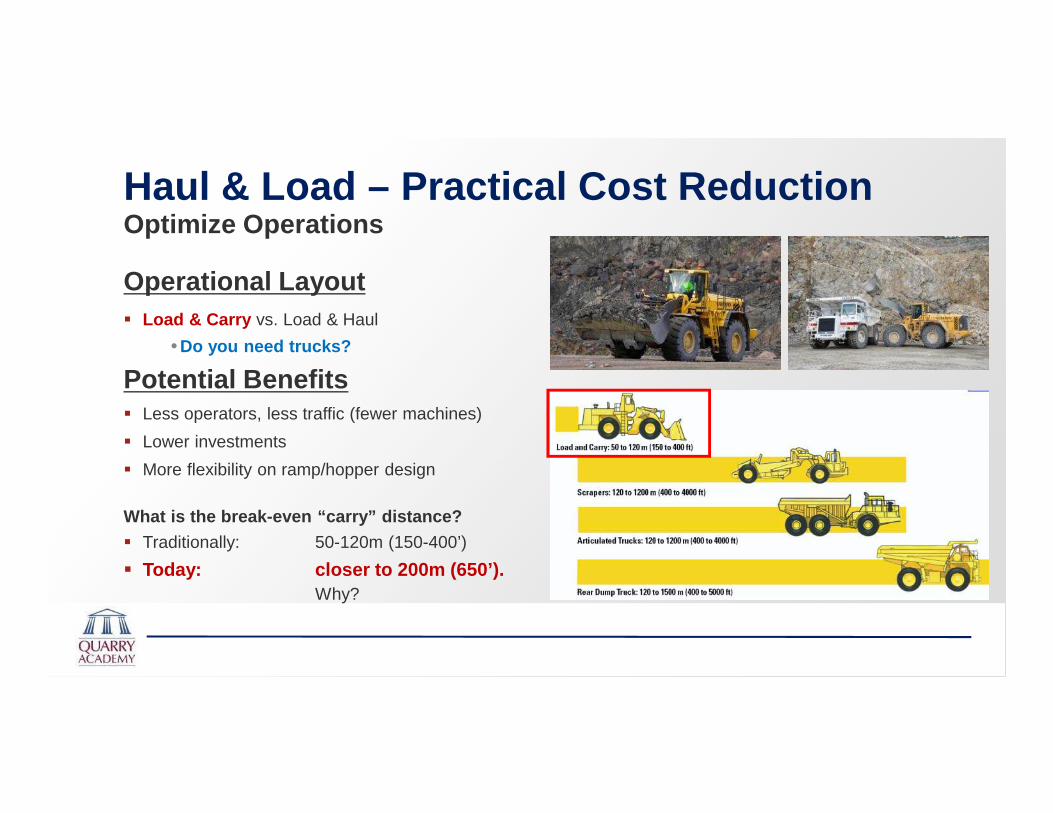
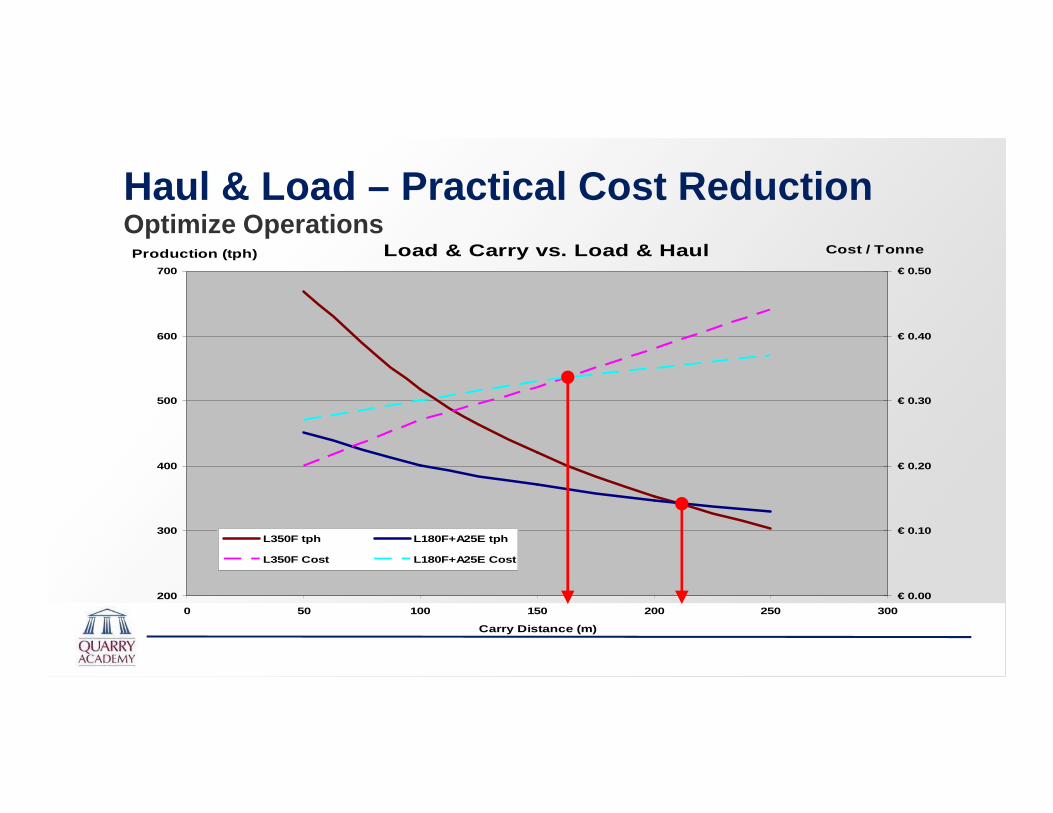
Operational Layout� Load & Carry vs. Load & Haul
• Do you need trucks?
� Less operators, less traffic (fewer machines)
� Lower investments
� More flexibility on ramp/hopper design
Potential Benefits
What is the break-even “carry” distance?
� Traditionally: 50-120m (150-400’)
� Today: closer to 200m (650’). Why?
Haul & Load – Practical Cost ReductionOptimize Operations
Load & Carry vs. Load & Haul
200
300
400
500
600
700
0 50 100 150 200 250 300
Carry Distance (m)
Production (tph)
€ 0.00
€ 0.10
€ 0.20
€ 0.30
€ 0.40
€ 0.50
L350F tph L180F+A25E tph
L350F Cost L180F+A25E Cost
Cost / Tonne
Haul & Load – Practical Cost ReductionOptimize Operations
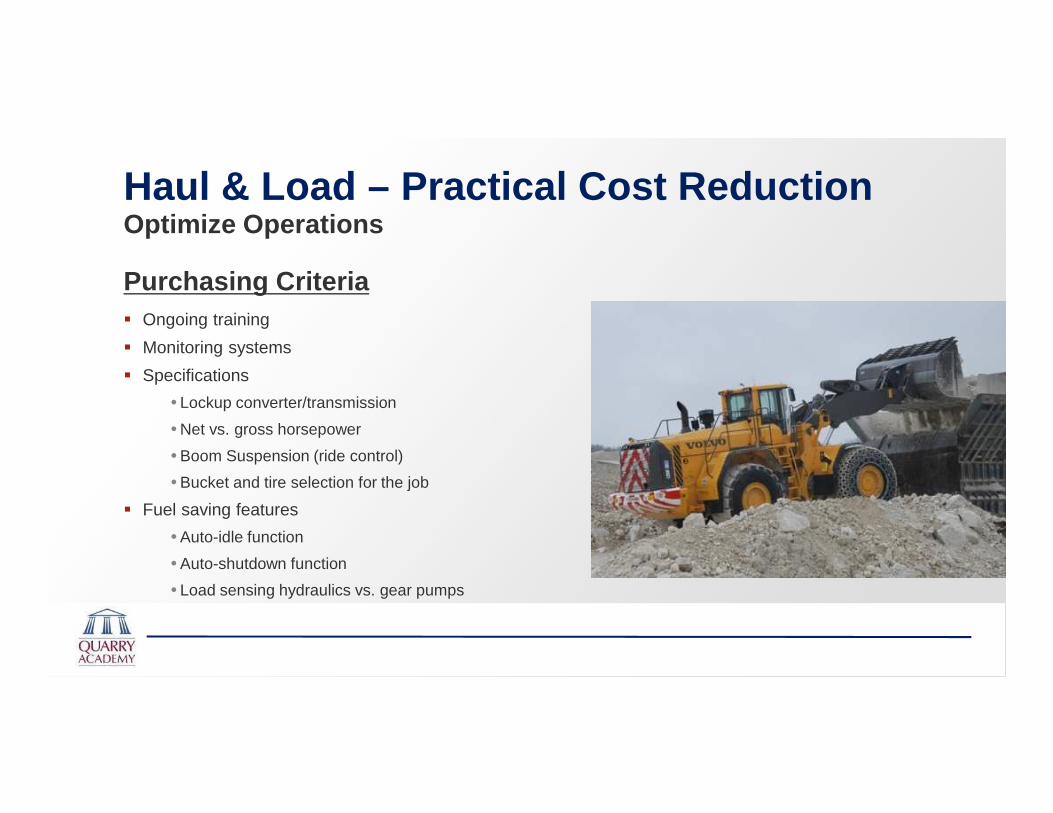
Purchasing Criteria� Ongoing training
� Monitoring systems
� Specifications
• Lockup converter/transmission
• Net vs. gross horsepower
• Boom Suspension (ride control)
• Bucket and tire selection for the job
� Fuel saving features
• Auto-idle function
• Auto-shutdown function
• Load sensing hydraulics vs. gear pumps
Haul & Load – Practical Cost ReductionOptimize Operations
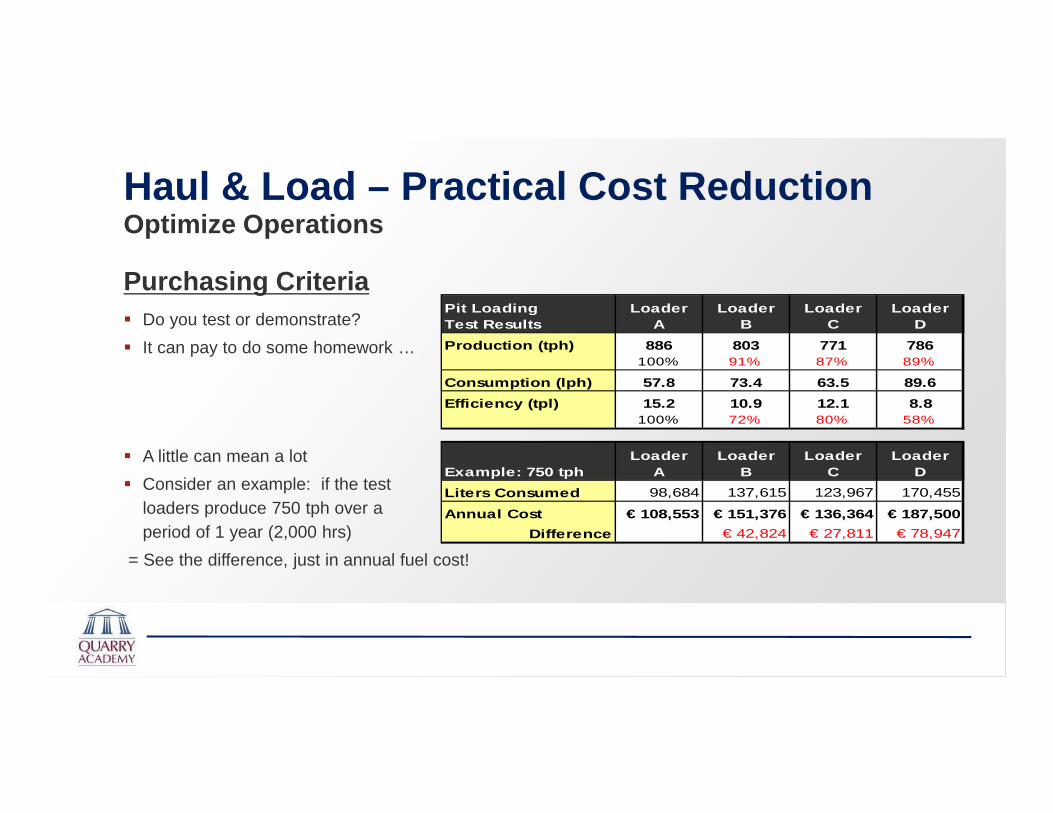
Purchasing Criteria� Do you test or demonstrate?
� It can pay to do some homework …
Pit Loading Test Results
LoaderA
LoaderB
LoaderC
LoaderD
Production (tph) 886 803 771 786100% 91% 87% 89%
Consumption (lph) 57.8 73.4 63.5 89.6
Efficiency (tpl) 15.2 10.9 12.1 8.8100% 72% 80% 58%
Example: 750 tphLoader
ALoader
BLoader
CLoader
D
Liters Consumed 98,684 137,615 123,967 170,455
Annual Cost € 108,553 € 151,376 € 136,364 € 187,500
Difference € 42,824 € 27,811 € 78,947
� A little can mean a lot
� Consider an example: if the test loaders produce 750 tph over a period of 1 year (2,000 hrs)
= See the difference, just in annual fuel cost!
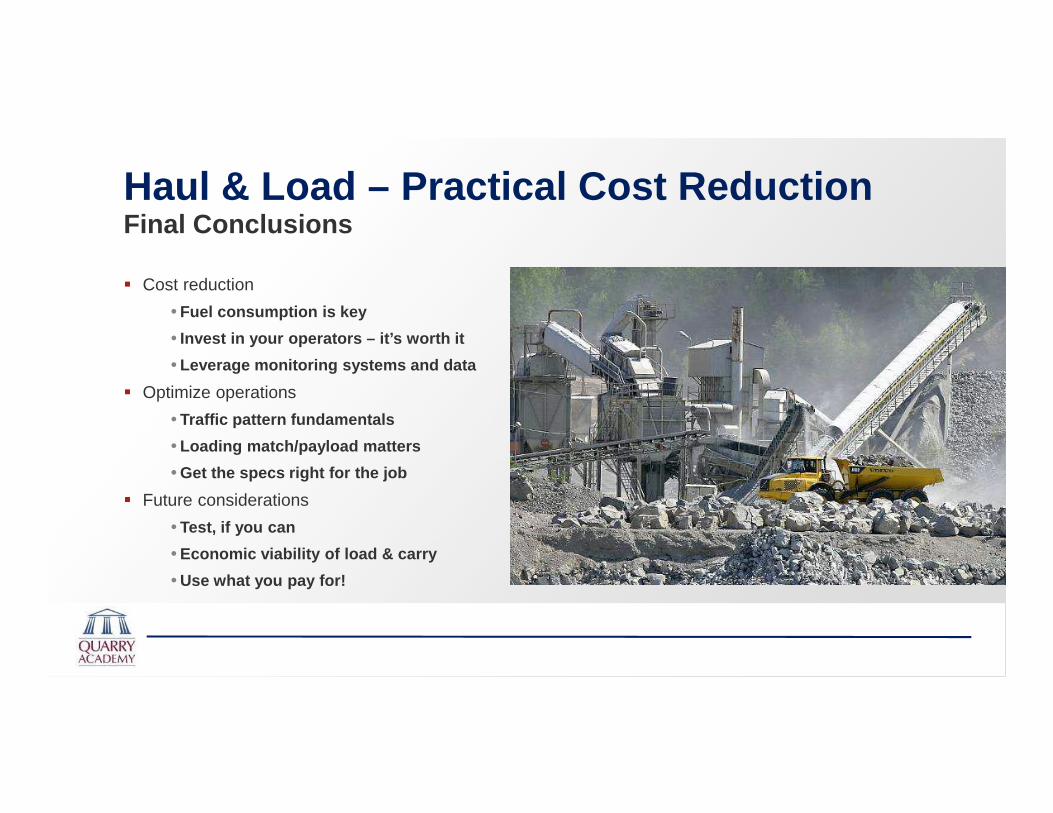
Haul & Load – Practical Cost ReductionFinal Conclusions
� Cost reduction
• Fuel consumption is key
• Invest in your operators – it’s worth it
• Leverage monitoring systems and data
� Optimize operations
• Traffic pattern fundamentals
• Loading match/payload matters
• Get the specs right for the job
� Future considerations
• Test, if you can
• Economic viability of load & carry
• Use what you pay for!

www.quarryacademy.com
Thank You!
• Guillermo Quezada
Extraction Business Development Manager
M: +49 (173) 6163244
• David Nus
Director, Global Mining & Aggregates
M: +1 828.301.7654