hans timmer world bank march 1, 2011 transformational changes in the global economy trade, finance...
Post on 19-Dec-2015
215 views
TRANSCRIPT

Hans TimmerWorld Bank
March 1, 2011
Transformational Changes in the Global Economy
Trade, finance and commodities after the crisis

Trade, Finance, and Commodities
• Trade dynamics illustrate that developing countries have become the drive of global growth

• Trade dynamics illustrate that developing countries have become the drive of global growth
• Financial markets still show the reverberations of the financial crisis
Trade, Finance, and Commodities

• Trade dynamics illustrate that developing countries have become the drive of global growth
• Financial markets still show the reverberations of the financial crisis
• Food price increases reflect major changes in commodity markets
Trade, Finance, and Commodities

Source: The World Bank
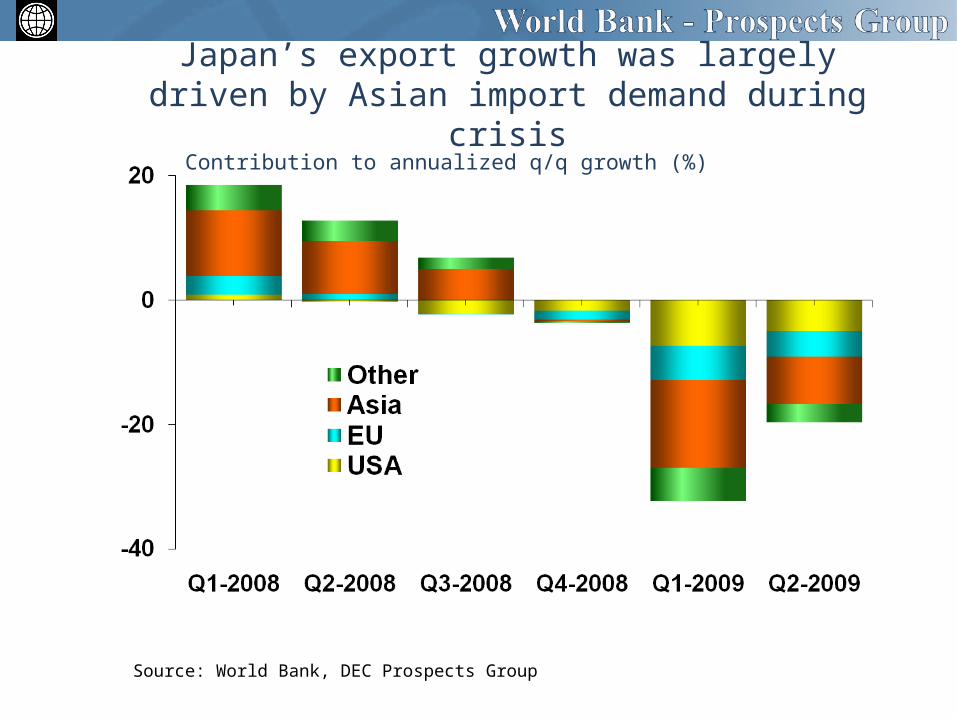
Japan’s export growth was largely driven by Asian import demand during crisis
Source: World Bank, DEC Prospects Group
Contribution to annualized q/q growth (%)

Source: World Bank, DEC Prospects Group
Developing countries’ imports stronger than their exports

Share of developing countries in global trade more than doubled during last 20 years
Source: Comtrade data via WITS

Source: The World Bank

Source: The World Bank

Source: The World Bank
Developing countries have become driver of global trade
• Sustained strong growth in developing countries is more crucial than rebalancing for global recovery
• Developing countries should take the lead in trade negotiations

Decline and recovery in capital flows was very concentrated
Source: The World Bank

Bank NPLs remain elevated in Europe and Central Asia

Capital flows put upward pressure on many currencies
Real-effective exchange rate, January 2009=100
Source: International Monetary Fund

Weak bank-lending implies private capital flows will not recover to pre-crisis levels for some time
Net private capital flows to developing countries, $ billion
Source: The World Bank
in billions Percent of GDP

From FDI inflow……
Percent of GDP

…to FDI outflows

Developing countries’ role in financial markets will dramatically increase
• Developing countries aim to become less dependent on dollar and US monetary policy.
• Coming decade will show shift from ingoing FDI to outgoing FDI.
• While high-income countries look for regulating financial markets, developing countries need to deepen markets, partly through liberalizing them.
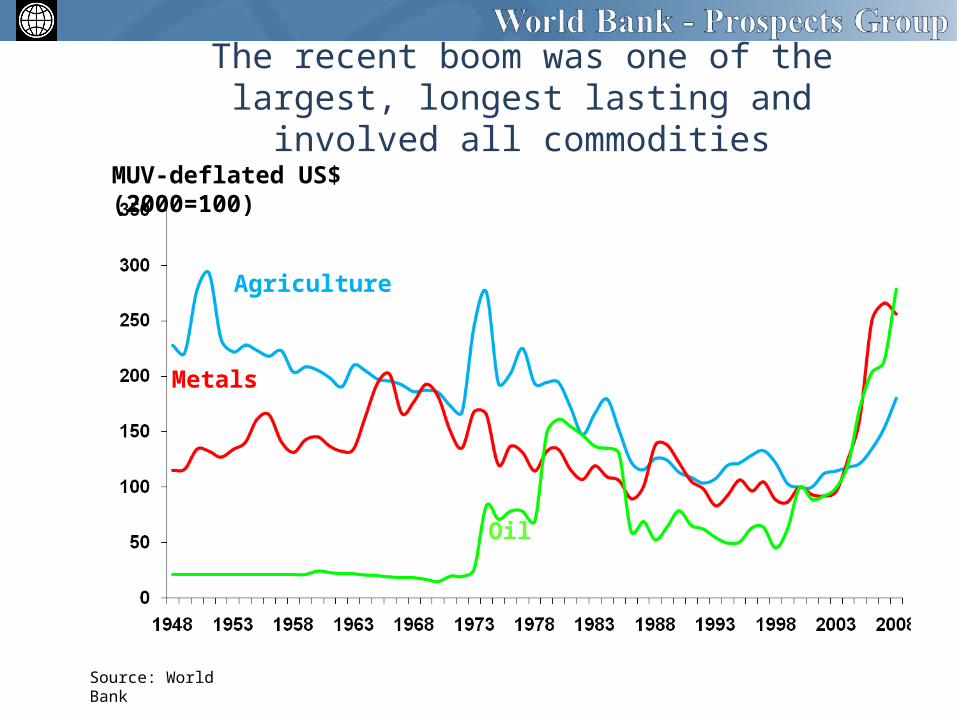
The recent boom was one of the largest, longest lasting and involved all commodities
MUV-deflated US$ (2000=100)
Source: World Bank
Agriculture
Metals
Oil

Source: The World Bank

Commodity intensity of demand, index 1971 = 1
Technological progress increases the efficiency of resource use
Source: World Bank.

BrazilChina
India
Russia
18
45
135
367
1,0
00
Gra
in C
onsu
mptio
n p
er
ca
pita
( K
g )
0.4 1.1 2.9 8.1 22.0 59.8GDP per capita (1,000 PPP $)
Note : Curve fitted on a log scale.
Most major countries have passed the point where food demand grows much faster than population
Source: World BankNote: Curve fitted on a log scale
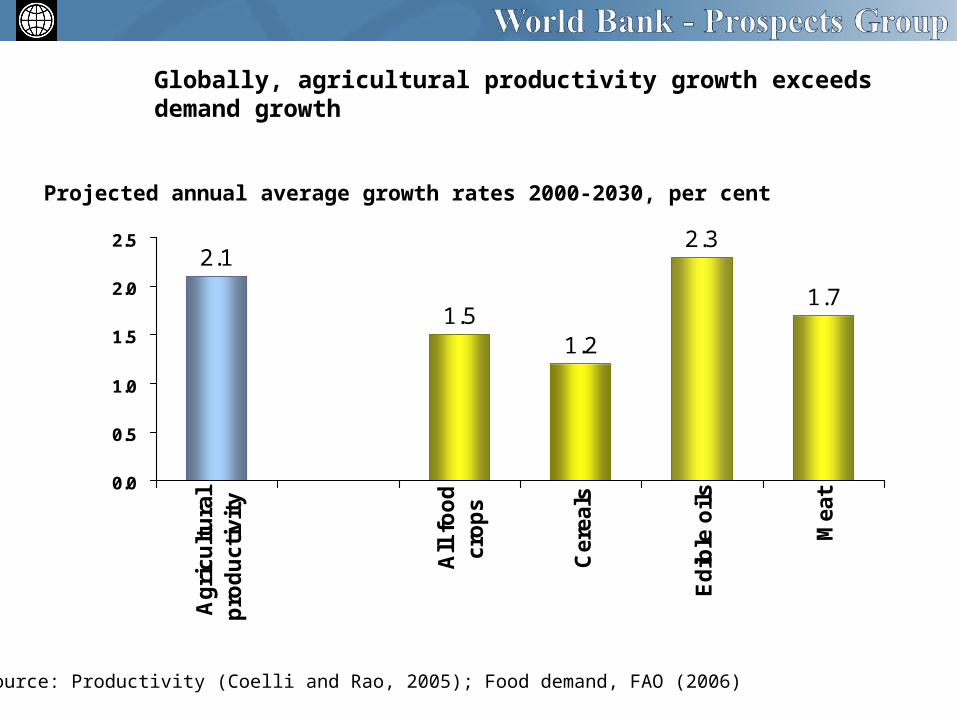
2.1
1.51.2
2.3
1.7
0.0
0.5
1.0
1.5
2.0
2.5
Ag
ricu
ltu
ral
pro
du
ctiv
ity
All
fo
od
cro
ps
Cer
eals
Ed
ible
oil
s
Mea
t
Globally, agricultural productivity growth exceeds demand growth
Source: Productivity (Coelli and Rao, 2005); Food demand, FAO (2006)
Projected annual average growth rates 2000-2030, per cent

Production (history) and demand (forecasts)(annual average percent change)
Source: FAO (history) and FAO/OECD (forecasts)

Causes of the boom
• Sharp increase in Chinese demand for metals
• Decades of weak prices, during which as much as ½ of global demand was being met from idle capacity
• Impact of oil prices on agricultural prices
• Adverse weather patterns
• Larger role of financial market

High oil prices affect food prices
y = 2.1166x - 3.3711
R2 = 0.7527
0
50
100
150
200
250
300
350
50 100 150
Crude Oil ($/bbl)
Mai
ze P
rice
($/
ton
)
y = 0.4246x + 86.178
R2 = 0.0526
0
50
100
150
200
250
300
350
10 30 50
Crude Oil ($/bbl)
Mai
ze P
rice
($/
ton)
Source: DEC Prospects Group.
Oil < $50 Oil > $50
Improving our capacity to respond to commodity cycles
Domestic policy agenda– Improve targeting of social welfare schemes– Invest in rural infrastructure and agricultural R&D– Be prepared to react rapidly because of long-term costs of even a relatively
short bout of high food prices
Global policy agenda– Proceed with trade liberalization, including improved disciplines governing
export bans– Increase the financial independence of World Food Program– Improve information flows and coordination of food stocks

Hans TimmerWorld Bank
March 1, 2011
Transformational Changes in the Global Economy
Trade, finance and commodities after the crisis