hanford tank 241-az-102 waste concentration and composition · hanford tank 241-az-102 waste...
TRANSCRIPT

PNWD-3235 WTP-RPT-054, Rev 0
Hanford Tank 241-AZ-102 Waste Concentration and Composition
S. K. Fiskum C. Z. Soderquist O. T. Farmer M. J. Steele L. R. Greenwood R. G. Swoboda E. D. Jenson M. W. Urie B. M. Oliver J. J. Wagner R. L. Russell
January 2003
Prepared for Bechtel National, Inc. under Contract No. 24590-101-TSA-W0000-004

LEGAL NOTICE
This report was prepared by Battelle Memorial Institute (Battelle) as an account of sponsored research activities. Neither Client nor Battelle nor any person acting on behalf of either:
MAKES ANY WARRANTY OR REPRESENTATION, EXPRESS OR IMPLIED, with respect to the accuracy, completeness, or usefulness of the information contained in this report, or that the use of any information, apparatus, process, or composition disclosed in this report may not infringe privately owned rights; or
Assumes any liabilities with respect to the use of, or for damages resulting from the use of, any information, apparatus, process, or composition disclosed in this report.
References herein to any specific commercial product, process, or service by trade name, trademark, manufacturer, or otherwise, does not necessarily constitute or imply its endorsement, recommendation, or favoring by Battelle. The views and opinions of authors expressed herein do not necessarily state or reflect those of Battelle.


PNWD-3235WTP-RPT-054, Rev 0
Hanford Tank 241-AZ-102 Waste Concentration and Composition
S. K. Fiskum C. Z. Soderquist O. T. Farmer M. J. Steele L. R. Greenwood R. G. Swoboda E. D. Jenson M. W. Urie B. M. Oliver J. J. Wagner R. L. Russell
January 2003
Test specification: 24590-PTF-TSP-RT-01-002, Rev. 1 Test plan: TP-RPP-WTP-111 Test exceptions: None R&T focus area: Pretreatment Test Scoping Statement(s): B-44
Battelle, Pacific Northwest Division Richland, Washington, 99352


Completeness of Testing
This report describes the results of work and testing specified by 24590-PTF-TSP-RT-01-002, Rev. 1 and TP-RPP-WTP-111. The work and any associated testing followed the quality assurance requirements outlined in the Test Specification/Plan. The descriptions provided in this test report are an accurate account of both the conduct of the work and the data collected. Test plan results are reported. Also reported are any unusual or anomalous occurrences that are different from expected results. The test results and this report have been reviewed and verified.
Approved:
_____________________________________ ___________ Gordon H. Beeman, Manager Date WTP R&T Support Project
_____________________________________ ___________ G. Todd Wright, Manager Date Research and Technology


iii
Summary
The U.S. Department of Energy is tasked with the disposition of high-activity radioactive waste stored at the Hanford site. The waste is to be vitrified following specific pretreatment processing to separate the waste into a small-volume high-activity waste fraction, and a large-volume low-activity waste fraction. The River Protection Project-Waste Treatment Plant (RPP-WTP) baseline process for 137Cs removal from Hanford high-activity tank waste is ion exchange. The current pretreatment flowsheet includes the use of Cs-selective, organic ion exchanger SuperLig 644(a) (SL-644) material for cesium removal from the aqueous waste fraction. However, tests conducted at Savannah River Technology Center resulted in poor ion exchange performance when tested with Hanford Tank 241-AZ-102 (AZ-102) waste. It was postulated that the low Na molarity (2.77) of the AZ-102 supernatant contributed to the poor Cs ion exchange performance and that the ion exchange removal of Cs from AZ-102 concentrated to nominally 5 M Na would be more effective.
Battelle Pacific Northwest Division (PNWD) was contracted to perform Cs ion exchange studies under Contract 24590-101-TSA-W000-0004. In preparation for Cs ion exchange, PNWD was also contracted to perform AZ-102 characterization, concentration, and subsequent concentrate characterization. The Cs ion exchange activities are defined in Technical Scoping Statement B-44, which is included in Appendix C of the Research and Technology Plan.(b) These studies are to verify design and operating parameters for plant-scale ion exchange systems. Test results will also be used to validate ion exchange models.
Objectives
The objectives of this work were to composite the AZ-102 tank waste samples, perform limited characterization on the composite, concentrate the AZ-102 to nominally 5 M Na, perform limited characterization of the concentrate, and provide the concentrated waste to the Cs ion exchange task for follow-on Cs ion exchange processing. All objectives were met.
Conduct of Testing
Ten jars containing AZ-102 waste (retrieved from Tank AZ-102, cores 261 and 262) were provided to PNWD in October of 2001. All bottles were similar in appearance, containing clear liquid. An organic layer could not be discerned in these bottles. Some of the samples had a small amount of white precipitate.
The contents of the 10 jars (4659 g or 4078 mL) were filtered, combined into a single composite, and the composite mixed by stirring. Following stirring, the composite was sub-sampled and measured for density, inorganic analytes, and 137Cs and total Cs. Characterization included:
inductively coupled plasma-atomic emission spectrometry (ICP-AES) (a) This material has been developed and supplied by IBC Advanced Technologies, Inc., American Fork, UT. (b) Research and Technology Plan, PL-W375-TE00007, Rev. 1, April 11, 2002, S. Barnes, R. Roosa, and R.
Peterson, BNI, Richland, WA.

iv
inductively coupled plasma-mass spectrometry (ICP-MS) for total Cs and Cs isotopic abundances kinetic phosphorescence analysis (KPA) for total uranium ion chromatography (IC) analysis for inorganic anions titration for hydroxide total inorganic carbon (TIC) and total organic carbon (TOC) gamma energy analysis (GEA) for 137Cs and 125Sb.
After removing sub-samples, 3372 mL of the composite were then evaporated to a targeted Na concentration of 5 M (one half the volume). The AZ-102 concentrate density was determined to be slightly high. A small amount of dilute caustic was added to reduce the solution density to 1.25 g/mL (from 1.271 g/mL). The final volume was 1,808 mL corresponding to a concentration factor of 1.8. The concentrated AZ-102 was sub-sampled and characterized in a manner similar to the as-received supernatant (excluding ICP-MS).
Solids (35.5 g dry mass) precipitated from the solution during evaporative concentration. The solids were sub-sampled and characterized for inorganic analytes and 137Cs. The solids characterization included
ICP-AES on dissolved subsample IC on dissolved subsample GEA on dissolved subsample X-ray Diffraction (XRD) on solid subsample
Performance and Results
The compositions of the as-received and concentrated AZ-102 supernatants, as well as AZ-102 solids formed as a result of concentration are summarized in Table S1. The solids were largely composed of Na3FSO4 (kogarkoite) and Na2C2O4 (natroxalate) mineral phases. Sample mass balance was maintained during processing operations. Furthermore , good mass balances of all significant anions and metals were obtained between the as-received AZ-102 and concentrated AZ-102 plus solids.

v
Table S1. Summary of AZ-102 As-Received and Concentrated Supernatants and Solids Compositions
AZ-102 As-Received Supernatant
AZ-102 Concentrate Supernatant
AZ-102 Precipitated Solids
02-366 02-751 02-1299 Mass
AnalyteAverage µg/mL(a)
DataFlag
Average µg/mL(a)
DataFlag
Average µg/g(a)
DataFlag
Balance %
Test Specification Analytes Al 518 929 1,080 99.2 Ca 33 U 34 U [260] J NA Cr 856 1,510 1,210 96
Cs (total)(b) 36.6 71.6 48 115 137Cs 946 µCi/mL 2,005 µCi/mL 1,345 µCi/g 115
Li 3.9 U 4 U 3.5 U NA K 3,340 6,660 5,460 X 108 Na 64,400 106,000 364,500 X 94.3
125Sb 4 Ci/mL U 4 Ci/mL U 4 Ci/g U NA U(KPA) 10.1 15.2 X NM 80.5
F (c) 1,050 1,760 40,150 130 Cl 140 U 140 U 72 U NA
NO2 37,500 78,000 47,000 113 NO3 19,600 37,700 25,800 105
PO4(d) 820 1,340 595 88.2
SO4 20,000 35,400 219,000 107 OH 10,200 18,800 NM 99.2
Density 1.143 g/mL 1.246 g/mL NM Other Measured Analytes
C2O4 3,160 X 1,680 221,000 102 Mo [60] J 110 91 99.5 P 150 286 229 104 Si [280] JB [255] JB 6,050 BX 72.9
TOC/F (e) 10,200 13,800 NM (f)
TIC/F (e) 1,400 U 1,400 NM (f)
TOC/P (e) 1,000 U 1000 NM NA TIC/P (e) 7,340 14,600 NM 106
Analytes detected are bolded for clarity and better readability. NM = not measured; NA = not applicable
U signifies undetected analyte; the concentration provided represents the instrument detection limit (IDL) multiplied by the sample dilution factors.
B signifies associated preparative blank concentration resulted in 5% or more of the sample concentration.
X signifies a quality control parameter (e.g., precision, blank spike recovery, etc.) was exceeded.
J signifies an estimated concentration; the concentration was within 10-times the detection limit.

vi
Table S.1 (Notes Contd)
The overall error for bolded values without brackets is estimated to be within 15% (analytes greater than 10 times the method detection limit [MDL]). Bracketed values identify sample concentrations that are <10 times the MDL, and errors likely exceed 15%.The total Cs concentration was calculated based on the 137Cs concentration and the isotopic distribution determined from the AZ-102 as-received sample by ICP-MS Fluoride results should be considered the upper-bound concentration. Significant peak distortion of the F peak suggests the presence of co-eluting anion(s), possibly formate or acetate. The P determined as PO4 by IC was higher than the P determined by ICP-AES. The IC chromatograms had many other anions at much higher concentrations and peak tailing may have biased the PO4 high. For TOC and TIC: P=by hot persulfate method; F=by furnace method/TIC by difference (TIC = TC-TOC). Furnace TIC and TOC results questionable; hot persulfate results used for mass balance calculation.
Quality Requirements
PNWD implemented the RPP-WTP quality requirements by performing work in accordance with the quality assurance project plan (QAPjP) approved by the RPP-WTP Quality Assurance (QA) organization. This work was conducted to the quality requirements of NQA-1-1989 and NQA-2a-1990, Part 2.7, as instituted through PNWD’s Waste Treatment Plant Support Project Quality Assurance Requirements and Description (WTPSP) Manual.
PNWD addressed verification activities by conducting an Independent Technical Review of the final data report in accordance with Procedure QA-RPP-WTP-604. This review verified that the reported results were traceable, that inferences and conclusions were soundly based, and that the reported work satisfied the Test Plan objectives.
Issue/Observation
Solids formed upon evaporation are composed primarily of Na3FSO4 (57%) and Na2C2O4 (28%). The precipitated solids were nominally 1 wt% of the AZ-102 as-received solution mass.

vii
Terms and Abbreviations
ASR Analytical Service Request BNI Bechtel National Inc. BS blank spike DI deionized DRD Development Requirements Document EQL estimated quantitation limit GEA gamma energy analysis HASQARD Hanford Analytical Services QA Requirements Document HPIC high-performance ion chromatography IC ion chromatography ICP-AES inductively coupled plasma-atomic emission spectrometry ICP-MS inductively coupled plasma-mass spectrometry IDL instrument detection level KPA kinetic phosphorescence analysis LCS laboratory control standard MDA minimum detectable activity MDL method detection limit MRQ minimum reportable quantity MS matrix spike MSD matrix spike duplicate NA not applicable ND not detected NM not measured n/r not recovered nr not reported %D percent difference OH hydroxide PB preparation blank PNWD Battelle - Pacific Northwest Division QA quality assurance QC quality control RPD relative percent difference RPL Radiochemical Processing Laboratory RPP River Protection Project SAL Shielded Analytical Laboratory TC total carbon

viii
TIC total inorganic carbon TOC total organic carbon TP test plan TS test specification WTP Waste Treatment Plant
Units
C degree Celsius
g gram
kV kilovolt
ma milliamp
Ci microcurie
g microgram
m micrometer
mL milliliter
M molarity
wt% weight percent

ix
Contents
Summary ...................................................................................................................................................... iii
Terms and Abbreviations............................................................................................................................vii
Units...........................................................................................................................................................viii
1.0 Introduction........................................................................................................................................ 1.1
2.0 Sample Receiving .............................................................................................................................. 2.1
3.0 AZ-102 Sample Processing................................................................................................................ 3.1
3.1 Filtration and Compositing......................................................................................................... 3.1
3.2 Sample Splitting ......................................................................................................................... 3.1
3.3 Evaporation ................................................................................................................................ 3.1
4.0 Analytical Sample Processing............................................................................................................ 4.1
4.1 Density ....................................................................................................................................... 4.1
4.2 Direct Sub-Sampling/Analysis ................................................................................................... 4.2
4.3 Acid Digestion............................................................................................................................ 4.2
4.4 Water Leach ............................................................................................................................... 4.2
4.5 X-Ray Diffraction ...................................................................................................................... 4.3
4.6 Cs Isotopic Distribution ............................................................................................................. 4.3
5.0 Analytical Results .............................................................................................................................. 5.1
5.1 Introduction ................................................................................................................................ 5.1
5.2 Analyte List Modifications......................................................................................................... 5.2
5.3 Data Limitations and General Observations .............................................................................. 5.2
5.4 X-Ray Diffraction Analysis of Solids ...................................................................................... 5.14
5.5 Fractional Analyte Recovery.................................................................................................... 5.16
6.0 Procedures, Quality Control, and Data Evaluation ............................................................................ 6.1

x
6.1 Inductively Coupled Plasma-Atomic Emission Spectroscopy ................................................... 6.1
6.2 Inductively Coupled Plasma/Mass Spectrometry....................................................................... 6.2
6.3 U Analysis by KPA.................................................................................................................... 6.2
6.4 Gamma Spectrometry................................................................................................................. 6.9
6.5 Anions ........................................................................................................................................ 6.9
6.6 Hydroxide Titration.................................................................................................................. 6.10
6.7 TOC/TIC by Hot Persulfate and Furnace................................................................................. 6.106.7.1 Hot Persulfate Method (PNL-ALO-381) ....................................................................... 6.106.7.2 Furnace Oxidation Method (PNL-ALO-380) ................................................................ 6.116.7.3 Comparison of TIC/TOC by Hot Persulfate and Furnace Oxidation Methods.............. 6.11
7.0 Conclusions........................................................................................................................................ 7.1
8.0 References .......................................................................................................................................... 8.1
Appendix A: Chains of Custody ............................................................................................................... A.1
Appendix B: Test Plan TP-RPP-WTP-111 “Tank 241-AZ-101 and 241-AZ-102 Waste Sample Ion Exchange Testing”.......................................................................................................................B.1
Appendix C: Test Instruction TI-RPP-WTP-127 “Mixing of AZ-102 and Evaporation to Nominally 5 M Na” and Addendum ..................................................................................................C.1
Appendix D: Target Analyte List, Minimum Reportable Quantities, and QC Acceptance Criteria........ D.1
Appendix E: ICP-AES Laboratory Control Sample and Matrix Spike Failures – AZ-102C Solids..........E.1
Figures
Figure 3.1. AZ-102 Sample Compositing and Splitting ........................................................................... 3.2
Figure 3.2. AZ-102 Composite Concentration and Subsequent Processing ............................................. 3.4
Figure 4.1. Flow Diagram for Analytical Processing of AZ-102, AZ-102C, and AZ-102C Solids Sub-samples............................................................................................................................. 4.1
Figure 5.1. XRD Pattern for AZ-102C Precipitated Solids .................................................................... 5.15

xi
Tables
Table S1. Summary of AZ-102 As-Received and Concentrated Supernatants and Solids Compositions ........................................................................................................................................ v
Table 2.1. Observations from As-Received AZ-102 Samples .................................................................. 2.1
Table 5.1. AZ-102 As-Received Supernatant Metals Analysis by ICP-AES ........................................... 5.3
Table 5.2. AZ-102 As-Received Supernatant Anion and TOC/TIC Analysis .......................................... 5.5
Table 5.3. AZ-102 As-Received Supernatant Uranium and Cs Analysis ................................................. 5.6
Table 5.4. AZ-102C Filtrate Metals Analysis by ICP-AES...................................................................... 5.7
Table 5.5. AZ-102C Filtrate Anion and TIC/TOC Analysis .................................................................... 5.9
Table 5.6. AZ-102C Filtrate U, Cs, and GEA......................................................................................... 5.10
Table 5.7. AZ-102C Precipitated Solids Metals Analysis ...................................................................... 5.11
Table 5.8. AZ-102C Precipitated Solids Anion Analysis ....................................................................... 5.13
Table 5.9. AZ-102C Precipitated Solids Gamma Analysis..................................................................... 5.14
Table 5.10. Estimated Solids Composition from AZ-102 Evaporation .................................................. 5.15
Table 5.11. Mass Balance of Various Analytes ...................................................................................... 5.17
Table 6.1. ICP-AES, ICP-MS, and KPA QC Results for AZ-102............................................................ 6.3
Table 6.2. ICP-AES and KPA QC Results for AZ-102C ......................................................................... 6.5
Table 6.3. ICP-AES QC Results for AZ-102C Solids .............................................................................. 6.7
Table 6.4. QC Results for GEA ................................................................................................................ 6.9
Table 6.5. Anion and TOC/TIC QC Results for AZ-102 As-Received .................................................. 6.12
Table 6.6. Anion and TOC/TIC QC Results for AZ-012C..................................................................... 6.13
Table 6.7. Anion QC Results for AZ-102C Solids ................................................................................. 6.14


1.1
1.0 Introduction
The U. S. Department of Energy plans to vitrify tank wastes at the Hanford Site in preparation for permanent disposal. Before vitrification, tank wastes will be divided into low-activity and high-activity fractions through specific pretreatment processes. The pretreatment flowsheet for the Hanford high-activity tank wastes includes the use of SuperLig 644 (SL-644) material for 137Cs removal from the aqueous waste fraction. Small-scale ion exchange testing with AZ-102 tank waste conducted at the Savannah River Technology Center demonstrated poor Cs removal using the SL-644 (Hassan et al. 2001). One reason proposed for the demonstrated poor Cs ion exchange performance was that the Na concentration in this tank waste was low (2.77 M). The SL-644 is supposed to operate best with high ionic strength solution and typical tank waste Na concentrations of 5 M.
Battelle Pacific Northwest Division (PNWD) was tasked with the testing of concentrated AZ-102 on small-scale SL-644 ion exchange columns per 241-AZ-101 and 241-AZ-102 Ion Exchange Test Specification 24590-PTF-TSP-RT-01-002, Rev.1, J. Toth, 10/1/01. The AZ-102 tank waste had to be concentrated to nominally 5 M Na. This report describes the analytical testing of the AZ-102 as-received sample, the concentration process, and the AZ-102 concentrate and solids byproduct analyses and compositions. Other processing aspects of the test plan (ion exchange, batch contacts, effluent and eluate analyses) are reported separately.
The objectives of this work were to: composite the AZ-102 samples received from 222-S perform limited characterization of the inorganic anion and metals content of AZ-102 concentrate the AZ-102 to nominally 5 M Na perform limited characterization of the AZ-102 concentrate provide concentrated AZ-102 to the Cs ion exchange task.


2.1
2.0 Sample Receiving
Tank AZ-102 was sampled from June 23, 1999, through September 23, 1999, from Core 261 and Core 262. Various sub-samples from different segments along the core were composited at the 222-S laboratory into ten nominally 400-mL samples. The composite samples were received under chain of custody (Appendix A) in the Radiochemical Processing Laboratory (RPL) Shielded Analytical Laboratory (SAL) hot cells on October 9, 2001. Each sample was assigned an RPL identification number.
The samples were weighed and observations of their physical appearances recorded. The measured gross composite sample masses agreed well with the gross masses reported by 222-S prior to sample transfer. All samples contained a small amount of solids; the solids’ appearance was recorded for each of these samples and is given in Table 2.1. The solids’ color may have been distorted through the yellow hot cell windows. There was no evidence of a separate organic phase in any of the samples.
Table 2.1. Observations from As-Received AZ-102 Samples
Bottle ID
RPLID
Reported gross
mass, g
Measuredgross
mass, g Solids present
Solids color
Estimatedsolids
volume Solids Appearance
18819 02-0226 782.1 782.04 Yes White 1 mL White crystalline, some large, ~2 mm long
18990 02-0227 757.6 757.80 Yes White with slight gray 0.5 mL Flocculent, white
18988 02-0228 767.5 764.15 Yes White 2 mL Crystalline
18989 02-0229 776.5 776.99 Yes White 3 mL White crystalline, small + one large piece ~5 mm
18996 02-0230 746.2 746.70 Yes Grey 1 mL Small particles, silty appearance
18992 02-0231 772.9 773.34 Yes White 4 mL Flocculent
18993 02-0232 737.7 738.14 Yes White 2 mL Flocculent
18998 02-0233 739.0 739.40 Yes White <1 mL Mostly small with some large pieces ~2mm
18994 02-0234 771.8 772.27 Yes Dark gray 2 mL Silty
18986 02-0235 772.4 772.63 Yes Brown 4 mL Silty


3.1
3.0 AZ-102 Sample Processing
The AZ-102 samples were processed according to Test Specification (TS) 24590-PTF-TSP-RT-01-002 (a) and Test Plan TP-RPP-WTP-111 (Appendix B). Raw data were recorded in Test Instruction TI-RPP-WTP-127 (Appendix C), and are maintained in the Project 42365 file.
3.1 Filtration and Compositing
The contents of the as-received AZ-102 bottles were passed sequentially through a 0.45- m nylon filter, and the filtrates were combined in a 6-L stainless steel evaporating beaker. The combined filtrates were then stirred thoroughly and sub-sampled for various tests including characterization. The compositing and sub-sampling are summarized in Figure 3.1. There was a 25-g mass loss attributed primarily to evaporation during hot cell processing activities. The residual solids from the filter were retained for possible additional characterization. The supernatant density was determined in duplicate and averaged 1.143 0.002 g/mL (T = 28oC).
3.2 Sample Splitting
The filtered composite sample was split into sub-samples for mixing process heels testing activities (not addressed in this report), large archive sub-samples, and archive analytical sub-samples. All sub-samples were stored in glass bottles. The various fractions were given the sample identifications shown in Figure 3.1. The analytical sub-samples were assigned a new RPL ID of 02-366 and analyzed according to Analytical Services Request (ASR) 6265 and, as amended, 6265.01. The remaining AZ-102 bulk sample remained in the stainless steel beaker for subsequent evaporation.
3.3 Evaporation
The AZ-102 filtrate was heated and evaporated at a controlled temperature of 50 2oC under an argon cover gas with continuous stirring from a stainless steel impeller. Evaporation continued from 10/31/01 15:15 to 11/3/01 12:00 (2.9 days) to nominally half the original volume. The concentrated filtrate was cooled and then passed through a 0.45- m nylon filter. Solids formation was evident; most solids settled to the bottom of the beaker, but a small fraction floated. The settled solids remained in the bottom of the beaker during the supernatant decant for filtration. The wet solids (hereafter identified as “AZ102C solids”) weighed 56.4 g (52.8 g in beaker and 3.6 g captured in the filter). The solids were allowed to air-dry in the beaker to constant mass at ambient temperature. The total air-dried solids mass remaining in the beaker was measured at 35.5 g. The loss of mass (17 g) is attributed to free water. Most of this water source was from residual concentrated AZ-102 solution remaining with the solids. The filtered concentrated AZ-102 density was determined to be 1.271 0.004 g/mL (T = 25oC).
(a) Test Specification 24590-PTF-TSP-RT-01-002, Rev. 1, Tank 241-AZ-101 and 241-AZ-102 Ion Exchange Test
Specification, James Toth, October 1, 2001.

3.2
Figure 3.1. AZ-102 Sample Compositing and Splitting
AZ-102 Supernatant Samples 02-0226 482.45g 02-0227 458.23 02-0228 465.38 02-0229 480.29 02-0230 453.37 02-0231 477.09 02-0232 442.78 02-0233 441.26 02-0234 477.99 02-0235 479.75Total 4658.58 g (4078 mL)
Filter AZ-102, As-received
AZ-102 Solids4.51 g (wet) 1.44 g (dry)
Estimated loss, 25 g
Archive AZ-102AR-arch 23.62 g
Analytical sample AZ-102AR-A ASR 6265, RPL ID 02-0366
Analytical sample AZ-102AR-BASR 6265 RPL ID 02-0366
Analytical sample AZ-102AR-CASR 6265.01, RPL ID 02-0366
11.45 g
11.41 g
56.0 g
Mixing process heels AZ-102AR-D
114.0 g
Additional archive AZ-102AR-E
Additional archive AZ-102AR-F
AZ-102 Remaining for Evaporation3854 g (3372 mL)
282.5 g
276.1 g
Combined AZ-102 4629 g

3.3
The dried solids mass remaining in the beaker was a combination of the precipitated solids and the dissolved solids (DS) from the residual supernatant phase. The actual precipitated solids mass (MP) from evaporative concentration can be calculated by subtracting the mass of residual supernatant solids (MDS)from the total solids mass (MT) according to Equation 1.
(1)
The mass of residual supernatant dissolved solids (MDS) can be estimated from the mass loss on drying of the total solids. By assuming that the weight loss on drying is water, MDS can be estimated by the density of the residual liquid ( L), density of water ( W), and the water mass loss (MW) according to Equation 2.
WW
WLDS M
MM
(2)
where L = 1.271 g/mL W = 1.000 g/mL
MW = 17 g
Based on Equation 2, the estimated MDS is 4.6 g or 13 wt% (i.e., 100 * [4.6 g / 35.5 g]) of the total dry solids. Applying Equation 1, the mass of solids precipitated from solution as a result of evaporative concentration was estimated to be:
gggM P 9.306.45.35
The dry-mass precipitated solids (30.9 g in beaker plus 3.6 g on filter) represented 0.89 wt% of the starting AZ-102 as-received supernatant mass (3854 g) and 1.7 wt% of the concentrated AZ-102 mass (2057 g).a Because the solids were not dried to 100oC, the total air-dried mass could include residual water. Thus the calculated wt% solids should be considered an upper bound.
The solids were transferred to glass bottles for storage. The dried solids were assigned RPL ID 02-1299 and submitted for characterization under ASR 6344.
The AZ-102 concentrate density of 1.271 g/mL was considered to be too high for subsequent processing through the Cs ion exchange SL-644 resin beds. A 200-mL aliquot of 0.01M NaOH was added back to the filtered AZ-102 concentrate to reduce the total density. The density of the slightly diluted AZ-102 concentrate was determined in duplicate to be 1.246 0.003 g/mL (T = 26oC),satisfactory for subsequent Cs ion exchange processing. This concentrate, labeled AZ-102C, was the AZ-102 feed solution for Cs ion exchange testing. Analytical sub-samples were taken and assigned an RPL ID of 02-0751 and submitted for characterization under ASR 6280. Figure 3.2 summarizes the entire sequence of evaporation, filtration, dilution, and analytical sub-sampling. a Most, if not all, supernatant was removed from the 3.6 g solids on the filter, however the solids were not necessarily dry. The wt% solids can be considered and upper bound.
DSTP MMM

3.4
Figure 3.2. AZ-102 Composite Concentration and Subsequent Processing
AZ-102 filtrate, 3854 g
Filter Analytical Sample AZ-102C solids, 52.8g wet, 35.5 g dry ASR 6344, RPL ID 02-1299
AZ-102 concentrate, 2057g
200 mL Add 0.01M NaOH
AZ-102 Cs ion exchange feed (AZ-102C), 2253g, 1808 mL
Analytical SamplesAZ-102C-A 12.7g AZ-102C-B 12.7 g ASR 6280, RPL ID 02-0751
25.4g
Filtrate
Residual solidsFiltered solids Filter paper solids,3.62 g wet
Evaporation to 50% volume

4.1
4.0 Analytical Sample Processing
The analytical processing and distribution of the AZ-102 as-received composite (AZ-102), concentrate (AZ-102C), and solids from the concentration of the as-received composite (AZ-102C solids) are detailed in Figure 4.1. The ASRs and assigned RPL IDs are shown with each sample.
IC = ion chromatography OH = hydroxide GEA = gamma energy analysis TIC = total inorganic carbon ICP-AES = inductively coupled plasma-
atomic emission spectrometry TOC = total organic carbon U = uranium
KPA = kinetic phosphorescence analysis XRD = x-ray diffraction ICP-MS = inductively coupled plasma-mass
spectrometry
Figure 4.1. Flow Diagram for Analytical Processing of AZ-102, AZ-102C, and AZ-102C Solids Sub-samples
4.1 Density
Density was determined in the SAL hot cells using 10-mL Class A volumetric flasks. All density determinations were performed in duplicate by measuring the net mass in the volumetric flask.
Direct Sub-Sampling/Analysis IC (inorganic anions), TOC/TIC, OH, density, GEA (ASR 6280)
Solids from AZ-102 Supernatant
Concentration
(ASR 6344, RPL ID 02-1299, AZ-102C Solids)
Digestion – PNL-ALO-128 ICP-AES, U (KPA), GEA (ASR 6265.01)
ICP-MS (ASR 6265.01 Cs only)
AZ-102 Tank Waste 1) As-received (ASR 6265/6265.01,
RPL ID 02-0366, AZ-102) 2) Concentrate (ASR 6280,
RPL ID 02-0751, AZ-102C)
Direct Sub-sampling/Analysis XRD
Digestion—PNL-ALO-128 ICP-AES, GEA
Water leach—PNL-ALO-103 IC (inorganic anions)

4.2
4.2 Direct Sub-Sampling/Analysis
Sub-samples of the AZ-102 and AZ-102C filtrates were taken in the SAL hot cells and then delivered to the RPL analytical workstations for various measurements including anions, hydroxide, TOC, and TIC. Preparation blanks (PBs) or diluent blanks were prepared with the samples, as appropriate. The analytical workstation was responsible for assuring that the appropriate batch and analytical QC samples were analyzed, as well as providing any additional processing to the sub-samples that might be required. That is, no lab control samples/blank spikes (LCS/BS), process blanks (PB), or matrix spikes (MSs) were prepared in the SAL. Aliquots of AZ-102C filtrate were also submitted for direct gamma energy analysis (GEA).
4.3 Acid Digestion
Aliquots of the AZ-102 as-received filtrate were acid digested in the SAL hot cells according to procedure PNL-ALO-128, HNO3-HCl Acid Extraction of Liquids for Metals Analysis Using a Dry-Block Heater. The SAL processed 1-mL aliquots of the AZ-102 filtrates in duplicate. The acid-extracted solutions were brought to a nominal 25-mL volume, absolute volumes were determined based on final solution weights and densities. The final digestion solution appeared to be clear and contain no precipitated solids. Along with a sample and duplicate, the SAL processed duplicate digestion PBs, two blank spikes (BSs) (one for ICP-AES and one for ICP-MS), and two MSs (one for ICP-AES and one for ICP-MS). Aliquots of the BS, MS, and PBs were provided with aliquots of the duplicate samples for ICP-AES and ICP-MS analyses. For AZ-102 (as-received) GEA, only the two PBs were provided with aliquots of the duplicate samples for analysis. Aliquots of the digested solutions were delivered to the 329 Facility for ICP-MS and to various RPL analytical workstations for ICP-AES, total U by KPA, and for gamma emitters by GEA, as appropriate. Aliquots of the filtered AZ-102C (concentrate) were processed identically but at a different time, and the digested solution distributed for all analyses except ICP-MS and GEA. The AZ-102C was analyzed directly (no acid digestion) by GEA.
Portions of AZ-102C solids were processed in the SAL hot cells according to PNL-ALO-129, HNO3-HCl Acid Extraction of Solids for Metals Analysis Using a Dry-Block Heater. The SAL processed 0.2-g aliquots of AZ-102C solids in duplicate. The acid-extracted solutions were brought to a nominal 25-mL volume, absolute volumes were determined based on final solution weights and densities. Along with the sample and duplicate, the SAL processed one PB, one BS, and one MS. The solids samples appeared to be completely dissolved by the acid-extraction process. The sample, duplicate, and all QC samples were submitted for ICP-AES analysis; only the sample, duplicate, and PB were submitted for GEA.
4.4 Water Leach
Aliquots of AZ-102C solids were water leached according to PNL-ALO-103, Water Leach of Sludges, Soils and Other Solid Samples in the SAL hot cells. Nominally 0.2-g aliquots of solids were contacted with nominally 11 g of deionized (DI) water. The actual water volume was determined gravimetrically. The solid samples completely dissolved in the DI water based on visual examination. A PB, BS, and MS were processed in the SAL with the samples. Sample aliquots were submitted to the inorganic anion analysis workstation.

4.3
4.5 X-Ray Diffraction
Aliquots of the AZ-102C solids were analyzed by XRD according to PNNL-RPG-268, Solids Analysis: X-ray Diffraction Analysis. Corundum was added as an internal standard to precisely calibrate the x-ray diffractometer. Sample duplicates were run with a 45-kV accelerating potential and 40 ma current to the XRD tube. The step size was 0.02 degrees 2-theta.
4.6 Cs Isotopic Distribution
The Cs isotopic distribution (133Cs, 135Cs, and 137Cs) was determined on the AZ-102 as-received supernatant according to PNL-SC-01, Inductively Coupled Plasma Mass Spectrometric (ICP-MS) Analysis. The Cs was separated from isobaric interferences using high-performance ion chromatography (HPIC), and the eluate was fed directly to the ICP-MS.


5.1
5.0 Analytical Results
5.1 Introduction
Tables 5.1 through 5.3 summarize the analytical results for the composited AZ-102 (as-received supernatant) tank waste. Tables 5.4 through 5.6 summarize the analytical results for the AZ-102 concentrated supernatant (AZ-102C). Tables 5.7 through 5.9 summarize the analytical results for solids that formed upon evaporation of the AZ-102 as-received supernatant (AZ-102C solids). Results are reported in g/mL or µCi/mL (or g/g or µCi/g), as appropriate. For some analyses, the nominal propagated uncertainties are also provided (as 1- , unless otherwise noted). However, for most analyses, no uncertainties are included in the tables. For these analyses, the estimated uncertainty is 10 to 15% for results above the estimated quantitation limit (EQL). Besides the duplicate sample results, the results obtained on the PBs are also reported, as appropriate.
The analytical results in Tables 5.1 through 5.9 and the quality control (QC) results in Tables 6.1 through 6.9 include a Data Flag column (i.e., a “Data Qualifier Code”), and the analyte concentrations or averages are flagged, as appropriate. The codes utilized are taken from the QA Plan and are defined below, as they relate to this report:
U Undetected: Analyte was analyzed, but not detected (e.g., no measurable instrument response) or response was less than the MDL. (Note: For some analyses, no results are reported below an EQL established by the lowest calibration standard adjusted for processing and analysis dilutions. In these cases, results less than EQL are flagged with a U. Footnotes in the tables identify which analyses use the lowest calibration standard as the reporting level.)
J Estimated value: The value reported is below the EQL and above the MDL. For radiochemical data, the J flag identifies results that have a propagated error of >10%, indicating that the results are typically within 10 times the minimum detectable activity (MDA).
B Analyte found in associated laboratory PB above the QA plan acceptance criteria (i.e., analyte concentration in the blank is greater than the EQL, or exceeds 5% of sample concentration).
X A QC deficiency is associated with the reported result. For this report, the X flag is used for the following: a) batch LCS or BS fails, b) both the MS and the post spike fail, c) serial dilution test (if required) fails for analytes with concentration greater than 0.1%.
The term MDL used in this report is an estimated MDL. That is, the MDLs have not been determined on the AZ-102 waste matrix per SW-846 (a) protocol. For the inorganic methods, the estimated MDLs are based on an instrument detection limit (IDL) established from using reagents and/or low-concentration high-purity standards as samples and evaluating instrument response near background levels. For radiochemical methods, the MDA is calculated per the QA Plan and is based on the background counting statistics.
(a) U.S. Environmental Protection Agency (EPA). 1998. Test Methods for Evaluating Solid Waste,
Physical/Chemical Methods, SW-846, Third Edition Update IIIA, Office of Solid Waste and Emergency Response. Washington, D.C.

5.2
The EQL is typically set at 10 times the estimated MDL, which is adjusted for dilution factors resulting from digestion or leaching processing. No estimated MDL is determined for the IC analysis. The IC analysis EQL is based on the lowest calibration standard adjusted for sample dilution; no results are reported below the EQL for this method. For radiochemical methods, no EQL is established; however, results are flagged with a “J” when the uncertainty exceeds 10%.
The test specification TS 24590-PTF-TSP-RT-01-002a was used as the basis to define the target analyte list, minimum reportable quantities (MRQ), and QC performance criteria for these analyses. The TOC and TIC were measured to help define the fractional recoveries of major species (organics and carbonate). Specific QC and QA discussions are given in Section 6.0.
5.2 Analyte List Modifications Analyte concentrations in addition to those required by the TSs are provided. These additional analytes were measured as part of the method and are provided for additional information only.
Total Cs was calculated from the AZ-102 (as-received) ICP-MS 133Cs result and the Cs isotopic ratios: 133Cs (52.9 wt%), 135Cs (15.0 wt%), and 137Cs (32.2 wt%). The isotopic ratio does not change as a function of the processing conditions; thus the same isotopic ratio was used for the AZ-102C and AZ-102C solids, where total Cs was calculated based on 137Cs determined by GEA.
5.3 Data Limitations and General Observations The F results have significant technical deficiencies. The reported F results represent the summation of F, acetate, and formate concentrations, as these are not readily resolved on the anion analysis IC system. The F results are most likely an overestimate of the actual F present in the AZ-102 samples.
Total Cs concentrations in the AZ-102C and AZ-102C solids were calculated based on the 137Cs in the solids and concentrated supernatant measured by GEA, and the Cs atomic mass ratio measured in the as-received AZ-102 supernatant.
The TIC and TOC results from the two analysis methods (i.e., hot persulfate oxidation and furnace oxidation) are significantly different for both the AZ-102 and AZ-102C samples, with the TIC from the hot persulfate method being very similar in concentration to the TOC from the furnace method. Since it is unlikely that the TIC from the hot persulfate method is in error, the high TOC from the furnace method is considered to be questionable and should not be used.
The anion and cation composition of the as-received AZ-102 generally agreed well with previously reported data from the Savannah River Technology Center (Hay and Bronikowski 2000).
Good agreement for 137Cs concentration in the AZ-102 as-received supernatant was obtained between the calculated concentration from ICP-MS-measured 133Cs and applied isotopic mass ratios, and the independently-measured 137Cs by GEA (see Table 5.3).
a Tank 241-AZ-101 and 241-AZ-102 Ion Exchange Test Specification 24590-PTF-TSP-RT-01-002, Rev. 1, J. Toth, 10/1/01

5.3
Table 5.1. AZ-102 As-Received Supernatant Metals Analysis by ICP-AES
Process Blank 1 Process Blank 2 Sample DuplicateMDL 02-366 PB1 Data MDL 02-366 PB2 Data MDL 02-366 Data MDL 02-366D Data
Analyte µg/mL(a) Flag µg/mL(a) Flag µg/mL(a) Flag µg/mL(a) Flag ICP-AES Test Specification Analytes
Al 1.6 1.6 U 1.6 1.6 U 7.9 513 8.0 524 Ca 6.6 6.6 U 6.7 6.7 U 33 33 U 33 33 U Cr 0.52 0.52 U 0.54 0.54 U 2.6 846 2.7 867
Li 0.79 0.79 U 0.81 0.81 U 3.9 3.9 U 4.0 4.0 UK 52 52 U 54 54 U 262 3,310 267 3,380 Na 3.9 [17] J 4.0 [14] J 19.7 63,700 20.0 65,000 U 52 52 U 54 54 U 262 260 U 267 270 U
Other Analytes Measured Ag 0.66 0.66 U 0.67 0.67 U 3.3 3.3 U 3.3 3.3 U As 6.6 6.6 U 6.7 6.7 U 33 33 U 33 33 U B 1.3 [12] J 1.3 [12] J 6.6 97.5 B 6.7 86.8 BBa 0.26 0.26 U 0.27 0.27 U 1.3 1.3 U 1.3 1.3 U Be 0.26 0.26 U 0.27 0.27 U 1.3 1.3 U 1.3 1.3 U Bi 2.6 2.6 U 2.7 2.7 U 13 13 U 13 13 U Cd 0.39 0.39 U 0.40 0.40 U 2.0 2.0 U 2.0 2.0 U Ce 5.2 5.2 U 5.4 5.4 U 26 26 U 27 27 U Co 1.3 1.3 U 1.3 1.3 U 6.6 6.6 U 6.7 6.7 U Cu 0.66 0.66 U 0.67 0.67 U 3.3 3.3 U 3.3 3.3 U Dy 1.3 1.3 U 1.3 1.3 U 6.6 6.6 U 6.7 6.7 U Eu 2.6 2.6 U 2.7 2.7 U 13 13 U 13 13 U Fe 0.66 0.66 U 0.67 0.67 U 3.3 3.3 U 3.3 3.3 U La 1.3 1.3 U 1.3 1.3 U 6.6 6.6 U 6.7 6.7 U Mg 2.6 2.6 U 2.7 2.7 U 13 13 U 13 13 U Mn 1.3 1.3 U 1.3 1.3 U 6.6 6.6 U 6.7 6.7 U Mo 1.3 1.3 U 1.3 1.3 U 6.6 [59] J 6.7 [61] JNd 2.6 2.6 U 2.7 2.7 U 13 13 U 13 13 U Ni 0.79 [3.3] J 0.81 [3.2] J 3.9 [13] JB 4.0 [10] JBP 2.6 2.6 U 2.7 2.7 U 13 147 13 153
Pb 2.6 2.6 U 2.7 2.7 U 13 13 U 13 13 U Pd 20 20 U 20 20 U 98 98 U 100 100 U Rh 7.9 7.9 U 8.1 8.1 U 39 39 U 40 40 U Ru 29 29 U 30 30 U 144 140 U 147 150 U Sb 13 13.1 U 13 13.5 U 66 66 U 67 67 U Se 6.6 6.6 U 6.7 6.7 U 33 33 U 33 33 U Si 13 [26] J 13 [25] J 66 [280] JB 67 [270] JBSn 39 39 U 40 40 U 197 200 U 200 200 U Sr 0.4 0.4 U 0.4 0.4 U 2.0 2.0 U 2.0 2.0 U Te 39 39 U 40 40 U 200 200 U 200 200 U Th 26 26 U 27 27 U 131 131 U 130 130 U Ti 0.66 0.7 U 0.67 0.7 U 3.3 3.3 U 3.3 3.3 U Tl 13 13 U 13 14 U 66 66 U 67 67 U

5.4
Process Blank 1 Process Blank 2 Sample DuplicateMDL 02-366 PB1 Data MDL 02-366 PB2 Data MDL 02-366 Data MDL 02-366D Data
Analyte µg/mL(a) Flag µg/mL(a) Flag µg/mL(a) Flag µg/mL(a) Flag V 1.3 1.3 U 1.3 1.3 U 6.6 6.6 U 6.7 6.7 U W 52 52 U 54 54 U 260 260 U 270 270 U Y 1.3 1.3 U 1.3 1.3 U 6.6 6.6 U 6.7 6.7 U Zn 1.3 1.3 U 1.3 1.3 U 6.6 6.6 U 6.7 6.7 U Zr 1.3 1.3 U 1.3 1.3 U 6.6 6.6 U 6.7 6.7 U
Analytes detected by ICP-AES are bolded for clarity and better readability.
U signifies undetected analyte; the concentration provided represents the IDL multiplied by the sample dilution factors.B signifies that the associated preparative blank concentration resulted in 5% or more of the sample concentration. X signifies that a QC parameter (e.g., precision, blank spike recovery, etc.) was exceeded. J signifies an estimated concentration; the concentration is >MDL but <EQL.
(a) The overall error for bolded values without brackets is estimated to be within 15% (analytes greater than 10-times the MDL). Bracketed values identify sample concentrations that are <10-times the MDL, and errors likely exceed 15%.
Table 5.1 (Contd)

5.5
Tab
le 5
.2.
AZ-
102
As-
Rec
eive
d Su
pern
atan
t Ani
on a
nd T
OC
/TIC
Ana
lysi
s
Proc
ess B
lank
Sa
mpl
eD
uplic
ate
EQ
L(a
)M
DL
(a)
02-3
66 P
BD
ata
EQ
L(a
)M
DL
(a)
02-3
66
Dat
a E
QL
(a)
MD
L (a
)02
-366
D
Dat
a A
naly
teg/
mL
Fl
ag
g/m
L
Flag
g/
mL
Fl
ag
Tes
t Spe
cific
atio
n A
naly
tes
F (b
) 0.
13
NA
0.
13
U
140
NA
1,
100
14
0 N
A
1,00
0 C
l 0.
13
NA
0.
13
U
140
NA
14
0 U
14
0 N
A
140
U
NO
2 0.
25
NA
0.25
U
2,
800
NA
38,1
00
2,
800
NA
36,9
00
NO
3 0.
25
NA
0.25
U
28
0 N
A19
,900
280
NA
19,2
00
OH
N
A
NA
(d)
U
NA
N
A10
,000
NA
N
A10
,300
O
ther
Ana
lyte
s Mea
sure
d TO
C/F
(c)
NA
N
AN
M(e
)
NA
1
,400
1
1,30
0(f)
N
A
1,4
00
900
0 TO
C/P
(c)
NA
NA
NM
(e)
NA
1,
000
1,00
0 U
NA
1,
000
1,00
0 U
TIC
/F(c
)N
AN
AN
M(e
)N
A
1,40
0 1,
400
UN
A
1,40
0 1,
400
UTI
C/P
(c)
NA
NA
NM
(e)
NA
38
0 6,
380
XN
A
380
8,30
0 X
Br
0.13
N
A0.
13
U
140
NA
14
0 U
14
0 N
A
140
U
C2O
4 0.
25
NA
0.25
U
28
0 N
A
3,15
0 X
28
0 N
A
3,17
0 X
PO4
0.25
N
A0.
25
U
280
NA
850
28
0 N
A80
0 SO
4 0.
25
NA
0.25
U
28
0 N
A20
,000
280
NA
19,9
00
Ana
lyte
s det
ecte
d ar
e bo
lded
for c
larit
y an
d be
tter r
eada
bilit
y.
U s
igni
fies u
ndet
ecte
d an
alyt
e; th
e co
ncen
tratio
n pr
ovid
ed re
pres
ents
the
IDL
mul
tiplie
d by
the
sam
ple
dilu
tion
fact
ors.
X s
igni
fies t
hat a
QC
par
amet
er (e
.g.,
prec
isio
n, b
lank
spik
e re
cove
ry, e
tc.)
was
exc
eede
d.
NA
= n
ot a
pplic
able
; NM
= n
ot m
easu
red
(a)
F, C
l, N
O2- , N
O3- , P
O43-
, SO
42-, B
r, an
d C
2O42-
repo
rt on
ly re
sults
abo
ve th
e EQ
L; th
eref
ore,
the
EQL
is p
rese
nted
in th
is c
olum
n. F
or a
ll ot
her
anal
ytes
, the
MD
L is
pre
sent
ed.
(b)
Fluo
ride
resu
lts sh
ould
be
cons
ider
ed th
e up
per-
boun
d co
ncen
tratio
n. S
igni
fican
t pea
k di
stor
tion
of th
e F
peak
sugg
ests
the
pres
ence
of c
o-el
utin
g an
ion(
s), p
ossi
bly
form
ate
or a
ceta
te.
(c)
For T
OC
and
TIC
: P
= by
hot
per
sulfa
te m
etho
d; F
= b
y fu
rnac
e m
etho
d w
here
TIC
was
det
erm
ined
by
diff
eren
ce o
f tw
o su
bsam
ples
(T
IC =
tota
l car
bon
[TC
]-TO
C);
syst
em b
lank
s are
subt
ract
ed fr
om a
ll sa
mpl
e re
sults
per
pro
cedu
re a
nd a
re n
ot re
porte
d (i.
e., n
ot a
pplic
able
, N
A).
(d)
For t
he O
H- b
lank
, no
infle
ctio
n po
int w
as d
etec
ted.
(e
)Th
e sa
mpl
e w
as d
ilute
d be
fore
ana
lysi
s; a
dilu
ent b
lank
was
not
ana
lyze
d.
(f)
Res
ult i
s sig
nific
antly
hig
her t
han
sam
ple
and
dupl
icat
e TC
resu
lts (9
,400
g/
mL
and
9,20
0 g/
mL,
resp
ectiv
ely)
, sug
gest
ing
resu
lt m
ay b
e hi
gher
than
the
actu
al T
OC
con
cent
ratio
n. N
ote
foot
note
(c).

5.6
Tab
le 5
.3.
AZ-
102
As-
Rec
eive
d Su
pern
atan
t Ura
nium
, Cs,
and
125 Sb
Ana
lysi
s
Proc
ess B
lank
1
Proc
ess B
lank
2
Sam
ple
Dup
licat
eM
DL
02-3
66 P
B1 ±
1SD
Dat
aM
DL
02-3
66 P
B2±
1SD
Dat
aM
DL
02-3
66
± 1S
D
Dat
aM
DL
02-3
66
± 1S
D
Dat
aA
naly
tes
µg/m
L
Flag
µg/m
L
Flag
µg/m
L
Flag
µg/m
L
Flag
U(K
PA)(a
) 0.
01
0.04
8 17
%
J 0.
01
0.07
8 11
%
J 0.
06
10.3
2%
0.06
9.
88
2%
13
3C
s 0.
04
0.04
U
0.06
0.
06
U
0.
03
20.1
5%
0.02
18
.6
1%
13
5 Cs(b
) N
A
NA
N
A
NA
N
A
5.70
5%
NA
5.
28
1%
13
7 Cs(b
) N
A
NA
N
A
NA
N
A
12.2
5%
NA
11
.3
1%
Tota
l Cs (b
) 0.
04
0.04
U
0.06
0.
06
U
0.03
38
.0
5%
0.
02
35.2
1%
µCi/m
LµC
i/mL
µCi/m
LµC
i/mL
137 C
s(c)
nr
0.00
036
9%
nr
0.
0003
7 13
%
J nr
94
2(d)
4%
nr
94
9(d)
4%
12
5 Sb
0.00
03
0.00
03
U
0.
0003
0.
0003
U
4 4
U
4
4
U
Ana
lyte
s det
ecte
d ar
e bo
lded
for c
larit
y an
d be
tter r
eada
bilit
y.
Stan
dard
dev
iatio
n (S
D) i
n re
port
in p
erce
nt.
NA
= n
ot a
pplic
able
; n
r = n
ot re
porte
d
U s
igni
fies u
ndet
ecte
d an
alyt
e; th
e co
ncen
tratio
n pr
ovid
ed re
pres
ents
the
IDL
mul
tiplie
d by
the
sam
ple
dilu
tion
fact
ors.
J si
gnifi
es a
n es
timat
ed c
once
ntra
tion;
the
anal
yte
conc
entra
tion
is >
MD
L bu
t <EQ
L. F
or ra
dioc
hem
ical
ana
lyse
s, th
e un
certa
inty
is >
10%
.
(a)
Ura
nium
resu
lts b
y K
PA
(b)
Tota
l Cs,
135 C
s, an
d 13
7 Cs w
ere
calc
ulat
ed fr
om th
e IC
P-M
S 13
3 Cs r
esul
ts, a
nd in
depe
nden
t Cs a
tom
ic m
ass r
atio
s det
erm
ined
by
ICP-
MS:
133 C
s 52.
9%, 13
5 Cs
15.0
%, 13
7 Cs 3
2.2%
. M
DL
is se
t to 1
33C
s MD
L.
(c)
Dec
ay c
orre
ctio
n re
fere
nce
date
is n
omin
ally
Mar
ch 2
002.
(d
)Th
e13
7 Cs c
once
ntra
tion
is c
alcu
late
d to
be
10.8
and
10.
9 g/
mL
base
d on
the
spec
ific
activ
ity o
f 137 C
s (87
C
i/g)
.

5.7
Table 5.4. AZ-102 Filtered Concentrate (AZ-102C) Metals Analysis by ICP-AES
Process Blank 1 Process Blank 2 Sample DuplicateMDL 02-751 PB1 Data MDL 02-751 PB2 Data MDL 02-751 Data MDL 02-751D Data
Analyte µg/mL(a) Flag µg/mL(a) Flag µg/mL(a) Flag µg/mL(a) FlagICP-AES Test Specification Analytes
Al 1.6 [2.0] J 1.6 1.6 U 7.9 917 8.2 941 Ca 6.7 6.7 U 6.7 6.7 U 33 33 U 34 34 U Cr 0.54 0.54 U 0.53 0.53 U 2.6 1,490 2.7 1,530 Li 0.81 0.81 U 0.80 0.80 U 4.0 4.0 U 4.1 4.1 UK 54 54 U 53 53 U 264 6,560 273 6,750 Na 4.0 [19] J 4.0 [14] J 20 104,000 20 108,000 U 54 54 U 53 53 U 260 260 U 270 270 U
Other Analytes Measured Ag 0.67 0.67 U 0.67 0.67 U 3.3 3.3 U 3.4 3.4 U As 6.7 6.7 U 6.7 6.7 U 33 33 U 34 34 U B 1.34 [13] XJ 1.3 [12] XJ 6.6 69 BX 6.8 85 BXBa 0.27 0.27 U 0.27 0.27 U 1.3 1.3 U 1.4 1.4 U Be 0.27 0.27 U 0.27 0.27 U 1.3 1.3 U 1.4 1.4 U Bi 2.7 2.7 U 2.7 2.7 U 13 13 U 14 14 U Cd 0.40 0.40 U 0.40 0.40 U 2.0 2.0 U 2.0 2.0 U Ce 5.4 5.4 U 5.3 5.3 U 26 26 U 27 27 U Co 1.3 1.3 U 1.3 1.3 U 6.6 6.6 U 6.8 6.8 U Cu 0.67 0.67 U 0.67 0.67 U 3.3 3.3 U 3.4 3.4 U Dy 1.3 1.3 U 1.3 1.3 U 6.6 6.6 U 6.8 6.8 U Eu 2.7 2.7 U 2.7 2.7 U 13 13 U 14 14 U Fe 0.67 0.67 U 0.67 0.67 U 3.3 3.3 U 3.4 3.4 U La 1.3 1.3 U 1.3 1.3 U 6.6 6.6 U 6.8 6.8 U Mg 2.7 2.7 U 2.7 2.7 U 13 13 U 14 14 U Mn 1.3 1.3 U 1.3 1.3 U 6.6 6.6 U 6.8 6.8 U Mo 1.3 1.3 U 1.3 1.3 U 6.6 108 6.8 111 Nd 2.7 2.7 U 2.7 2.7 U 13 13 U 14 14 U Ni 0.81 [0.88] J 0.80 0.80 U 4.0 4.0 U 4.1 4.1 U P 2.7 2.7 U 2.7 2.7 U 13 283 14 290
Pb 2.7 2.7 U 2.7 2.7 U 13 13 U 14 14 U Pd 20 20 U 20 20 U 99 99 U 100 100 U Rh 8.1 8.1 U 8.0 8.0 U 40 40 U 41 41 U Ru 30 30 U 29 29 U 145 145 U 150 150 U Sb 13 13 U 13 13 U 66 66 U 68 68 U Se 6.7 6.7 U 6.7 6.7 U 33 33 U 34 34 U Si 13 [33] J 13 [25] J 66 [220] BJ 68 [290] BJSn 40 40 U 40 40 U 200 200 U 200 200 U Sr 0.40 0.40 U 0.40 0.40 U 2.0 2.0 U 2.0 2.0 U Te 40 40 U 40 40 U 200 200 U 200 200 U Th 27 27 U 27 27 U 130 130 U 140 140 U Ti 0.67 0.67 U 0.67 0.67 U 3.3 3.3 U 3.4 3.4 U Tl 13 13 U 13 13 U 66 66 U 68 68 U V 1.3 1.3 U 1.3 1.3 U 6.6 6.6 U 6.8 6.8 U

5.8
Process Blank 1 Process Blank 2 Sample DuplicateMDL 02-751 PB1 Data MDL 02-751 PB2 Data MDL 02-751 Data MDL 02-751D Data
Analyte µg/mL(a) Flag µg/mL(a) Flag µg/mL(a) Flag µg/mL(a) FlagW 54 54 U 53 53 U 260 260 U 270 270 U Y 1.3 1.3 U 1.3 1.3 U 6.6 6.6 U 6.8 6.8 U Zn 1.3 1.3 U 1.3 1.3 U 6.6 6.6 U 6.8 6.8 U Zr 1.3 1.3 U 1.3 1.3 U 6.6 6.6 U 6.8 6.8 U
Analytes detected by ICP-AES are bolded for clarity and better readability.
U signifies undetected analyte; the concentration provided represents the IDL multiplied by the sample dilution factors.
B signifies that the associated preparative blank concentration resulted in 5% or more of the sample concentration. X signifies that a QC parameter (e.g., precision, blank spike recovery, etc.) was exceeded. J signifies an estimated concentration; the concentration is >MDL but <EQL.
(a) The overall error for bolded values without brackets is estimated to be within 15% (analytes greater than 10 times the MDL). Bracketed values identify sample concentrations that are <10 times the MDL, and errors likely exceed 15%.
Table 5.4 (Contd)

5.9
Tab
le 5
.5.
AZ-
102
Filte
red
Con
cent
rate
(AZ-
102C
) Ani
on a
nd T
IC/T
OC
Ana
lysi
s
Proc
ess B
lank
Sa
mpl
eD
uplic
ate
EQ
L(a
)M
DL
(a)
02-7
51 P
B
Dat
a E
QL
(a)
MD
L(a
)02
-751
PB
D
ata
EQ
L(a
)M
DL
(a)
02-7
51 P
BD
ata
Ana
lyte
g/
mL
Fl
ag
g/m
L
Flag
g/
mL
Fl
ag
Tes
t Spe
cific
atio
n A
naly
tes
F (b)
1.4
NA
1.
4 U
14
0 N
A
1,84
0
140
NA
1,
690
Cl
1.4
NA
1.
4 U
14
0 N
A
140
U
140
NA
14
0 U
N
O2
2.8
NA
2.
8 U
1,
400
NA
81
,800
1,40
0 N
A
74,1
00
NO
3 2.
8 N
A
2.8
U
1,40
0 N
A
39,4
00
1,
400
NA
36
,000
O
H
N
A
(d)
U
NA
N
A
17,4
00
NA
20
,100
O
ther
Ana
lyte
s Mea
sure
d
TO
C/F
(c)
NA
N
A
NM
(e)
N
A
1,00
0 1
4,50
0
NA
1,
000
13
,300
TO
C/P
(c)
NA
NA
N
M(e
)
NA
500
500
U
NA
500
1,00
0 TI
C/F
(c)
NA
NA
N
M(e
)N
A1,
000
1,00
0 U
N
A1,
400
1,40
0 U
TI
C/P
(c)
NA
NA
N
M(e
)
NA
190
15,0
00
N
A19
0 14
,100
B
r 1.
4 N
A
1.4
U
140
NA
14
0 U
14
0 N
A
140
U
C2O
4 2.
8 N
A
2.8
U
280
NA
1,
900
X
280
NA
1,
450
XPO
4 2.
8 N
A
2.8
U
280
NA
1,
380
28
0 N
A
1,31
0 SO
4 2.
8 N
A
2.8
U
1,40
0 N
A
37,1
00
1,
400
NA
33
,600
A
naly
tes d
etec
ted
are
bold
ed fo
r cla
rity
and
bette
r rea
dabi
lity.
N
A =
not
app
licab
le; N
M =
not
mea
sure
d U
sig
nifie
s und
etec
ted
anal
yte;
the
conc
entra
tion
prov
ided
repr
esen
ts th
e ID
L m
ultip
lied
by th
e sa
mpl
e di
lutio
n fa
ctor
s. X
sig
nifie
s tha
t a Q
C p
aram
eter
(e.g
., pr
ecis
ion,
bla
nk sp
ike
reco
very
, etc
.) w
as e
xcee
ded.
(a)
F, C
l, N
O2,
NO
3, PO
4, SO
4, B
r, an
d C
2O4 r
epor
t onl
y re
sults
abo
ve th
e EQ
L; th
eref
ore,
the
EQL
is p
rese
nted
in th
is c
olum
n. F
or a
ll ot
her a
naly
tes,
the
MD
L is
pre
sent
ed.
(b)
Fluo
ride
resu
lts sh
ould
be
cons
ider
ed th
e up
per b
ound
con
cent
ratio
n. S
igni
fican
t pea
k di
stor
tion
of th
e F
peak
sugg
ests
the
pres
ence
of c
o-el
utin
g an
ion(
s), p
ossi
bly
form
ate
or a
ceta
te.
(c)
For T
OC
and
TIC
: P=
by h
ot p
ersu
lfate
met
hod;
F=b
y fu
rnac
e m
etho
d/TI
C b
y di
ffer
ence
(TIC
= to
tal c
arbo
n [T
C]-
TOC
); sy
stem
bla
nks a
re
subt
ract
ed fr
om a
ll sa
mpl
e re
sults
per
pro
cedu
re a
nd a
re n
ot re
porte
d (i.
e., n
ot a
pplic
able
, NA
). (d
)Fo
r the
OH
bla
nk, n
o in
flect
ion
poin
t was
det
ecte
d.
(e)
The
sam
ple
was
dilu
ted
befo
re a
naly
sis;
a d
iluen
t bla
nk w
as n
ot a
naly
zed.
5.10
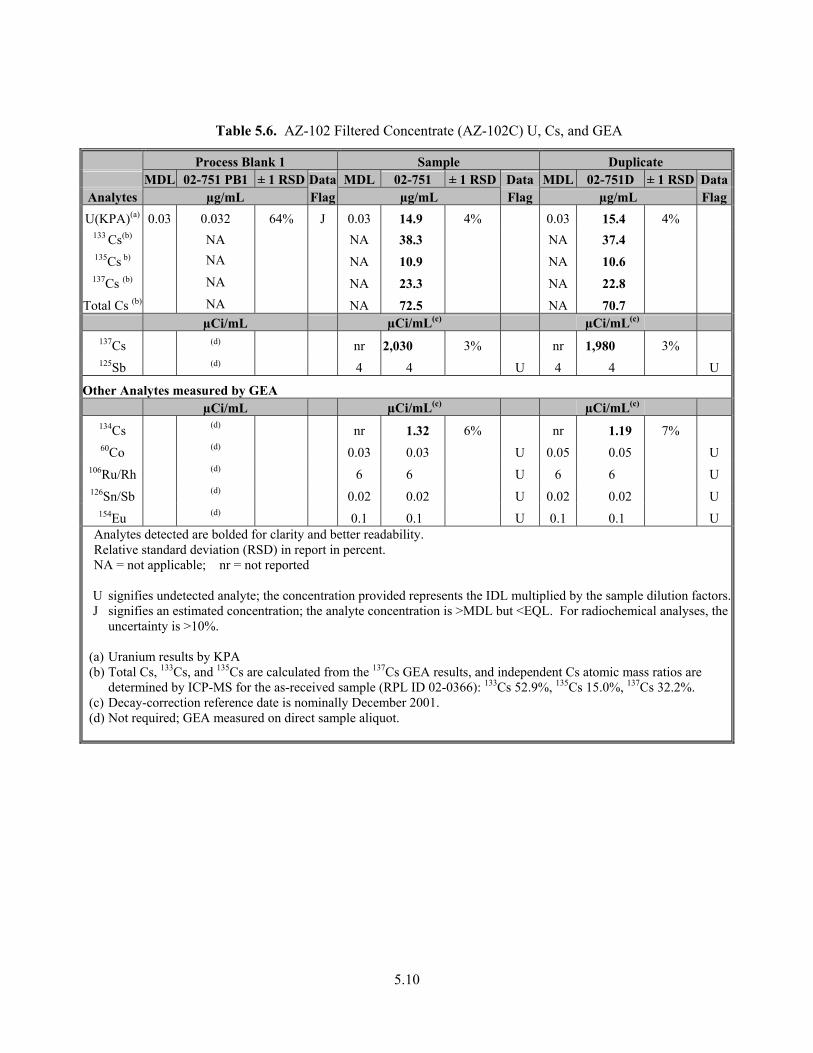
Table 5.6. AZ-102 Filtered Concentrate (AZ-102C) U, Cs, and GEA
Process Blank 1 Sample DuplicateMDL 02-751 PB1 ± 1 RSD Data MDL 02-751 ± 1 RSD Data MDL 02-751D ± 1 RSD Data
Analytes µg/mL Flag µg/mL Flag µg/mL FlagU(KPA)(a) 0.03 0.032 64% J 0.03 14.9 4% 0.03 15.4 4%
133 Cs(b) NA NA 38.3 NA 37.4 135Cs b) NA NA 10.9 NA 10.6 137Cs (b) NA NA 23.3 NA 22.8
Total Cs (b) NA NA 72.5 NA 70.7 µCi/mL µCi/mL(c) µCi/mL(c)
137Cs (d) nr 2,030 3% nr 1,980 3% 125Sb (d) 4 4 U 4 4 U
Other Analytes measured by GEA µCi/mL µCi/mL(c) µCi/mL(c)
134Cs (d) nr 1.32 6% nr 1.19 7% 60Co (d) 0.03 0.03 U 0.05 0.05 U
106Ru/Rh (d) 6 6 U 6 6 U 126Sn/Sb (d) 0.02 0.02 U 0.02 0.02 U
154Eu (d) 0.1 0.1 U 0.1 0.1 U Analytes detected are bolded for clarity and better readability. Relative standard deviation (RSD) in report in percent. NA = not applicable; nr = not reported
U signifies undetected analyte; the concentration provided represents the IDL multiplied by the sample dilution factors.J signifies an estimated concentration; the analyte concentration is >MDL but <EQL. For radiochemical analyses, the
uncertainty is >10%.
(a) Uranium results by KPA (b) Total Cs, 133Cs, and 135Cs are calculated from the 137Cs GEA results, and independent Cs atomic mass ratios are
determined by ICP-MS for the as-received sample (RPL ID 02-0366): 133Cs 52.9%, 135Cs 15.0%, 137Cs 32.2%. (c) Decay-correction reference date is nominally December 2001. (d) Not required; GEA measured on direct sample aliquot.

5.11
Table 5.7. AZ-102C Precipitated Solids Metals Analysis
Process Blank 1 Sample DuplicateMDL 02-1299 PB1 Data MDL 02-1299 Data MDL 02-1299D Data
Analyte µg/g(a) Flag µg/g(a) Flag µg/g(a) Flag ICP-AES Test Specification Analytes
Al 7.2 [31] J 7.3 1,040 6.9 1,110 Ca 30 30 U 30 [260] J 29 [260] JCr 2.4 2.4 U 2.4 1,260 2.3 1,160 Li 3.6 3.6 U 3.6 3.6 U 3.5 3.5 U K 240 240 U 243 5,660 X 231 5,250 XNa 18 272 X 91 367,000 X 87 362,000 XU 240 240 U 240 240 U 230 230 U
Other Analytes Measured Ag 3.0 3.0 U 3.0 3.0 U 2.9 2.9 U As 30 30 U 30 30 U 29 29 U B 6.0 212 6.1 1,500 XB 5.8 1,460 XBBa 1.2 1.2 U 1.2 [7.2] J 1.2 [6.5] JBe 1.2 1.2 U 1.2 1.2 U 1.2 1.2 U Bi 12 12 U 12 12 U 12 12 U Cd 1.8 1.8 U 1.8 [4.0] J 1.7 [4.1] JCe 24 24 U 24 24 U 23 23 U Co 6.0 6.0 U 6.1 6.1 U 5.8 5.8 U Cu 3.0 3.0 U 3.0 3.0 U 2.9 2.9 U Dy 6.0 6.0 U 6.1 6.1 U 5.8 5.8 U Eu 12 12 U 12 12 U 12 12 U Fe 3.0 [6.0] J 3.0 [19] JB 2.9 [21] JBLa 6.0 6.0 U 6.1 [6.5] J 5.8 [6.3] JMg 12 12 U 12 12 U 12 12 U Mn 6.0 6.0 U 6.1 6.1 U 5.8 5.8 U Mo 6.0 6.0 U 6.1 95 5.8 87Nd 12 12 U 12 [15] J 12 [15] JNi 3.6 3.6 U 3.6 3.6 U 3.5 3.5 U P 12 12 U 12 235 12 222
Pb 12 12 U 12 12 U 12 12 U Pd 90 90 U 91 91 U 87 87 U Rh 36 36 U 36 36 U 35 35 U Ru 130 130 U 130 130 U 130 130 U Sb 60 60 U 61 61 U 58 58 U Se 30 30 U 30 30 U 29 29 U Si 60 [600] J 61 7230 XB 58 4870 XBSn 180 180 U 180 180 U 170 170 U Sr 2 1.8 U 1.8 [2.8] J 1.7 [2.6] JTe 180 180 U 180 180 U 170 170 U Th 120 120 U 120 120 U 120 120 U Ti 3.0 3.0 U 3.0 [5.2] J 2.9 [5.5] JTl 60 60 U 61 61 U 58 58 U

5.12
Process Blank 1 Sample DuplicateMDL 02-1299 PB1 Data MDL 02-1299 Data MDL 02-1299D Data
Analyte µg/g(a) Flag µg/g(a) Flag µg/g(a) Flag V 6 6.0 U 6.1 6.1 U 5.8 5.8 U W 240 240 U 240 240 U 230 230 U Y 6 6.0 U 6.1 6.1 U 5.8 5.8 U Zn 6.0 6.0 U 6.1 6.1 U 5.8 5.8 U Zr 6.0 6.0 U 6.1 [16] J 5.8 [16] J
Analytes detected by ICP-AES are bolded for clarity and better readability.
U signifies undetected analyte; the concentration provided represents the IDL multiplied by the sample dilution factors.
B signifies that the associated preparative blank concentration resulted in 5% or more of the sample concentration.
X signifies that a QC parameter (e.g., precision, blank spike recovery, etc.) was exceeded. J signifies an estimated concentration; the concentration is >MDL but <EQL.
(a) The overall error for bolded values without brackets is estimated to be within 15% (analytes greater than 10-times the MDL). Bracketed values identify sample concentrations that are <10 times the MDL, and errors likely exceed 15%.
Table 5.7 (Contd)

5.13
Table 5.8. AZ-102C Precipitated Solids Anion Analysis
Process Blank Sample Duplicate
EQL(a) 02-1299 PB Data EQL(a) 02-1299 Data EQL(a) 02-1299D DataAnalyte µg/g Flag µg/g Flag µg/g Flag
Test Specification Analytes F (b) 8 8 U 1,400 40,400 1,500 39,900 Cl 8 8 U 71 71 U 73 73 U
NO2 16 16 U 2,800 49,900 2,900 44,000 NO3 16 16 U 2,800 27,200 2,900 24,400 PO4 16 16 U 140 600 150 590 SO4 16 16 U 2,800 225,000 2,900 213,000
Other Analytes Measured Br 8 8 U 71 71 U 73 73 U
C2O4 16 16 U 2,800 217,000 2,900 225,000 Analytes detected are bolded for clarity and better readability.
U signifies undetected analyte; the concentration provided represents the IDL multiplied by the sample dilution factors.
(a) F, Cl, NO2, NO3, PO4, SO4, Br, and C2O4 report only results above the EQL. (b) Fluoride results should be considered the upper bound concentration. The F is not resolved
from formate or acetate.

5.14
Table 5.9. AZ-102C Precipitated Solids Gamma Analysis
Process Blank 1 Sample DuplicateMDL 02-1299 PB ± 1SD Data MDL 02-1299 ± 1SD Data MDL 02-1299D ± 1SD Data
Analytes µCi/g(a) Flag µCi/g(a) Flag µCi/g(a) Flag Test Specification Analytes
137Cs nr 0.021 5% nr 1,390 4% nr 1,300 4% 125Sb 0.002 0.002 U 4 4 U 4 4 U
µg/g µg/g µg/g137Cs nr 0.0003 nr 16.0 4% nr 14.9 4%
Cs (total) NA (b) NA 49.6(c) 4% NA 46.4(c) 4%
Other Analytes Measured µCi/g(a) µCi/g(a) µCi/g(a)
241Am nr 0.001 23% J 20 20 U 20 20 U Analytes detected are bolded for clarity and better readability. Standard deviation (SD) in report in percent. NA = not applicable; nr = not reported
U signifies undetected analyte; the concentration provided represents the IDL multiplied by the sample dilution factors.
J signifies an estimated concentration; the analyte concentration is >MDL but <EQL. For radiochemical analyses, the uncertainty is >10%.
(a) Decay correction reference date is nominally February 2002. (b) Total Cs cannot be determined since isotopic ratio of the blank is not known. (c) Total Cs and 137Cs in g/g are calculated from the GEA 137Cs concentration, specific activity of 137Cs
(87 Ci/ g), and the isotopic ratio of AZ-102 as-received supernatant (RPL ID 02-0366) where 137Cs = 32.2 wt%.
5.4 X-Ray Diffraction Analysis of Solids
The duplicate sample analyses resulted in virtually identical XRD spectra. An XRD spectrum with the stick diagrams of identified components is given in Figure 5.1. The major phases found in the solids were sodium fluorosulfate (Na3FSO4, Kogarkoite) and sodium oxalate (Na2C2O4, natroxalate). The dominant materials found by destructive analysis support the Na3FSO4 and Na2C2O4 compositions where 36-wt% Na, 4-wt% F, 22-wt% SO4, and 22-wt% C2O4 were found. A small amount of sodium nitrite (NaNO2) was present and is supported by the measured 4.7-wt% NO2. Very small amounts of phases matching zinc nitrate hydroxide hydrate [Zn5(NO3)2(OH)8 2H2O] and potassium hydrogen acetate (C6H11KO6) patterns were present. Potassium was detected by ICP-AES analysis in the AZ-102C solids at 0.5 wt%; however, zinc was not detected. A breakdown of the estimated solids composition based on the anion, metals, and XRD results is provided in Table 5.10. The presence of NaNO3 is estimated based on the anion and cation composition, but was not detected by XRD.

5.15
Table 5.10. Estimated Solids Composition from AZ-102 Evaporation
Compound Formula Weight percent Sodium fluorosulfate Na3FSO4 57 Sodium oxalate Na2C2O4 28 Sodium nitrite NaNO2 7 Sodium nitrate(a) NaNO3 4 Minor constituents Various 4 (a) The presence of NaNO3 is assumed based on ICP-AES and IC analyses; its
presence is not supported by the XRD analysis.
Figure 5.1. XRD Pattern for Precipitated AZ-102C Solids with Matching Stick Diagrams of Identified Components
The major phases (Na3FSO4 and Na2C2O4) certainly precipitated from solution as part of the AZ-102 concentration process. A small fraction (~4.6 g) of the total solids mass (35.5 g) was contributed from total dissolved solids of residual AZ-102C (Section 3.3). It is possible that the observed NaNO2 and predicted NaNO3 are from the dried, residual AZ-102 concentrate fraction.

5.16
5.5 Fractional Analyte Recovery
Within analytical uncertainty, generally 100% of the anions and metals present in the AZ-102 as-received sample were recovered in the combined AZ-102 concentrate filtrate plus solids. Most of the analytes in the AZ-102 as-received material were recovered in the AZ-102 concentrate filtrate. Losses from the aqueous phase to the solid phase were found for SO4, F, C2O4, and some Na. Analyte concentrations, masses, and fractionations are summarized in Table 5.11. Despite the presence of SO4 inthe solids, the final SO4 concentration in the aqueous phase was a factor of 1.8 more concentrated than the initial sulfate concentration and equivalent to the average concentration factors of other analytes. Oxalate concentration, however, dropped with the aqueous phase volume reduction from an initial 0.036 M to a final 0.019 M. Silicon showed mass loss; however, the aqueous compositions had high uncertainties for Si, and thus initial and final Si masses in the aqueous fractions may be higher or lower than shown.

5.17
Tab
le 5
.11.
Mas
s Bal
ance
of V
ario
us A
naly
tes
AZ-
102
As-
Rec
eive
d A
Z-10
2 C
once
ntra
te
AZ-
102
Prec
ipita
ted
Solid
s
Ana
lyte
A
vera
ge M
T
otal
mg
Ave
rage
M
Tot
al m
g%
reco
vere
dC
onc.
fa
ctor
A
vera
ge µ
g/g
Tot
al m
g%
rec
over
ed
%ac
coun
ted
for
Met
als
Al
1.90
E-2
1.73
E+3
3.44
E-2
1.68
E+3
97
1.8
1.08
E+3
3.82
E+1
2.2
99.2
C
r 1.
65E-
2 2.
89E+
32.
90E-
2 2.
73E+
3 94
.5
1.8
1.21
E+3
4.30
E+1
1.5
96
K
8.56
E-2
1.13
E+4
1.70
E-1
1.20
E+4
107
2.0
5.46
E+3
1.94
E+2
1.7
108
Na
2.80
E+0
2.17
E+5
4.61
E+0
1.92
E+5
88.3
1.
6 3.
65E+
5 1.
29E+
4 6
94.3
U
(KPA
) 4.
24E-
5 3.
40E+
16.
37E-
5 2.
70E+
1 80
.5
1.5
NM
N
A
NA
80
.5
Mo
[6.2
5E-4
] [2
.02E
+2]
1.14
E-3
1.98
E+2
97.9
1.
8 9.
07E+
1 3.
22E+
0 [1
.6]
99.5
P
4.84
E-3
5.06
E+2
9.25
E-3
5.18
E+2
102
1.9
2.29
E+2
8.11
E+0
1.6
104
Si
[9.7
9E-3
] [9
.27E
+2]
[9.0
8E-3
] [4
.61E
+2]
49.7
0.
93
6.05
E+03
2.
15E+
2 [2
3.2]
72
.9
Ani
ons
F (a)
5.53
E-2
3.54
E+3
9.29
E-2
3.19
E+3
90.1
1.
7 4.
02E+
4 1.
43E+
3 40
.3
130
NO
2 8.
15E-
1 1.
26E+
5 1.
69E+
0 1.
41E+
5 11
2 2.
1 4.
70E+
4 1.
67E+
3 1.
3 11
3 N
O3
3.15
E-1
6.59
E+4
6.08
E-1
6.82
E+4
103
1.9
2.58
E+4
9.16
E+2
1.4
105
PO4
8.69
E-3
2.78
E+3
1.42
E-2
2.43
E+3
87.4
1.
6 5.
95E+
2 2.
10E+
1 0.
8 88
.2
SO4
2.08
E-1
6.73
E+4
3.68
E-1
6.39
E+4
95
1.8
2.19
E+5
7.78
E+3
11.6
10
7 C
2O4
3.59
E-2
1.07
E+4
1.90
E-2
3.03
E+3
28.4
0.
53
2.21
E+5
7.85
E+3
73.6
10
2 O
H
5.98
E-1
3.43
E+4
1.11
E+0
3.40
E+4
99.2
1.
8 N
M
NA
N
A
99.2
TI
C(b
)6.
12E-
1 2.
48E+
41.
21E+
0 2.
63E+
4 10
6 2.
0 N
M
NA
N
A
106
Rad
iois
otop
e A
vera
ge
µCi/m
LT
otal
µC
iA
vera
ge
µCi/m
LT
otal
µC
i%
reco
vere
d C
onc.
fa
ctor
A
vera
ge µ
Ci/g
Tot
al µ
Ci
%re
cove
red
%ac
coun
ted
for
137 C
s 9.
46E+
2 3.
19E+
6 2.
01E+
3 3.
63E+
6 11
4 2.
1 1
.34E
+3
4.77
E+4
1.5
115
NM
= n
ot m
easu
red;
NA
= n
ot a
pplic
able
The
over
all e
rror
for b
olde
d va
lues
with
out b
rack
ets i
s est
imat
ed to
be
with
in
15%
(ana
lyte
s gre
ater
than
10-
times
the
MD
L).
Bra
cket
ed v
alue
s id
entif
y sa
mpl
e co
ncen
tratio
ns th
at a
re <
10-ti
mes
the
MD
L, a
nd e
rror
s lik
ely
exce
ed 1
5%.
(a)
Fluo
ride
resu
lts sh
ould
be
cons
ider
ed th
e up
per-
boun
d co
ncen
tratio
n. S
igni
fican
t pea
k di
stor
tion
of th
e F
peak
sugg
ests
the
pres
ence
of c
o-el
utin
g an
ion(
s), p
ossi
bly
form
ate
or a
ceta
te.
(b)
TIC
, or c
arbo
nate
, is r
epor
ted
as m
g C
and
is b
ased
on
the
hot p
ersu
lfate
resu
lts.


6.1
6.0 Procedures, Quality Control, and Data Evaluation
A discussion of procedures, data quality, and QC is provided below for each analytical method. Analytical instrument calibration and calibration verification were performed in accordance with the QA Program’s plan Conducting Analytical Work in Support of Regulatory Programs, which is in compliance with the Hanford Analytical Services QA Requirements Document (HASQARD)(a). Raw data, including bench sheets, instrument printouts, data reduction, and calibration files, are maintained or cross-referenced in the Project 42365 file.
The sample averages, MRQs, quality data flags, QC parameters, and QC acceptance criteria are summarized in Tables 6.1 through 6.7. In some cases, one sample value was reported as less than the MDL/MDA (i.e., U flagged) and the duplicate reported with a value (i.e., either J flagged or a value measured above the EQL). The reported average was conservatively estimated as the single reported value above the MDL/MDA.
The QC and results evaluations provided in the following sections are limited to the analytes of interest defined by the TSs (See Section 5.1). Analytes other than those specified by the TSs are considered “opportunistic” and are provided for information only. Some of these “opportunistic” analytes have been measured per the requirements stated in the governing QA Plan or TS; however, the data have not been fully evaluated against the acceptance criteria. The QC performance of “opportunistic” analytes is not discussed.
6.1 Inductively Coupled Plasma-Atomic Emission Spectroscopy Tables 5.1, 5.4, 5.7, 6.1, 6.2, and 6.3
The AZ-102 and AZ-102C acid-digested (PNL-ALO-128) samples and the AZ-102C solids acid-digested (PNL-ALO-129) samples were analyzed according to PNL-ALO-211, Determination of Elements by Inductively Coupled Argon Plasma Atomic Emission Spectrometry. The detected analytes at or above the EQL (equivalent to ten times the MDL) were reported with an uncertainty of ±15% (2- ).As the MDL was approached, uncertainty increased to 100%. The samples (i.e., AZ-102, AZ-102C, and AZ-102C solids) were processed and analyzed at separate times; thus, each had a different set of QC samples for evaluating system performance. Quality control for the ICP-AES analysis consisted of sample duplicates, PBs, MSs, LCS/BSs, post spikes, calibration verification check standards, instrument blanks, interference check standards, and linear range check standards.
AZ-102 as-received: All QC acceptance criteria were met. The ICP-AES MS for this analysis did not contain U; however, the U concentration was <MDL, and the U concentration was measured by KPA, which had a MS. The MSs and post spikes for Na and Cr did not show adequate recovery since the spikes were less than 20% of the analyte concentration; serial dilution was used to assess matrix interferences for these analytes.
(a) Hanford Analytical Services Quality Assurance Requirements Document; Volume 4: Laboratory Technical
Requirements. DOE/RL-96-68, Rev. 2, September 1998.

6.2
AZ-102C concentrate: Except for the Na RPD, all QC acceptance criteria were met. However, Na RPD only slightly exceeded the acceptance criterion (i.e., 3.7% versus criterion of 3.5%) and was not considered a significant failure. The ICP-AES MS for this analysis did not contain U; however, the U concentration was <MDL and the U concentration was measured by KPA, which had a MS. The MSs and post spikes for Na and Cr could not be recovered since the spikes were less than 20% of the analyte concentration; serial dilution was used to assess matrix interferences for these analytes.
AZ-102C solids: Although QC acceptance criteria were not specifically addressed in the TSs, the AZ-102C solids analysis was evaluated to the same criteria as the supernatant analysis. Except for the K and Na LCS/BS and the K MS, all QC acceptance criteria were met. The Na LCS/BS over-recovery was assumed to be from contamination during processing; the PB exhibited Na contamination well above the EQL. The K MS under-recovery was attributed to incorrect K concentration being assigned to the matrix spiking standard (see Appendix E for discussion).a The K post spike, which used a different spiking standard, exhibited excellent recovery, and thus the failure of the K MS was not considered significant.
6.2 Inductively Coupled Plasma/Mass Spectrometry Tables 5.2 and 6.1
Only the AZ-102 as-received supernatant samples (acid digested per PNL-ALO-128) were analyzed by ICP-MS for 133Cs and Cs isotopic analysis according to procedure PNL-ALO-280, InductivelyCoupled Plasma-Mass Spectrometer Analysis. Except for the MS and LCS/BS, the acid-digested samples were from the same processed solutions as were analyzed by ICP-AES analysis.
Quality control for the ICP-MS analysis consisted of sample duplicates, PBs, MS, LCS/BS, calibration verification check standards, and instrument blanks. All QC met the acceptance criteria. The duplicate analyses met the QC criterion of <15% RPD. The Cs MS (i.e., 133Cs) recovery was within the acceptance criteria of 70% to 130%. No Cs was measured in the PBs above the acceptance criteria (i.e., <EQL or <5% of sample concentration).
6.3 U Analysis by KPA Tables 5.3, 5.6, 6.1, and 6.2
Aliquots from the acid digestion (PNL-ALO-128) of the AZ-102 as-received supernatant and AZ-102C concentrate samples were further processed for U analysis. The aliquots were treated with concentrated HNO3, evaporated to dryness, and then re-dissolved in dilute HNO3 for U analysis. Total U was measured according to procedure RPG-CMC-4014, Uranium by Kinetic Phosphorescence Analysis.The AZ-102C solids were not analyzed for U by KPA. The aliquots from the AZ-102 as-received and AZ-102C concentrate samples were processed at different times and analyzed in separate analytical batches. Each processing batch for U(KPA) analysis consisted of a sample, duplicate, PB, MS, and BS. Calibration verification standards and instrument blanks were analyzed to verify system performance.
The U concentration for both the AZ-102 as-received supernatant and AZ-102C concentrate were well below the MRQ value of 780 µg/mL. For both samples, all QC criteria were met with the exception of one MS. The duplicate analysis RPDs (4% and 3%) easily met the QC criterion of <15%. The BS
a The K concentration in the spiking standard was lower than the certificate value.

6.3
recoveries (95% and 91%) met the acceptance criteria of 80% to 120%. The MS recovery for the AZ-102 as-received supernatant met the QC criteria of 75% to 125%, but the MS recovery for the AZ-102C was low at 66%; the reason was unknown. Uranium was present in the SAL hot cell PBs, but at a concentration <<1% of any sample U concentration.
Table 6.1. ICP-AES, ICP-MS, and KPA QC Results for AZ-102
Post Post Lab Matrix Matrix Matrix
02-366 Target Control Spike Spike Spike SerialMRQ MDL Average Data RPD RPD (LCS/BS) (MS) (PS-A) (PS-B) Dilution
Analyte µg/mL(a) µg/mL µg/mL(b) Flag %(c) % % Rec. %Rec. %Rec. % Rec. %D 80% - 75% - 75% - 75% -
Acceptance Criteria 120% 125% 125% 125% < ±10% Test Specification Analytes
Al 75 7.9 518 2.2 <15 99 99 97 0.2 Ca 150 33 33 U <15 101 104 101 Cr 15 2.6 856 2.5 <15 99 n/r n/r 3.4
133Cs(d) 1.5 0.0003 19.4 7.1 <15 99 99 Li 4 3.9 3.9 U <15 101 99 98 K 75 260 3,340 2.1 <15 100 106 93 Na 75 20 64,400 2.1 <3.5 103 n/r n/r 3.0 U 600 260 260 U <15 95 (e)
U (KPA) 780 0.06 10.1 4 <15 95 97 Other Analytes Measured
Ag 3.3 3.3 U As 33 33 U B 6.6 92 B 11.7 113 77 100 Ba 1.3 1.3 U 97 98 96 Be 1.3 1.3 U Bi 13 13 U 98 Cd 2.0 2.0 U 101 101 99 Ce 26 26 U Co 6.6 6.6 U 99 Cu 3.3 3.3 U 98 93 95 Dy 6.6 6.6 U 95
Eu 13 13 U Fe 3.3 3.3 U 99 103 100 La 6.6 6.6 U Mg 13 13 U 102 108 105
Mn 6.6 6.6 U 102 Mo 6.6 [60] J 97 Nd 13 13 U
Ni 3.9 [12] JB 99 102 105 P 13 150 4 101 106 98
Pb 13 13 U 100 98 95

6.4
Post Post Lab Matrix Matrix Matrix
02-366 Target Control Spike Spike Spike SerialMRQ MDL Average Data RPD RPD (LCS/BS) (MS) (PS-A) (PS-B) Dilution
Analyte µg/mL(a) µg/mL µg/mL(b) Flag %(c) % % Rec. %Rec. %Rec. % Rec. %D
Pd 98 98 U Rh 39 39 U
Ru 140 140 U Sb 66 66 U Se 33 33 U Si 66 [280] JB 106
Sn 200 200 U Sr 2.0 2.0 U 98 99 98 Te 200 200 U Th 130 130 U 99 Ti 3.3 3.3 U 93 Tl 66 66 U
V 6.6 6.6 U
W 260 260 U Y 6.6 6.6 U Zn 6.6 6.6 U 100 103 102 Zr 6.6 6.6 U 97
Analytes detected by ICP-AES are bolded for clarity and better readability. Blank areas indicate that QC results were not evaluated, or QC analyses were not performed, for opportunistic (other) analytes.n/r = not recovered; spike concentration <20% of sample concentration.
U signifies undetected analyte; the concentration provided represents the IDL multiplied by the sample dilution factors. B signifies that the associated preparative blank concentration resulted in 5% or more of the sample concentration. J signifies an estimated concentration; the concentration is >MDL but <EQL.
(a) MRQs from 24590-WTP-TSP-RT-01-002, Tables A.1, B.2, and D.1. (b) The overall error for bolded values without brackets is estimated to be within 15% (analytes greater than 10-times
the MDL). Bracketed values identify sample concentrations that are <10-times the MDL, and errors likely exceed 15%.
(c) RPD only calculated when both the sample and duplicate results are greater than the EQL. (d) Cs concentration and QC are based on 133Cs analysis by ICP-MS. (e) U was not present in the MS spike solution.
Table 6.1 (Contd)

6.5
Table 6.2. ICP-AES and KPA QC Results for Filtered AZ-102 Concentrate (AZ-102C)
Post Post Lab Matrix Matrix Matrix
02-751 Target Control Spike Spike Spike SerialMRQ MDL Average Data RPD RPD (LCS/BS) (MS)(d) (PS-A) (PS-B) Dilution
Analyte µg/mL(a) µg/mL µg/mL(b) Flag %(c) % % Rec. %Rec. %Rec. % Rec. %D 80% - 75% - 75% - 75% -
Acceptance Criteria 120% 125% 125% 125% < ±10% Test Specification Analytes
Al 75 7.9 929 2.6 <15 98 95 99 1.6 Ca 150 33 34 U <15 98 99 101 Cr 15 2.6 1,510 2.6 <15 96 n/r n/r 1.5 Li 4 4.0 4.0 U <15 99 94 100 K 75 260 6,660 2.8 <15 99 94 102 Na 75 20 106,000 3.7 <3.5 99 n/r n/r 5.7 U 600 270 270 U <15 99 (e) 103
U (KPA) 780 0.03 15.2 X 3 <15 91 66 Other Analytes Measured
Ag 3.3 3.3 U 101 As 33 33 U 105 B 6.6 77.2 B 21 108 102 100 Ba 1.3 1.3 U 95 94 96 Be 1.3 1.3 U 102 Bi 13 13 U 99 Cd 2.0 2.0 U 99 99 103 Ce 26 27 U 99 Co 6.6 6.6 U 96 102 Cu 3.3 3.3 U 97 86 94 Dy 6.6 6.6 U 100
Eu 13 13 U 99 Fe 3.3 3.3 U 98 100 101 La 6.6 6.6 U 98 Mg 13 13 U 98 103 105
Mn 6.6 6.6 U 100 103 Mo 6.6 110 2.6 99 Nd 13 13 U 100 Ni 4.0 4.0 U 97 100 103 P 13 286 2.5 99 100 101
Pb 13 13 U 107 111 111 Pd 100 100 U 114 Rh 40 40 U 96
Ru 150 150 U

6.6
Post Post Lab Matrix Matrix Matrix
02-751 Target Control Spike Spike Spike SerialMRQ MDL Average Data RPD RPD (LCS/BS) (MS)(d) (PS-A) (PS-B) Dilution
Analyte µg/mL(a) µg/mL µg/mL(b) Flag %(c) % % Rec. %Rec. %Rec. % Rec. %D
Sb 66 66 U 102 Se 33 33 U 103 Si 66 [255] JB 111 Sn 200 200 U 101
Sr 2.0 2.0 U 96 94 97 Te 200 200 U 102 Th 130 130 U 98 Ti 3.3 3.3 U 93 Tl 66 66 U 100
V 6.6 6.6 U 100
W 270 270 U Y 6.6 6.6 U 101 Zn 6.6 6.6 U 98 101 Zr 6.6 6.6 U 97
Analytes detected by ICP-AES are bolded for clarity and better readability. Blank areas indicate that QC results were not evaluated, or QC analyses were not performed, for opportunistic (other) analytes.Shaded/bolded results highlight non-compliances with QC acceptance criteria; see report for discussion. n/r = not recovered; spike concentration <20% of sample concentration.
U signifies undetected analyte; the concentration provided represents the IDL multiplied by the sample dilution factors.
B signifies that the associated preparative blank concentration resulted in 5% or more of the sample concentration. X signifies that a QC parameter (e.g., precision, blank spike recovery, etc.) was exceeded. J signifies an estimated concentration; the concentration is >MDL but <EQL.
(a) MRQs from 24590-WTP-TSP-RT-01-002 Table A.1 and B.2. (b) The overall error for bolded values without brackets is estimated to be within 15% (analytes greater than 10 times
the MDL). Bracketed values identify sample concentrations that are <10-times the MDL, and errors likely exceed 15%.
(c) RPD only calculated when both the sample and duplicate results are greater than the EQL. (d) The process batch matrix spike was prepared from another sample of similar matrix (02-0752, AZ-102C Cs ion
exchange effluent) and run with this sample. (e) U was not present in the MS spike solution.
Table 6.2 (Contd)

6.7
Table 6.3. ICP-AES QC Results for AZ-102C Solids
Post Post Lab Matrix Matrix Matrix
02-1299 Target Control Spike Spike Spike SerialMRQ MDL Average Data RPD RPD (LCS/BS) (MS) (PS-A) (PS-B) Dilution
Analyte µg/g(a) µg/g µg/g(b) Flag %(c) % % Rec. %Rec. %Rec. % Rec. %D 80% - 75% - 75% - 75% -
Acceptance Criteria 120% 125% 125% 125% < ±10% Test Specification Analytes
Al NA 6.9 1,080 6.3 <15 105 101 101 3.2 Ca NA 29 [260] J <15 103 97 103 Cr NA 2.3 1,210 8.4 <15 106 n/r 103 5.0 Li NA 3.5 3.5 U <15 106 99 103 K NA 231 5,460 X 7.5 <15 35(e) 24(e) 98 -1.6 Na NA 87 364,500 X 1.5(d) <3.5 144 n/r 109 -0.1(d)
U NA 240 240 U <15 107 99 102 Other Analytes Measured
Ag 2.9 2.9 U 101 As 29 29 U 105 B 5.8 1,480 BX 2.4 169 136 103 3.3 Ba 1.2 [6.9] J 105 92 102 Be 1.2 1.2 U 100 98 103 Bi 12 12 U 108 106 103 Cd 1.7 [4.1] J 103 100 105 Ce 23 23 U 105 97 98
Co 5.8 5.8 U 106 Cu 2.9 2.9 U 111 91 103 Dy 5.8 5.8 U 101 Eu 12 12 U 102 Fe 2.9 [20] JB 109 107 106 La 5.8 [6.4] J 103 96 101 Mg 12 12 U 104 100 109
Mn 5.8 5.8 U 105 99 105 Mo 5.8 91 8.4 106 97 104 3.5 Nd 12 [15] J 103 96 99 Ni 3.5 3.5 U 106 102 106 P 12 229 5.6 103 100 103 0.4
Pb 12 12 U 117 113 117
Pd 87 87 U Rh 35 35 U 94
Ru 130 130 U Sb 58 58 U 101

6.8
Post Post Lab Matrix Matrix Matrix
02-1299 Target Control Spike Spike Spike SerialMRQ MDL Average Data RPD RPD (LCS/BS) (MS) (PS-A) (PS-B) Dilution
Analyte µg/g(a) µg/g µg/g(b) Flag %(c) % % Rec. %Rec. %Rec. % Rec. %D
Se 29 29 U 105 Si 58 6050 BX 39 107 75 111 Sn 180 180 U 83
Sr 1.7 [2.7] J 106 99 106 Te 180 180 U 104 Th 120 120 U 101 97 101 Ti 2.9 [5.4] J 103 97 101 Tl 58 58 U 103
V 5.8 5.8 U 98 93 99
W 240 240 U 100 92 Y 5.8 5.8 U 100 Zn 5.8 5.8 U 111 107 109 Zr 5.8 [16] J 105 101 105
Analytes detected by ICP-AES are bolded for clarity and better readability. Blank areas indicate that QC results were not evaluated, or QC analyses were not performed, for opportunistic (other) analytes.Shaded/bolded results highlight non-compliances with QC acceptance criteria; see report for discussion. n/r = not recovered; spike concentration <20% of sample concentration.
U signifies undetected analyte; the concentration provided represents the IDL multiplied by the sample dilution factors.
B signifies that the associated preparative blank concentration resulted in 5% or more of the sample concentration. X signifies that a QC parameter (e.g., precision, blank spike recovery, etc.) was exceeded. J signifies an estimated concentration; the concentration is >MDL but <EQL.
(a) The TS provides no MRQs for solids. (b) The overall error for bolded values without brackets is estimated to be within 15% (analytes greater than
10 times the MDL). Bracketed values identify sample concentrations that are <10-times the MDL, and errors likely exceed 15%.
(c) RPD only calculated when both the sample and duplicate results are greater than the EQL. (d) RPD calculated from samples after an additional 5x dilution; %D calculated from results after additional 5x and
25x dilutions. (e) The K LCS/BS and MS failures were attributed to instability of K in the multi-element spiking standard. The K
concentration at the time of spiking was much lower than the original certified value (see Appendix E for discussion).
Table 6.3 (Contd)

6.9
6.4 Gamma Spectrometry Tables 5.3, 5.6, 5.9, and 6.4
Diluted aqueous sample aliquots were directly counted for gamma emitters according to procedure PNL-ALO-450, Gamma Energy Analysis and Low-Energy Photon Spectrometry. For the GEA analyses performed on acid-digested aliquots (i.e., RPL ID 02-366 and 02-1299), only sample, duplicate, and PBs were analyzed for gamma emitters; LCS/BS and MS were not prepared, nor required, for this analysis since the measurement is a direct reading of the gamma energy and is not subject to matrix interferences. The AZ-102C concentrate (i.e., RPL ID 02-751) was analyzed without digestion processing, and no PB was prepared. Before any analysis, reference standard and background counts were performed to verify GEA system performance. Only 137Cs and 125Sb determinations were required.
All 137Cs sample results were well above the MRQ. All SAL hot cell PBs show the presence of 137Cs,but the activities in the PBs are negligible with respect to the sample activities. The sample duplicates showed excellent repeatability for 137Cs with RPD values well within the acceptance criterion of <15%. No 125Sb was detected above the MDA of 4 Ci/mL for the supernatants or 4 Ci/g for the solids.
Table 6.4. GEA QC Results for 137Cs
RPL ID Sample ID MRQ
µCi/mL(a)Average 137Cs µCi/mL(b) 1SD
DataFlag RPD %
Target RPD%
02-366 AZ102 As-received Filtrate 0.01 946 4% 1 <15 02-751 AZ102C Concentrate 0.01 2,010 3% 3 <15
02-1299 AZ102C Solids NA 1,350(c) 4% 6.7 <15 Analytes detected are bolded for clarity and better readability. Standard deviation (SD) in report in percent. NA = not applicable
(a) MRQ from TS 24590-PTF-TSP-RT-01-002. (b) GEA decay correction reference dates: 02-366 Feb 4, 2002; 02-751 Dec 3, 2001;
02-1299 Feb 20, 2002. (c) AZ102C Solids reported as µCi/g.
6.5 AnionsTables 5.2, 5.5, 5.8, 6.5, 6.6, and 6.7
Anion analyses were conducted according to method PNL-ALO-212, Determination of Inorganic Anions by Ion Chromatography. The IC method was used to evaluate the anions of interest on unprocessed aqueous sub-samples and on the water leach solutions (PNL-ALO-103) of the solids sample. Aliquots of the aqueous sub-samples and water leach solutions were prepared for IC anion analysis by dilution (100x to 5000x for aqueous samples and 10x to 200x for the water leach solutions) to assure that the anions were measured within the calibration range. The samples (i.e., AZ-102, AZ-102C, and AZ-102C solids) were processed and analyzed at separate times; thus, each has a different set of QC samples for evaluating system performance. Quality control for the anion analyses consisted of sample duplicates, PBs, MSs, BSs, calibration verification check standards, and instrument blanks.

6.10
For the AZ-102, AZ-102C, and AZ-102C solids, all QC samples analyzed meet acceptance criteria, and no further discussion of the QC performance is necessary. Only those anions detected above the lowest calibration standard concentration adjusted for sample dilution factors (i.e., above the EQL) are reported. The EQL was less than the required MRQ for all anions, except F for the AZ-102C solids and Cl for all samples. The high total anion concentration for all samples required significant sample dilution to prevent column overloading during the IC analysis; this dilution made it impossible to meet the very low MRQ (10 g/mL) for Cl.
6.6 Hydroxide Titration Tables 5.2, 5.5, 6.5, and 6.6
The AZ-102 and AZ-102C samples were analyzed in duplicate for the hydroxide content following procedure PNL-ALO-228, Determination of Hydroxyl and Alkalinity of Aqueous Solutions, Leachates & Supernates. Sample aliquots were diluted in the SAL hot cells. These diluted aliquots were analyzed using a Brinkman 636 Auto-Titrator. A 0.1186 N NaOH solution was prepared for use as a verification standard and the matrix spiking solution, and a 0.2040 M HCl solution was prepared as the titrant. The first inflection point was defined as the hydroxide equivalency. The RPDs were within the acceptance criterion of <15%. The BS recoveries were within the acceptance criterion of 80% to 120%; an acceptance criterion for the MS was not specified. No hydroxide was detected in the reagent blanks.
6.7 TOC/TIC by Hot Persulfate and Furnace Tables 5.2, 5.5, 6.5, and 6.6
The AZ-102 and AZ-102C samples were analyzed for TOC and TIC by two different procedures: PNL-ALO-381, Direct Determination of TC, TOC, and TIC in Radioactive Sludges and Liquids by Hot Persulfate Method, and PNL-ALO-380, Determination of Carbon in Solids Using the Coulometric Carbon Dioxide Coulometer. The AZ-102 and AZ-102C samples were analyzed in separate batches; thus, each has a different set of QC samples for evaluating system performance. The AZ-102C solids were not analyzed for TOC or TIC. The TIC and TOC analyses were not required by the test specification. The quality control discussions refer to QA criteria delineated in the QA Plan Conducting Analytical Work in Support of Regulatory Programs.
6.7.1 Hot Persulfate Method (PNL-ALO-381)
The hot-persulfate wet oxidation method uses acid decomposition to measure TIC and acidic potassium persulfate oxidation at 92 to 95 C for measurement of TOC, with both the TIC and TOC being obtained from the same sample. The TC is defined as the sum of the TIC and TOC. All sample results were corrected for average percent recovery of instrument calibration check standards and were also corrected for contribution from the instrument blanks, as per procedure PNL-ALO-381 calculations. The QC for the method uses sample duplicates, LCS (or BS), and a MS.
The LCS/BS recoveries and MS recoveries for both the AZ-102 (as-received) and AZ-102C (concentrate) samples met the QC criteria (i.e., 80% to 120% for LCS/BS and 75% to 125% for MS) for both the TIC and TOC analysis. The RPD for the AZ-102C TIC analysis met the QC criterion of <20%.

6.11
However, the RPD for the AZ-102 TIC analyses was 26% and exceeded the QC criterion; the reason for the poor reproducibility is unknown. The RPDs for the AZ-102 or AZ-102C TOC analyses could not be determined since the TOC results were <5x MDL.
6.7.2 Furnace Oxidation Method (PNL-ALO-380)
The furnace oxidation method determined TOC by combusting an aliquot of sample in oxygen at 700 C for 10 to 20 minutes. The TC was determined on another aliquot of sample by combusting at 1000 C for 10 minutes, and the TIC was obtained by difference between the TC and TOC. All sample results were corrected for average percent recovery of instrument calibration check standards and were also corrected for contribution from the instrument blanks, as per procedure PNL-ALO-380 calculations.The QC for the method uses sample duplicates, LCS (or BS), and a MS.
The LCS/BS recoveries and MS recoveries for both the AZ-102 (as-received) and AZ-102C (concentrate) samples met the QC criteria (i.e., 80% to 120% for LCS/BS and 75% to 125% for MS) for both the TOC and TC analysis. The RPD for AZ-102 and AZ-102C TC analysis and the AZ-102C concentrate TOC analysis met the acceptance criterion of <20%. However, the RPD for the AZ-102 TOC analyses was 23%, and slightly exceeded the QC criterion.
6.7.3 Comparison of TIC/TOC by Hot Persulfate and Furnace Oxidation Methods
The TIC results from the furnace oxidation method were obtained by difference (TC-TOC), with the analysis being performed on two independent sample aliquots (one for TOC and one for TC). The TC for the hot-persulfate method was the summation of the TIC and TOC, with the analyses for both TOC and TIC being performed on a single aliquot under different oxidation conditions.
The average AZ-102 TC result from the hot-persulfate method (7300 g C/mL) was lower than the average TC result from the furnace method (9300 g C/mL), whereas the average AZ-102C TC results from the two methods were in excellent agreement (i.e., both 14,700 g/mL). However, there were significant differences between the TOC and TIC results between the methods for both the AZ-102 and AZ-102C samples. Oxidation efficiency has been shown to vary between the methods as a function of the carbon-bearing compound (Baldwin et al. 1994). Volatile components may be removed by initial sparging during the hot-persulfate method. TIC determination and certain metal carbonates may fully or partially oxidize at the 700 C temperature used for the furnace method TOC determination. Thus, the reported results from the two methods may vary. Typically, the furnace method produces the most accurate TC results (i.e., results from single measurements and not a summation from two measurements) and the hot persulfate method provides the most accurate TIC results.

6.12
Table 6.5. Anion and TOC/TIC QC Results for AZ-102 As-Received
MRQ EQL(a)02-366
Average DataTarget RPD
Lab Control
(LCS/BS)
Matrix Spike(MS)
Matrix Spike Duplicate
(MSD) Analyte µg/mL µg/mL µg/mL Flag
(c)
RPD % % % Rec. % Rec. % Rec. 80% - 75% - 75% -
Acceptance Criteria 120% 125% 125% Test Specification Analytes
F (b) 150 140 1,050 5 <15 94 95 91 Cl 300 140 140 U <15 95 98 96
NO2 3,000 2,800 37,500 3 <15 98 99 108 NO3 3,000 280 19,600 4 <15 92 94 100 OH 17 – 10,200 3 <15 94 91(f)
Other Measured Analytes TOC/F (d) 1,400(a) 10,200(g) 23 102 81 TIC/F (d) 1,400(a) 1,400 U 2(e) 103(e) 104(e)
TOC/P (d) 1000(a) 1,000 U 105 105 TIC/P (d) 380(a) 7,340 26 103 98
Br 140 140 U 97 98 95 C2O4 280 3,160 X 1 100 101 0PO4 280 820 6 95 94 92 SO4 280 20,000 1 94 95 103
Analytes detected are bolded for clarity and better readability. Blank areas indicate that QC results were not evaluated, or QC analyses were not performed, for opportunistic (other) analytes.Shaded/bolded results highlight non-compliances with QC acceptance criteria; see report for discussion. MSD = matrix spike duplicate
U signifies undetected analyte; the concentration provided represents the IDL multiplied by the sample dilution factors.
X signifies that a QC parameter (e.g., precision, blank spike recovery, etc.) was exceeded.
(a) F, Cl, NO2, NO3, PO4, SO4, Br, and C2O4 report only results above the EQL; therefore, the EQL is presented in this column. For all other analytes, the MDL is presented.
(b) Fluoride results should be considered the upper-bound concentration. Significant peak distortion of the F peak suggests the presence of co-eluting anion(s), possibly formate or acetate.
(c) RPD only calculated when both the sample and duplicate results are greater than the EQL. (d) For TOC and TIC: P=by hot persulfate method; F=by furnace method/TIC by difference (TIC = TC-TOC). (e) The LCS and MS recovery represents the recovery for the TC analysis. RPD represents the RPF for the TC
analysis (9,400 g/mL and 9,200 g/mL). (f) No MS criteria for OH specified in TS. (g) One of the two TOC results (11,300 g/mL) was significantly higher than sample and duplicate TC result
(9,400 g/mL and 9,200 g/mL, respectively), suggesting that the average result may be higher than the actual TOC concentration.

6.13
Table 6.6. Anion and TOC/TIC QC Results for Filtered AZ-102 Concentrate (AZ-102C)
MRQ EQL(a)02-751
Average Data(c)
RPDTarget RPD
Lab Control
(LCS/BS)
Lab Control Duplicate(LCS/BS)
Matrix Spike (MS)
Analyte µg/mL(g) µg/mL µg/mL Flag % % % Rec. % Rec. % Rec. 80% - 80% - 75% -
Acceptance Criteria 120% 120% 125% Test Specification Analytes
F (b) 150 140 1,760 9 <15 104 104 104 Cl 10 140 140 U <15 97 96 101
NO2 3,000 1,400 78,000 10 <15 102 103 105 NO3 3,000 1,400 37,700 9 <15 94 96 97 OH 17 18,800 14 <15 93 100(f) 89
Other Analytes TOC-F (d) 1,000(a) 13,900 9 97 112 TIC-F (d) 1,000(a) 1,000 U 6(e) 103(e) 108(e)
TOC-P (d) 500(a) 1000 95 100 TIC-P (d) 220(a) 14,600 6 102 101
Br 140 140 U 98 103 104 C2O4 280 1,680 27 107 107 105 PO4 280 1,340 5 103 103 103 SO4 1,400 35,400 10 102 102 103
Analytes detected are bolded for clarity and better readability. Blank areas indicate that QC results were not evaluated, or QC analyses were not performed, for opportunistic (other) analytes.Shaded/bolded results highlight non-compliances with QC acceptance criteria; see report for discussion.
U signifies undetected analyte; the concentration provided represents the IDL multiplied by the sample dilution factors.
X signifies that a QC parameter (e.g., precision, blank spike recovery, etc.) was exceeded.
(a) F, Cl, NO2, NO3, PO4, SO4, Br, and C2O4 report only results above the EQL; therefore, the EQL is presented in this column. For TOC and TIC analytes, the MDL is presented.
(b) Fluoride results should be considered the upper-bound concentration. Significant peak distortion of the F peak suggests the presence of co-eluting anion(s), possibly formate or acetate.
(c) RPD only calculated when both the sample and duplicate results are greater than the EQL. (d) For TOC and TIC: P=by hot persulfate method; F=by furnace method/TIC by difference (TIC = TC-TOC). (e) The LCS and MS recovery represents the recovery for the TC analysis. The RPD represents the RPD for the TC
analysis (15,300 g/mL and 14,500 g/mL). (f) No MS criteria for OH specified in TS. (g) MRQs from Test Specification 24590-WTP-TSP-RT-01-002.

6.14
Table 6.7. Anion QC Results for AZ-102C Solids
Analyte MRQ g/mL(e)
EQL(a)
µg/g
02-1299 Average µg/g
Data Flag
(b)
RPD %
Target RPD
%
Lab Control Spike (LSC/BS)
% Rec. Post Matrix
Spike% Rec.(c)
Acceptance Criteria 80% - 120% 75% - 125% Test Specification Analytes
F (d) 1,400 40,200 1 <15 90 112 Cl 71 71 U <15 93 106
NO2 2,800 47,000 13 <15 97 110 NO3 2,800 25,800 11 <15 92 102 PO4 140 600 2 <15 92 104 SO4 2,800 219,000 5 <15 92 118
Other Analytes Br 71 71 U 94 105
C2O4 2,800 221,000 3 96 119 Analytes detected are bolded for clarity and better readability. Blank areas indicate that QC results were not evaluated, or QC analyses were not performed, for opportunistic (other) analytes.
U signifies undetected analyte; the concentration provided represents the IDL multiplied by the sample dilution factors.
(a) F, Cl, NO2, NO3, PO4, SO4, Br, and C2O4 report only results above the EQL. (b) RPD only calculated when both the sample and duplicate results are greater than the EQL. (c) The matrix spike was not recoverable. The diluted MS sample (leached) resulted in all anion concentrations
<EQL or <<20% of the sample concentration. A post-matrix spike was performed instead. (d) Fluoride results should be considered the upper-bound concentration. The F co-elutes with formate and acetate. (e) No MRQs for solids were defined.

7.1
7.0 Conclusions
The Hanford tank waste AZ-102 samples received from 222-S were composited and characterized for metals (ICP-AES), inorganic anions, TOC/TIC, and 137Cs. The AZ-102 composite was evaporated to nominally 50% volume, resulting in nominally 1-wt% precipitate formation. The precipitate consisted primarily of Na3FSO4 (57%) and Na2C2O4 (28%). Characterization of the AZ-102 concentrate showed good total mass recovery of most measured analytes (e.g., Na, Al, K, Cr, Mo, P, NO3, NO2, PO4, SO4,OH, and 137Cs), with the notable exception of oxalate. The AZ-102 concentrate was forwarded to the Cs ion exchange task for ion exchange processing.

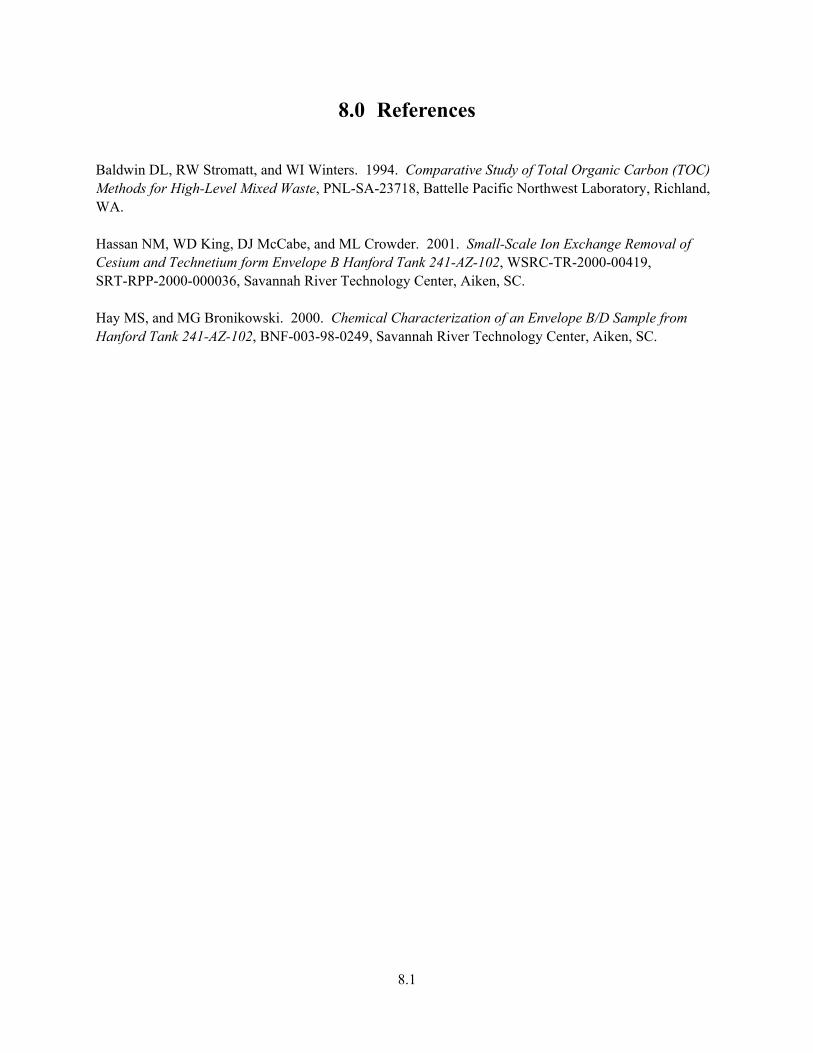
8.1
8.0 References
Baldwin DL, RW Stromatt, and WI Winters. 1994. Comparative Study of Total Organic Carbon (TOC) Methods for High-Level Mixed Waste, PNL-SA-23718, Battelle Pacific Northwest Laboratory, Richland, WA.
Hassan NM, WD King, DJ McCabe, and ML Crowder. 2001. Small-Scale Ion Exchange Removal of Cesium and Technetium form Envelope B Hanford Tank 241-AZ-102, WSRC-TR-2000-00419, SRT-RPP-2000-000036, Savannah River Technology Center, Aiken, SC.
Hay MS, and MG Bronikowski. 2000. Chemical Characterization of an Envelope B/D Sample from Hanford Tank 241-AZ-102, BNF-003-98-0249, Savannah River Technology Center, Aiken, SC.


Appendix A
Chains of Custody


A.1
Appendix A: Chains of Custody


Appendix B
Test Plan TP-RPP-WTP-111 “Tank 241-AZ-101 and 241-AZ-102 Waste Sample Ion
Exchange Testing”


B.1
Appendix B: Test Plan TP-RPP-WTP-111 “Tank 241-AZ-101 and 241-AZ-102 Waste Sample Ion Exchange Testing”


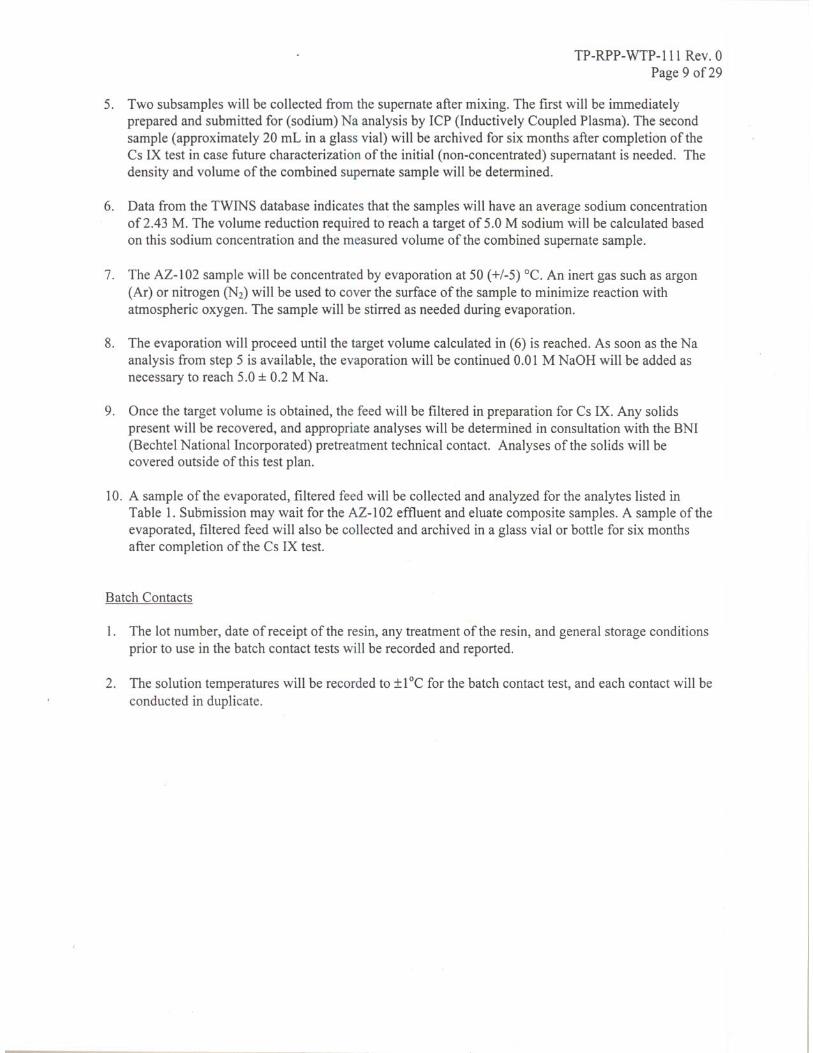


Appendix C
Test Instruction TI-RPP-WTP-127 “Mixing of AZ-102 and Evaporation to Nominally 5 M Na”
and Addendum


C.1
Appendix C: Test Instruction TI-RPP-WTP-127 “Mixing of AZ-102 and Evaporation to Nominally 5 M Na” and Addendum


Appendix D
Target Analyte List, Minimum Reportable Quantities, and QC Acceptance Criteria
Test Specification 24590-PTF-TSP-RT-01-002 Tables A.1, B.2 and D.2

D.1
Appendix D: Target Analyte List, Minimum ReportableQuantities, and QC Acceptance Criteria
Test Specification 24590-PTF-TSP-RT-01-002 Tables A.1, B.2 and D.2


24590-PTF-TSP-RT-01-002 Appendices
Batch Contacts with Cs Ion Exchange ResinNote: Batch contacts are to be conducted prior to the small-scale column tests with the radioactive sample to verify that SuperLig 644 and SuperLig 639 resin exchange capacities are consistent with previous batches of these resins. Since these tests create wastes from listed wastes (AZ-101 and AZ-102) they in turn will be regulated as listed wastes and require appropriate disposal.
1. Personnel are to record the solution temperature to 1oC for the batch contact test. Batch contact tests are to be conducted in duplicate.
2. Personnel are to record the production lot number for the resin samples used in the batch contacts. The resin samples used in the batch contacts are to be from the same production lot as the resin used in the column tests.
3. Personnel are to analyze the AZ-101 feed supernate solution to determine the density, and concentrations of Na, K, free hydroxide, nitrate, fluoride, chloride, nitrite, Cs137, pertechnetate, and total Tc99. The minimum reportable quantity (MRQ) for each analyte is provided in Table A.1. SuperLig 644 and 639 resins have exhibited exchange affinity for these analytes.
Table A.1 Analyte Minimum Reportable Quantity
Analyte MRQ ( g/mL) Na or K 7.5E+01
Cs 1.0 E+01 Al 7.5E+01 Ca 1.5E+02
Free Hydroxide 1.7E+01 Nitrate 3.0E+03 Nitrite 3.0E+03
Chloride 3.0E+02 Fluoride 1.5E+02
Radionuclide MRQ ( Ci/mL)Cs137 1.0E-02
Pertechnetate and Total Tc99 3.0E-03
4. Personnel are to analyze the AZ-102 concentrated supernate solutions to determine the density and concentrations of analytes listed on Table A.1. Radionuclide analysis is for 137Cs. The MRQ for each analyte is provided in Table A.1.
5. Personnel are to contact 0.1 0.01-g of SuperLig 644 resin and 0.1 0.01-g of SuperLig 639 resin with 10 0.1-mL of the solutions listed in Table A.2. Batch contacts are to be conducted for a minimum of 24 hr.

24590-PTF-TSP-RT-01-002 Appendices
d. Personnel are to collect all AZ-102 cesium eluate, composite the eluate, and analyze the eluate to determine the concentrations of the analytes listed in Table B.2. Analytical requirements for the AZ-102 tests are different than for the AZ-101 tests.
Table B.2. Analytical Requirements for AZ-102 Cs Column Effluents and Eluents*
Analyte MRQ ( g/mL) Al 7.5E+01 Ca 1.5E+02 Cr 1.5E+01 K 7.5E+01 Li 4.0E+00 Na 7.5E+01 U 6.00E+02
TOC 1.5+E03 TIC# 7.5E+01 Cl* 1.0 E+01* F 1.5E+02
Nitrate 3.0E+03 Nitrite 3.0E+03
Phosphate 3.0E+03 Sulfate 3.0E+03
Total and free OH 1.70E+01 Density 0.9 to 1.7 g/mL Total Cs 1.5E+00
Radionuclide MRQ ( Ci/mL)Cs137 1.0E-02
Sb-125 ---- * Note the MRQ for the Chloride. # Note: Do not perform the TIC on the AZ-102 eluate.
e. Personnel are to save the cesium eluate solution from both tests for at least 6 months. Personnel are to save the AZ-101 cesium eluate solutions from AZ-101 for combination with HLW sludge for vitrification tests.
9. After eluting and rinsing the lead cesium column, personnel are to regenerate the lead column as follows.
a. Transfer through the lead column 2-total apparatus volumes of 0.25M sodium hydroxide solution at 1 BV/hr.
b. Drain some of the excess liquid from atop the column, leaving approximately 1-BV of sodium hydroxide solution atop the resin bed. Composite and analyze the regeneration solution to determine the concentrations of 137Cs, sodium, and hydroxide in the regeneration solution. Measure the residual concentration of cesium in the columns after elution and regeneration.
c. Personnel are to retain the solution from regeneration of the column.

24590-PTF-TSP-RT-01-002 Appendices
Table D.2. Quality Control Parameters for Pretreated LAW Analysis
QC Acceptance Criteria Liquid Fraction Analytical Technique LCS %Recovery(a) Spike %Recovery(b) Duplicate RSD(c)
Ag, Al, Bi, Ca, Cd, Cr, Cu, Fe, K, Mg, Mn, Nd, Ni, P, Pb, Pd, Rh, Ru, S, Sr, Si, Ti, U, Zn, Zr
ICP/AES 80 - 120% 75 - 125% <15%
Na ICP/AES 80 - 120% 75 - 125% <3.5% As, B, Ba, Be, Ce, Co, La, Li, Mo, Pr, Rb, Sb, Se, Ta, Te, Th, Tl, V, W, mass unit 90(d)
ICP/MS 80 - 120% 70 - 130% <15%
Cl-, F-, NO2-, NO3
-, PO4-3,
SO4-2
IC 80 - 120% 75 - 125% <15%
CN- Distillation Colorimetric
80 - 120% 75 - 125% <15%
Cs(i), Eu(i) ICP/MS N/A N/A N/A Hg CVAA 80 - 120% 75 - 125% <15% NH3/NH4
+ ISE, standard additions 80 - 120% 75 - 125% <15% OH- Potentiometric titration 80 - 120% N/A <15% TIC/CO3
- Persulfate and combustion furnace
80 - 120% 75 - 125% <15%
TOC Silver catalyzed persulfate and combustion furnace
80 - 120% 75 - 125% <15%
Y Derived from calculation
N/A N/A N/A
3H Separation/liq. Scintillation
80 - 120% N/A(e) <15%
14C Separation/liq. Scintillation
80 - 120% 75 - 125% <15%
60Co(f) GEA NP N/A(g) <15% 79Se Liq. Scintillation NP N/A(e) <15% 90Sr Isotopic specific
separation/beta count 75 - 125% N/A(e) <15%
99Tc ICP/MS 80 - 120% 70 - 130% <15% 99Tc (pertechnetate) Separation/beta count 80 - 120% 70 - 130% <15% 125Sb GEA to be obtained 126Sn ICP/MS 80 - 120% 70 - 130% <15% 129I ICP/MS or
Separation/GEA NP N/A(g) <15%
137Cs GEA NP N/A(g) <15% 152Eu(f) GEA NP N/A(g) <15% 154Eu(f) GEA NP N/A(g) <15% 155Eu(f) GEA NP N/A(g) <15% 231Pa ICP/MS Developed by Laboratory 233U ICP/MS 90 - 110% 75 - 125% <15% 234U ICP/MS 90 - 110% 75 - 125% <15% 235U ICP/MS 90 - 110% 75 - 125% <15% 236U ICP/MS 90 - 110% 75 - 125% <15% 238U ICP/MS 80 - 120% 70 - 130% <15% 237Np(e) ICP/MS 90 - 110% 75 - 125% <15% Total Pu Sum of Isotopes N/A N/A N/A 238Pu, 239Pu, 240Pu(h) Separation/AEA NP N/A(e) <15% 241Pu/Am, 242Pu ICP/MS 80 - 120% 70 - 130% <15% 241Am Separation/AEA NP N/A(e) <15% 242Cm Separation/AEA NP N/A(e) <15% 243Am/Cm ICP/MS 90 - 110% 75 - 125% <15% 243 + 244Cm Separation/AEA NP N/A(e) <15% Total Alpha(h) Proportional counter 70 - 130% 70 - 130% <15% Total Beta Beta counting 70 - 130% 70 - 130% <15% Total Gamma GEA-Sum of isotopes N/A N/A N/A

24590-PTF-TSP-RT-01-002 Appendices
Density N/A N/A N/A Wt% dissolved solids Gravimetric 80 - 120% N/A <21% Acronyms:
AEA – Alpha Energy Analysis CVAA – Cold Vapor Atomic Absorption GEA – Gamma Energy Analysis IC – Ion Chromatography ICP/AES – Inductively Coupled Plasma Atomic Emission Spectroscopy ICP/MS – Inductively Coupled Plasma Mass Spectroscopy LSC – Laboratory Control Standard N/A – Not applicable NP – Not performed RSD – Relative Standard Deviation Wt% – Weight percent
Footnotes:
(a) LCS = Laboratory Control Standard. This standard is carried through the entire method. The accuracy of a method is usually expressed as the percent recovery of the LCS. The LCS is a matrix with known concentration of analytes processed with each preparation and analysis batch. It is expressed as percent recovery; i.e., the amount measured, divided by the known concentration, times 100.
(b) For some methods, the sample accuracy is expressed as the percent recovery of a matrix spike sample. It is expressed as percent recovery; i.e., the amount measured less the amount in the sample, divided by the spike added, times 100. One matrix spike is performed per analytical batch. Samples are batched with similar matrices. For other analytes, the accuracy is determined based on use of serial dilutions.
(c) RSD = Relative Standard Deviation between the samples. Sample precision is estimated by analyzing replicates taken separately through preparation and analysis. Acceptable sample precision is usually <15% RSD if the sample result is at least 10 times the instrument detection limit. RSD = (standard deviation of the mean/mean) x 100
(d) ICP-MS mass unit 90 includes 90Sr, 90Y, and 93Zr.
(e) Matrix spike analyses are not required for this method because a tracer is used to correct for analyte loss during sample preparation and analysis. The result generated using the tracer accounts for any inaccuracy of the method on the matrix. The reported results reflect this correction.
(f) An extended counting time in the presence of high 137Cs activity may be required to achieve the minimum reportable quantity for 60Co and 152Eu, 154Eu, 155Eu.
(g) The measurement is a direct reading of the energy and the sample matrix does not affect the analysis; therefore, a matrix spike is not required.
(h) The sum of 238Pu, 239Pu, 240Pu, and 241Am activities will be used as a measurement of alpha-emitting TRU. The selected isotopes account for greater than 95% of the alpha-emitting TRU activity based on previous analysis of Phase I candidate tank waste (Esch 1997a, 1997b, 1997c . Additional isotopes that are defined as alpha-emitting TRU (e.g., 237Np, 242Pu, 242Cm, 243Am, and 243+244Cm) are not used to calculate total TRU activity because the MDAs for these isotopes are large in comparison with the envelope limits and it is expected that their concentrations are well below the MDA. Note that 241Pu is a beta-emitting TRU whose analysis, along with 242Cm, is required specifically for class C waste determination.
(i) Total Cs and Eu are sums of all isotopes, therefore spiking and LCS does not apply.
Table D.2 (Con’t)

Appendix E
ICP-AES Laboratory Control Sample and Matrix Spike Failures – AZ-102C Solids


E.1
Appendix E: ICP-AES Laboratory Control Sample and Matrix Spike Failures – AZ-102C Solids
The Laboratory Control Sample (LCS) processed with the AZ-101C Solids failed to meet the quality control acceptance criterion of 80% to 120% for K, Na, and B. The Matrix Spike failed to meet the QC acceptance criterion of 75% to 125% for K and B, and the Na recovery was not measurable since the sample concentration greatly exceeded the spiking concentration. The reason for each of these failures is described below.
Although the Quality Assurance Plan required re-preparation and re-analysis when the LCS fails, a decision was made not to reanalyze the AZ-102C Solids based on the following.
a) All other QC samples analyzed for K, Na, and B were acceptable. b) The reasons for the failures could be determined. c) The failures were not systematic; i.e., the LCS for K, Na, and B did not fail for the AZ-102
as-received analysis or the AZ-102C liquid analysis. d) The measurement of the AZ-102C solids was performed on an opportunistic basis. e) The AZ-102 mass balance was reasonably good, based on the AZ-102 as-received, AZ-102C
Liquid, and AZ-102C Solids analysis, and the AZ-102C Solids made up only about 1% of the mass.
f) The AZ-102C solids dose levels were significantly high, and additional exposure to staff was not warranted based on data needs.
Potassium Failure Investigation
The LCS and MS were prepared from the same multi-element standard solutions (PBNL-QC-1 and PBNL-QC-2 from Inorganic Ventures, Inc.). The multi-element standard solutions were used over about a 3-month period and were used for the AZ-102 as-received, AZ-102C Liquid, and AZ-102C Solids ICP-AES analyses. The as-received and Liquid analyses were conducted within 1 month of the procurement of the standards, whereas the Solids analysis was conducted about 3 months after procurement. Only the LCS and MS associated with the AZ-102C Solids failed.
Just before preparing the LCS and MS for the AZ-102C Solids analysis, an LCS K failure (~30% recovery) on another batch of samples using the same multi-element solutions prompted an investigation. Based on the investigation, the multi-element standard PBNL-QC-2 was determined to have deteriorated and was removed from service. Unfortunately, this was not in time to restrict its use for the AZ-102C Solids analysis.
During the investigation, the laboratory analyzed the PBNL-QC-2 solution multiple times with an average recovery of about 35% of the certified concentration. The vendor was notified and conducted an independent evaluation of archived material. The vendor measured a K concentration of 1725 g/mL in the archive, where the certified value was 5000 g/mL. This evaluation was documented on the vendor’s “Inquiry Report Form CL# 4359 (02/04/02)”. A copy of this form and the laboratory’s results on PBNL-QC-2 after 3 months is included in the ICP-AES system file.
E.2
If 1725 g/mL is used as the basis for the K LCS and MS calculation, the LCS recovers at 100% and the MS at about 70%. However, the 1725 g/mL is not a certified value and cannot be used for reporting the LCS and MS recoveries.
Sodium and Boron Failure Investigation
The failure of the LCS and MS for Na and B was attributed to blank contamination from processing the AZ-102C Solids in glass using procedure PNL-ALO-129, which requires nitric acid and hydrochloric acid in the digestion process. This procedure typically requires non-glass digestion vessels (e.g., Teflon, polyethylene, etc.) whenever Na, Si, and B (major glass components) are analytes of interest. However, for the AZ-102C Solids acid-digestion, glass-digestion vessels were used for preparing the standards and samples, primarily since the intent of the analysis was to identify the major components of the precipitated solids, and any blank contamination would have a minimal effect.
The Na and B (and Si, which was not identified as an analyte of interest) concentrations in the processing blank were 1.5 to 3.5 times greater than the estimated quantitation limits (EQL). Although the blank contributions were subtracted from the QC samples, the excessively high B and Na LCS recoveries and the B matrix spike recovery were due to variability from single process blank analysis.
Another contributing factor was the result of processing standard solutions containing HF (0.7% added in PBNL QC 2) in glass-digestion vessels. Since the absolute effect of the HF on the glass vessels was likely variable and cannot be quantified, it was not possible to correct the recoveries to account for this effect. Hence the failure was not a systematic problem.
PNWD-3235WTP-RPT-054, Rev 0
Distr. 1
Distribution
No. of Copies
OFFSITE
No. of Copies
ONSITE
2 Savannah River Technology CenterJim Marra PO Box 616, Road 1 Building 773-43A Aiken, SC 29808
Harold Sturm PO Box 616, Road 1 Building 773-A Aiken, SC 29808
20 Battelle Pacific Northwest DivisionS. K. Fiskum (5) P7-22 O. T. Farmer P8-50 L. R. Greenwood P7-22 E. D. Jenson P7-22 B. M. Oliver P7-22 R. L. Russell K6-24 C. Z. Soderquist P7-22 M. J. Steele P7-22 R. G. Swoboda P7-22 J. J. Toth H4-02 M. W. Urie P7-22 J. J. Wagner P7-22 D. E. Kurath P7-28 Project File P7-28 Information Release (2) K1-06
7 Bechtel National, Inc.S. Barnes H4-02 W. Graves H4-02 S. Jenkins H4-02 R. Longwell H4-02 R. Peterson H4-02 R&T Manager H4-02 WTP PDC Coordinator H4-02