handbook of seafood quality, safety and health applications (alasalvar/handbook of seafood quality,...
TRANSCRIPT
P1: SFK/UKS P2: SFKc03 BLBK298-Alasalvar August 5, 2010 15:17 Trim: 244mm×172mm
3 Sensory evaluation of fish freshness andeating qualities
David P. Green
3.1 Introduction
Sensory evaluation of fish freshness and eating qualities remains the most important assess-ment method employed by the seafood industry today. Until recently, sensory analysis wasused to determine product specifications or standards in quality control and to an extent,in product development and optimization [1]. However, sensory assessments are becom-ing increasingly important in market development and frequently are correlated with othernon-sensory chemical, microbial, and physical assessment techniques (Chapter 2).
Regardless of the species, consumers generally believe that the best fish is the freshestfish, and thus are more desirable. A widely accepted definition for fish freshness is difficulthowever, because from a species standpoint, freshness is constantly changing and forms acontinuum from the fresh to a stale state in terms of its eating qualities. Freshness makesa major contribution to the overall quality of fish and fishery products [2] and is greatlyinfluenced by both pre-harvest conditions and post-harvest handling practices [1,3].
Bremner and Sakaguchi [4] first described freshness as a total set of characteristics inrecently harvested products that bear on its ability to meet stated or implied requirements.As fish spoils, its smell, taste, appearance, and texture go through characteristic and welldefined stages. Sensory assessors are trained to recognize these stages in going from freshto stale and assign an objective number or appropriate score to each fish or batch of fish.Recognition of freshness and the acceptance or rejection of fish on this basis may be all thatis necessary for industry. However, different species and products spoil in different patternsand the use of appropriate sensory and non-sensory assessment methods is warranted.
Bremner [5] also recognized that the term “eating qualities” should be replaced by a moredirect expression of the properties or group of properties that best describes the food product.Nielsen et al. [6] point out that sensory evaluation mostly describes intrinsic product qualities(i.e. species, fat content, smell, and appearance) while consumer choice is based on bothintrinsic and extrinsic factors (i.e. price, convenience, origin, and handling). The validation ofintrinsic sensory tests (descriptive/discriminative – objective methods) for use in predictingthe remaining shelf-life of fish in ice has been reported [7]. Future integration in the assess-ment of intrinsic qualities by sensory tests and extrinsic factors (preference/acceptability –
Handbook of Seafood Q uality, Safety and Health Applications
Edited by Cesarettin Alasalvar, Fereidoon Shahidi, Kazuo Miyashita and Udaya Wanasundara
© 2011 Blackwell Publishing Ltd. ISBN: 978-1-405-18070-2
P1: SFK/UKS P2: SFKc03 BLBK298-Alasalvar August 5, 2010 15:17 Trim: 244mm×172mm
30 Seafood Quality, Safety and Health Applications
subjective methods) may soon be used in predicting consumer behaviour towards a particularfish product [8,9].
Consumer demand for high-quality, safe, and healthy foods is increasing on a global basis.Improved freshness tests have been developed for various fish species that are both rapid andmore reliable. The use of sensory assessments in fish is becoming increasingly important fornew market development. This chapter discusses the sensory methods used for evaluatingfish freshness and eating qualities and some pre- and post-harvest practices that affect thequality and shelf-life of chill-stored fish.
3.2 Methods for sensory evaluation of fish
Both objective and subjective sensory testing methods are used to evaluate fish freshness. Ob-jective tests include descriptive (profiling and structured scaling) and discriminative (triangletest and forced choice) sensory methods. Both descriptive/discriminative tests are analyti-cal measurements of the intrinsic quality of the product, whereas effective (subjective test)methods are used for consumer testing and measure the attitude and emotional responses ofconsumers towards a particular product [8]. For chill-stored fish, sensory methods based onthe Torry scale [10] remain in use for some countries. In Europe, the most common methodused for quality assessment of chill-stored fish is the EU scheme [11]. Most recently, a struc-tured scaling and sensory profiling method (Quality Index Method [QIM]) was developed[12] to assess fish freshness [8]. The latter method is thought to address some limitationsinherent in the current EU grading scheme.
3.2.1 Torry scale
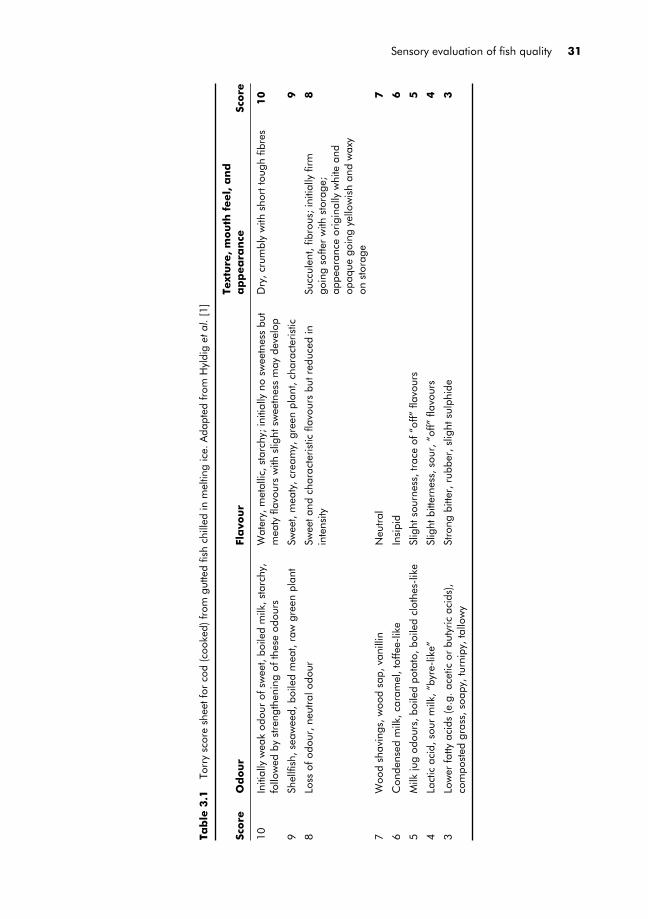
The first scoring method for use with fish and fishery products was developed at the TorryResearch Station in the UK [13]. The Torry scale is a 10-point scale originally developed toassess the eating qualities of cooked fish samples. Scores are given from 10 (very fresh intaste and odour) to 3 (spoiled). Scores below a 3 are considered unnecessary, as the fish isthen not fit for human consumption. The average score of 5.5 may be used as the limit forconsumption. The Torry scale has been developed for lean, medium fat, and fatty fish species.The spoilage attributes can be observed in either the raw or the cooked fish, and appropriatescoring systems are available for both forms (Table 3.1). Interestingly, the Torry scoringmethod for fish freshness was correlated with changes in electrical conductivity across skinsurfaces of fish. These relationships lead to development of the Torry Fish Freshness Meter(Torrymeter), which is commercially available and used today [14].
3.2.2 European Union Scheme
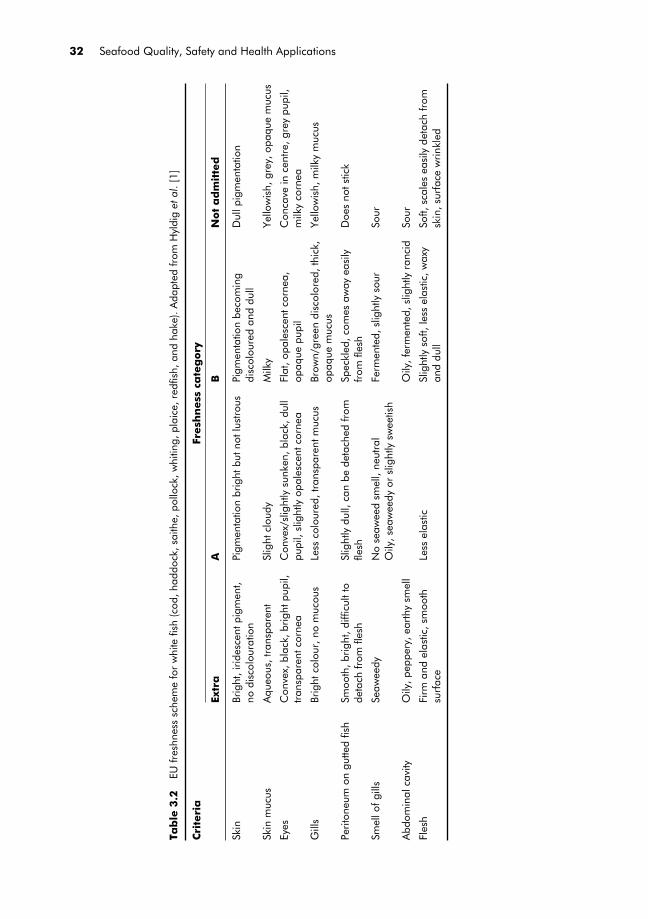
Quality assessment of chill-stored fish under Council Regulation (EC) No. 2406/96November 26, 1996 established the EU scheme used by fish inspectors today [11]. Thescheme identifies three quality levels: E (Extra) is the highest quality; A is acceptable qual-ity; and B is the level beyond which fish are not admitted for human consumption (Table 3.2).The EU scheme is criticized for its limitations in that it does not take into account the dif-ferences between species (uses only general parameters) and mixes both subjective andobjective sensory methods in the assessment scheme. Several studies have shown that themore recent QIM scheme is more reliable in assessing the sensory changes of differentspecies as compared to the EU grading scheme [15].
P1: SFK/UKS P2: SFKc03 BLBK298-Alasalvar August 5, 2010 15:17 Trim: 244mm×172mm
Sensory evaluation of fish quality 31
Tab
le3.1
Torr
ysc
ore
shee
tfor
cod
(coo
ked)
from
gutte
dfis
hch
illed
inm
eltin
gic
e.A
dapt
edfr
omH
yldi
get
al.[
1]
Score
Od
ou
rFl
avo
ur
Text
ure
,m
ou
thfe
el,
an
da
pp
ea
ran
ceSc
ore
10In
itial
lyw
eak
odou
rof
swee
t,bo
iled
milk
,sta
rchy
,fo
llow
edby
stre
ngth
enin
gof
thes
eod
ours
Wat
ery,
met
allic
,sta
rchy
;in
itial
lyno
swee
tnes
sbu
tm
eaty
flavo
urs
with
slig
htsw
eetn
ess
may
deve
lop
Dry
,cru
mbl
yw
ithsh
ortt
ough
fibre
s10
9Sh
ellfi
sh,s
eaw
eed,
boile
dm
eat,
raw
gree
npl
ant
Swee
t,m
eaty
,cre
amy,
gree
npl
ant,
char
acte
ristic
9
8Lo
ssof
odou
r,ne
utra
lodo
urSw
eeta
ndch
arac
teris
ticfla
vour
sbu
tred
uced
inin
tens
itySu
ccul
ent,
fibro
us;
initi
ally
firm
goin
gso
fter
with
stor
age;
appe
aran
ceor
igin
ally
whi
tean
dop
aque
goin
gye
llow
ish
and
wax
yon
stor
age
8
7W
ood
shav
ings
,woo
dsa
p,va
nilli
nN
eutr
al7
6C
onde
nsed
milk
,car
amel
,tof
fee-
like
Insi
pid
6
5M
ilkju
god
ours
,boi
led
pota
to,b
oile
dcl
othe
s-lik
eSl
ight
sour
ness
,tra
ceof
“off”
flavo
urs
5
4La
ctic
acid
,sou
rm
ilk,“
byre
-lik
e”Sl
ight
bitte
rnes
s,so
ur,“
off”
flavo
urs
4
3Lo
wer
fatty
acid
s(e
.g.a
cetic
orbu
tyric
acid
s),
com
post
edgr
ass,
soap
y,tu
rnip
y,ta
llow
ySt
rong
bitte
r,ru
bber
,slig
htsu
lphi
de3
P1: SFK/UKS P2: SFKc03 BLBK298-Alasalvar August 5, 2010 15:17 Trim: 244mm×172mm
32 Seafood Quality, Safety and Health Applications
Tab
le3.2
EUfr
eshn
ess
sche
me
for
whi
tefis
h(c
od,h
addo
ck,s
aith
e,po
llock
,whi
ting,
plai
ce,r
edfis
h,an
dha
ke).
Ada
pted
from
Hyl
dig
etal
.[1]
Cri
teri
aFr
esh
ness
cate
gory
Extr
aA
BN
ot
ad
mit
ted
Skin
Brig
ht,i
rides
cent
pigm
ent,
nodi
scol
oura
tion
Pigm
enta
tion
brig
htbu
tnot
lust
rous
Pigm
enta
tion
beco
min
gdi
scol
oure
dan
ddu
llD
ullp
igm
enta
tion
Skin
muc
usA
queo
us,t
rans
pare
ntSl
ight
clou
dyM
ilky
Yello
wis
h,gr
ey,o
paqu
em
ucus
Eyes
Con
vex,
blac
k,br
ight
pupi
l,tr
ansp
aren
tcor
nea
Con
vex/
slig
htly
sunk
en,b
lack
,dul
lpu
pil,
slig
htly
opal
esce
ntco
rnea
Flat
,opa
lesc
entc
orne
a,op
aque
pupi
lC
onca
vein
cent
re,g
rey
pupi
l,m
ilky
corn
ea
Gill
sBr
ight
colo
ur,n
om
ucou
sLe
ssco
lour
ed,t
rans
pare
ntm
ucus
Brow
n/gr
een
disc
olor
ed,t
hick
,op
aque
muc
usYe
llow
ish,
milk
ym
ucus
Perit
oneu
mon
gutte
dfis
hSm
ooth
,brig
ht,d
ifficu
ltto
deta
chfr
omfle
shSl
ight
lydu
ll,ca
nbe
deta
ched
from
flesh
Spec
kled
,com
esaw
ayea
sily
from
flesh
Doe
sno
tstic
k
Smel
lofg
ills
Seaw
eedy
No
seaw
eed
smel
l,ne
utra
lO
ily,s
eaw
eedy
orsl
ight
lysw
eetis
hFe
rmen
ted,
slig
htly
sour
Sour
Abd
omin
alca
vity
Oily
,pep
pery
,ear
thy
smel
lO
ily,f
erm
ente
d,sl
ight
lyra
ncid
Sour
Fles
hFi
rman
del
astic
,sm
ooth
surf
ace
Less
elas
ticSl
ight
lyso
ft,le
ssel
astic
,wax
yan
ddu
llSo
ft,sc
ales
easi
lyde
tach
from
skin
,sur
face
wrin
kled
P1: SFK/UKS P2: SFKc03 BLBK298-Alasalvar August 5, 2010 15:17 Trim: 244mm×172mm
Sensory evaluation of fish quality 33
3.2.3 Quality Index Method
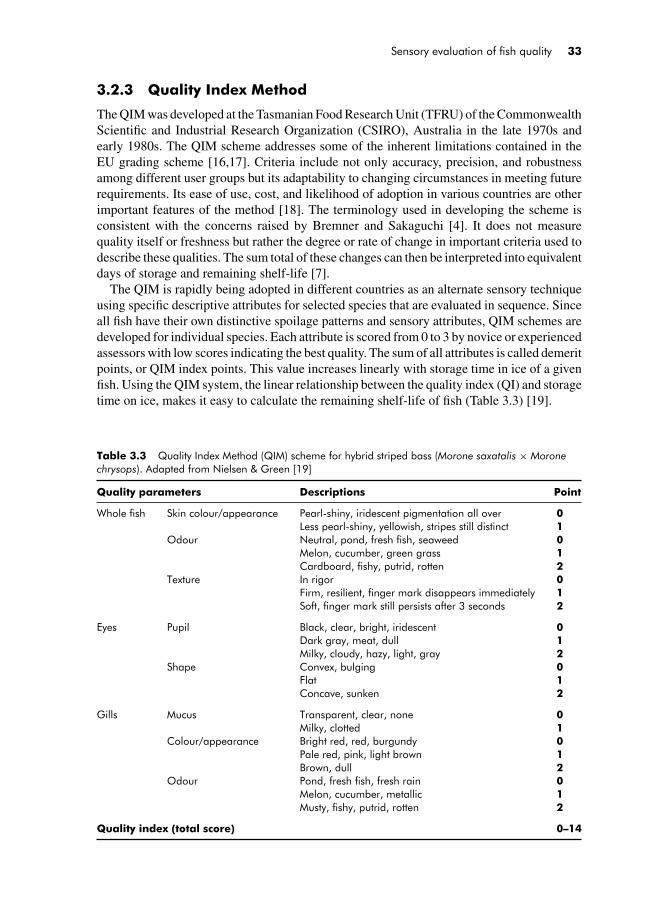
The QIM was developed at the Tasmanian Food Research Unit (TFRU) of the CommonwealthScientific and Industrial Research Organization (CSIRO), Australia in the late 1970s andearly 1980s. The QIM scheme addresses some of the inherent limitations contained in theEU grading scheme [16,17]. Criteria include not only accuracy, precision, and robustnessamong different user groups but its adaptability to changing circumstances in meeting futurerequirements. Its ease of use, cost, and likelihood of adoption in various countries are otherimportant features of the method [18]. The terminology used in developing the scheme isconsistent with the concerns raised by Bremner and Sakaguchi [4]. It does not measurequality itself or freshness but rather the degree or rate of change in important criteria used todescribe these qualities. The sum total of these changes can then be interpreted into equivalentdays of storage and remaining shelf-life [7].
The QIM is rapidly being adopted in different countries as an alternate sensory techniqueusing specific descriptive attributes for selected species that are evaluated in sequence. Sinceall fish have their own distinctive spoilage patterns and sensory attributes, QIM schemes aredeveloped for individual species. Each attribute is scored from 0 to 3 by novice or experiencedassessors with low scores indicating the best quality. The sum of all attributes is called demeritpoints, or QIM index points. This value increases linearly with storage time in ice of a givenfish. Using the QIM system, the linear relationship between the quality index (QI) and storagetime on ice, makes it easy to calculate the remaining shelf-life of fish (Table 3.3) [19].
Table 3.3 Quality Index Method (QIM) scheme for hybrid striped bass (Morone saxatalis × Moronechrysops). Adapted from Nielsen & Green [19]
Quality parameters Descriptions Point
Whole fish Skin colour/appearance Pearl-shiny, iridescent pigmentation all over 0Less pearl-shiny, yellowish, stripes still distinct 1
Odour Neutral, pond, fresh fish, seaweed 0Melon, cucumber, green grass 1Cardboard, fishy, putrid, rotten 2
Texture In rigor 0Firm, resilient, finger mark disappears immediately 1Soft, finger mark still persists after 3 seconds 2
Eyes Pupil Black, clear, bright, iridescent 0Dark gray, meat, dull 1Milky, cloudy, hazy, light, gray 2
Shape Convex, bulging 0Flat 1Concave, sunken 2
Gills Mucus Transparent, clear, none 0Milky, clotted 1
Colour/appearance Bright red, red, burgundy 0Pale red, pink, light brown 1Brown, dull 2
Odour Pond, fresh fish, fresh rain 0Melon, cucumber, metallic 1Musty, fishy, putrid, rotten 2
Quality index (total score) 0–14
P1: SFK/UKS P2: SFKc03 BLBK298-Alasalvar August 5, 2010 15:17 Trim: 244mm×172mm
34 Seafood Quality, Safety and Health Applications
The principle behind development of the QIM scheme is summarized by Hyldig et al. [18]and specific steps in development of schemes is provided in Bonilla et al. [7]. Training ofassessors is performed for the industry and was adapted for use with consumers [20]. Theconsumer (C) QIM method uses an external consumer panel and a vocabulary (descriptors)specifically chosen for consumers. C-QIM is not an acceptability (subjective) test but anobjective tool for use in decision making for the consumer when buying fish in a market orretail outlet [21]. Further work in this area is ongoing as new tools are being investigatedfor delivery of the QIM with new species and wider use by industry and consumer groups.Adoption of QIM in the EU and other countries would greatly aid in standardizing trade infish and fishery products worldwide.
3.3 Pre-harvest factors affecting freshness
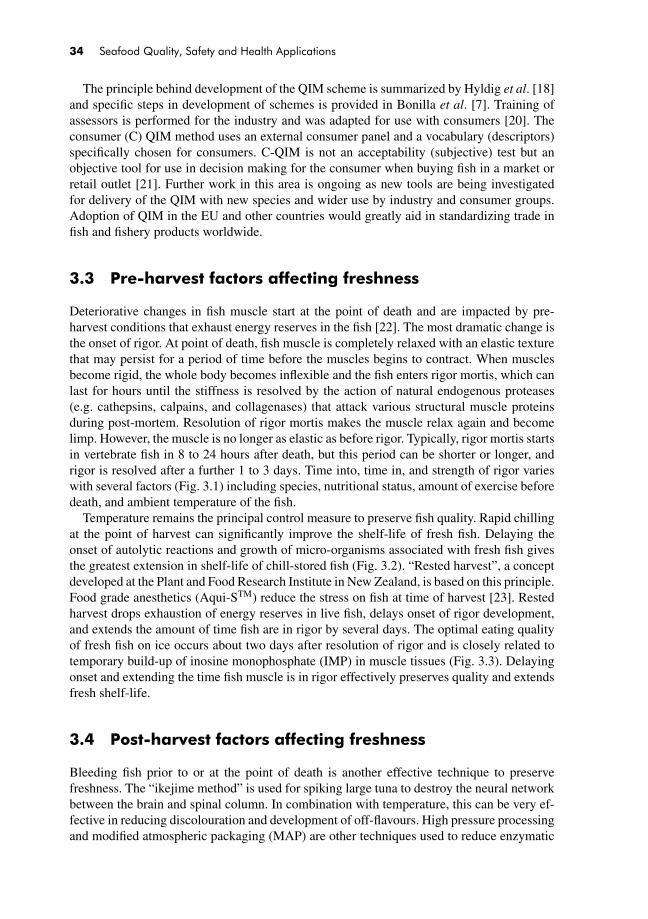
Deteriorative changes in fish muscle start at the point of death and are impacted by pre-harvest conditions that exhaust energy reserves in the fish [22]. The most dramatic change isthe onset of rigor. At point of death, fish muscle is completely relaxed with an elastic texturethat may persist for a period of time before the muscles begins to contract. When musclesbecome rigid, the whole body becomes inflexible and the fish enters rigor mortis, which canlast for hours until the stiffness is resolved by the action of natural endogenous proteases(e.g. cathepsins, calpains, and collagenases) that attack various structural muscle proteinsduring post-mortem. Resolution of rigor mortis makes the muscle relax again and becomelimp. However, the muscle is no longer as elastic as before rigor. Typically, rigor mortis startsin vertebrate fish in 8 to 24 hours after death, but this period can be shorter or longer, andrigor is resolved after a further 1 to 3 days. Time into, time in, and strength of rigor varieswith several factors (Fig. 3.1) including species, nutritional status, amount of exercise beforedeath, and ambient temperature of the fish.
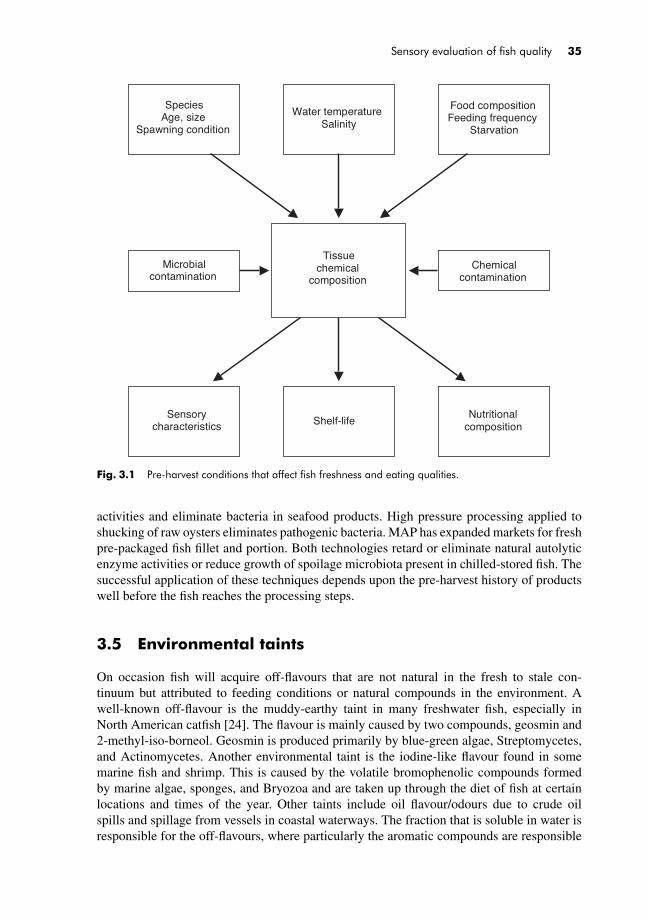
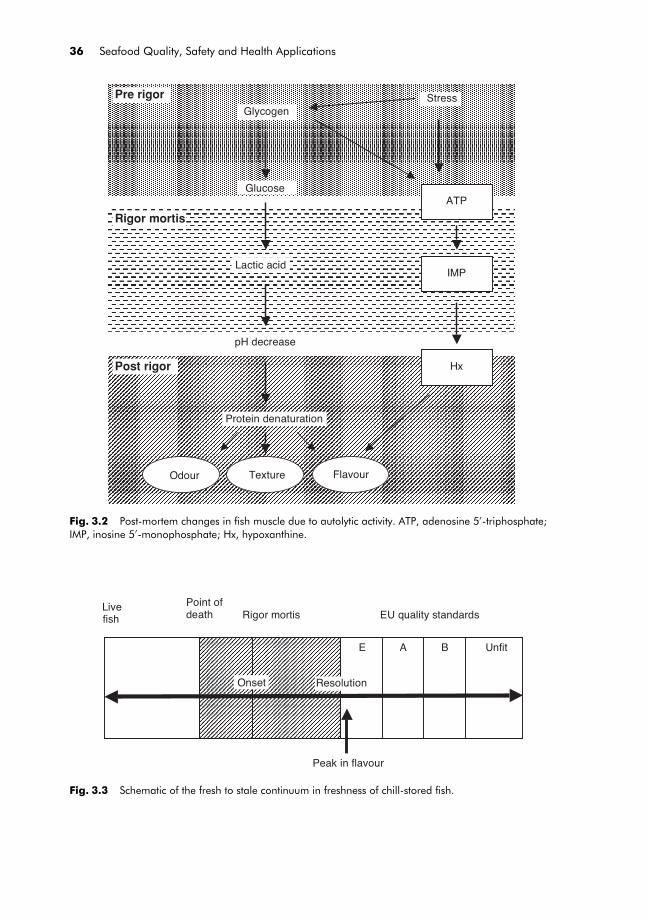
Temperature remains the principal control measure to preserve fish quality. Rapid chillingat the point of harvest can significantly improve the shelf-life of fresh fish. Delaying theonset of autolytic reactions and growth of micro-organisms associated with fresh fish givesthe greatest extension in shelf-life of chill-stored fish (Fig. 3.2). “Rested harvest”, a conceptdeveloped at the Plant and Food Research Institute in New Zealand, is based on this principle.Food grade anesthetics (Aqui-STM) reduce the stress on fish at time of harvest [23]. Restedharvest drops exhaustion of energy reserves in live fish, delays onset of rigor development,and extends the amount of time fish are in rigor by several days. The optimal eating qualityof fresh fish on ice occurs about two days after resolution of rigor and is closely related totemporary build-up of inosine monophosphate (IMP) in muscle tissues (Fig. 3.3). Delayingonset and extending the time fish muscle is in rigor effectively preserves quality and extendsfresh shelf-life.
3.4 Post-harvest factors affecting freshness
Bleeding fish prior to or at the point of death is another effective technique to preservefreshness. The “ikejime method” is used for spiking large tuna to destroy the neural networkbetween the brain and spinal column. In combination with temperature, this can be very ef-fective in reducing discolouration and development of off-flavours. High pressure processingand modified atmospheric packaging (MAP) are other techniques used to reduce enzymatic
P1: SFK/UKS P2: SFKc03 BLBK298-Alasalvar August 5, 2010 15:17 Trim: 244mm×172mm
Sensory evaluation of fish quality 35
Tissuechemical
composition
Water temperatureSalinity
Food compositionFeeding frequency
Starvation
Microbialcontamination
Chemicalcontamination
Sensorycharacteristics
NutritionalcompositionShelf-life
SpeciesAge, size
Spawning condition
Fig. 3.1 Pre-harvest conditions that affect fish freshness and eating qualities.
activities and eliminate bacteria in seafood products. High pressure processing applied toshucking of raw oysters eliminates pathogenic bacteria. MAP has expanded markets for freshpre-packaged fish fillet and portion. Both technologies retard or eliminate natural autolyticenzyme activities or reduce growth of spoilage microbiota present in chilled-stored fish. Thesuccessful application of these techniques depends upon the pre-harvest history of productswell before the fish reaches the processing steps.
3.5 Environmental taints
On occasion fish will acquire off-flavours that are not natural in the fresh to stale con-tinuum but attributed to feeding conditions or natural compounds in the environment. Awell-known off-flavour is the muddy-earthy taint in many freshwater fish, especially inNorth American catfish [24]. The flavour is mainly caused by two compounds, geosmin and2-methyl-iso-borneol. Geosmin is produced primarily by blue-green algae, Streptomycetes,and Actinomycetes. Another environmental taint is the iodine-like flavour found in somemarine fish and shrimp. This is caused by the volatile bromophenolic compounds formedby marine algae, sponges, and Bryozoa and are taken up through the diet of fish at certainlocations and times of the year. Other taints include oil flavour/odours due to crude oilspills and spillage from vessels in coastal waterways. The fraction that is soluble in water isresponsible for the off-flavours, where particularly the aromatic compounds are responsible
P1: SFK/UKS P2: SFKc03 BLBK298-Alasalvar August 5, 2010 15:17 Trim: 244mm×172mm
36 Seafood Quality, Safety and Health Applications
Pre rigorGlycogen
Glucose
Rigor mortis
Lactic acid
pH decrease
Protein denaturation
Stress
ATP
IMP
Hx
Odour Texture Flavour
Post rigor
Fig. 3.2 Post-mortem changes in fish muscle due to autolytic activity. ATP, adenosine 5′-triphosphate;IMP, inosine 5′-monophosphate; Hx, hypoxanthine.
Point ofdeath Rigor mortis EU quality standards
E
ResolutionOnset
A B Unfit
Peak in flavour
Livefish
Fig. 3.3 Schematic of the fresh to stale continuum in freshness of chill-stored fish.
P1: SFK/UKS P2: SFKc03 BLBK298-Alasalvar August 5, 2010 15:17 Trim: 244mm×172mm
Sensory evaluation of fish quality 37
[25]. Others include a bitter taste in herring caused by larvae of Mytilus sp. [26] and mineraloil or petroleum flavours in fish caused by the plantonic mollusc, Spiratell helicina [1].The occurrence of off-flavours due to the presence of environmental taints falls outside thegeneral QIM scheme and are not included in the scoring system. These defects should benoted in quality control but are not associated with the natural deteriorative changes thatoccur in chill-stored fish.
3.6 Extending freshness and shelf-life in fish
Prolonging fish freshness and delaying seafood spoilage are challenges for the seafoodindustry. Fish “freshness” is estimated by a combination of sensory attributes: appearance,smell, texture, and taste. Sensory evaluation by trained assessors is an accurate way tomeasure freshness. Quantitative chemical, biological, and instrumental methods techniquesare correlated with sensory qualities to evaluate fish freshness and quality attributes. In post-mortem fish, intrinsic chemical and physical changes due to endogenous enzyme activity andextrinsic changes due to microbial growth and metabolism cause loss of fish freshness andquality attributes. Improving our understanding of factors affecting post-mortem changesoccurring in fish is important for preserving fresh quality and extending shelf-life. Applyingthese principles in wild harvest and aquaculture practices and in post-harvest handling offish will help industry supply safe, high-quality, and health promoting fish products.
3.7 Conclusions
Sensory evaluation of fish freshness and eating qualities involves both objective and subjectivetesting methods. Because different species and fishery products spoil in different patterns, theappropriate use of sensory and non-sensory assessment methods is warranted. The integrationin assessment of intrinsic qualities by sensory testing and extrinsic factors may soon lead toprediction of consumer behaviours towards a particular fish product.
References
1. Hyldig, G., Larsen, E. & Green-Petersen, D. (2007). Fish and sensory analysis in the fish chain. In:Handbook of Meat, Poultry & Seafood Quality. Nollet, L.M.L., Boylston, T., Chen, F. et al. (eds),Blackwell Publishing, Oxford, UK, pp. 499–510.
2. Oehlenschlager, J. & Sørensen, N.K. (1997). Criteria of seafish freshness and quality aspects. In:Methods to Determine the Freshness of Fish in Research and Industry. Proceedings of the Final Meetingof the Concerted Action “Evaluation of Fish Freshness”. Luten, J.B., Dalgaard, P., Careche, M., Verrez-Bagnis, V., Martinsdottir, E. & Heia, K. (eds), International Institute of Refrigeration, Paris, France,pp. 30–35.
3. Lougovois, V.P. & Kyrana, V.R. (2005). Freshness quality and spoilage of chill-stored fish. In: FoodPolicy, Control and Research. Riley, A.P. (ed.), Nova Science Publishers, Inc., Hauppauge, NY,pp. 35–75.
4. Bremner, H.A. & Sakaguchi, M. (2000). A critical look at whether “freshness” can be determined.Journal of Aquatic Food Product Technology, 9, 15–25.
5. Bremner, H.A. (2000). Toward practical definitions of quality for food science. Critical Reviews in FoodScience and Nutrition, 40, 83–90.
P1: SFK/UKS P2: SFKc03 BLBK298-Alasalvar August 5, 2010 15:17 Trim: 244mm×172mm
38 Seafood Quality, Safety and Health Applications
6. Nielsen, J., Hyldig, G. & Larsen, E. (2002). Eating quality of fish – a review. Journal of Aquatic FoodProduct Technology, 11, 125–141.
7. Bonilla, A.C., Sveinsdottir, K. & Martinsdottir, E. (2007). Development of quality index method (QIM)scheme for fresh cod (Gadus morhua) fillets and application in shelf-life study. Food Control, 18,352–358.
8. Hyldig, G. (2007). Sensory profiling of fish, fish product, and shellfish. In: Handbook of Meat, Poultry& Seafood Quality. Nollet, L.M.L., Boylston, T., Chen, F. et al. (eds), Blackwell Publishing, Oxford,UK, pp. 511–528.
9. Martinsdottir, E., Schelvis, R., Hyldig, G. & Sveinsdottir, S. (2009). Sensory evaluation of seafood:methods. In: Fishery Products: Quality, Safety, and Authenticity. Rehbein, H. & Oehlenschlager, J.(eds), Wiley-Blackwell, Oxford, UK, pp. 425–443.
10. Shewan, J.M., Mackintosh, R.G., Tucker, C.G. & Ehrenberg, A.S.C. (1953). The development of anumerical scoring system for the sensory assessment of the spoilage of wet white fish stored in ice.Journal of Science and Agriculture, 6, 183–189.
11. Anonymous (1996). Council regulation (EC) No 2406/96 of November 1996 laying down commonmarketing standard for certain fishery products. Official Journal of the European Communities, L334,1–14.
12. Bremner, H.A. (1985). A convenient, easy-to-use system for estimating the quality of chilled seafood.Fish Processing Bulletin, 7, 59–73.
13. Howgate, P., Johnston, A. & Whittle, K.J. (1992). Multilingual Guide to EC Freshness Grades forFishery Products. Torry Research Station, Aberdeen, UK.
14. Pivarnik, L.F., Kazantzis, D., Karakoltsidis, P.A. et al. (2006). Freshness assessment of six New Englandfish species using the Torrymeter. Journal of Food Science, 55, 79–82.
15. Triqui, R. & Bouchriti, N. (2003). Freshness assessment of Moroccan sardine (Scardina pilchardus):comparison of overall sensory changes to instrumentally determined volatiles. Journal of Agriculturaland Food Chemistry, 55, 7540–7546.
16. Olafsdottir, G., Martinsdottir, E. & Oehlenschlager, J. (1997). Methods to evaluate fish freshness inresearch and industry. Trends in Food Science and Technology, 8, 258–265.
17. Hyldig, G. & Nielsen, J. (2004). QIM, a tool for determination of fish freshness. In: Seafood Quality andSafety: Advances in the New Millennium, Shahidi, F. & Simpson, B.K. (eds), ScienceTech PublishingCo., St. John’s, NL, Canada, pp. 81–90.
18. Hyldig, G., Bremner, A., Martinsdottir, E. & Schelvis, R. (2007). Quality index methods. In: Handbookof Meat, Poultry & Seafood Quality. Nollet, L.M.L., Boylston, T., Chen, F. et al. (eds), BlackwellPublishing, Oxford, UK, pp. 529–547.
19. Nielsen, D. & Green, D. (2007). Developing a quality index grading tool for hybrid striped bass (Moronesaxatilis × Morone chrysops) based on the quality index method. International Journal of Food Scienceand Technology, 42, 86–94.
20. Warm, K., Nielsen, J., Hyldig, G. & Martens, M. (2000). Sensory quality of five fish species. Journal ofFood Quality, 23, 583–602.
21. Delahunty, C. (2009). Sensory characteristics of different cod products related to consumer preferencesand attitudes. Food Quality and Preference, 20, 120–132.
22. Delbarre-Ladrat, C., Cheret, R., Taylor, R. & Verrez-Bagnis, V. (2006). Trends in post-mortem again infish: understanding of proteolysis and disorganization of the myofibrillar structure. Critical Reviews inFood Science and Nutrition, 46, 409–421.
23. Woods, III, L.C., Theisen, D.D. & He, S. (2008). Efficacy of Aqui-S as an anesthetic for market-sizedstriped bass. North American Journal of Aquaculture, 70, 219–222.
24. Howgate, P. (2004). Tainting of farmed fish by geomin and 2-methyl-iso-borneal: a review of sensoryaspects and of uptake/depuration. Aquaculture, 234, 155–181.
25. Martinsen, C., Lauby, B., Newvissi, A. & Brannon, E. (1992). The influence of crude oil and dispersanton the sensory characteristics of steelhead (Oncorhychus mykiss) in marine waters. Journal of AquaticFood Product Technology, 1, 37–51.
26. Connell, J.J. (1975). Control of Fish Quality. Fishing News (Books) Ltd., Farnham, Surrey, UK.