salmon farming industry handbook 2015 marine harvest · · 2015-08-26industry handbook 2015 ......
TRANSCRIPT
Salmon Farming
Industry Handbook 2015
Marine Harvest

Forward-looking Statements
2
This handbook may be deemed to include forward-looking statements that reflect Marine
Harvest's current expectations and views of future events. Some of these forward-looking
statements can be identified by terms and phrases such as "anticipate", "should", "likely",
"foresee", "believe", "estimate", "expect", "intend", "could", "may", "project", "predict", "will"
and similar expressions. These forward-looking statements include statements related to
population growth, protein consumption, consumption of fish (including both farmed and
wild capture), global supply and demand for fish (and salmon in particular), aquaculture’s
relationship to food consumption, salmon harvests, demographic and pricing trends,
market trends, price volatility, industry trends and strategic initiatives, the issuance and
awarding of new farming licenses, governmental progress on regulatory change in the
aquaculture industry, estimated biomass utilization, salmonid health conditions as well as
vaccines, medical treatments and other mitigating efforts, smolt release, development of
standing biomass, trends in the seafood industry, expected research and development
expenditures, business prospects and positioning with respect to market, and the effects
of any extraordinary events and various other matters (including developments with
respect to laws, regulations and governmental policies regulating the industry and
changes in accounting policies, standards and interpretations). The preceding list is not
intended to be an exhaustive list of all our forward-looking statements. These statements
are only predictions based on Marine Harvest’s current estimates or expectations about
future events or future results. Actual results, level of activity, performance or
achievements could differ materially from those expressed or implied by the forward-
looking statements because the realization of those results, the level of activity,
performance or achievements are subject to many risks and uncertainties, including, but
not limited to changes to the price of salmon; risks related to fish feed; economic and
market risks; environmental risks; risks related to escapes, biological risks, including fish
diseases and sea lice; product risks; regulatory risks including risk related to food safety,
the aquaculture industry, processing, competition and anti-corruption; trade restriction
risks; strategic and competitive risks; and reputation risks. All forward-looking statements
included in this handbook are based on information available at the time of its release,
and Marine Harvest assumes no obligation to update any forward-looking statement.
Updated as of 29 June 2015
The Marine Harvest
Salmon Farming Industry Handbook
3
The purpose of this document is to give investors and financial analysts a better insight
into the salmon farming industry, and what Marine Harvest considers to be the most
important value drivers.
Updated as of 29 June 2015
Table of content
4
1. Introduction 5 8. Financial Considerations 46
8.1 Working capital 46
2. Definition of Segment 6 8.2 Capital return analysis 49
2.1 Seafood as part of a larger protein space 6 8.3 Currency overview 51
2.2 Stagnating wild catch – growing aquaculture 7 8.4 Price, cost and EBIT development in Norway 53
2.3 Fish consumption 8 8.5 Effects of geographical diversification 54
2.4 Salmonids contribute 4.2% of global seafood supply 9
2.5 Large opportunities within aquaculture 10 9. Barriers to entry - Licences 55
2.6 Supply of farmed and wild salmonids 11 9.1 Regulations of fish farming in Norway 56
2.7 Salmonids harvest 2014 12 9.2 Regulations of fish farming in Scotland 60
2.8 A healthy product 13 9.3 Regulations of fish farming in Chile 61
2.9 Resource efficient production 14 9.4 Regulations of fish farming in BC, Canada 62
2.10 Climate friendly production 15
2.11 Relative price development of protein products 16 10. Risk Factors 63
10.1 Salmon disease prevention and treatment 63
3. Salmon Supply 17 10.2 Most important health risks for the salmon 64
3.1 Historic total harvest of Atlantic salmon 1995-2015E 17 10.3 Fish health and vaccination (Norway) 65
3.2 Diminishing growth expected going forward 18 10.4 Research and development focus 66
3.3 Few coastlines feasible for salmon farming 19
11. Indicators Determining Harvest Volumes 67
4. Salmon Markets 20 11.1 Projecting future harvest quantities 67
4.1 Global trade flow of farmed Atlantic salmon 20 11.2 Yield per smolt 68
4.2 Farmed Atlantic salmon by market 21 11.3 Development in standing biomass during the year 69
4.3 Development of value vs. Volume 22
4.4 Price neutral demand growth - historically 6-7% 23 12. Secondary Processing (VAP) 70
4.5 Supply and demand – historic prices 24 12.1 European value-added processing (VAP) industry 71
4.6 Historic price development by local reference prices 25 12.2 Market segment in the EU (2012) 72
4.7 Different sizes – different prices (Norway) 26 12.3 The European market for smoked salmon 73
5. Industry Structure 27 Appendix 74
5.1 Top 5-10 players of farmed Atlantic salmon 27 Weight conversion ratios and key words 75
5.2 Number of players in producing countries 28 Price indices vs. FOB packing plant 76
Some historic acquisitions and divestments 77
6. Salmon Production and Cost Structure 29 Atlantic salmon production cycle 79
6.1 Establishing a salmon farm 29 Sustainability of fish feed 80
6.2 The Atlantic salmon life/production cycle 30 The Global Salmon Initiative & the ASC 81
6.3 Sea water temperature's influence 32 Marine Harvest history 82
6.4 Production inputs 33 MHG – Leading position across the value chain 83
6.5 Cost component – disease and mortality 35 Marine Harvest farming 84
6.6 Accounting principles for biological assets 36 Marine Harvest sales network 85
6.7 Economics of salmon farming 37 Marine Harvest processing facilities 86
6.8 Cost structure for Marine Harvest in 2014 38 Marine Harvest sales channels (2014) 87
6.9 Production costs for Marine Harvest in 2014 39 Sources for industry and market information 88
7. Feed Production 40
7.1 Overview of feed market 40
7.2 Relative feeding 42
7.3 Salmon feed producers 43
7.4 Salmon feed ingredients 44
7.5 Feed raw material market 45
1. Introduction
5 Note: The quantity figures in this industry handbook are mainly expressed in GWE (gutted weight equivalent). For
a weight conversion table, see appendix.
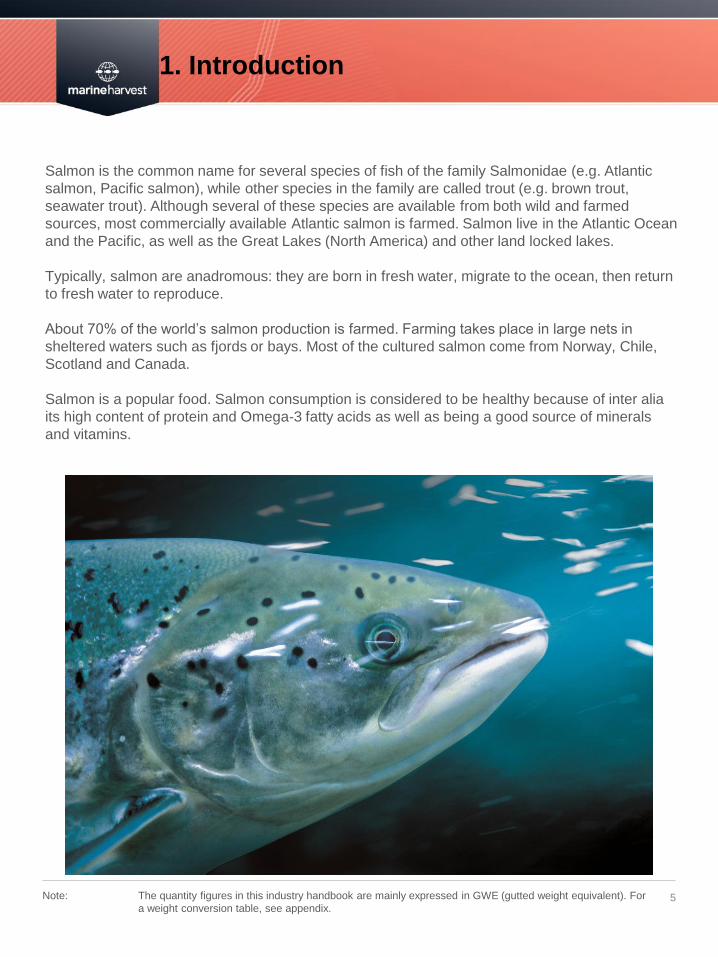
Salmon is the common name for several species of fish of the family Salmonidae (e.g. Atlantic
salmon, Pacific salmon), while other species in the family are called trout (e.g. brown trout,
seawater trout). Although several of these species are available from both wild and farmed
sources, most commercially available Atlantic salmon is farmed. Salmon live in the Atlantic Ocean
and the Pacific, as well as the Great Lakes (North America) and other land locked lakes.
Typically, salmon are anadromous: they are born in fresh water, migrate to the ocean, then return
to fresh water to reproduce.
About 70% of the world’s salmon production is farmed. Farming takes place in large nets in
sheltered waters such as fjords or bays. Most of the cultured salmon come from Norway, Chile,
Scotland and Canada.
Salmon is a popular food. Salmon consumption is considered to be healthy because of inter alia
its high content of protein and Omega-3 fatty acids as well as being a good source of minerals
and vitamins.
2. Definition of Segment 2.1 Seafood as part of a larger protein space
6 Sources: FAO (2011); FAOstat Food Balance Sheets, FAO Statistical Yearbook 2014
United Nations population data; World Population Prospects: The 2012 Revision
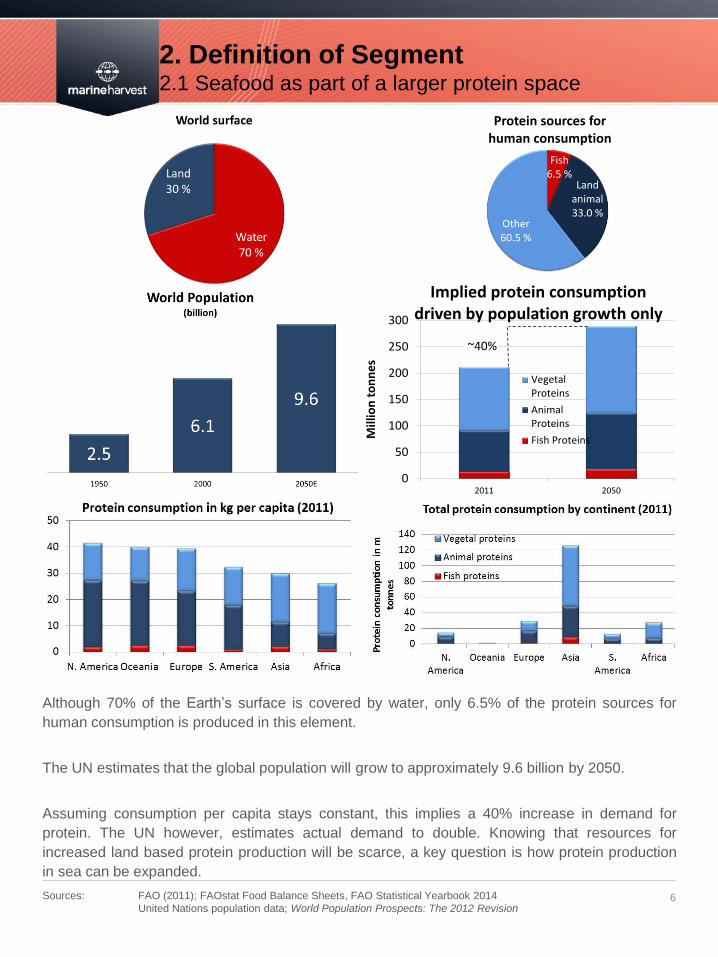
Although 70% of the Earth’s surface is covered by water, only 6.5% of the protein sources for
human consumption is produced in this element.
The UN estimates that the global population will grow to approximately 9.6 billion by 2050.
Assuming consumption per capita stays constant, this implies a 40% increase in demand for
protein. The UN however, estimates actual demand to double. Knowing that resources for
increased land based protein production will be scarce, a key question is how protein production
in sea can be expanded.
Fish6.5 %
Land animal33.0 %
Other60.5 %
Protein sources for human consumption
0
50
100
150
200
250
300
2011 2050
Mill
ion
to
nn
es
Implied protein consumption driven by population growth only
VegetalProteins
AnimalProteins
Fish Proteins
~40%
2. Definition of Segment 2.2 Stagnating wild catch – growing aquaculture
7 Sources: FAO (2013) World Fisheries and Aquaculture, FAO Statistical Yearbook 2014
OECD-FAO (2013) Agricultural Outlook
World Bank (2013) Fish to 2030
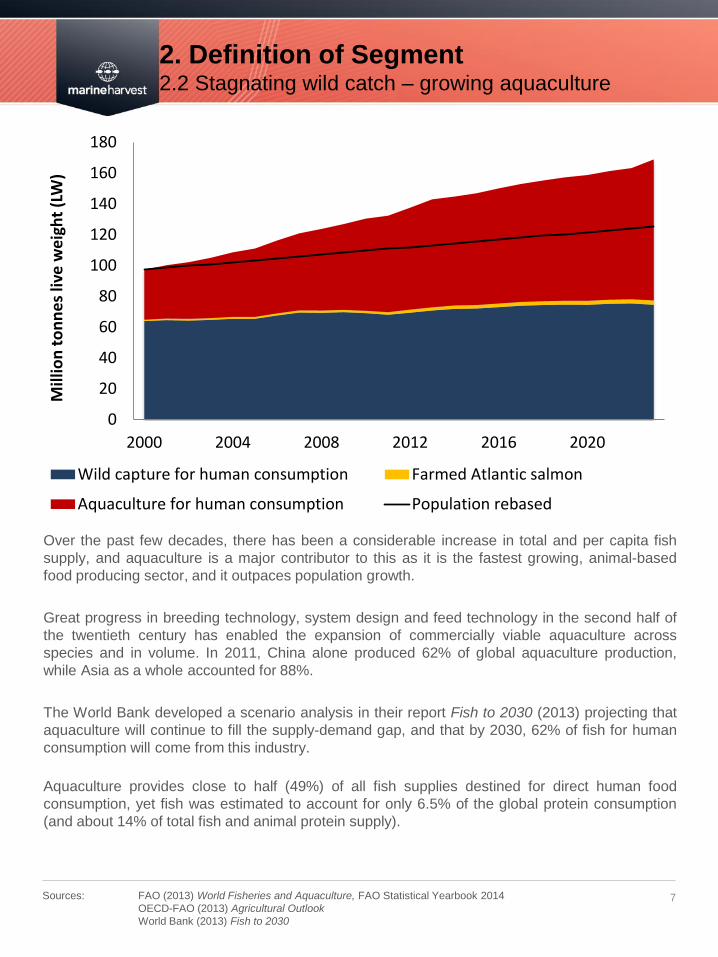
Over the past few decades, there has been a considerable increase in total and per capita fish
supply, and aquaculture is a major contributor to this as it is the fastest growing, animal-based
food producing sector, and it outpaces population growth.
Great progress in breeding technology, system design and feed technology in the second half of
the twentieth century has enabled the expansion of commercially viable aquaculture across
species and in volume. In 2011, China alone produced 62% of global aquaculture production,
while Asia as a whole accounted for 88%.
The World Bank developed a scenario analysis in their report Fish to 2030 (2013) projecting that
aquaculture will continue to fill the supply-demand gap, and that by 2030, 62% of fish for human
consumption will come from this industry.
Aquaculture provides close to half (49%) of all fish supplies destined for direct human food
consumption, yet fish was estimated to account for only 6.5% of the global protein consumption
(and about 14% of total fish and animal protein supply).
0
20
40
60
80
100
120
140
160
180
2000 2004 2008 2012 2016 2020
Mill
ion
to
nn
es
live
we
igh
t (L
W)
Wild capture for human consumption Farmed Atlantic salmon
Aquaculture for human consumption Population rebased
2. Definition of Segment 2.3 Fish consumption
8 Source: World Bank (2013): Fish to 2030
FAO (2014); The State of World Fisheries and Aquaculture
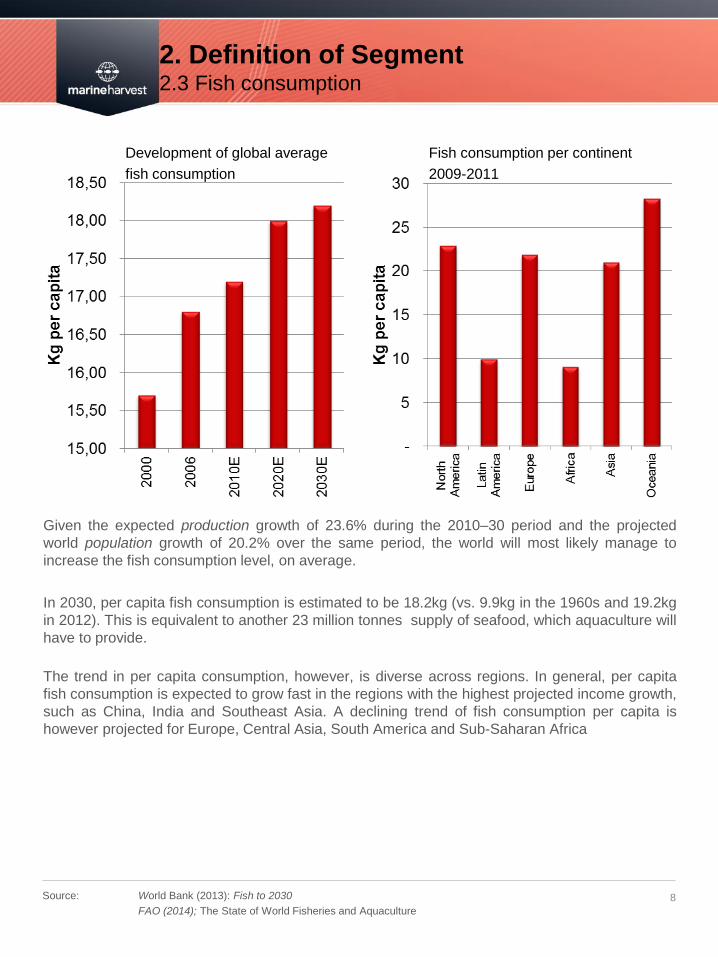
Given the expected production growth of 23.6% during the 2010–30 period and the projected
world population growth of 20.2% over the same period, the world will most likely manage to
increase the fish consumption level, on average.
In 2030, per capita fish consumption is estimated to be 18.2kg (vs. 9.9kg in the 1960s and 19.2kg
in 2012). This is equivalent to another 23 million tonnes supply of seafood, which aquaculture will
have to provide.
The trend in per capita consumption, however, is diverse across regions. In general, per capita
fish consumption is expected to grow fast in the regions with the highest projected income growth,
such as China, India and Southeast Asia. A declining trend of fish consumption per capita is
however projected for Europe, Central Asia, South America and Sub-Saharan Africa
Development of global average Fish consumption per continent
fish consumption 2009-2011
2. Definition of Segment 2.4 Salmonids contribute 4.2% of global seafood supply
9 Note: Live weight (LW) is used because different species have different conversion ratios
Source: Kontali Analyse
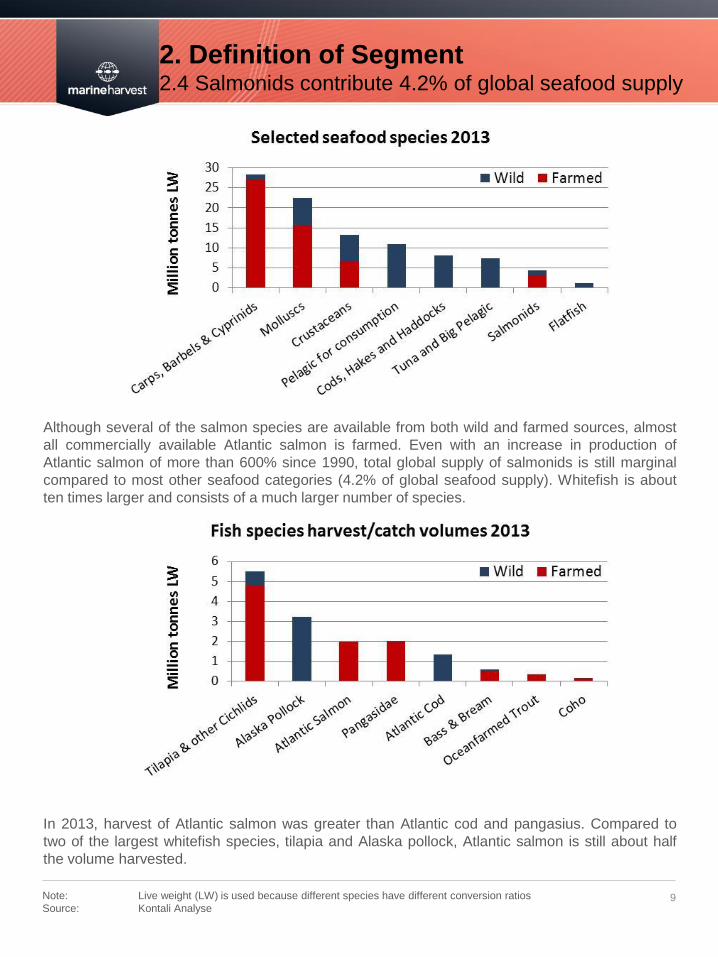
Although several of the salmon species are available from both wild and farmed sources, almost
all commercially available Atlantic salmon is farmed. Even with an increase in production of
Atlantic salmon of more than 600% since 1990, total global supply of salmonids is still marginal
compared to most other seafood categories (4.2% of global seafood supply). Whitefish is about
ten times larger and consists of a much larger number of species.
In 2013, harvest of Atlantic salmon was greater than Atlantic cod and pangasius. Compared to
two of the largest whitefish species, tilapia and Alaska pollock, Atlantic salmon is still about half
the volume harvested.
2. Definition of Segment 2.5 Large opportunities within aquaculture
10 Source: Kontali Analyse
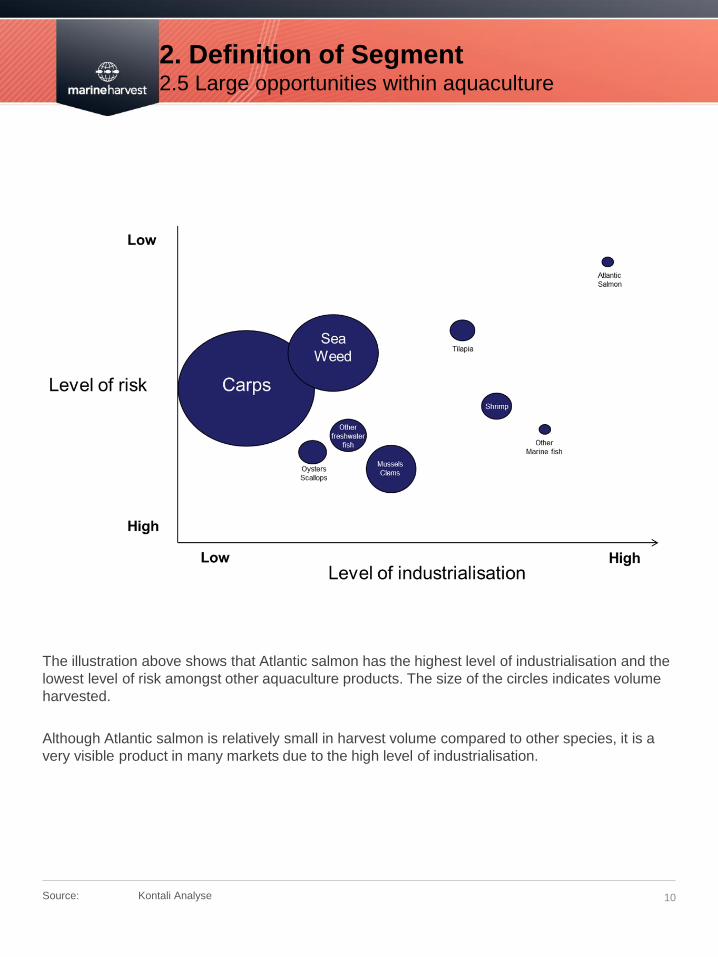
The illustration above shows that Atlantic salmon has the highest level of industrialisation and the
lowest level of risk amongst other aquaculture products. The size of the circles indicates volume
harvested.
Although Atlantic salmon is relatively small in harvest volume compared to other species, it is a
very visible product in many markets due to the high level of industrialisation.
2. Definition of Segment 2.6 Supply of farmed and wild salmonids
11 Source: Kontali Analyse
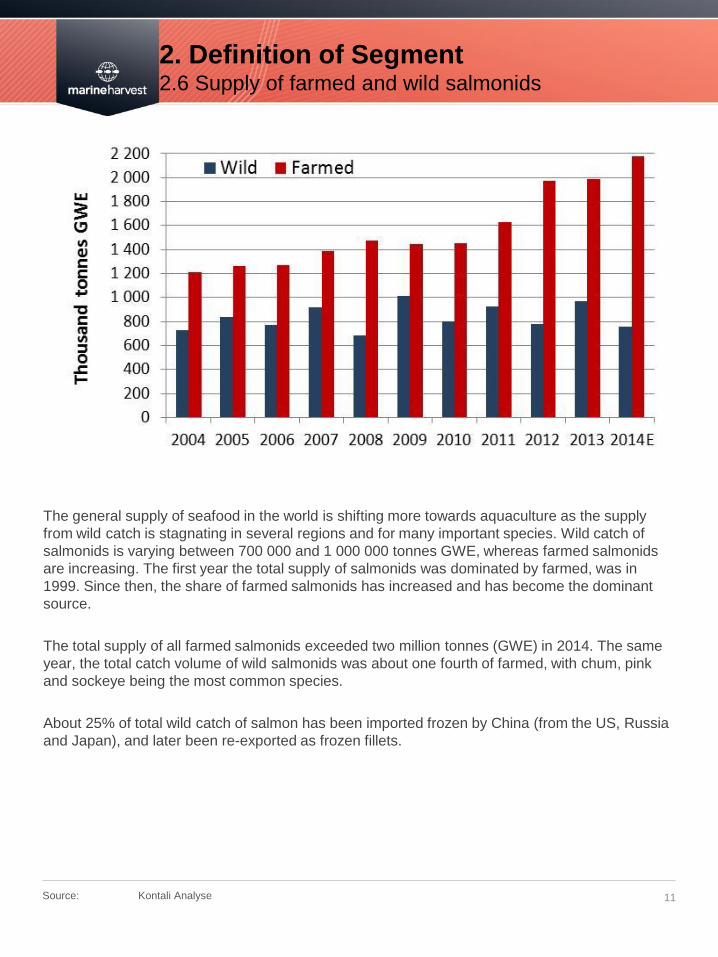
The general supply of seafood in the world is shifting more towards aquaculture as the supply
from wild catch is stagnating in several regions and for many important species. Wild catch of
salmonids is varying between 700 000 and 1 000 000 tonnes GWE, whereas farmed salmonids
are increasing. The first year the total supply of salmonids was dominated by farmed, was in
1999. Since then, the share of farmed salmonids has increased and has become the dominant
source.
The total supply of all farmed salmonids exceeded two million tonnes (GWE) in 2014. The same
year, the total catch volume of wild salmonids was about one fourth of farmed, with chum, pink
and sockeye being the most common species.
About 25% of total wild catch of salmon has been imported frozen by China (from the US, Russia
and Japan), and later been re-exported as frozen fillets.
2. Definition of Segment 2.7 Salmonids harvest 2014
12
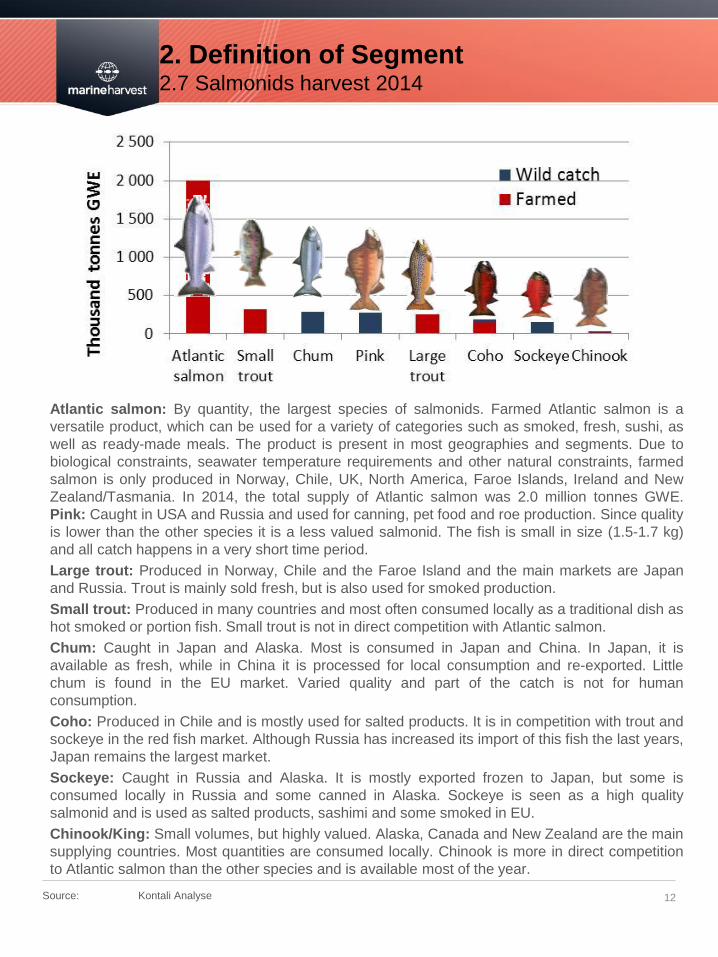
Atlantic salmon: By quantity, the largest species of salmonids. Farmed Atlantic salmon is a
versatile product, which can be used for a variety of categories such as smoked, fresh, sushi, as
well as ready-made meals. The product is present in most geographies and segments. Due to
biological constraints, seawater temperature requirements and other natural constraints, farmed
salmon is only produced in Norway, Chile, UK, North America, Faroe Islands, Ireland and New
Zealand/Tasmania. In 2014, the total supply of Atlantic salmon was 2.0 million tonnes GWE.
Pink: Caught in USA and Russia and used for canning, pet food and roe production. Since quality
is lower than the other species it is a less valued salmonid. The fish is small in size (1.5-1.7 kg)
and all catch happens in a very short time period.
Large trout: Produced in Norway, Chile and the Faroe Island and the main markets are Japan
and Russia. Trout is mainly sold fresh, but is also used for smoked production.
Small trout: Produced in many countries and most often consumed locally as a traditional dish as
hot smoked or portion fish. Small trout is not in direct competition with Atlantic salmon.
Chum: Caught in Japan and Alaska. Most is consumed in Japan and China. In Japan, it is
available as fresh, while in China it is processed for local consumption and re-exported. Little
chum is found in the EU market. Varied quality and part of the catch is not for human
consumption.
Coho: Produced in Chile and is mostly used for salted products. It is in competition with trout and
sockeye in the red fish market. Although Russia has increased its import of this fish the last years,
Japan remains the largest market.
Sockeye: Caught in Russia and Alaska. It is mostly exported frozen to Japan, but some is
consumed locally in Russia and some canned in Alaska. Sockeye is seen as a high quality
salmonid and is used as salted products, sashimi and some smoked in EU.
Chinook/King: Small volumes, but highly valued. Alaska, Canada and New Zealand are the main
supplying countries. Most quantities are consumed locally. Chinook is more in direct competition
to Atlantic salmon than the other species and is available most of the year.
Source: Kontali Analyse
2. Definition of Segment 2.8 A healthy product
13 Sources: FAO, Marine Harvest, WHO, The Norwegian Directorate of Health (2011),
U.S. Department for Agriculture, and Health and Human Services (2010)
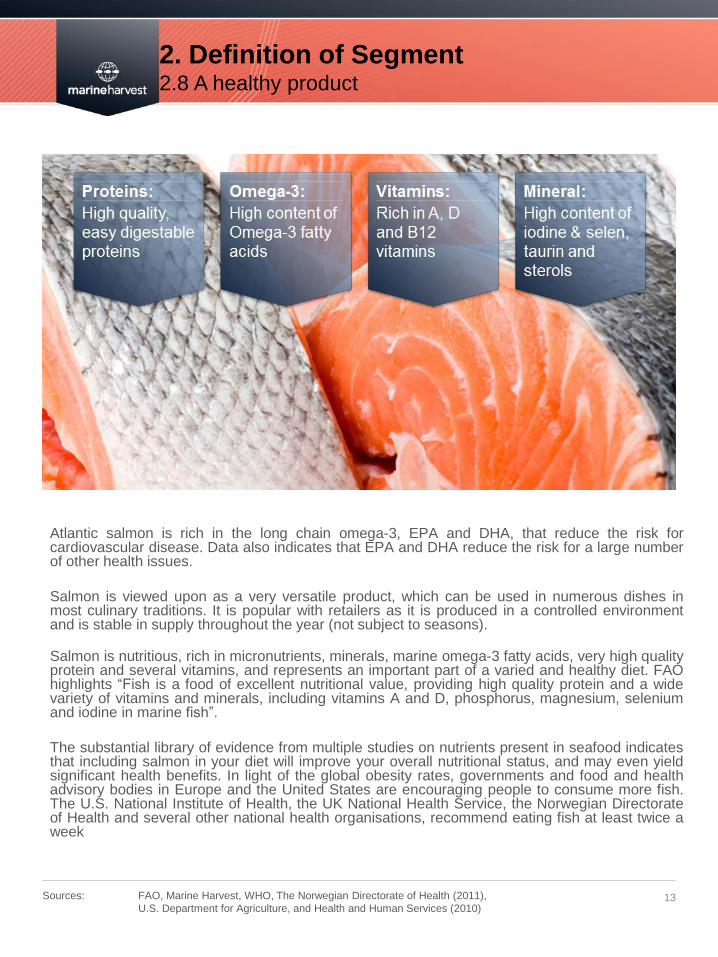
Atlantic salmon is rich in the long chain omega-3, EPA and DHA, that reduce the risk for cardiovascular disease. Data also indicates that EPA and DHA reduce the risk for a large number of other health issues.
Salmon is viewed upon as a very versatile product, which can be used in numerous dishes in most culinary traditions. It is popular with retailers as it is produced in a controlled environment and is stable in supply throughout the year (not subject to seasons).
Salmon is nutritious, rich in micronutrients, minerals, marine omega-3 fatty acids, very high quality protein and several vitamins, and represents an important part of a varied and healthy diet. FAO highlights “Fish is a food of excellent nutritional value, providing high quality protein and a wide variety of vitamins and minerals, including vitamins A and D, phosphorus, magnesium, selenium and iodine in marine fish”.
The substantial library of evidence from multiple studies on nutrients present in seafood indicates that including salmon in your diet will improve your overall nutritional status, and may even yield significant health benefits. In light of the global obesity rates, governments and food and health advisory bodies in Europe and the United States are encouraging people to consume more fish. The U.S. National Institute of Health, the UK National Health Service, the Norwegian Directorate of Health and several other national health organisations, recommend eating fish at least twice a week
2. Definition of Segment 2.9 Resource efficient production
14 Sources: Ytrestøyl et. al. (2014), National Beef Association UK (2014), Volden, H and N. I. Nielsen, (2011) Energy and
metabolizable protein supply, www.journalofanimalscience.org, Skretting (2012) Delivering SUSTAINABLE
FEED SOLUTIONS for aquaculture, SINTEF Report (2009) Carbon Footprint and energy use of Norwegian
seafood products
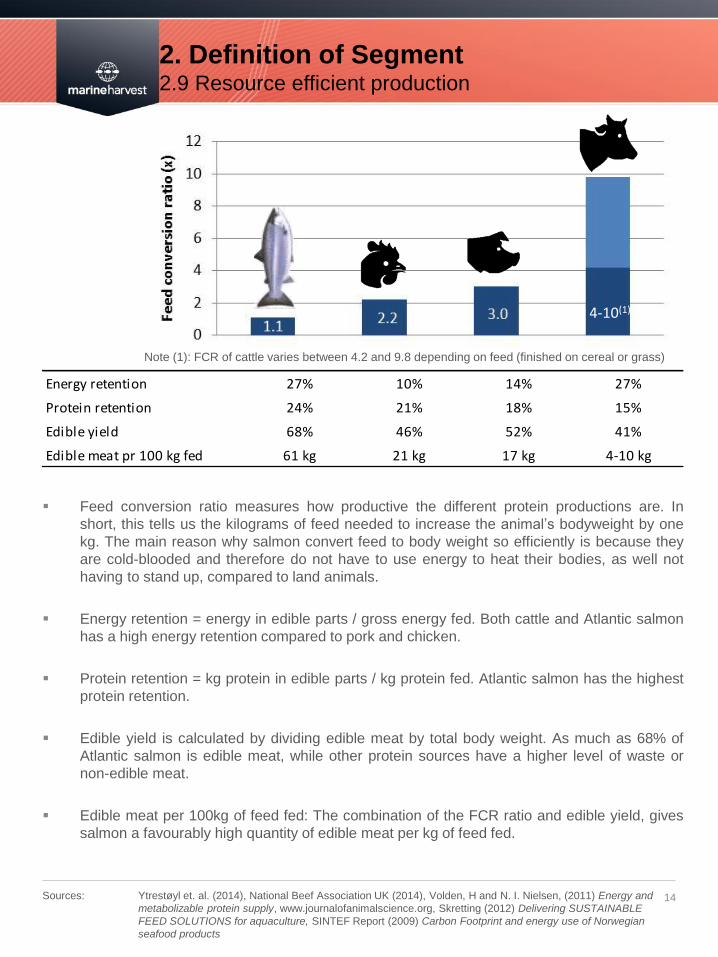
Feed conversion ratio measures how productive the different protein productions are. In
short, this tells us the kilograms of feed needed to increase the animal’s bodyweight by one
kg. The main reason why salmon convert feed to body weight so efficiently is because they
are cold-blooded and therefore do not have to use energy to heat their bodies, as well not
having to stand up, compared to land animals.
Energy retention = energy in edible parts / gross energy fed. Both cattle and Atlantic salmon
has a high energy retention compared to pork and chicken.
Protein retention = kg protein in edible parts / kg protein fed. Atlantic salmon has the highest
protein retention.
Edible yield is calculated by dividing edible meat by total body weight. As much as 68% of
Atlantic salmon is edible meat, while other protein sources have a higher level of waste or
non-edible meat.
Edible meat per 100kg of feed fed: The combination of the FCR ratio and edible yield, gives
salmon a favourably high quantity of edible meat per kg of feed fed.
Note (1): FCR of cattle varies between 4.2 and 9.8 depending on feed (finished on cereal or grass)
4-10(1)
Energy retention 27% 10% 14% 27%
Protein retention 24% 21% 18% 15%
Edible yield 68% 46% 52% 41%
Edible meat pr 100 kg fed 61 kg 21 kg 17 kg 4-10 kg
2. Definition of Segment 2.10 Climate friendly production
15 Sources: Marine Harvest, Mekonnen, M.M. & Hoekstra A.Y. (2010), Ytrestøyl et. al. (2014), SINTEF Report (2009)
Carbon Footprint and energy use of Norwegian seafood products, IME (2013)
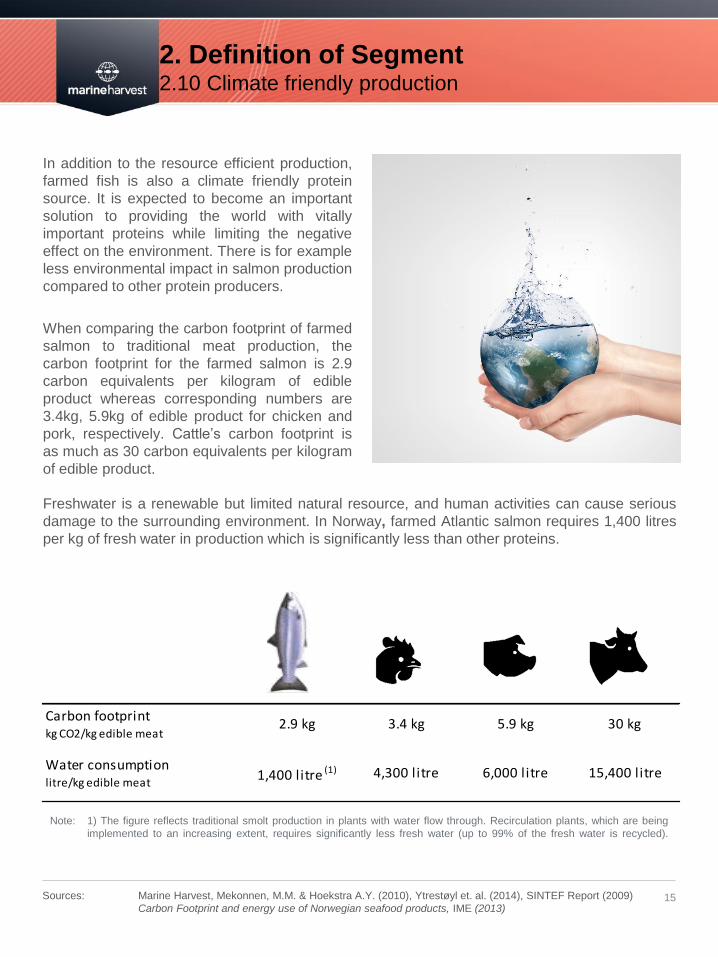
In addition to the resource efficient production,
farmed fish is also a climate friendly protein
source. It is expected to become an important
solution to providing the world with vitally
important proteins while limiting the negative
effect on the environment. There is for example
less environmental impact in salmon production
compared to other protein producers.
When comparing the carbon footprint of farmed
salmon to traditional meat production, the
carbon footprint for the farmed salmon is 2.9
carbon equivalents per kilogram of edible
product whereas corresponding numbers are
3.4kg, 5.9kg of edible product for chicken and
pork, respectively. Cattle’s carbon footprint is
as much as 30 carbon equivalents per kilogram
of edible product.
Freshwater is a renewable but limited natural resource, and human activities can cause serious
damage to the surrounding environment. In Norway, farmed Atlantic salmon requires 1,400 litres
per kg of fresh water in production which is significantly less than other proteins.
Note: 1) The figure reflects traditional smolt production in plants with water flow through. Recirculation plants, which are being
implemented to an increasing extent, requires significantly less fresh water (up to 99% of the fresh water is recycled).
Carbon footprintkg CO2/kg edible meat
2.9 kg 3.4 kg 5.9 kg 30 kg
Water consumptionlitre/kg edible meat
1,400 litre (1) 4,300 litre 6,000 litre 15,400 litre
2. Definition of Segment 2.11 Relative price development of protein products
16 Sources: International Monetary Fund
Marine Harvest
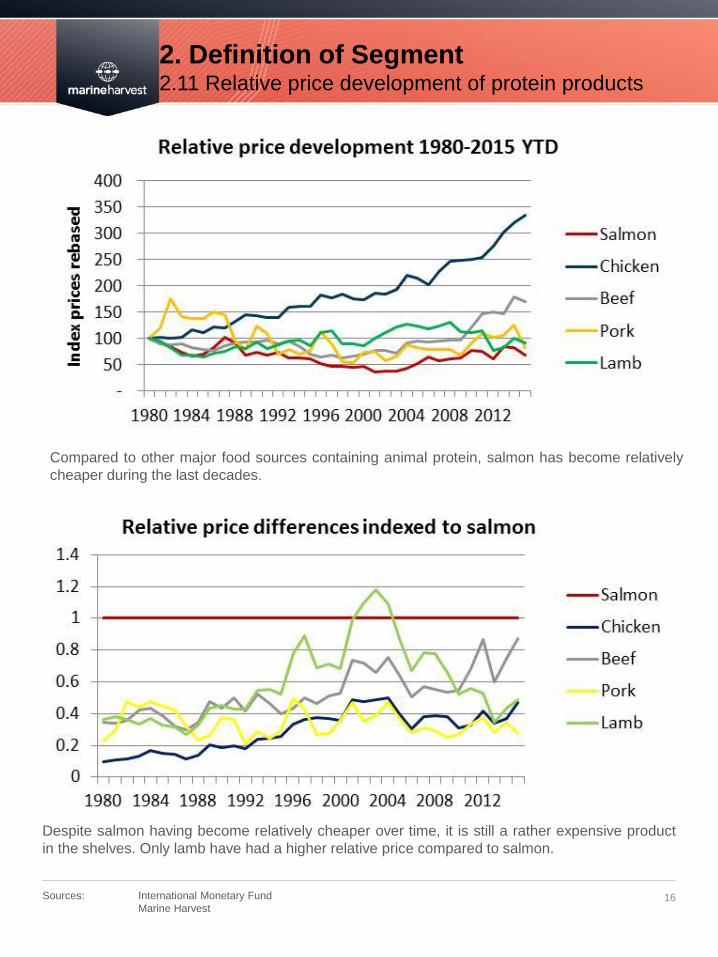
Compared to other major food sources containing animal protein, salmon has become relatively
cheaper during the last decades.
Despite salmon having become relatively cheaper over time, it is still a rather expensive product
in the shelves. Only lamb have had a higher relative price compared to salmon.
3. Salmon Supply 3.1 Historic total harvest of Atlantic salmon 1995-2015E
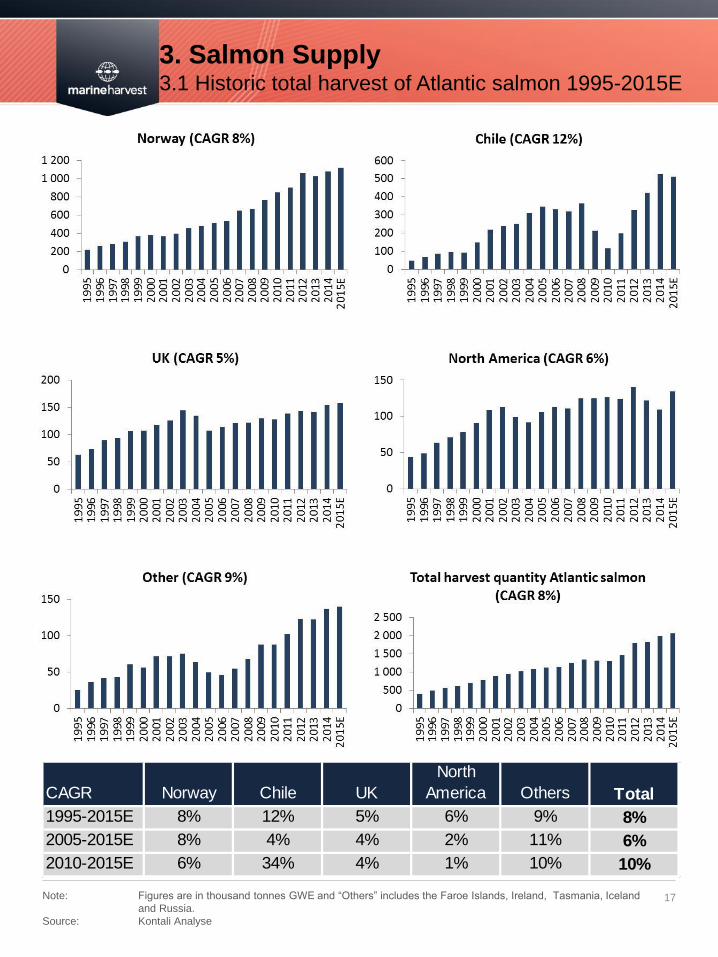
17 Note: Figures are in thousand tonnes GWE and “Others” includes the Faroe Islands, Ireland, Tasmania, Iceland
and Russia.
Source: Kontali Analyse
CAGR Norway Chile UK
North
America Others Total
1995-2015E 8% 12% 5% 6% 9% 8%
2005-2015E 8% 4% 4% 2% 11% 6%
2010-2015E 6% 34% 4% 1% 10% 10%
3. Salmon Supply 3.2 Diminishing growth expected going forward
18 Note: Marine Harvest does not provide guidance of industry supply except from guidance depicted in quarterly
presentations.
Sources: Kontali Analyse, Population Division of the Department of Economic and Social Affairs of the United Nations,
World Population Prospects: The 2012 Revision
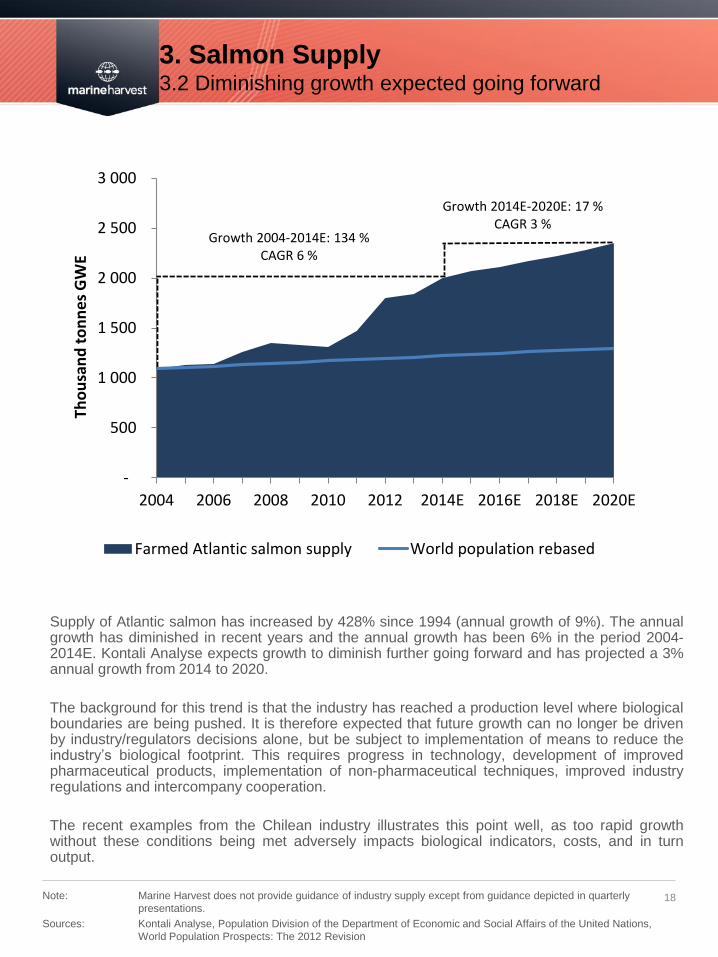
Supply of Atlantic salmon has increased by 428% since 1994 (annual growth of 9%). The annual growth has diminished in recent years and the annual growth has been 6% in the period 2004-2014E. Kontali Analyse expects growth to diminish further going forward and has projected a 3% annual growth from 2014 to 2020.
The background for this trend is that the industry has reached a production level where biological boundaries are being pushed. It is therefore expected that future growth can no longer be driven by industry/regulators decisions alone, but be subject to implementation of means to reduce the industry’s biological footprint. This requires progress in technology, development of improved pharmaceutical products, implementation of non-pharmaceutical techniques, improved industry regulations and intercompany cooperation.
The recent examples from the Chilean industry illustrates this point well, as too rapid growth without these conditions being met adversely impacts biological indicators, costs, and in turn output.
-
500
1 000
1 500
2 000
2 500
3 000
2004 2006 2008 2010 2012 2014E 2016E 2018E 2020E
Tho
usa
nd
to
nn
es G
WE
Farmed Atlantic salmon supply World population rebased
Growth 2004-2014E: 134 %CAGR 6 %
Growth 2014E-2020E: 17 %CAGR 3 %
3. Salmon Supply 3.3 Few coastlines feasible for salmon farming
19
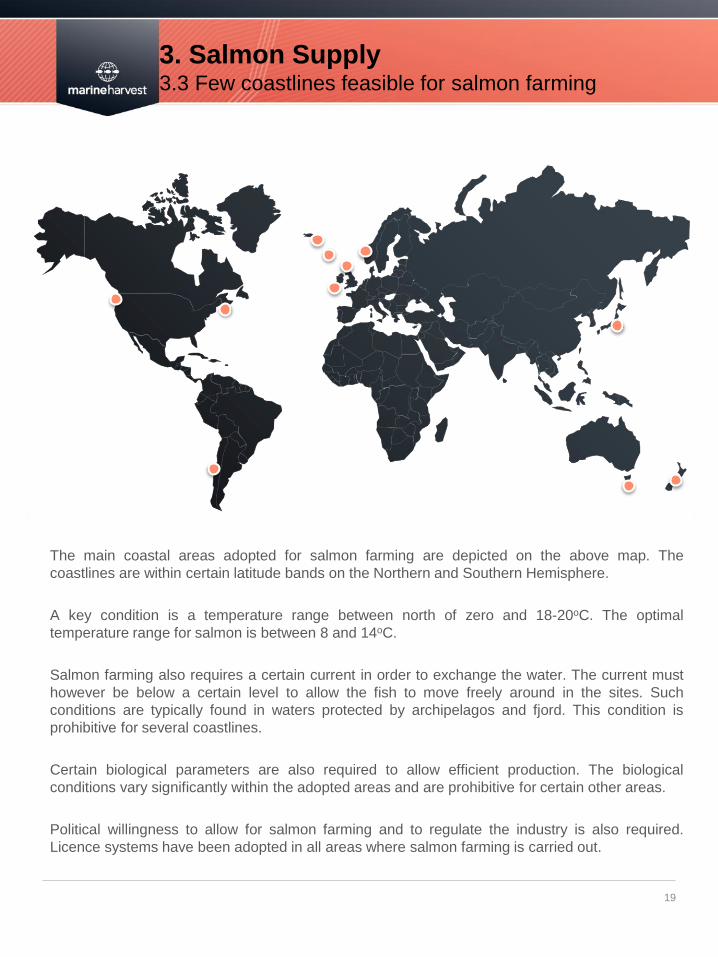
The main coastal areas adopted for salmon farming are depicted on the above map. The
coastlines are within certain latitude bands on the Northern and Southern Hemisphere.
A key condition is a temperature range between north of zero and 18-20oC. The optimal
temperature range for salmon is between 8 and 14oC.
Salmon farming also requires a certain current in order to exchange the water. The current must
however be below a certain level to allow the fish to move freely around in the sites. Such
conditions are typically found in waters protected by archipelagos and fjord. This condition is
prohibitive for several coastlines.
Certain biological parameters are also required to allow efficient production. The biological
conditions vary significantly within the adopted areas and are prohibitive for certain other areas.
Political willingness to allow for salmon farming and to regulate the industry is also required.
Licence systems have been adopted in all areas where salmon farming is carried out.
4. Salmon Markets 4.1 Global trade flow of farmed Atlantic salmon
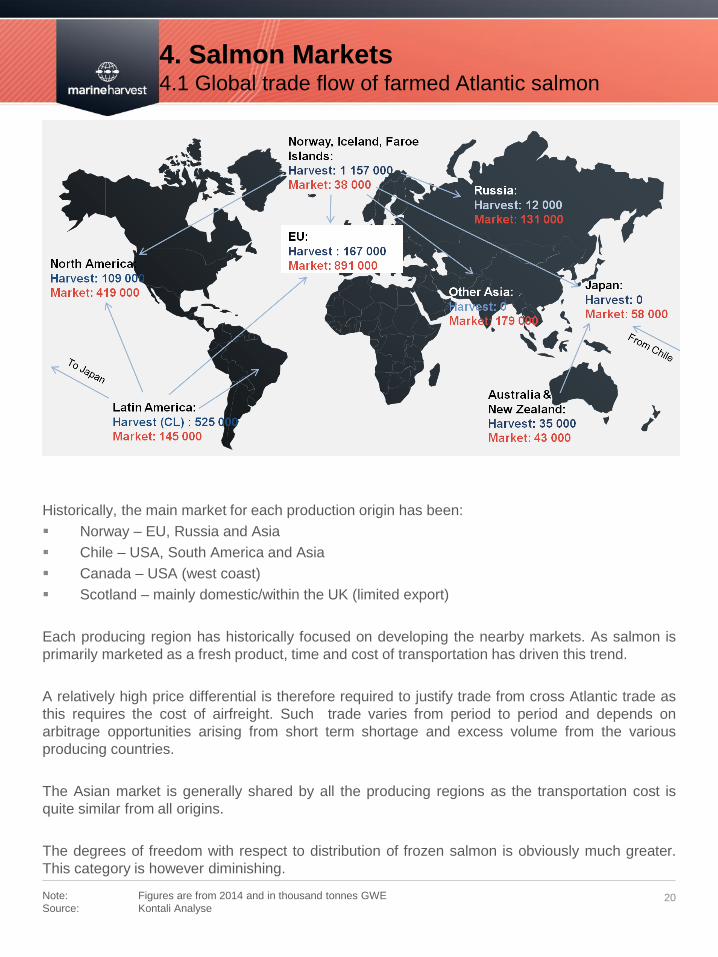
20 Note: Figures are from 2014 and in thousand tonnes GWE
Source: Kontali Analyse
Historically, the main market for each production origin has been:
Norway – EU, Russia and Asia
Chile – USA, South America and Asia
Canada – USA (west coast)
Scotland – mainly domestic/within the UK (limited export)
Each producing region has historically focused on developing the nearby markets. As salmon is
primarily marketed as a fresh product, time and cost of transportation has driven this trend.
A relatively high price differential is therefore required to justify trade from cross Atlantic trade as
this requires the cost of airfreight. Such trade varies from period to period and depends on
arbitrage opportunities arising from short term shortage and excess volume from the various
producing countries.
The Asian market is generally shared by all the producing regions as the transportation cost is
quite similar from all origins.
The degrees of freedom with respect to distribution of frozen salmon is obviously much greater.
This category is however diminishing.
4. Salmon Markets 4.2 Farmed Atlantic salmon by market
21 Source: Kontali Analyse
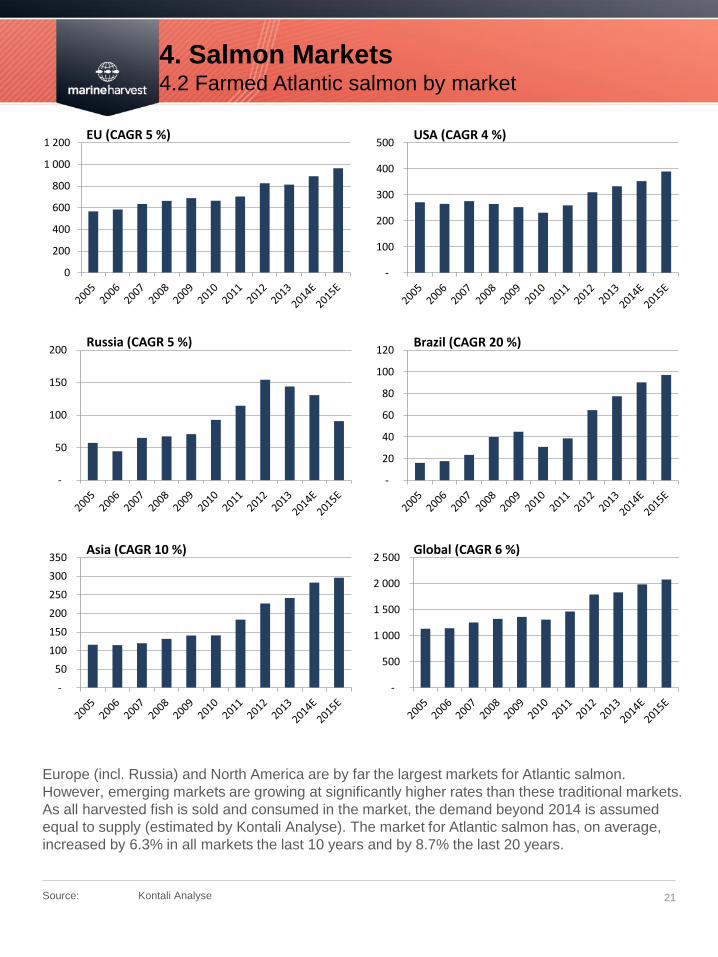
Europe (incl. Russia) and North America are by far the largest markets for Atlantic salmon.
However, emerging markets are growing at significantly higher rates than these traditional markets.
As all harvested fish is sold and consumed in the market, the demand beyond 2014 is assumed
equal to supply (estimated by Kontali Analyse). The market for Atlantic salmon has, on average,
increased by 6.3% in all markets the last 10 years and by 8.7% the last 20 years.
0
200
400
600
800
1 000
1 200EU (CAGR 5 %)
-
100
200
300
400
500USA (CAGR 4 %)
-
50
100
150
200Russia (CAGR 5 %)
-
20
40
60
80
100
120Brazil (CAGR 20 %)
-
50
100
150
200
250
300
350Asia (CAGR 10 %)
-
500
1 000
1 500
2 000
2 500Global (CAGR 6 %)
4. Salmon Markets 4.3 Development of value vs. volume
22 Source: Kontali Analyse
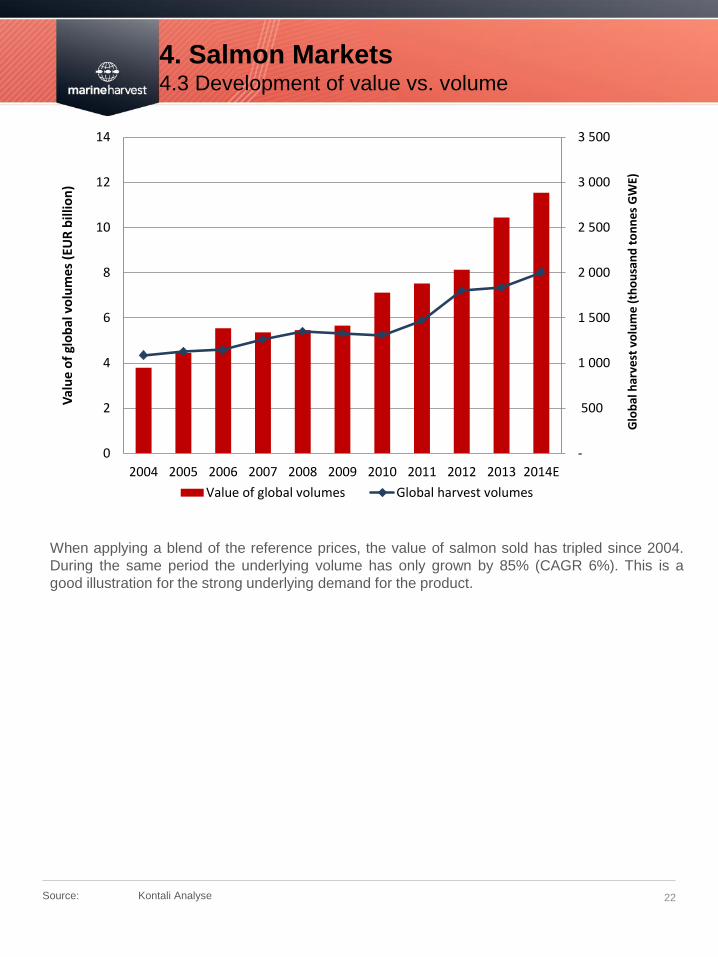
When applying a blend of the reference prices, the value of salmon sold has tripled since 2004.
During the same period the underlying volume has only grown by 85% (CAGR 6%). This is a
good illustration for the strong underlying demand for the product.
-
500
1 000
1 500
2 000
2 500
3 000
3 500
0
2
4
6
8
10
12
14
2004 2005 2006 2007 2008 2009 2010 2011 2012 2013 2014E
Val
ue
of
glo
bal
vo
lum
es (
EUR
bill
ion
)
Value of global volumes Global harvest volumes
Glo
bal
har
vest
vo
lum
e (
tho
usa
nd
to
nn
es G
WE)
-30%
-20%
-10%
0%
10%
20%
30%
40%
50%
-5% 0% 5% 10% 15% 20% 25%
Ch
ange
in a
vera
ge F
CA
Osl
o p
rice
Global supply change
4. Salmon Markets 4.4 Price neutral demand growth - historically 6-7%
23 Source: Kontali Analyse
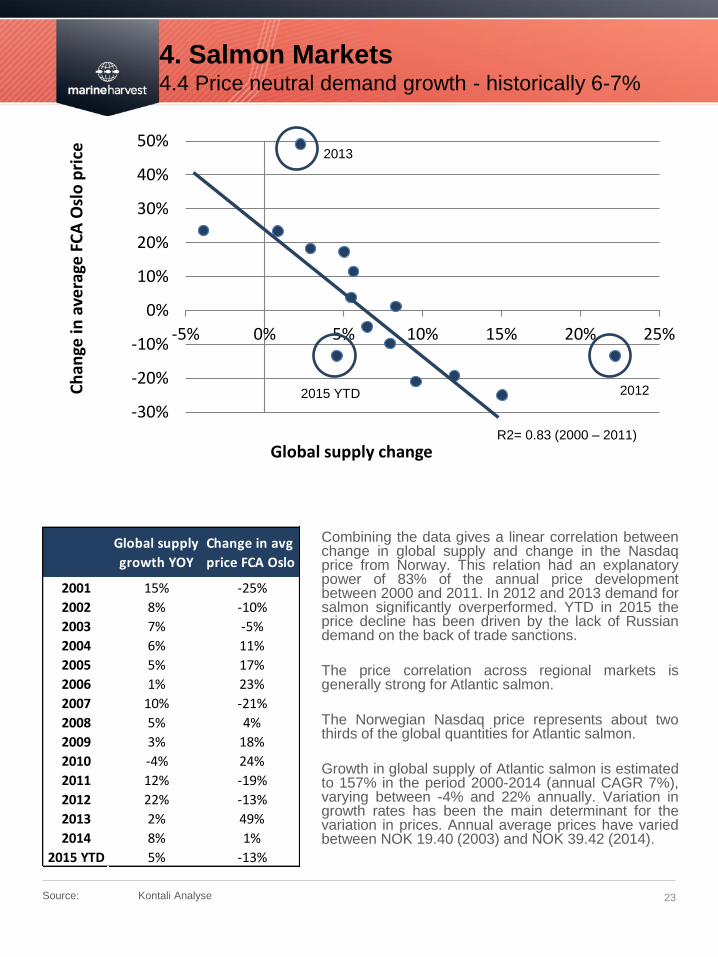
Combining the data gives a linear correlation between change in global supply and change in the Nasdaq price from Norway. This relation had an explanatory power of 83% of the annual price development between 2000 and 2011. In 2012 and 2013 demand for salmon significantly overperformed. YTD in 2015 the price decline has been driven by the lack of Russian demand on the back of trade sanctions.
The price correlation across regional markets is generally strong for Atlantic salmon.
The Norwegian Nasdaq price represents about two thirds of the global quantities for Atlantic salmon.
Growth in global supply of Atlantic salmon is estimated to 157% in the period 2000-2014 (annual CAGR 7%), varying between -4% and 22% annually. Variation in growth rates has been the main determinant for the variation in prices. Annual average prices have varied between NOK 19.40 (2003) and NOK 39.42 (2014).
2013
2012
R2= 0.83 (2000 – 2011)
2015 YTD
2001 15% -25%
2002 8% -10%
2003 7% -5%
2004 6% 11%
2005 5% 17%
2006 1% 23%
2007 10% -21%
2008 5% 4%
2009 3% 18%
2010 -4% 24%
2011 12% -19%
2012 22% -13%
2013 2% 49%
2014 8% 1%
2015 YTD 5% -13%
Global supply
growth YOY
Change in avg
price FCA Oslo
4. Salmon Markets 4.5 Supply and demand – historic prices
24 Source: Kontali Analyse
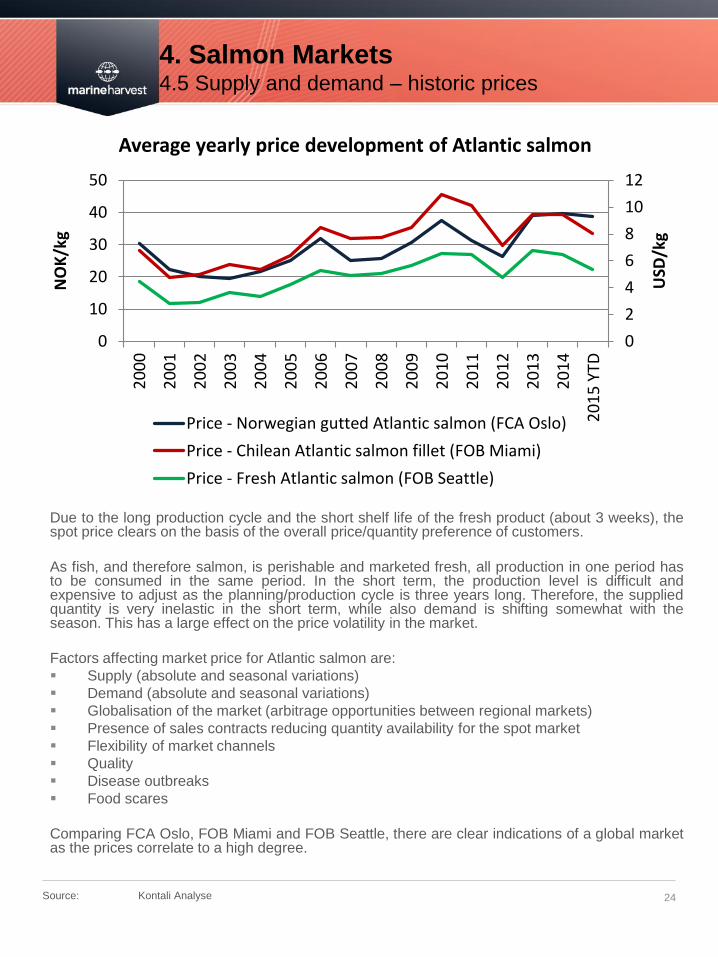
Due to the long production cycle and the short shelf life of the fresh product (about 3 weeks), the spot price clears on the basis of the overall price/quantity preference of customers.
As fish, and therefore salmon, is perishable and marketed fresh, all production in one period has to be consumed in the same period. In the short term, the production level is difficult and expensive to adjust as the planning/production cycle is three years long. Therefore, the supplied quantity is very inelastic in the short term, while also demand is shifting somewhat with the season. This has a large effect on the price volatility in the market.
Factors affecting market price for Atlantic salmon are:
Supply (absolute and seasonal variations)
Demand (absolute and seasonal variations)
Globalisation of the market (arbitrage opportunities between regional markets)
Presence of sales contracts reducing quantity availability for the spot market
Flexibility of market channels
Quality
Disease outbreaks
Food scares
Comparing FCA Oslo, FOB Miami and FOB Seattle, there are clear indications of a global market as the prices correlate to a high degree.
0
2
4
6
8
10
12
0
10
20
30
40
50
20
00
20
01
20
02
20
03
20
04
20
05
20
06
20
07
20
08
20
09
20
10
20
11
20
12
20
13
20
14
20
15
YTD
USD
/kg
NO
K/k
g
Average yearly price development of Atlantic salmon
Price - Norwegian gutted Atlantic salmon (FCA Oslo)
Price - Chilean Atlantic salmon fillet (FOB Miami)
Price - Fresh Atlantic salmon (FOB Seattle)
4. Salmon Markets 4.6 Historic price development by local reference prices
25 Source: Kontali Analyse
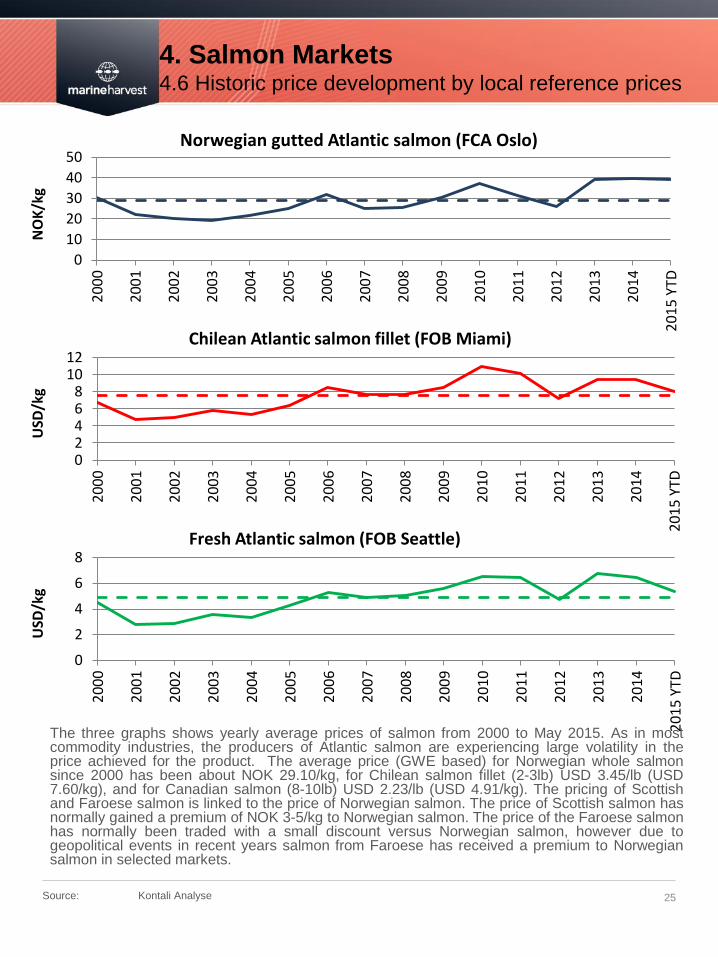
The three graphs shows yearly average prices of salmon from 2000 to May 2015. As in most commodity industries, the producers of Atlantic salmon are experiencing large volatility in the price achieved for the product. The average price (GWE based) for Norwegian whole salmon since 2000 has been about NOK 29.10/kg, for Chilean salmon fillet (2-3lb) USD 3.45/lb (USD 7.60/kg), and for Canadian salmon (8-10lb) USD 2.23/lb (USD 4.91/kg). The pricing of Scottish and Faroese salmon is linked to the price of Norwegian salmon. The price of Scottish salmon has normally gained a premium of NOK 3-5/kg to Norwegian salmon. The price of the Faroese salmon has normally been traded with a small discount versus Norwegian salmon, however due to geopolitical events in recent years salmon from Faroese has received a premium to Norwegian salmon in selected markets.
0
10
20
30
40
50
20
00
20
01
20
02
20
03
20
04
20
05
20
06
20
07
20
08
20
09
20
10
20
11
20
12
20
13
20
14
20
15
YTD
NO
K/k
g
Norwegian gutted Atlantic salmon (FCA Oslo)
02468
1012
20
00
20
01
20
02
20
03
20
04
20
05
20
06
20
07
20
08
20
09
20
10
20
11
20
12
20
13
20
14
20
15
YTD
USD
/kg
Chilean Atlantic salmon fillet (FOB Miami)
0
2
4
6
8
20
00
20
01
20
02
20
03
20
04
20
05
20
06
20
07
20
08
20
09
20
10
20
11
20
12
20
13
20
14
20
15
YTD
USD
/kg
Fresh Atlantic salmon (FOB Seattle)
4. Salmon Markets 4.7 Different sizes – different prices (Norway)
26 Source: Kontali Analyse
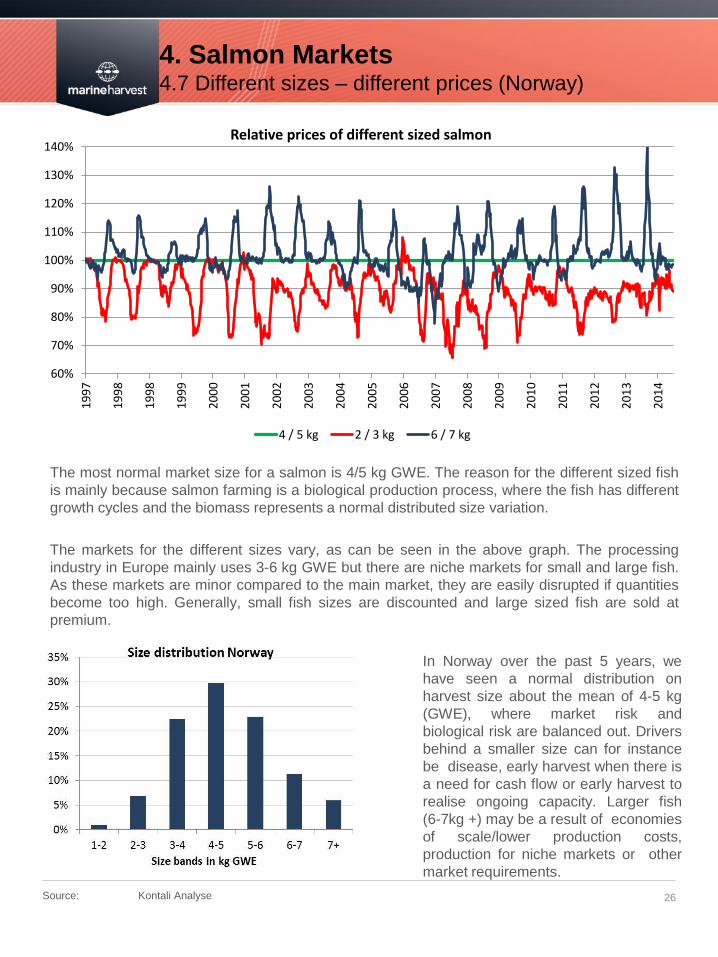
In Norway over the past 5 years, we
have seen a normal distribution on
harvest size about the mean of 4-5 kg
(GWE), where market risk and
biological risk are balanced out. Drivers
behind a smaller size can for instance
be disease, early harvest when there is
a need for cash flow or early harvest to
realise ongoing capacity. Larger fish
(6-7kg +) may be a result of economies
of scale/lower production costs,
production for niche markets or other
market requirements.
The most normal market size for a salmon is 4/5 kg GWE. The reason for the different sized fish
is mainly because salmon farming is a biological production process, where the fish has different
growth cycles and the biomass represents a normal distributed size variation.
The markets for the different sizes vary, as can be seen in the above graph. The processing
industry in Europe mainly uses 3-6 kg GWE but there are niche markets for small and large fish.
As these markets are minor compared to the main market, they are easily disrupted if quantities
become too high. Generally, small fish sizes are discounted and large sized fish are sold at
premium.
60%
70%
80%
90%
100%
110%
120%
130%
140%
19
97
19
98
19
98
19
99
20
00
20
01
20
02
20
03
20
04
20
05
20
06
20
07
20
08
20
09
20
10
20
11
20
12
20
13
20
14
Relative prices of different sized salmon
4 / 5 kg 2 / 3 kg 6 / 7 kg
5. Industry Structure 5.1 Top 5-10 players of farmed Atlantic salmon
27 Source: Kontali Analyse, Marine Harvest, Quarterly reports
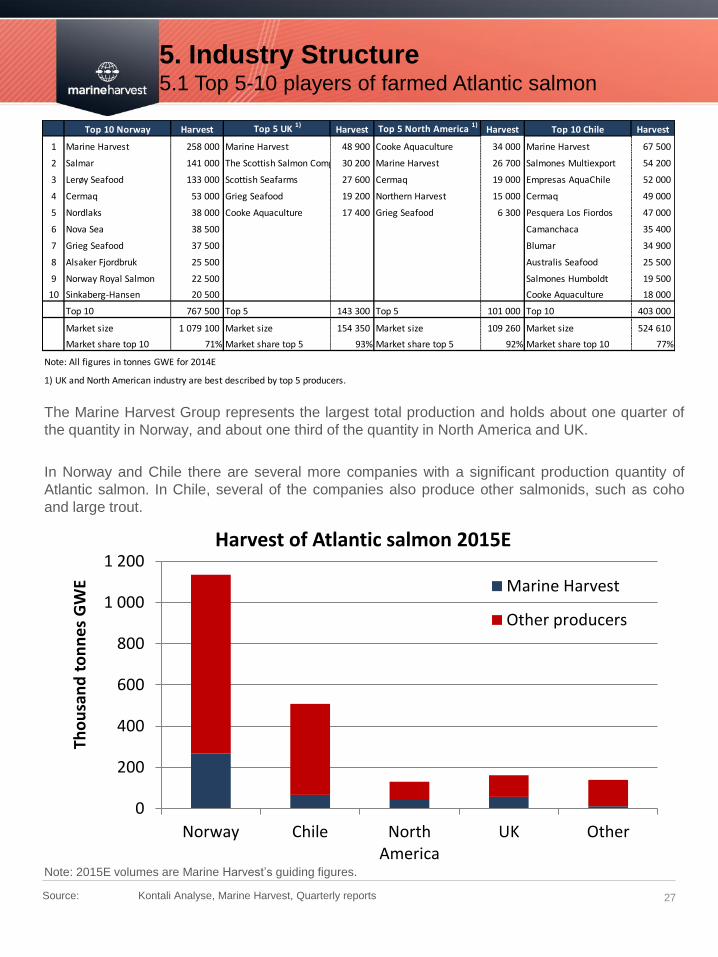
The Marine Harvest Group represents the largest total production and holds about one quarter of
the quantity in Norway, and about one third of the quantity in North America and UK.
In Norway and Chile there are several more companies with a significant production quantity of
Atlantic salmon. In Chile, several of the companies also produce other salmonids, such as coho
and large trout.
Note: 2015E volumes are Marine Harvest’s guiding figures.
0
200
400
600
800
1 000
1 200
Norway Chile NorthAmerica
UK Other
Tho
usa
nd
to
nn
es G
WE
Harvest of Atlantic salmon 2015E
Marine Harvest
Other producers
Top 10 Norway Harvest Top 5 UK 1)Harvest Top 5 North America 1)
Harvest Top 10 Chile Harvest
1 Marine Harvest 258 000 Marine Harvest 48 900 Cooke Aquaculture 34 000 Marine Harvest 67 500
2 Salmar 141 000 The Scottish Salmon Company30 200 Marine Harvest 26 700 Salmones Multiexport 54 200
3 Lerøy Seafood 133 000 Scottish Seafarms 27 600 Cermaq 19 000 Empresas AquaChile 52 000
4 Cermaq 53 000 Grieg Seafood 19 200 Northern Harvest 15 000 Cermaq 49 000
5 Nordlaks 38 000 Cooke Aquaculture 17 400 Grieg Seafood 6 300 Pesquera Los Fiordos 47 000
6 Nova Sea 38 500 Camanchaca 35 400
7 Grieg Seafood 37 500 Blumar 34 900
8 Alsaker Fjordbruk 25 500 Australis Seafood 25 500
9 Norway Royal Salmon 22 500 Salmones Humboldt 19 500
10 Sinkaberg-Hansen 20 500 Cooke Aquaculture 18 000
Top 10 767 500 Top 5 143 300 Top 5 101 000 Top 10 403 000
Market size 1 079 100 Market size 154 350 Market size 109 260 Market size 524 610
Market share top 10 71% Market share top 5 93% Market share top 5 92% Market share top 10 77%
Note: All figures in tonnes GWE for 2014E
1) UK and North American industry are best described by top 5 producers.
5. Industry Structure 5.2 Number of players in producing countries
28 Note: See appendix for some historical acquisitions and divestments
Source: Kontali Analyse
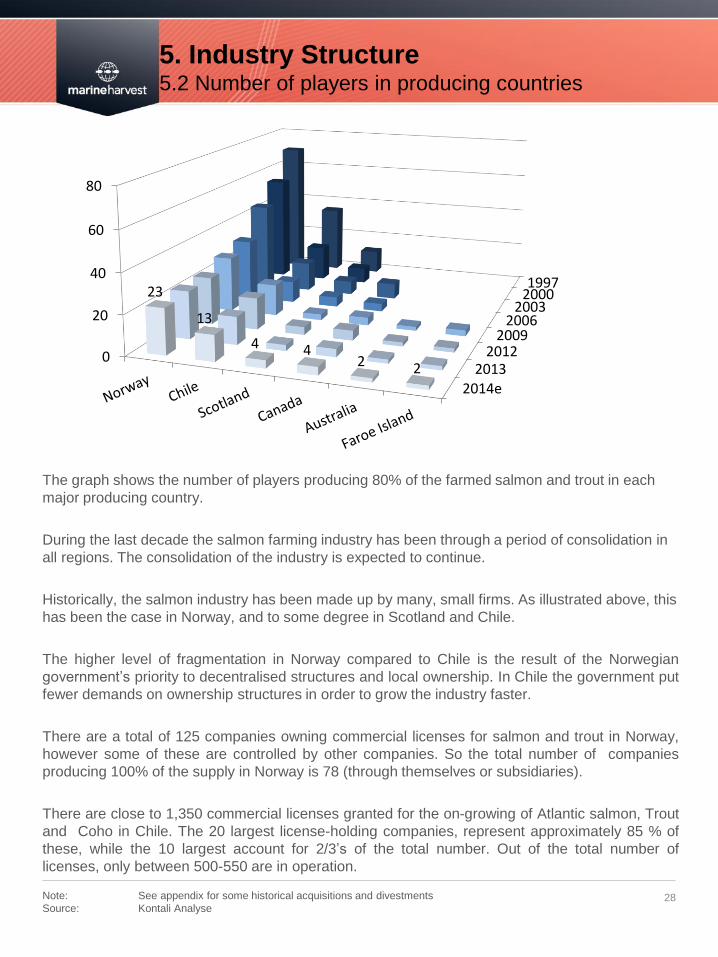
The graph shows the number of players producing 80% of the farmed salmon and trout in each
major producing country.
During the last decade the salmon farming industry has been through a period of consolidation in
all regions. The consolidation of the industry is expected to continue.
Historically, the salmon industry has been made up by many, small firms. As illustrated above, this
has been the case in Norway, and to some degree in Scotland and Chile.
The higher level of fragmentation in Norway compared to Chile is the result of the Norwegian
government’s priority to decentralised structures and local ownership. In Chile the government put
fewer demands on ownership structures in order to grow the industry faster.
There are a total of 125 companies owning commercial licenses for salmon and trout in Norway,
however some of these are controlled by other companies. So the total number of companies
producing 100% of the supply in Norway is 78 (through themselves or subsidiaries).
There are close to 1,350 commercial licenses granted for the on-growing of Atlantic salmon, Trout
and Coho in Chile. The 20 largest license-holding companies, represent approximately 85 % of
these, while the 10 largest account for 2/3’s of the total number. Out of the total number of
licenses, only between 500-550 are in operation.
2014e2013
20122009
20062003
20001997
0
20
40
60
80
23
13
4 42 2

6. Salmon Production and Cost Structure 6.1 Establishing a salmon farm
29
The salmon farming production cycle is about 3 years. During the first year of production the eggs
are fertilised and the fish is grown into approx. 100 grams in controlled freshwater environment.
Subsequently, the fish is transported into seawater cages where it is grown out to approx. 4-5 kg
during a period of 14-24 months. The growth of the fish is heavily dependent on the seawater
temperatures, which varies by time of year and across regions.
Having reached harvestable size, the fish is transported to primary processing plants where it is
slaughtered and gutted. Most salmon is sold gutted on ice in a box (GWE).
6. Salmon Production and Cost Structure 6.2 The Atlantic salmon life/production cycle
30 Note: See appendix for a more detailed illustration of the production cycle.
Source: Marine Harvest
10-1
6 m
on
ths
14
-24
month
s
Brood – Parr -
Smolt
Spawn
Transfer
to sea Growth phase
in sea
Slaughtering Processing
6. Salmon Production and Cost Structure 6.2 The Atlantic salmon life/production cycle
31 Source: Marine Harvest
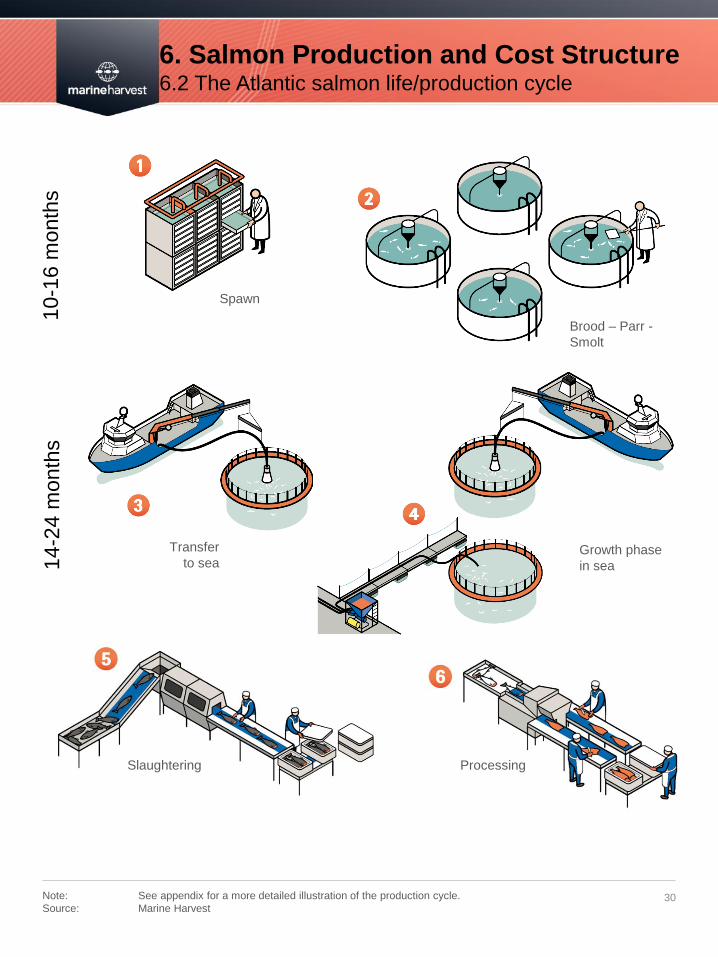
The total freshwater production cycle takes approximately 10-16 months and the total seawater
production cycle take approximately 14-24 months, hence a total cycle length of 24-40 months. In
Chile, the cycle is slightly shorter as the sea water temperatures are more optimal.
In autumn, the broodstock are stripped for eggs and the ova inlay happens between November
and March. The producer has the possibility to speed up the growth of the juveniles with light
manipulation to accelerate the smoltification process by up to 6 months.
In Norway, smolt is mainly released into seawater twice a year. Harvesting volume is spread
evenly throughout most of the year, although harvesting quantity is largest in the last quarter of
the year as this is the period of best growth. During summer, the supply to the market is
significantly different than the rest of the year as the harvesting pattern shift generation. During
this time the weight dispersion between the large and small harvested salmon is greater than the
rest of the year.
After a site is harvested, the location is fallowed between 2 and 6 months before the next
generation is put to sea at the same location. Smolt may be released in the same location with a
two year cycle.
6. Salmon Production and Cost Structure 6.3 Sea water temperature’s influence
32 Sources: Marine Harvest, www.seatemperature.org
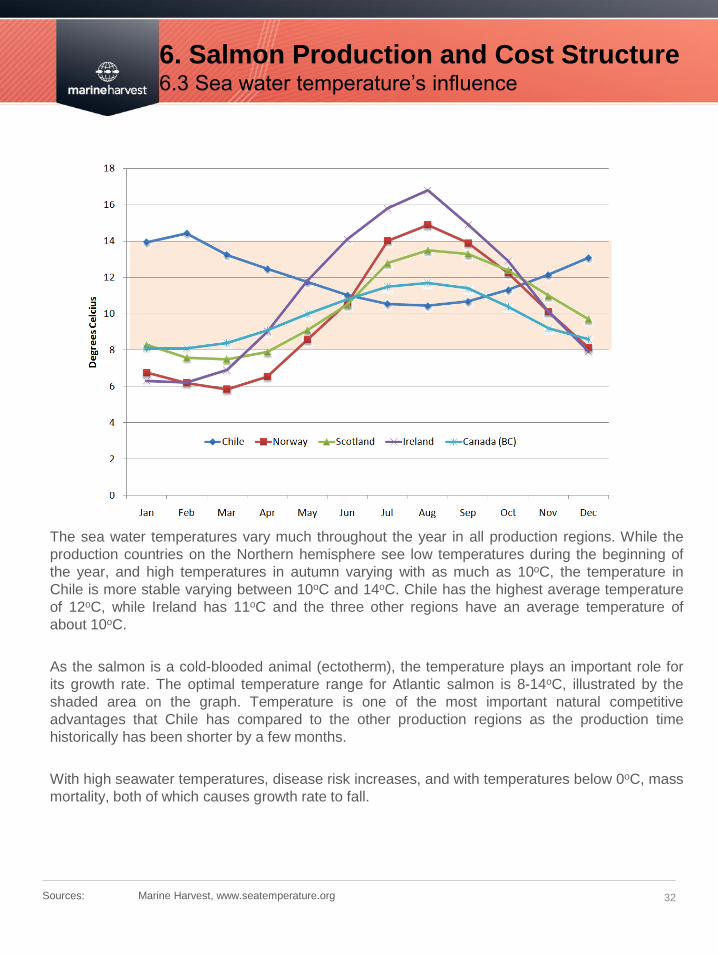
The sea water temperatures vary much throughout the year in all production regions. While the
production countries on the Northern hemisphere see low temperatures during the beginning of
the year, and high temperatures in autumn varying with as much as 10oC, the temperature in
Chile is more stable varying between 10oC and 14oC. Chile has the highest average temperature
of 12oC, while Ireland has 11oC and the three other regions have an average temperature of
about 10oC.
As the salmon is a cold-blooded animal (ectotherm), the temperature plays an important role for
its growth rate. The optimal temperature range for Atlantic salmon is 8-14oC, illustrated by the
shaded area on the graph. Temperature is one of the most important natural competitive
advantages that Chile has compared to the other production regions as the production time
historically has been shorter by a few months.
With high seawater temperatures, disease risk increases, and with temperatures below 0oC, mass
mortality, both of which causes growth rate to fall.
6. Salmon Production and Cost Structure 6.4 Production inputs
33
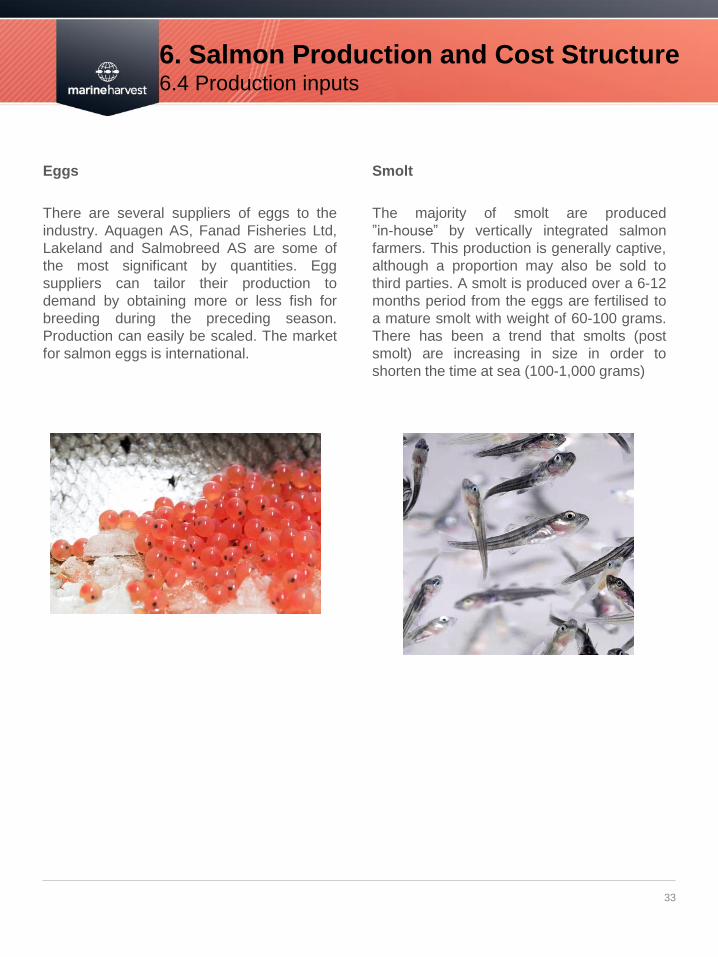
Eggs
There are several suppliers of eggs to the
industry. Aquagen AS, Fanad Fisheries Ltd,
Lakeland and Salmobreed AS are some of
the most significant by quantities. Egg
suppliers can tailor their production to
demand by obtaining more or less fish for
breeding during the preceding season.
Production can easily be scaled. The market
for salmon eggs is international.
Smolt
The majority of smolt are produced
”in-house” by vertically integrated salmon
farmers. This production is generally captive,
although a proportion may also be sold to
third parties. A smolt is produced over a 6-12
months period from the eggs are fertilised to
a mature smolt with weight of 60-100 grams.
There has been a trend that smolts (post
smolt) are increasing in size in order to
shorten the time at sea (100-1,000 grams)
6. Salmon Production and Cost Structure 6.4 Production inputs
34 Sources: Marine Harvest, Kontali Analyse, SSPO, Estudio Situación Laboral en la Industria del Salmón”
Silvia Leiva 2014
Labour
According to Nofima there were over 9 600 full time employees in the aquaculture industry in Norway in
2013. The employment effect of derived activities of aquaculture purchases are nearly 15 000 employees. In
total there are over 24 000 full time employees either directly or indirectly as a result of the aquaculture
industry in Norway.
According to Scotland Salmon Producers Organisation (SSPO), over 2 500 people are employed in salmon
production in Scotland. The Scottish Government estimates that over 8 000 jobs are generated directly or
indirectly by the aquaculture industry.
Estimates on Canadian employment say that around 15 000 people are employed in aquaculture, where 6
000 are based in British Colombia.
Direct employment in Chilean aquaculture (incl. processing) is estimated to around 30 000 people in 2014.
The Marine Harvest Group has a total of 11 700 employees in 24 countries worldwide (31 Dec 2014).
In Norway, both salaries and levels of automation are highest, while the opposite is the case in Chile.
Salaries in UK and Canada are somewhat lower than in Norway.
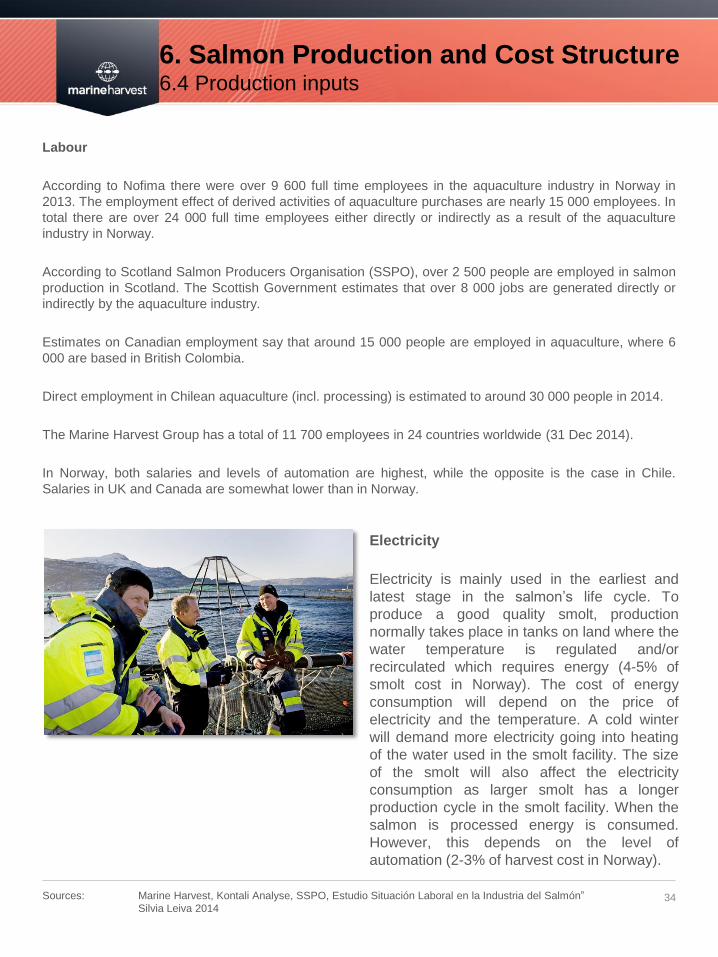
Electricity
Electricity is mainly used in the earliest and
latest stage in the salmon’s life cycle. To
produce a good quality smolt, production
normally takes place in tanks on land where the
water temperature is regulated and/or
recirculated which requires energy (4-5% of
smolt cost in Norway). The cost of energy
consumption will depend on the price of
electricity and the temperature. A cold winter
will demand more electricity going into heating
of the water used in the smolt facility. The size
of the smolt will also affect the electricity
consumption as larger smolt has a longer
production cycle in the smolt facility. When the
salmon is processed energy is consumed.
However, this depends on the level of
automation (2-3% of harvest cost in Norway).
6. Salmon Production and Cost Structure 6.5 Cost component – disease and mortality
35
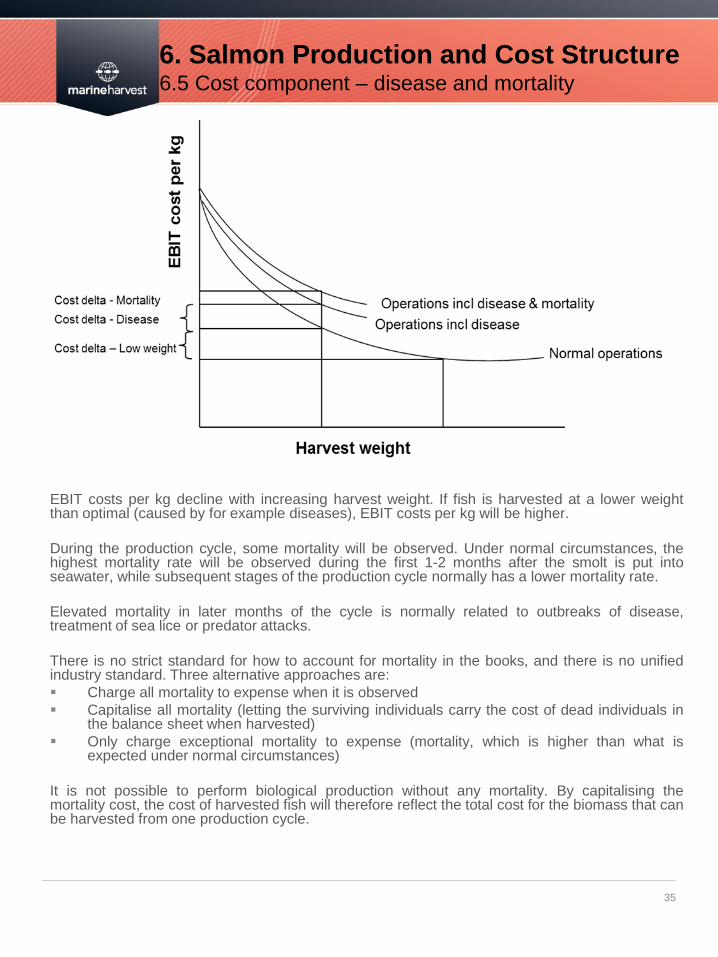
EBIT costs per kg decline with increasing harvest weight. If fish is harvested at a lower weight than optimal (caused by for example diseases), EBIT costs per kg will be higher.
During the production cycle, some mortality will be observed. Under normal circumstances, the highest mortality rate will be observed during the first 1-2 months after the smolt is put into seawater, while subsequent stages of the production cycle normally has a lower mortality rate.
Elevated mortality in later months of the cycle is normally related to outbreaks of disease, treatment of sea lice or predator attacks.
There is no strict standard for how to account for mortality in the books, and there is no unified industry standard. Three alternative approaches are:
Charge all mortality to expense when it is observed
Capitalise all mortality (letting the surviving individuals carry the cost of dead individuals in the balance sheet when harvested)
Only charge exceptional mortality to expense (mortality, which is higher than what is expected under normal circumstances)
It is not possible to perform biological production without any mortality. By capitalising the mortality cost, the cost of harvested fish will therefore reflect the total cost for the biomass that can be harvested from one production cycle.
6. Salmon Production and Cost Structure 6.6 Accounting principles for biological assets
36
Biological assets are measured at fair value less cost to sell, unless the fair value cannot be measured reliably.
Effective markets for sale of live fish do not exist so the valuation of live fish implies establishment of an estimated fair value of the fish in a hypothetical market. The calculation of the estimated fair value is based on market prices for harvested fish and adjusted for estimated differences. The prices are reduced for harvesting costs and freight costs to market, to arrive at a net value back to farm. The valuation reflects the expected quality grading and size distribution. The change in estimated fair value is recognised in profit or loss on a continuous basis, and is classified separately (not included in the cost of the harvested biomass). On harvest, the fair value adjustment is reversed on the same line.
The biomass valuation includes the full estimated fair value of fish at and above harvest size (4 kg LW). For fish between 1 kg and 4 kg LW a relative share of future value is included. The best fair value estimate for fish below 1 kg, smolt and broodstock is considered to be accumulated cost. The valuation is completed for each business unit and is based on biomass in sea for each sea water site. The fair value reflects the expected market price. The market price is derived from a variety of sources, normally a combination of achieved prices last month and the most recent contract entered into. For Marine Harvest Norway, quoted forward prices (Fish Pool) are also included in the calculation.
Operational EBIT
Operational EBIT and other operational results are reported based on the realised costs of harvested volume and do not include the fair value adjustments on biomass.
6. Salmon Production and Cost Structure 6.7 Economics of salmon farming
37
Reported revenues: Revenues are a gross figure; they can include invoiced freight from reference place (e.g. FCA Oslo) to customer, and have discounts, commissions and credits deducted. Reported revenues can also include revenues from trading activity, sales of by-products, insurance compensation, gain/loss on sale of assets etc.
Price: Reported prices are normally stated in the terms of a specific reference price e.g. the Nasdaq price for Norway (FCA Oslo) and UB price for Chile (FOB Miami). Reference prices are not reflecting freight, and other sales reducing items mentioned above. Reference prices are for one specific product (Nasdaq price = sales price per kg head on gutted fish packed fresh in a standard box). Sales of other products (frozen products, fresh fillets and portions) will cause deviation in the achieved prices vs. reference price. Reference prices are for superior quality fish, while achieved prices are for a mix of qualities, including downgrades. Reference prices are spot prices, while most companies will have a mix of spot and contract sales in their portfolio.
Quantity: Reported quantity can take many forms. Quantity harvested = Fish harvested in a specific period in a standardized term; e.g. Gutted Weight Equivalent (GWE), which is the same weight measure as Head-on-Gutted (HOG), or Whole Fish Equivalent (WFE), the difference being gutting loss. Quantity sold can be reported using different weight scales:
Kg sold in product weight.
Kg sold converted to standard weight unit (GWE or WFE).
Quantity sold could also include traded quantity.
The salmon farming industry is capital intensive and volatile. This is a result of a long production cycle, a fragmented industry, market conditions and a biological production process, which is affected by many external factors.
Over time, production costs have been reduced and productivity has increased as new technology and new competence has been achieved. In recent years, costs have trended upwards due to several factors including rising feed costs, biological costs and more stringent regulatory compliance procedures.
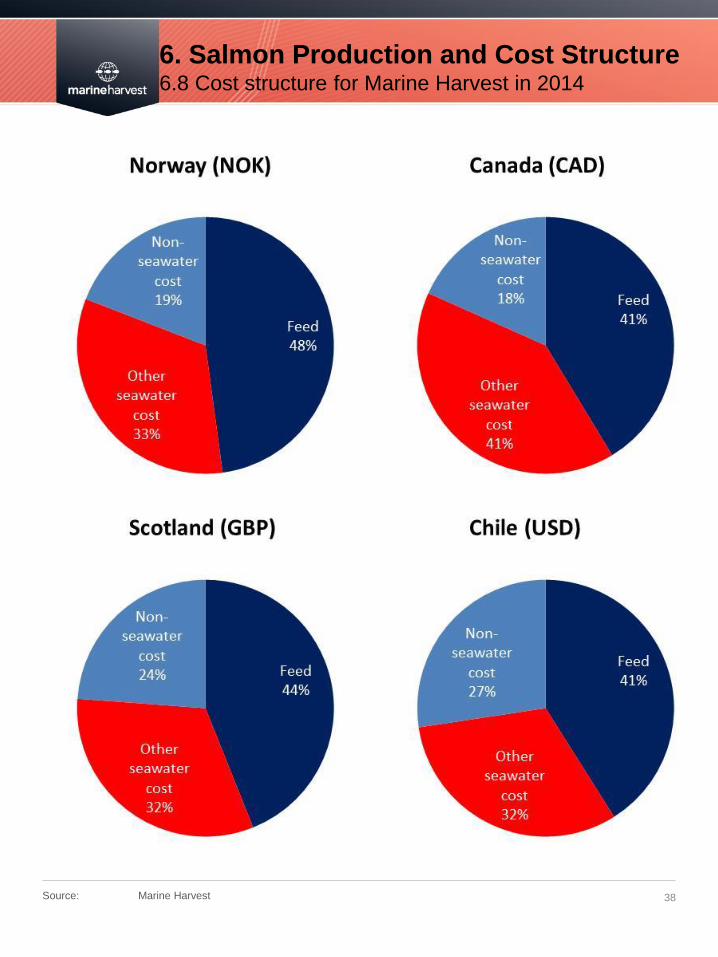
6. Salmon Production and Cost Structure 6.8 Cost structure for Marine Harvest in 2014
38 Source: Marine Harvest
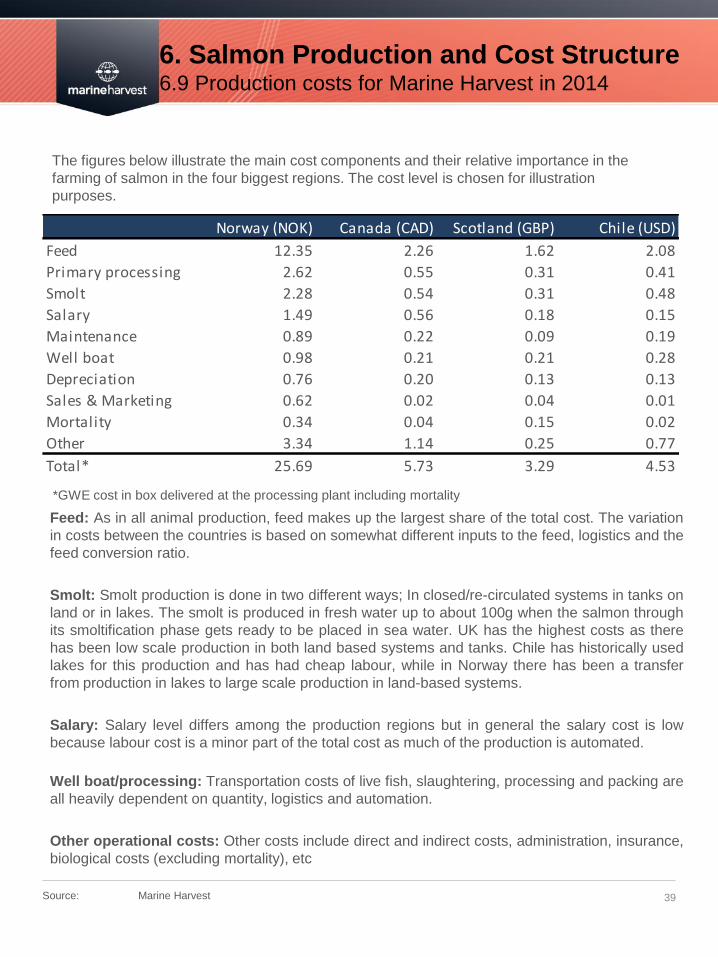
6. Salmon Production and Cost Structure 6.9 Production costs for Marine Harvest in 2014
39
Feed: As in all animal production, feed makes up the largest share of the total cost. The variation
in costs between the countries is based on somewhat different inputs to the feed, logistics and the
feed conversion ratio.
Smolt: Smolt production is done in two different ways; In closed/re-circulated systems in tanks on
land or in lakes. The smolt is produced in fresh water up to about 100g when the salmon through
its smoltification phase gets ready to be placed in sea water. UK has the highest costs as there
has been low scale production in both land based systems and tanks. Chile has historically used
lakes for this production and has had cheap labour, while in Norway there has been a transfer
from production in lakes to large scale production in land-based systems.
Salary: Salary level differs among the production regions but in general the salary cost is low
because labour cost is a minor part of the total cost as much of the production is automated.
Well boat/processing: Transportation costs of live fish, slaughtering, processing and packing are
all heavily dependent on quantity, logistics and automation.
Other operational costs: Other costs include direct and indirect costs, administration, insurance,
biological costs (excluding mortality), etc
*GWE cost in box delivered at the processing plant including mortality
The figures below illustrate the main cost components and their relative importance in the
farming of salmon in the four biggest regions. The cost level is chosen for illustration
purposes.
Norway (NOK) Canada (CAD) Scotland (GBP) Chile (USD)
Feed 12.35 2.26 1.62 2.08
Primary processing 2.62 0.55 0.31 0.41
Smolt 2.28 0.54 0.31 0.48
Salary 1.49 0.56 0.18 0.15
Maintenance 0.89 0.22 0.09 0.19
Well boat 0.98 0.21 0.21 0.28
Depreciation 0.76 0.20 0.13 0.13
Sales & Marketing 0.62 0.02 0.04 0.01
Mortality 0.34 0.04 0.15 0.02
Other 3.34 1.14 0.25 0.77
Total* 25.69 5.73 3.29 4.53
Source: Marine Harvest
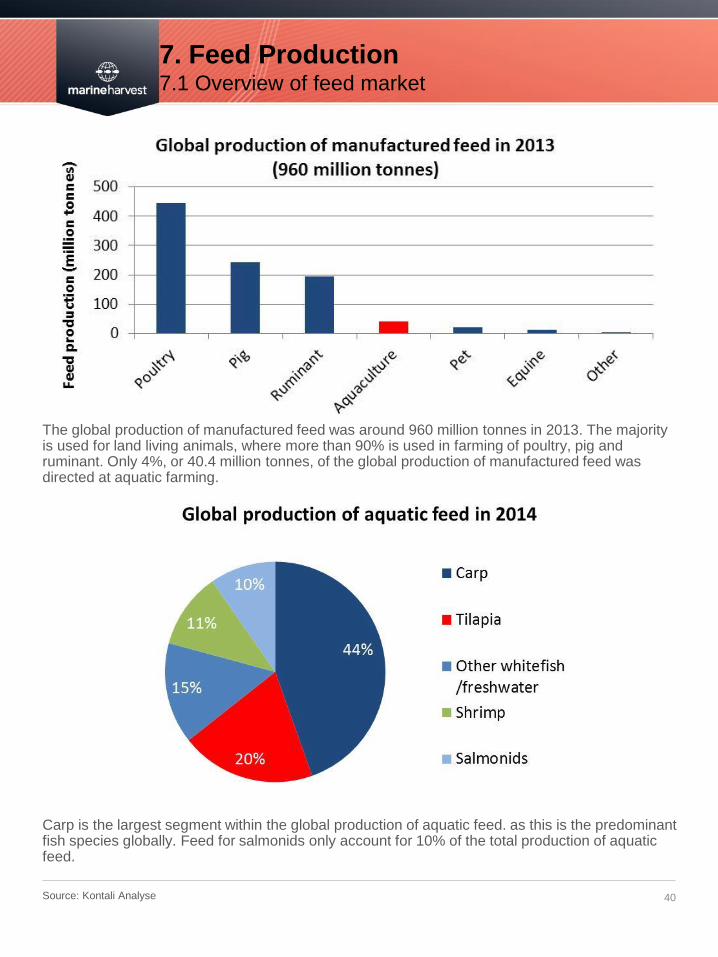
7. Feed Production 7.1 Overview of feed market
40 Source: Kontali Analyse
The global production of manufactured feed was around 960 million tonnes in 2013. The majority is used for land living animals, where more than 90% is used in farming of poultry, pig and ruminant. Only 4%, or 40.4 million tonnes, of the global production of manufactured feed was directed at aquatic farming.
Carp is the largest segment within the global production of aquatic feed. as this is the predominant fish species globally. Feed for salmonids only account for 10% of the total production of aquatic feed.
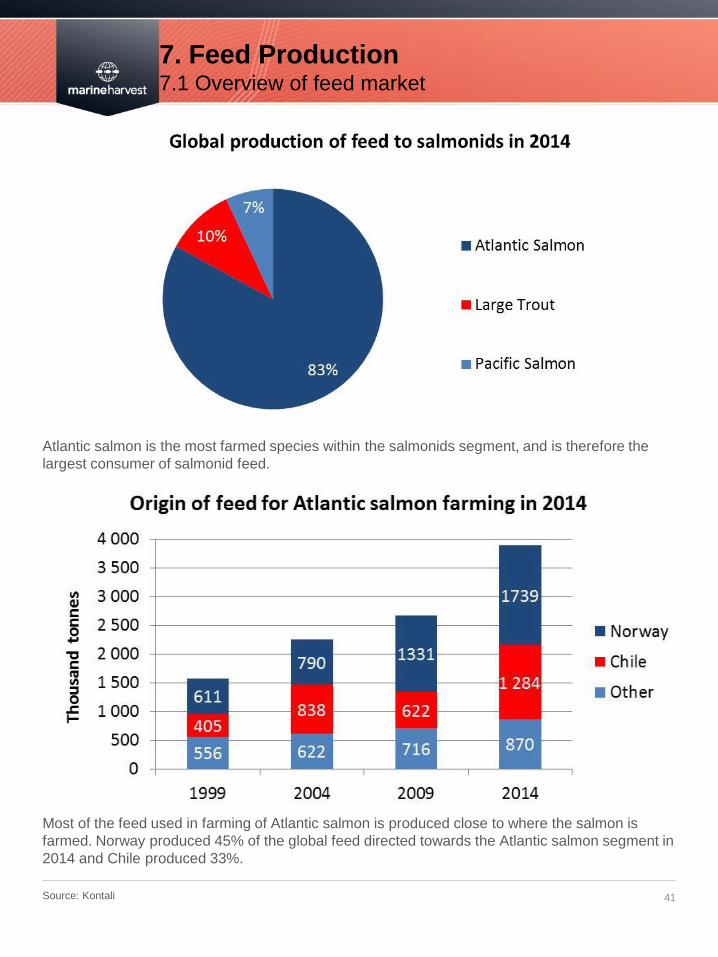
7. Feed Production 7.1 Overview of feed market
41 Source: Kontali
Atlantic salmon is the most farmed species within the salmonids segment, and is therefore the
largest consumer of salmonid feed.
Most of the feed used in farming of Atlantic salmon is produced close to where the salmon is
farmed. Norway produced 45% of the global feed directed towards the Atlantic salmon segment in
2014 and Chile produced 33%.
42 *Relative feeding: (Feed sold or fed during a month) / (Biomass per primo in month)
Source: Kontali
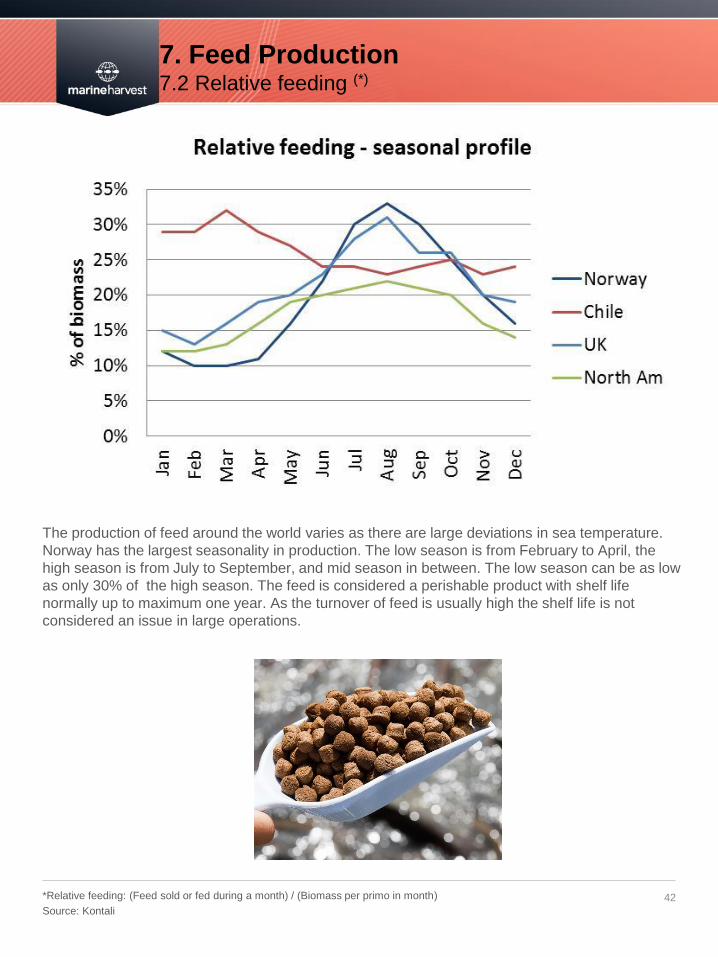
The production of feed around the world varies as there are large deviations in sea temperature.
Norway has the largest seasonality in production. The low season is from February to April, the
high season is from July to September, and mid season in between. The low season can be as low
as only 30% of the high season. The feed is considered a perishable product with shelf life
normally up to maximum one year. As the turnover of feed is usually high the shelf life is not
considered an issue in large operations.
7. Feed Production 7.2 Relative feeding (*)
7. Feed Production 7.3 Salmon feed producers
43 Source: Holtermann (2014), Kontali Analyse
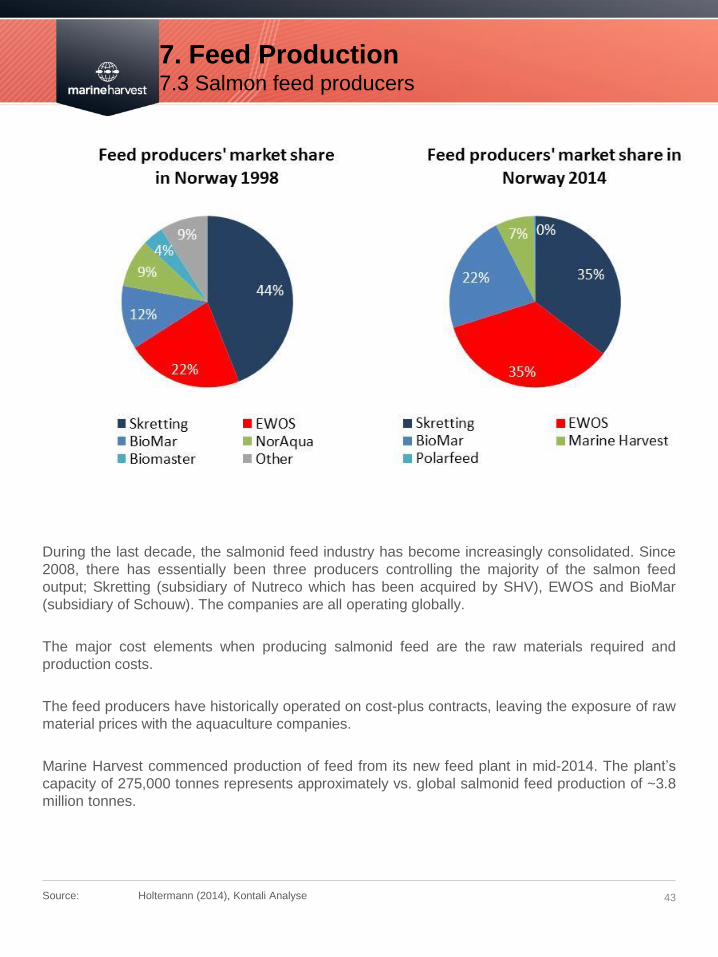
During the last decade, the salmonid feed industry has become increasingly consolidated. Since
2008, there has essentially been three producers controlling the majority of the salmon feed
output; Skretting (subsidiary of Nutreco which has been acquired by SHV), EWOS and BioMar
(subsidiary of Schouw). The companies are all operating globally.
The major cost elements when producing salmonid feed are the raw materials required and
production costs.
The feed producers have historically operated on cost-plus contracts, leaving the exposure of raw
material prices with the aquaculture companies.
Marine Harvest commenced production of feed from its new feed plant in mid-2014. The plant’s
capacity of 275,000 tonnes represents approximately vs. global salmonid feed production of ~3.8
million tonnes.
7. Feed Production 7.4 Salmon feed ingredients
44 Source: Holtermann (2014)
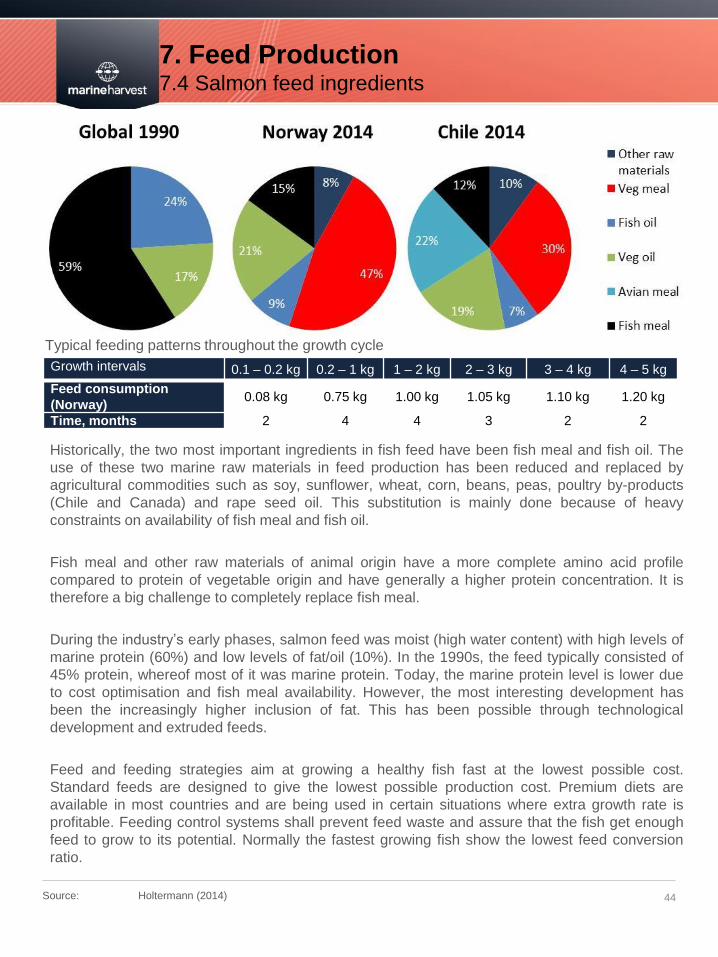
Historically, the two most important ingredients in fish feed have been fish meal and fish oil. The
use of these two marine raw materials in feed production has been reduced and replaced by
agricultural commodities such as soy, sunflower, wheat, corn, beans, peas, poultry by-products
(Chile and Canada) and rape seed oil. This substitution is mainly done because of heavy
constraints on availability of fish meal and fish oil.
Fish meal and other raw materials of animal origin have a more complete amino acid profile
compared to protein of vegetable origin and have generally a higher protein concentration. It is
therefore a big challenge to completely replace fish meal.
During the industry’s early phases, salmon feed was moist (high water content) with high levels of
marine protein (60%) and low levels of fat/oil (10%). In the 1990s, the feed typically consisted of
45% protein, whereof most of it was marine protein. Today, the marine protein level is lower due
to cost optimisation and fish meal availability. However, the most interesting development has
been the increasingly higher inclusion of fat. This has been possible through technological
development and extruded feeds.
Feed and feeding strategies aim at growing a healthy fish fast at the lowest possible cost.
Standard feeds are designed to give the lowest possible production cost. Premium diets are
available in most countries and are being used in certain situations where extra growth rate is
profitable. Feeding control systems shall prevent feed waste and assure that the fish get enough
feed to grow to its potential. Normally the fastest growing fish show the lowest feed conversion
ratio.
Growth intervals 0.1 – 0.2 kg 0.2 – 1 kg 1 – 2 kg 2 – 3 kg 3 – 4 kg 4 – 5 kg
Feed consumption
(Norway) 0.08 kg 0.75 kg 1.00 kg 1.05 kg 1.10 kg 1.20 kg
Time, months 2 4 4 3 2 2
Typical feeding patterns throughout the growth cycle
7. Feed Production 7.5 Feed raw material market
45 Source: Holtermann (2014)
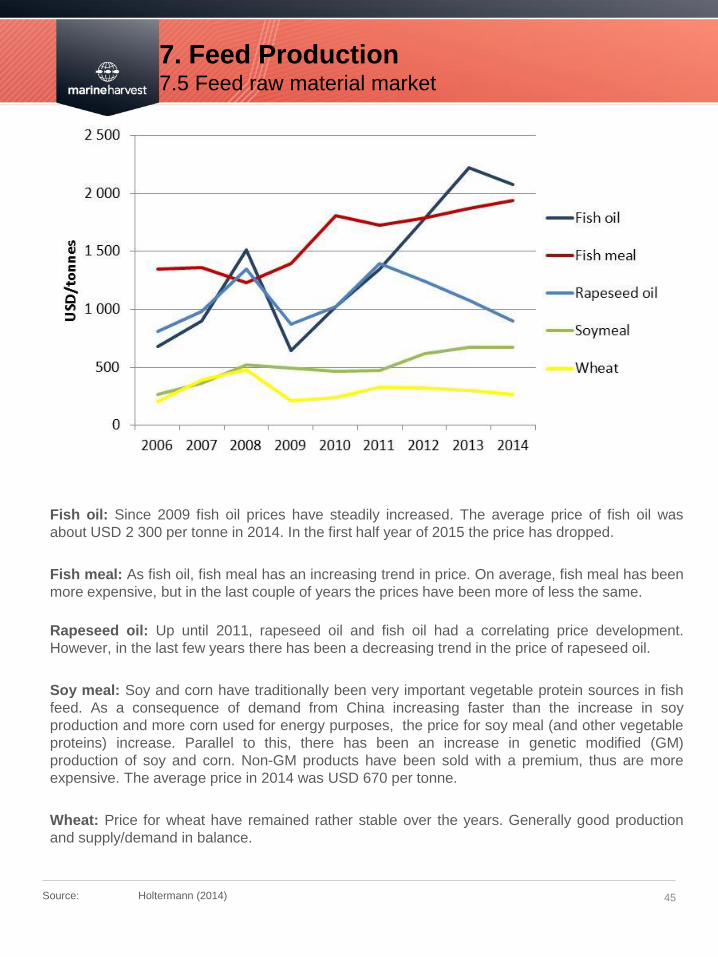
Fish oil: Since 2009 fish oil prices have steadily increased. The average price of fish oil was
about USD 2 300 per tonne in 2014. In the first half year of 2015 the price has dropped.
Fish meal: As fish oil, fish meal has an increasing trend in price. On average, fish meal has been
more expensive, but in the last couple of years the prices have been more of less the same.
Rapeseed oil: Up until 2011, rapeseed oil and fish oil had a correlating price development.
However, in the last few years there has been a decreasing trend in the price of rapeseed oil.
Soy meal: Soy and corn have traditionally been very important vegetable protein sources in fish
feed. As a consequence of demand from China increasing faster than the increase in soy
production and more corn used for energy purposes, the price for soy meal (and other vegetable
proteins) increase. Parallel to this, there has been an increase in genetic modified (GM)
production of soy and corn. Non-GM products have been sold with a premium, thus are more
expensive. The average price in 2014 was USD 670 per tonne.
Wheat: Price for wheat have remained rather stable over the years. Generally good production
and supply/demand in balance.
8. Financial Considerations 8.1 Working capital
46 Source: Marine Harvest
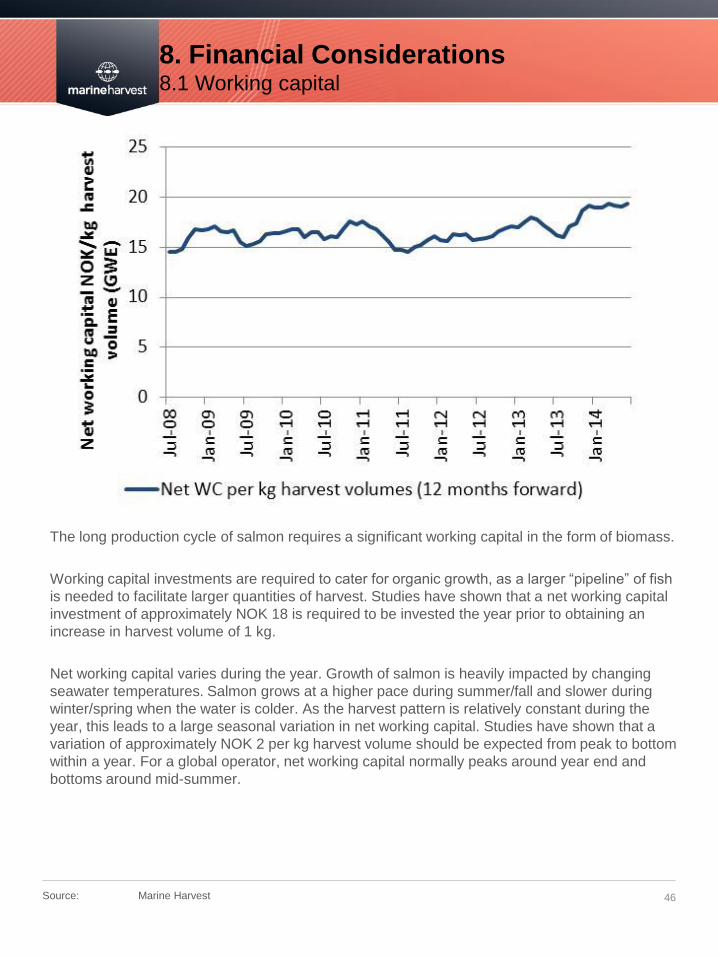
The long production cycle of salmon requires a significant working capital in the form of biomass.
Working capital investments are required to cater for organic growth, as a larger “pipeline” of fish
is needed to facilitate larger quantities of harvest. Studies have shown that a net working capital
investment of approximately NOK 18 is required to be invested the year prior to obtaining an
increase in harvest volume of 1 kg.
Net working capital varies during the year. Growth of salmon is heavily impacted by changing
seawater temperatures. Salmon grows at a higher pace during summer/fall and slower during
winter/spring when the water is colder. As the harvest pattern is relatively constant during the
year, this leads to a large seasonal variation in net working capital. Studies have shown that a
variation of approximately NOK 2 per kg harvest volume should be expected from peak to bottom
within a year. For a global operator, net working capital normally peaks around year end and
bottoms around mid-summer.
8. Financial Considerations 8.1 Working capital
47 Source: Marine Harvest
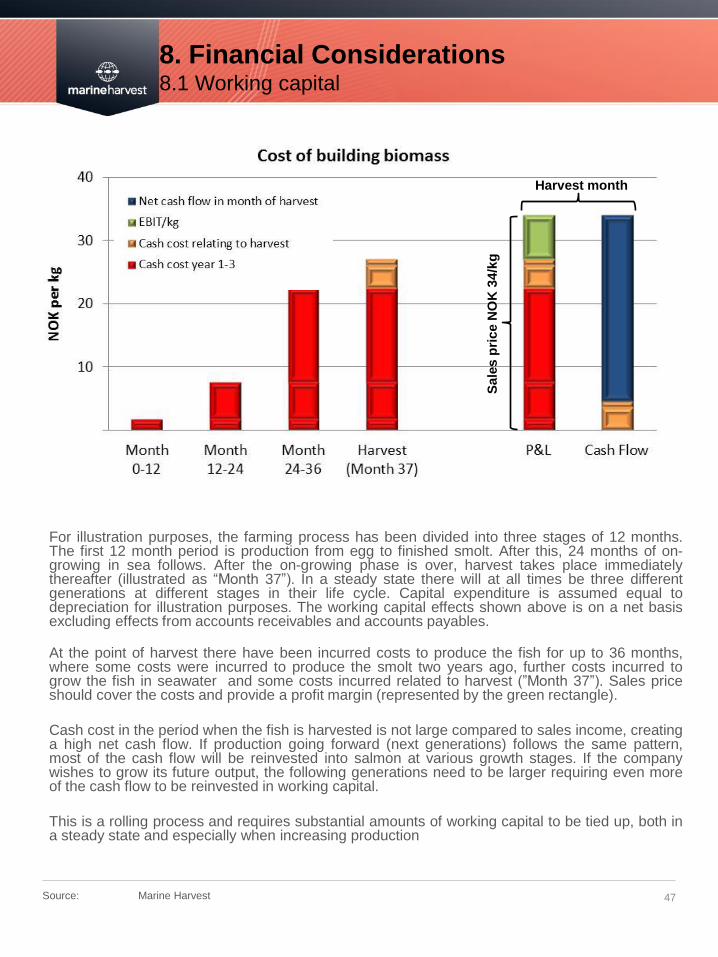
For illustration purposes, the farming process has been divided into three stages of 12 months. The first 12 month period is production from egg to finished smolt. After this, 24 months of on-growing in sea follows. After the on-growing phase is over, harvest takes place immediately thereafter (illustrated as “Month 37”). In a steady state there will at all times be three different generations at different stages in their life cycle. Capital expenditure is assumed equal to depreciation for illustration purposes. The working capital effects shown above is on a net basis excluding effects from accounts receivables and accounts payables.
At the point of harvest there have been incurred costs to produce the fish for up to 36 months, where some costs were incurred to produce the smolt two years ago, further costs incurred to grow the fish in seawater and some costs incurred related to harvest (”Month 37”). Sales price should cover the costs and provide a profit margin (represented by the green rectangle).
Cash cost in the period when the fish is harvested is not large compared to sales income, creating a high net cash flow. If production going forward (next generations) follows the same pattern, most of the cash flow will be reinvested into salmon at various growth stages. If the company wishes to grow its future output, the following generations need to be larger requiring even more of the cash flow to be reinvested in working capital.
This is a rolling process and requires substantial amounts of working capital to be tied up, both in a steady state and especially when increasing production
Harvest month
Sale
s p
rice N
OK
34/k
g
8. Financial Considerations 8.1 Working capital
48 Source: Marine Harvest
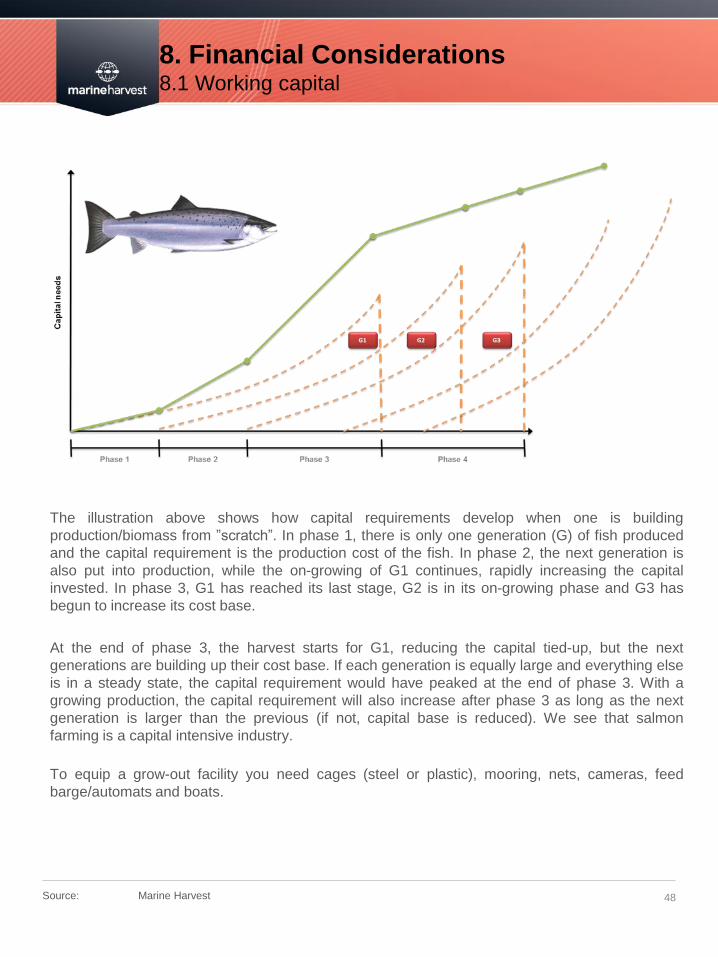
The illustration above shows how capital requirements develop when one is building
production/biomass from ”scratch”. In phase 1, there is only one generation (G) of fish produced
and the capital requirement is the production cost of the fish. In phase 2, the next generation is
also put into production, while the on-growing of G1 continues, rapidly increasing the capital
invested. In phase 3, G1 has reached its last stage, G2 is in its on-growing phase and G3 has
begun to increase its cost base.
At the end of phase 3, the harvest starts for G1, reducing the capital tied-up, but the next
generations are building up their cost base. If each generation is equally large and everything else
is in a steady state, the capital requirement would have peaked at the end of phase 3. With a
growing production, the capital requirement will also increase after phase 3 as long as the next
generation is larger than the previous (if not, capital base is reduced). We see that salmon
farming is a capital intensive industry.
To equip a grow-out facility you need cages (steel or plastic), mooring, nets, cameras, feed
barge/automats and boats.
8. Financial Considerations 8.2 Capital return analysis
49 Sources: Marine Harvest, Kontali Analyse
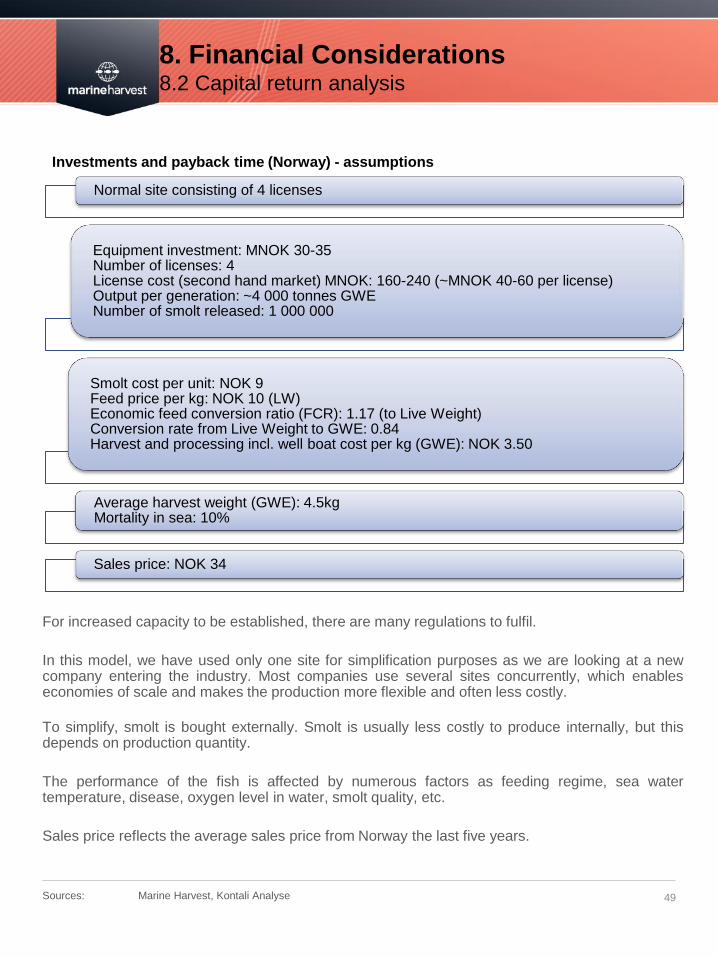
Normal site consisting of 4 licenses
Equipment investment: MNOK 30-35 Number of licenses: 4 License cost (second hand market) MNOK: 160-240 (~MNOK 40-60 per license) Output per generation: ~4 000 tonnes GWE Number of smolt released: 1 000 000
Smolt cost per unit: NOK 9 Feed price per kg: NOK 10 (LW) Economic feed conversion ratio (FCR): 1.17 (to Live Weight) Conversion rate from Live Weight to GWE: 0.84 Harvest and processing incl. well boat cost per kg (GWE): NOK 3.50
Average harvest weight (GWE): 4.5kg Mortality in sea: 10%
Sales price: NOK 34
For increased capacity to be established, there are many regulations to fulfil.
In this model, we have used only one site for simplification purposes as we are looking at a new company entering the industry. Most companies use several sites concurrently, which enables economies of scale and makes the production more flexible and often less costly.
To simplify, smolt is bought externally. Smolt is usually less costly to produce internally, but this depends on production quantity.
The performance of the fish is affected by numerous factors as feeding regime, sea water temperature, disease, oxygen level in water, smolt quality, etc.
Sales price reflects the average sales price from Norway the last five years.
Investments and payback time (Norway) - assumptions
8. Financial Considerations 8.2 Capital return analysis
50 Source: Marine Harvest
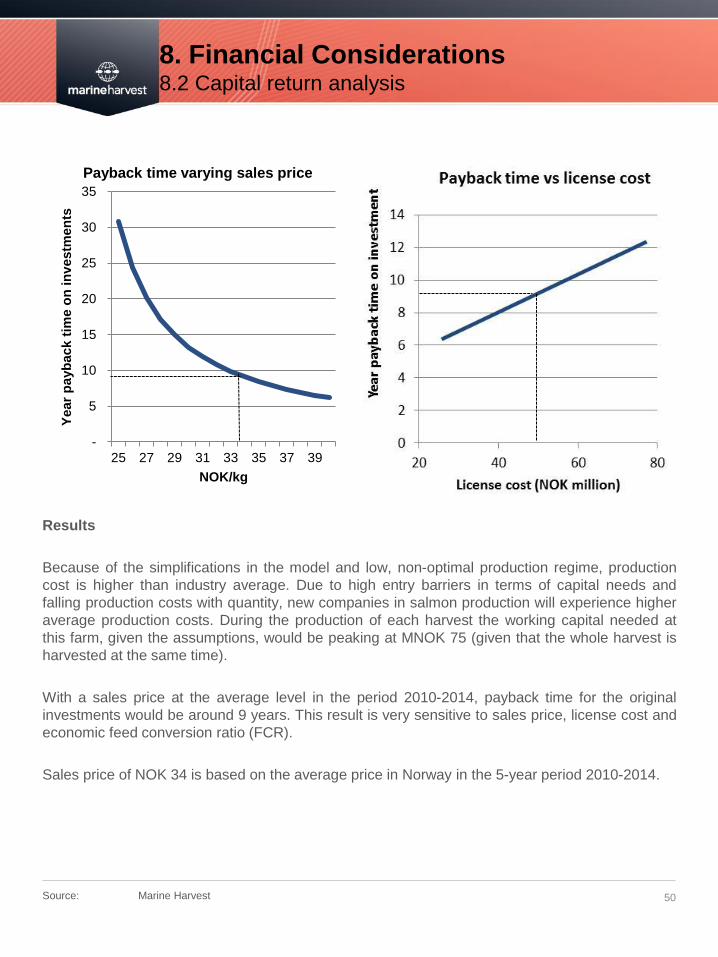
Results
Because of the simplifications in the model and low, non-optimal production regime, production
cost is higher than industry average. Due to high entry barriers in terms of capital needs and
falling production costs with quantity, new companies in salmon production will experience higher
average production costs. During the production of each harvest the working capital needed at
this farm, given the assumptions, would be peaking at MNOK 75 (given that the whole harvest is
harvested at the same time).
With a sales price at the average level in the period 2010-2014, payback time for the original
investments would be around 9 years. This result is very sensitive to sales price, license cost and
economic feed conversion ratio (FCR).
Sales price of NOK 34 is based on the average price in Norway in the 5-year period 2010-2014.
-
5
10
15
20
25
30
35
25 27 29 31 33 35 37 39
Year
payb
ack t
ime o
n in
vestm
en
ts
NOK/kg
Payback time varying sales price
51 Source: Kontali
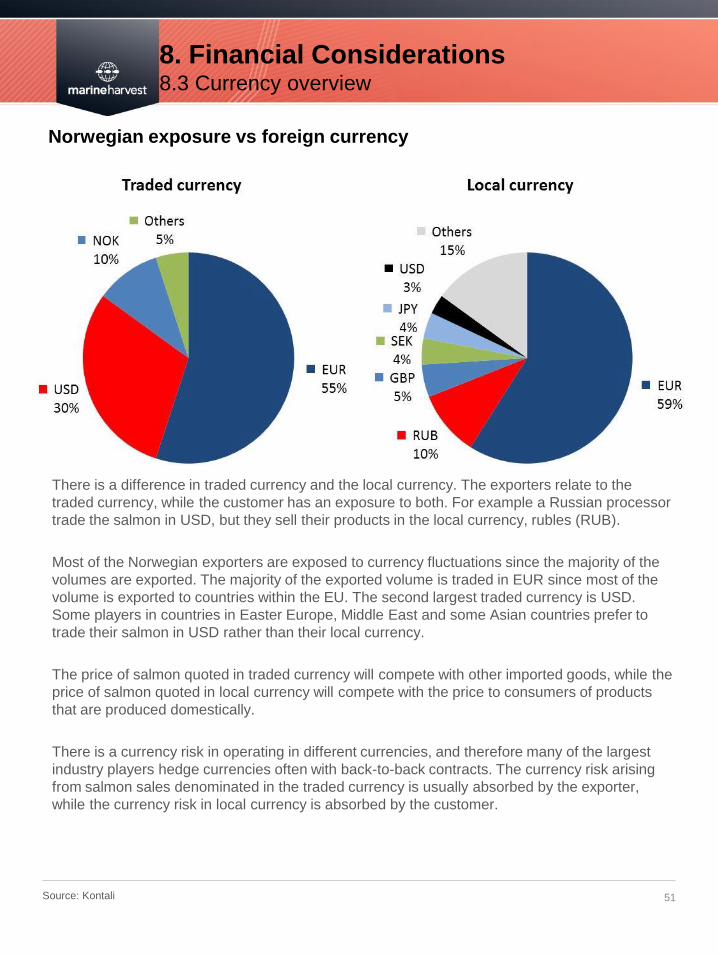
There is a difference in traded currency and the local currency. The exporters relate to the
traded currency, while the customer has an exposure to both. For example a Russian processor
trade the salmon in USD, but they sell their products in the local currency, rubles (RUB).
Most of the Norwegian exporters are exposed to currency fluctuations since the majority of the
volumes are exported. The majority of the exported volume is traded in EUR since most of the
volume is exported to countries within the EU. The second largest traded currency is USD.
Some players in countries in Easter Europe, Middle East and some Asian countries prefer to
trade their salmon in USD rather than their local currency.
The price of salmon quoted in traded currency will compete with other imported goods, while the
price of salmon quoted in local currency will compete with the price to consumers of products
that are produced domestically.
There is a currency risk in operating in different currencies, and therefore many of the largest
industry players hedge currencies often with back-to-back contracts. The currency risk arising
from salmon sales denominated in the traded currency is usually absorbed by the exporter,
while the currency risk in local currency is absorbed by the customer.
8. Financial Considerations 8.3 Currency overview
Norwegian exposure vs foreign currency
8. Financial Considerations 8.3 Currency overview
52 Source: Kontali
Note: (1) The table shows exposure against local currency weighted against total exports
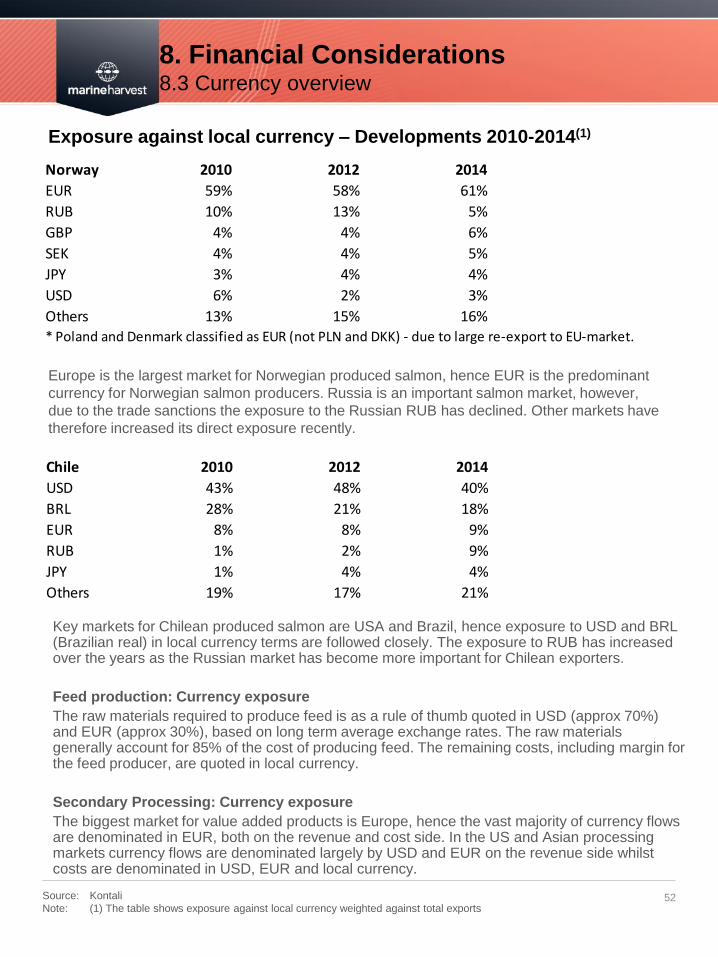
Europe is the largest market for Norwegian produced salmon, hence EUR is the predominant
currency for Norwegian salmon producers. Russia is an important salmon market, however,
due to the trade sanctions the exposure to the Russian RUB has declined. Other markets have
therefore increased its direct exposure recently.
Key markets for Chilean produced salmon are USA and Brazil, hence exposure to USD and BRL (Brazilian real) in local currency terms are followed closely. The exposure to RUB has increased over the years as the Russian market has become more important for Chilean exporters.
Feed production: Currency exposure
The raw materials required to produce feed is as a rule of thumb quoted in USD (approx 70%) and EUR (approx 30%), based on long term average exchange rates. The raw materials generally account for 85% of the cost of producing feed. The remaining costs, including margin for the feed producer, are quoted in local currency.
Secondary Processing: Currency exposure
The biggest market for value added products is Europe, hence the vast majority of currency flows are denominated in EUR, both on the revenue and cost side. In the US and Asian processing markets currency flows are denominated largely by USD and EUR on the revenue side whilst costs are denominated in USD, EUR and local currency.
Exposure against local currency – Developments 2010-2014(1)
Norway 2010 2012 2014
EUR 59% 58% 61%
RUB 10% 13% 5%
GBP 4% 4% 6%
SEK 4% 4% 5%
JPY 3% 4% 4%
USD 6% 2% 3%
Others 13% 15% 16%* Poland and Denmark classified as EUR (not PLN and DKK) - due to large re-export to EU-market.
Chile 2010 2012 2014
USD 43% 48% 40%
BRL 28% 21% 18%
EUR 8% 8% 9%
RUB 1% 2% 9%
JPY 1% 4% 4%
Others 19% 17% 21%
8. Financial Considerations 8.4 Price, cost and EBIT development in Norway
53 Source: Kontali Analyse
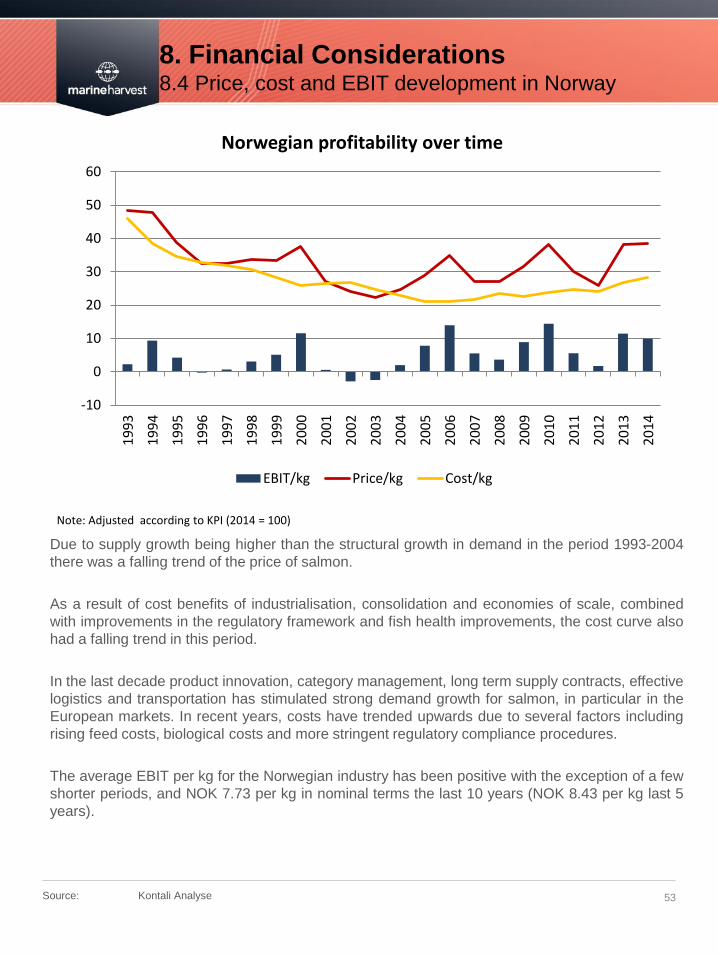
Due to supply growth being higher than the structural growth in demand in the period 1993-2004
there was a falling trend of the price of salmon.
As a result of cost benefits of industrialisation, consolidation and economies of scale, combined
with improvements in the regulatory framework and fish health improvements, the cost curve also
had a falling trend in this period.
In the last decade product innovation, category management, long term supply contracts, effective
logistics and transportation has stimulated strong demand growth for salmon, in particular in the
European markets. In recent years, costs have trended upwards due to several factors including
rising feed costs, biological costs and more stringent regulatory compliance procedures.
The average EBIT per kg for the Norwegian industry has been positive with the exception of a few
shorter periods, and NOK 7.73 per kg in nominal terms the last 10 years (NOK 8.43 per kg last 5
years).
-10
0
10
20
30
40
50
60
19
93
19
94
19
95
19
96
19
97
19
98
19
99
20
00
20
01
20
02
20
03
20
04
20
05
20
06
20
07
20
08
20
09
20
10
20
11
20
12
20
13
20
14
Norwegian profitability over time
EBIT/kg Price/kg Cost/kg
Note: Adjusted according to KPI (2014 = 100)
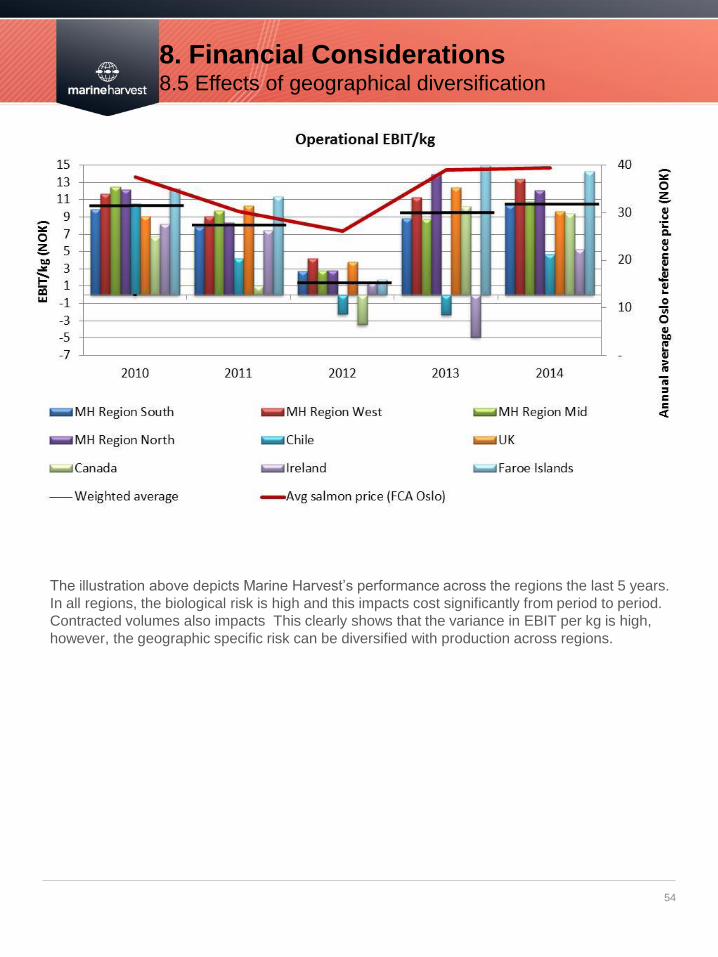
8. Financial Considerations 8.5 Effects of geographical diversification
54
The illustration above depicts Marine Harvest’s performance across the regions the last 5 years.
In all regions, the biological risk is high and this impacts cost significantly from period to period.
Contracted volumes also impacts This clearly shows that the variance in EBIT per kg is high,
however, the geographic specific risk can be diversified with production across regions.
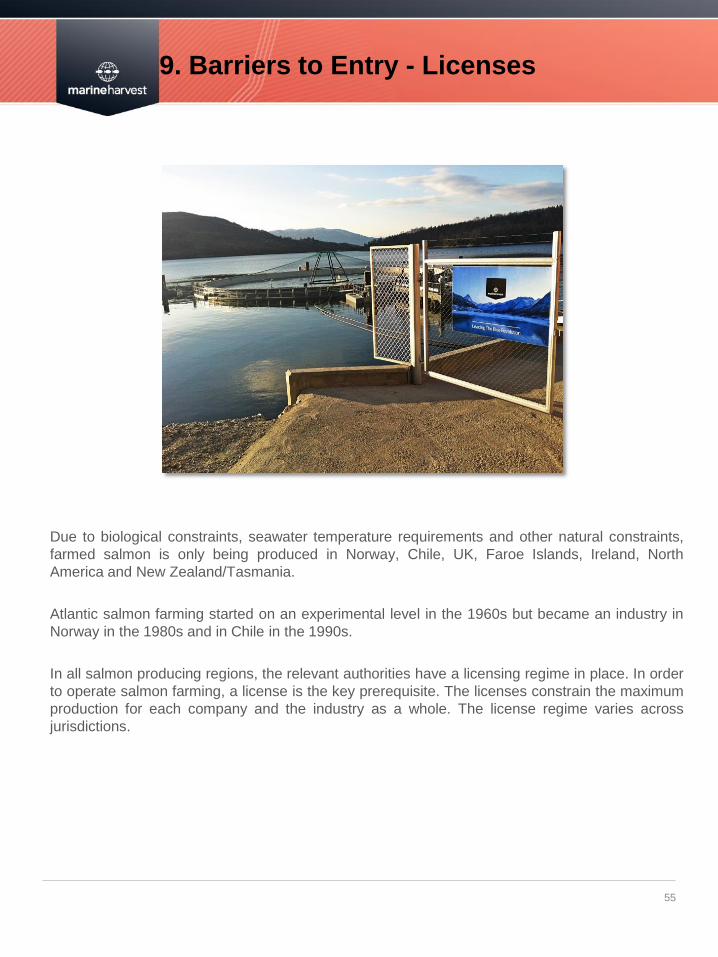
9. Barriers to Entry - Licenses
55
Due to biological constraints, seawater temperature requirements and other natural constraints,
farmed salmon is only being produced in Norway, Chile, UK, Faroe Islands, Ireland, North
America and New Zealand/Tasmania.
Atlantic salmon farming started on an experimental level in the 1960s but became an industry in
Norway in the 1980s and in Chile in the 1990s.
In all salmon producing regions, the relevant authorities have a licensing regime in place. In order
to operate salmon farming, a license is the key prerequisite. The licenses constrain the maximum
production for each company and the industry as a whole. The license regime varies across
jurisdictions.
9. Barriers to Entry – Licenses 9.1 Regulations of fish farming in Norway
56
License and location
Fish farming companies in Norway are subject to a large number of regulations. The Aquaculture
Act (17 June 2005) and the Food Safety Act (19 December 2003) are the two most important
laws, and there are detailed provisions set out in several regulations emanated from one of the
two acts.
In Norway, a salmon farming license allows farming salmon either in freshwater (smolt/fingeling
production) or in the sea. The number of licenses for Atlantic salmon and trout in sea water was
limited to 974 licenses in 2014. Such limitations does not apply for licenses in fresh water (smolt
production), which can be applied for continuously. Farming licenses in sea water can be
connected to up to four farming sites (six sites is allowed when all sites are connected with the
same licenses). This increases the capacity and efficiency of the sites.
New licenses in sea are awarded by the Norwegian Ministry of Trade, Industry and Fisheries and
are administered by the Directorate of Fisheries. Licenses can be sold and pledged, with legal
security in terms of registration in the Aquaculture Register. Since 1982, new licenses have been
awarded only in limited years. In 2013, Norwegian authorities announced its plan to issue 45 new
“green” licenses. These were awarded in 2014 and Marine Harvest Norway AS was granted one
license. Licenses last in perpetuity, but may be withdrawn in case of material breach of conditions
set out in the license or the aquaculture or environmental legislation.
The production limitations in Norway are regulated as "maximum allowed biomass" (MAB), being
the defined maximum volume of fish a company can hold at sea at all times. In general, one
license is currently set a MAB, of 780 tons (945 tons in the counties of Troms and Finnmark). The
sum of all license-MAB in each region is the farming company's total allowed biomass in this
region. In addition, each production site has a MAB and the total amount of fish at this each site
will have to be less than this limitation. Generally, sites have between 2,340 and 4.680 tons
allowed MAB.
The Norwegian Parliament has recently discussed and voted on a new white paper on
aquaculture. The intention of the white paper is to ensure a sustainable growth of the industry.
Future growth will be granted based on sustainable indicators, currently sea lice. In addition, the
coast will be divided into a number of regions. Growth will be determined based on a traffic light
signal based on certain criteria being satisfied. If these criteria are satisfied the region may grow
by a maximum of 6% per every two years. However on-going discussions will determine if such
criteria should be site-specific, and not only regional. If the criteria are not satisfied the region may
not grow (status quo) and if they are breached production should be reduced.
The Parliament has asked for more information before they conclude regarding the modelling of
both the indicator and new regions. This process is estimated to be finalized in 2016, and the first
growth will probably be granted in 2017. Until then the current regulations will apply.
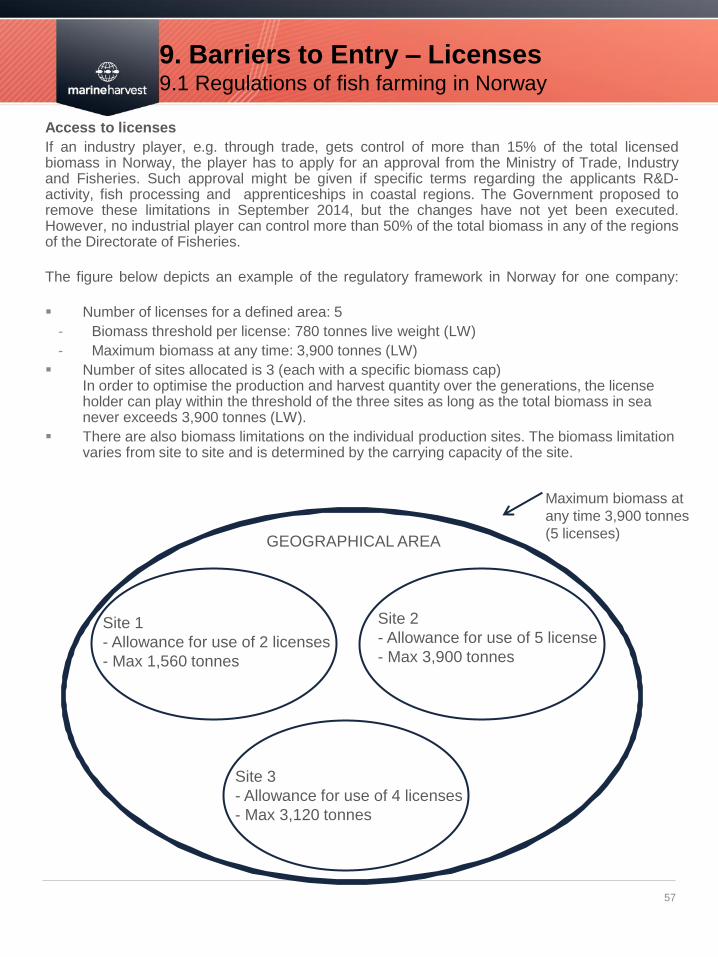
9. Barriers to Entry – Licenses 9.1 Regulations of fish farming in Norway
57
Access to licenses
If an industry player, e.g. through trade, gets control of more than 15% of the total licensed biomass in Norway, the player has to apply for an approval from the Ministry of Trade, Industry and Fisheries. Such approval might be given if specific terms regarding the applicants R&D-activity, fish processing and apprenticeships in coastal regions. The Government proposed to remove these limitations in September 2014, but the changes have not yet been executed. However, no industrial player can control more than 50% of the total biomass in any of the regions of the Directorate of Fisheries.
The figure below depicts an example of the regulatory framework in Norway for one company:
Number of licenses for a defined area: 5
- Biomass threshold per license: 780 tonnes live weight (LW)
- Maximum biomass at any time: 3,900 tonnes (LW)
Number of sites allocated is 3 (each with a specific biomass cap) In order to optimise the production and harvest quantity over the generations, the license holder can play within the threshold of the three sites as long as the total biomass in sea never exceeds 3,900 tonnes (LW).
There are also biomass limitations on the individual production sites. The biomass limitation varies from site to site and is determined by the carrying capacity of the site.
GEOGRAPHICAL AREA
Site 1
- Allowance for use of 2 licenses
- Max 1,560 tonnes
Maximum biomass at
any time 3,900 tonnes
(5 licenses)
Site 2
- Allowance for use of 5 license
- Max 3,900 tonnes
Site 3
- Allowance for use of 4 licenses
- Max 3,120 tonnes
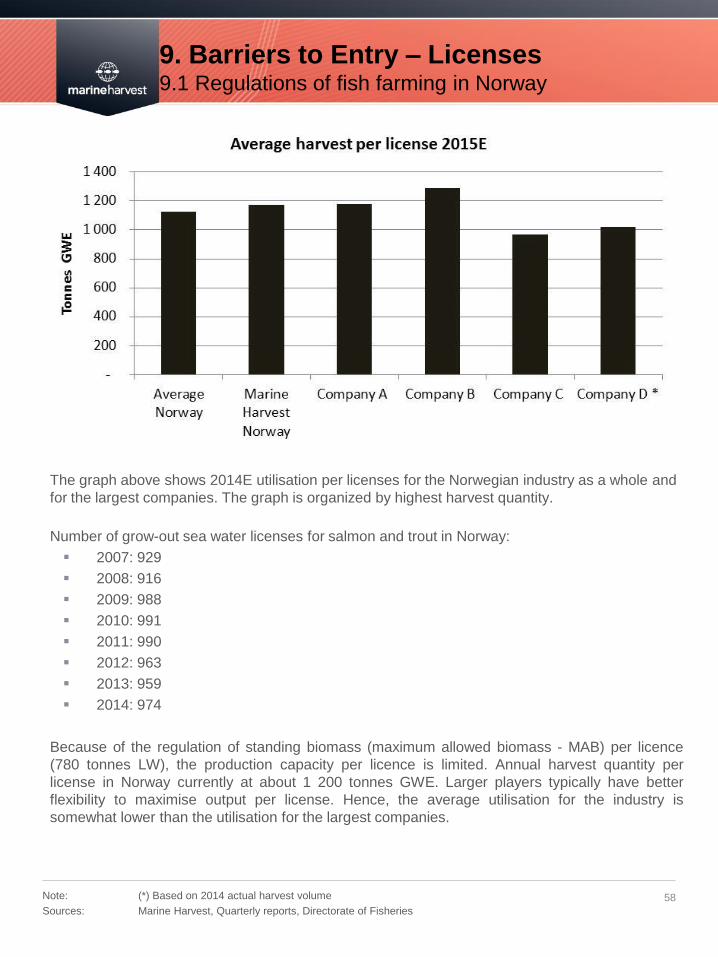
9. Barriers to Entry – Licenses 9.1 Regulations of fish farming in Norway
58 Note: (*) Based on 2014 actual harvest volume
Sources: Marine Harvest, Quarterly reports, Directorate of Fisheries
The graph above shows 2014E utilisation per licenses for the Norwegian industry as a whole and
for the largest companies. The graph is organized by highest harvest quantity.
Number of grow-out sea water licenses for salmon and trout in Norway:
2007: 929
2008: 916
2009: 988
2010: 991
2011: 990
2012: 963
2013: 959
2014: 974
Because of the regulation of standing biomass (maximum allowed biomass - MAB) per licence
(780 tonnes LW), the production capacity per licence is limited. Annual harvest quantity per
license in Norway currently at about 1 200 tonnes GWE. Larger players typically have better
flexibility to maximise output per license. Hence, the average utilisation for the industry is
somewhat lower than the utilisation for the largest companies.
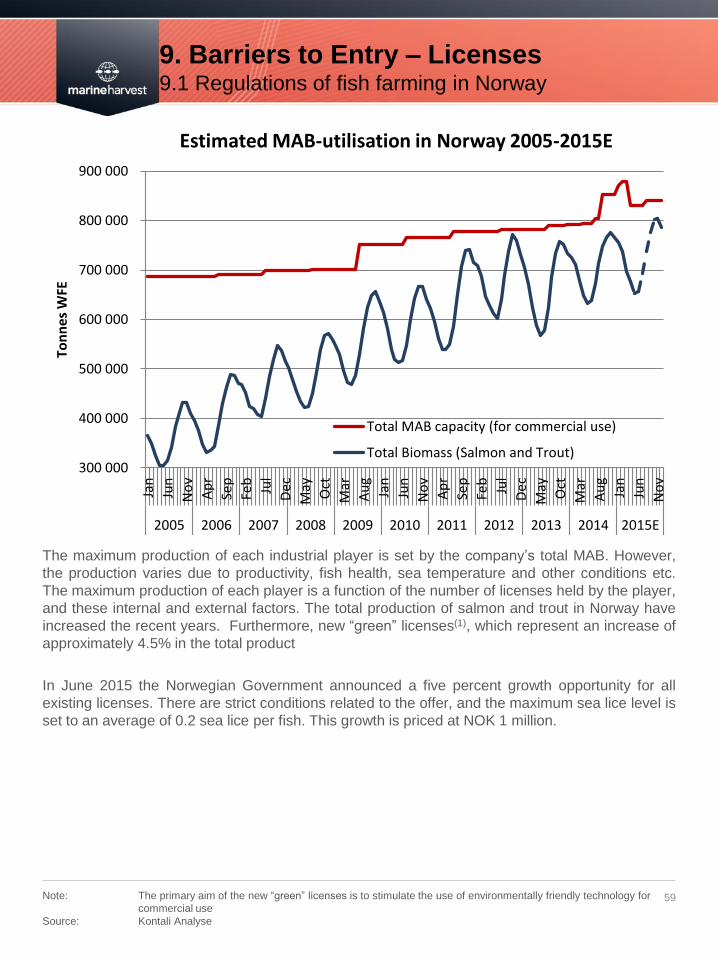
9. Barriers to Entry – Licenses 9.1 Regulations of fish farming in Norway
59 Note: The primary aim of the new “green” licenses is to stimulate the use of environmentally friendly technology for
commercial use
Source: Kontali Analyse
The maximum production of each industrial player is set by the company’s total MAB. However,
the production varies due to productivity, fish health, sea temperature and other conditions etc.
The maximum production of each player is a function of the number of licenses held by the player,
and these internal and external factors. The total production of salmon and trout in Norway have
increased the recent years. Furthermore, new “green” licenses(1), which represent an increase of
approximately 4.5% in the total product
In June 2015 the Norwegian Government announced a five percent growth opportunity for all
existing licenses. There are strict conditions related to the offer, and the maximum sea lice level is
set to an average of 0.2 sea lice per fish. This growth is priced at NOK 1 million.
300 000
400 000
500 000
600 000
700 000
800 000
900 000
Jan
Jun
No
v
Ap
r
Sep
Feb
Jul
De
c
May Oct
Mar
Au
g
Jan
Jun
No
v
Ap
r
Sep
Feb
Jul
De
c
May Oct
Mar
Au
g
Jan
Jun
No
v
2005 2006 2007 2008 2009 2010 2011 2012 2013 2014 2015E
Ton
ne
s W
FE
Estimated MAB-utilisation in Norway 2005-2015E
Total MAB capacity (for commercial use)
Total Biomass (Salmon and Trout)
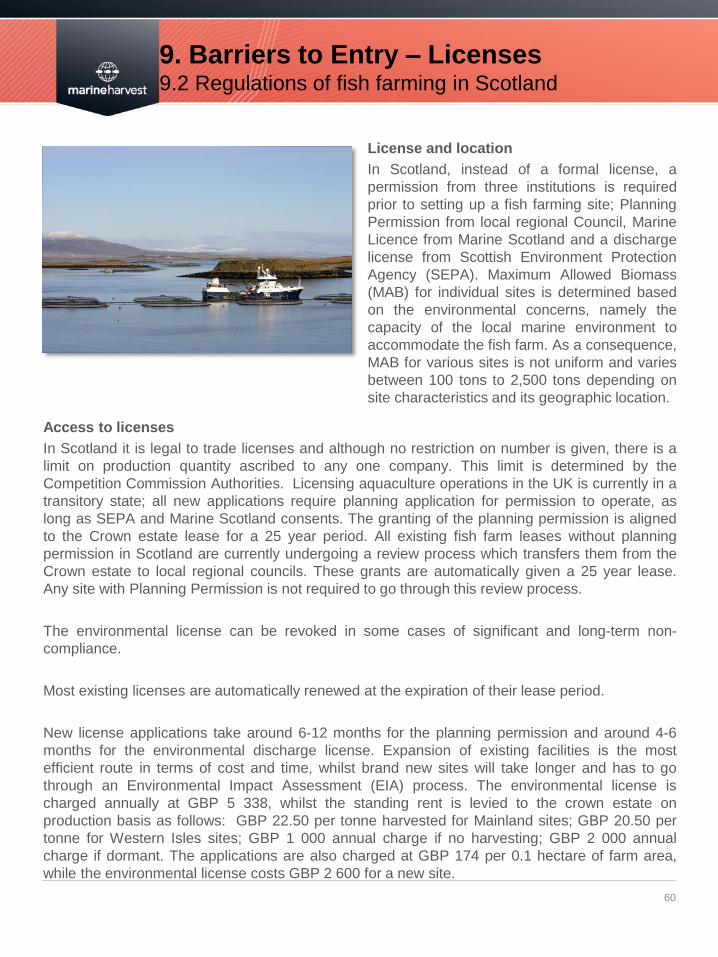
9. Barriers to Entry – Licenses 9.2 Regulations of fish farming in Scotland
60
Access to licenses
In Scotland it is legal to trade licenses and although no restriction on number is given, there is a
limit on production quantity ascribed to any one company. This limit is determined by the
Competition Commission Authorities. Licensing aquaculture operations in the UK is currently in a
transitory state; all new applications require planning application for permission to operate, as
long as SEPA and Marine Scotland consents. The granting of the planning permission is aligned
to the Crown estate lease for a 25 year period. All existing fish farm leases without planning
permission in Scotland are currently undergoing a review process which transfers them from the
Crown estate to local regional councils. These grants are automatically given a 25 year lease.
Any site with Planning Permission is not required to go through this review process.
The environmental license can be revoked in some cases of significant and long-term non-
compliance.
Most existing licenses are automatically renewed at the expiration of their lease period.
New license applications take around 6-12 months for the planning permission and around 4-6
months for the environmental discharge license. Expansion of existing facilities is the most
efficient route in terms of cost and time, whilst brand new sites will take longer and has to go
through an Environmental Impact Assessment (EIA) process. The environmental license is
charged annually at GBP 5 338, whilst the standing rent is levied to the crown estate on
production basis as follows: GBP 22.50 per tonne harvested for Mainland sites; GBP 20.50 per
tonne for Western Isles sites; GBP 1 000 annual charge if no harvesting; GBP 2 000 annual
charge if dormant. The applications are also charged at GBP 174 per 0.1 hectare of farm area,
while the environmental license costs GBP 2 600 for a new site.
License and location
In Scotland, instead of a formal license, a
permission from three institutions is required
prior to setting up a fish farming site; Planning
Permission from local regional Council, Marine
Licence from Marine Scotland and a discharge
license from Scottish Environment Protection
Agency (SEPA). Maximum Allowed Biomass
(MAB) for individual sites is determined based
on the environmental concerns, namely the
capacity of the local marine environment to
accommodate the fish farm. As a consequence,
MAB for various sites is not uniform and varies
between 100 tons to 2,500 tons depending on
site characteristics and its geographic location.
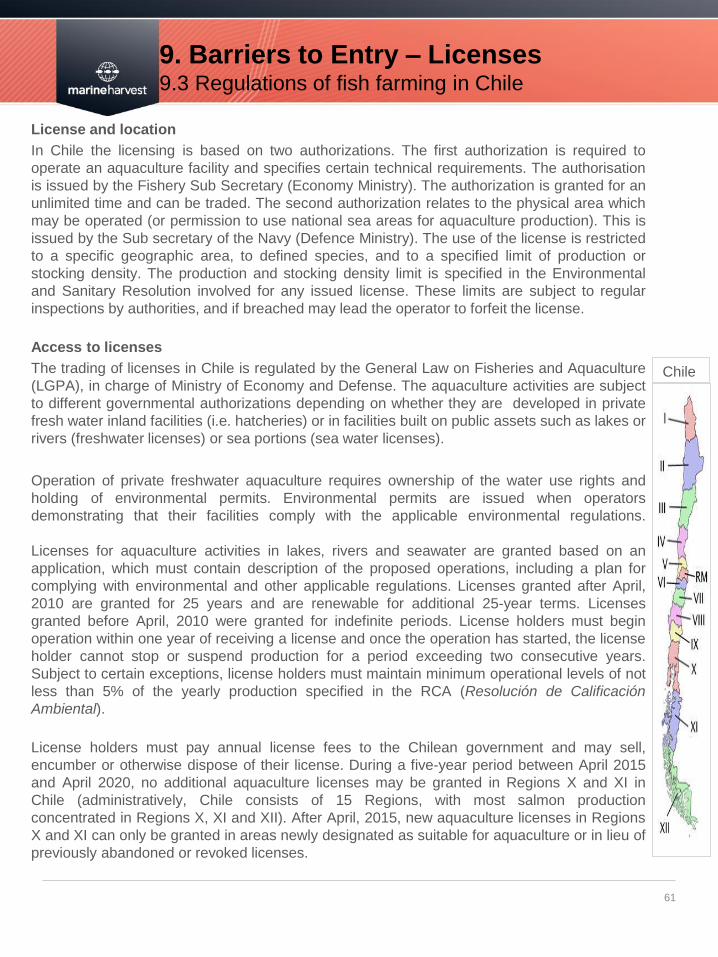
9. Barriers to Entry – Licenses 9.3 Regulations of fish farming in Chile
61
License and location
In Chile the licensing is based on two authorizations. The first authorization is required to
operate an aquaculture facility and specifies certain technical requirements. The authorisation
is issued by the Fishery Sub Secretary (Economy Ministry). The authorization is granted for an
unlimited time and can be traded. The second authorization relates to the physical area which
may be operated (or permission to use national sea areas for aquaculture production). This is
issued by the Sub secretary of the Navy (Defence Ministry). The use of the license is restricted
to a specific geographic area, to defined species, and to a specified limit of production or
stocking density. The production and stocking density limit is specified in the Environmental
and Sanitary Resolution involved for any issued license. These limits are subject to regular
inspections by authorities, and if breached may lead the operator to forfeit the license.
Access to licenses
The trading of licenses in Chile is regulated by the General Law on Fisheries and Aquaculture
(LGPA), in charge of Ministry of Economy and Defense. The aquaculture activities are subject
to different governmental authorizations depending on whether they are developed in private
fresh water inland facilities (i.e. hatcheries) or in facilities built on public assets such as lakes or
rivers (freshwater licenses) or sea portions (sea water licenses).
Operation of private freshwater aquaculture requires ownership of the water use rights and
holding of environmental permits. Environmental permits are issued when operators
demonstrating that their facilities comply with the applicable environmental regulations.
Licenses for aquaculture activities in lakes, rivers and seawater are granted based on an
application, which must contain description of the proposed operations, including a plan for
complying with environmental and other applicable regulations. Licenses granted after April,
2010 are granted for 25 years and are renewable for additional 25-year terms. Licenses
granted before April, 2010 were granted for indefinite periods. License holders must begin
operation within one year of receiving a license and once the operation has started, the license
holder cannot stop or suspend production for a period exceeding two consecutive years.
Subject to certain exceptions, license holders must maintain minimum operational levels of not
less than 5% of the yearly production specified in the RCA (Resolución de Calificación
Ambiental).
License holders must pay annual license fees to the Chilean government and may sell,
encumber or otherwise dispose of their license. During a five-year period between April 2015
and April 2020, no additional aquaculture licenses may be granted in Regions X and XI in
Chile (administratively, Chile consists of 15 Regions, with most salmon production
concentrated in Regions X, XI and XII). After April, 2015, new aquaculture licenses in Regions
X and XI can only be granted in areas newly designated as suitable for aquaculture or in lieu of
previously abandoned or revoked licenses.
Chile
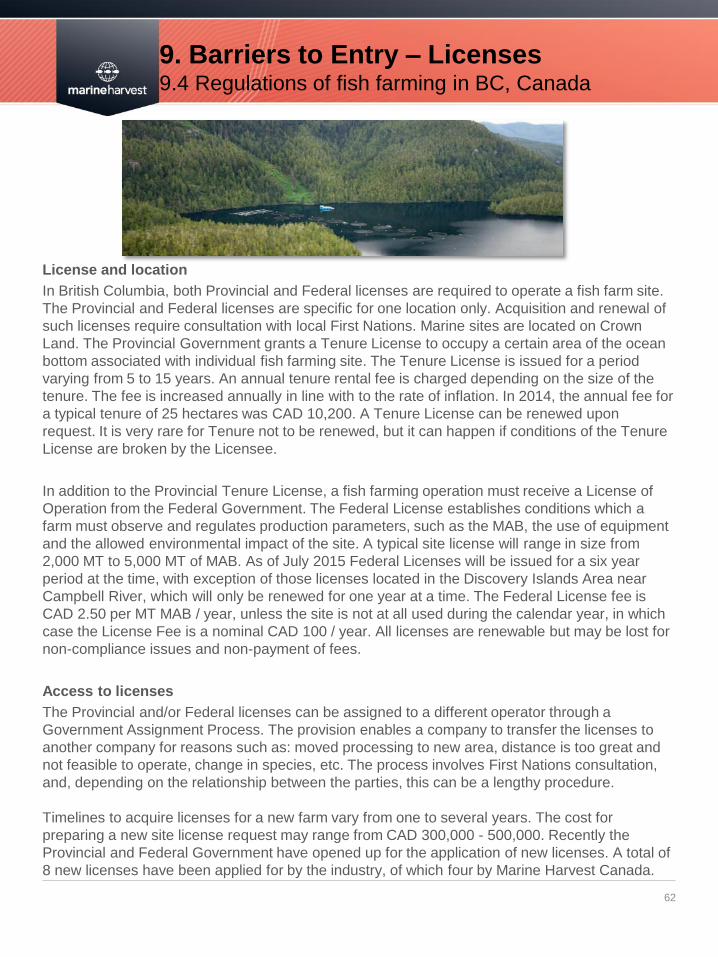
9. Barriers to Entry – Licenses 9.4 Regulations of fish farming in BC, Canada
62
License and location
In British Columbia, both Provincial and Federal licenses are required to operate a fish farm site.
The Provincial and Federal licenses are specific for one location only. Acquisition and renewal of
such licenses require consultation with local First Nations. Marine sites are located on Crown
Land. The Provincial Government grants a Tenure License to occupy a certain area of the ocean
bottom associated with individual fish farming site. The Tenure License is issued for a period
varying from 5 to 15 years. An annual tenure rental fee is charged depending on the size of the
tenure. The fee is increased annually in line with to the rate of inflation. In 2014, the annual fee for
a typical tenure of 25 hectares was CAD 10,200. A Tenure License can be renewed upon
request. It is very rare for Tenure not to be renewed, but it can happen if conditions of the Tenure
License are broken by the Licensee.
In addition to the Provincial Tenure License, a fish farming operation must receive a License of
Operation from the Federal Government. The Federal License establishes conditions which a
farm must observe and regulates production parameters, such as the MAB, the use of equipment
and the allowed environmental impact of the site. A typical site license will range in size from
2,000 MT to 5,000 MT of MAB. As of July 2015 Federal Licenses will be issued for a six year
period at the time, with exception of those licenses located in the Discovery Islands Area near
Campbell River, which will only be renewed for one year at a time. The Federal License fee is
CAD 2.50 per MT MAB / year, unless the site is not at all used during the calendar year, in which
case the License Fee is a nominal CAD 100 / year. All licenses are renewable but may be lost for
non-compliance issues and non-payment of fees.
Access to licenses
The Provincial and/or Federal licenses can be assigned to a different operator through a
Government Assignment Process. The provision enables a company to transfer the licenses to
another company for reasons such as: moved processing to new area, distance is too great and
not feasible to operate, change in species, etc. The process involves First Nations consultation,
and, depending on the relationship between the parties, this can be a lengthy procedure.
Timelines to acquire licenses for a new farm vary from one to several years. The cost for
preparing a new site license request may range from CAD 300,000 - 500,000. Recently the
Provincial and Federal Government have opened up for the application of new licenses. A total of
8 new licenses have been applied for by the industry, of which four by Marine Harvest Canada.
10. Risk Factors 10.1 Salmon disease prevention and treatment
63
Maximising survival and maintaining healthy fish stocks are primarily achieved through good
husbandry and health management practices and policies. Such practices, in addition, reduce
exposure to pathogens and the risk of health challenges. The success of good health
management practices have been demonstrated on many occasions and have contributed to an
overall improvement in the survival of farmed salmonids.
Fish health management plans, veterinary health plans, bio security plans, risk mitigation plans,
contingency plans, disinfection procedures, surveillance schemes as well as coordinated and
synchronised zone/area management approaches, all support healthy stocks with emphasis on
disease prevention.
Prevention of many diseases is achieved through vaccination at an early stage and during
freshwater. Vaccines are widely used commercially to reduce the risk of health challenges. With
the introduction of vaccines a considerable number of bacterial health challenges have been
effectively controlled, with the additional benefit that the quantity of medicine prescribed in the
industry has been reduced.
In some instances however medicinal treatment is required to maximise survival and even the best
managed farms may use medicines from time to time. For several viral diseases, no effective
vaccines are currently available.
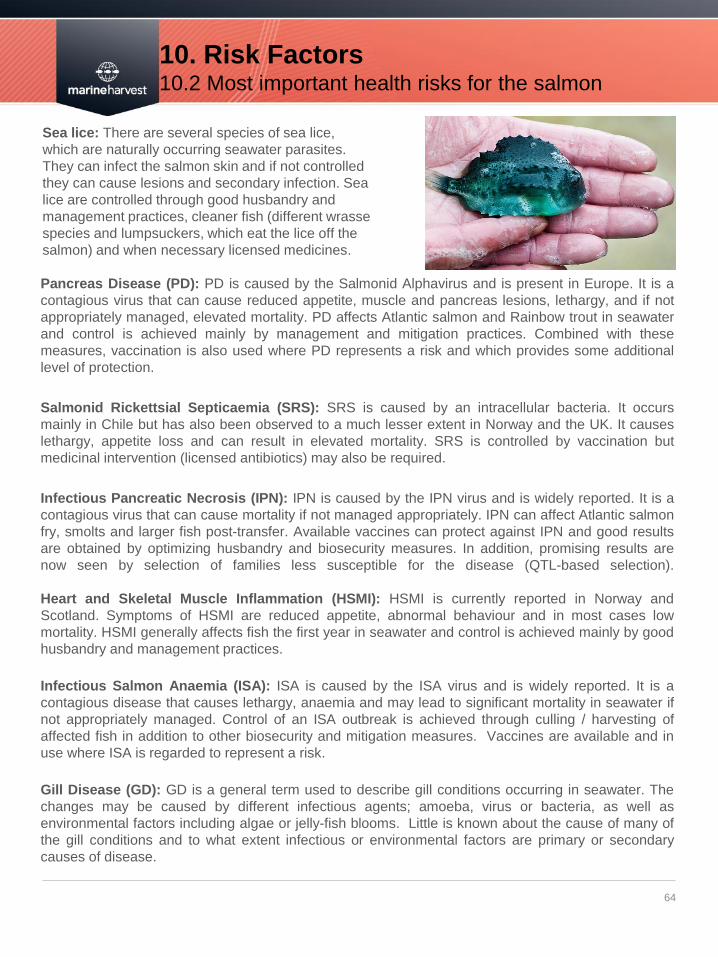
10. Risk Factors 10.2 Most important health risks for the salmon
64
Sea lice: There are several species of sea lice,
which are naturally occurring seawater parasites.
They can infect the salmon skin and if not controlled
they can cause lesions and secondary infection. Sea
lice are controlled through good husbandry and
management practices, cleaner fish (different wrasse
species and lumpsuckers, which eat the lice off the
salmon) and when necessary licensed medicines.
Pancreas Disease (PD): PD is caused by the Salmonid Alphavirus and is present in Europe. It is a
contagious virus that can cause reduced appetite, muscle and pancreas lesions, lethargy, and if not
appropriately managed, elevated mortality. PD affects Atlantic salmon and Rainbow trout in seawater
and control is achieved mainly by management and mitigation practices. Combined with these
measures, vaccination is also used where PD represents a risk and which provides some additional
level of protection.
Salmonid Rickettsial Septicaemia (SRS): SRS is caused by an intracellular bacteria. It occurs
mainly in Chile but has also been observed to a much lesser extent in Norway and the UK. It causes
lethargy, appetite loss and can result in elevated mortality. SRS is controlled by vaccination but
medicinal intervention (licensed antibiotics) may also be required.
Infectious Pancreatic Necrosis (IPN): IPN is caused by the IPN virus and is widely reported. It is a
contagious virus that can cause mortality if not managed appropriately. IPN can affect Atlantic salmon
fry, smolts and larger fish post-transfer. Available vaccines can protect against IPN and good results
are obtained by optimizing husbandry and biosecurity measures. In addition, promising results are
now seen by selection of families less susceptible for the disease (QTL-based selection).
Heart and Skeletal Muscle Inflammation (HSMI): HSMI is currently reported in Norway and
Scotland. Symptoms of HSMI are reduced appetite, abnormal behaviour and in most cases low
mortality. HSMI generally affects fish the first year in seawater and control is achieved mainly by good
husbandry and management practices.
Infectious Salmon Anaemia (ISA): ISA is caused by the ISA virus and is widely reported. It is a
contagious disease that causes lethargy, anaemia and may lead to significant mortality in seawater if
not appropriately managed. Control of an ISA outbreak is achieved through culling / harvesting of
affected fish in addition to other biosecurity and mitigation measures. Vaccines are available and in
use where ISA is regarded to represent a risk.
Gill Disease (GD): GD is a general term used to describe gill conditions occurring in seawater. The
changes may be caused by different infectious agents; amoeba, virus or bacteria, as well as
environmental factors including algae or jelly-fish blooms. Little is known about the cause of many of
the gill conditions and to what extent infectious or environmental factors are primary or secondary
causes of disease.
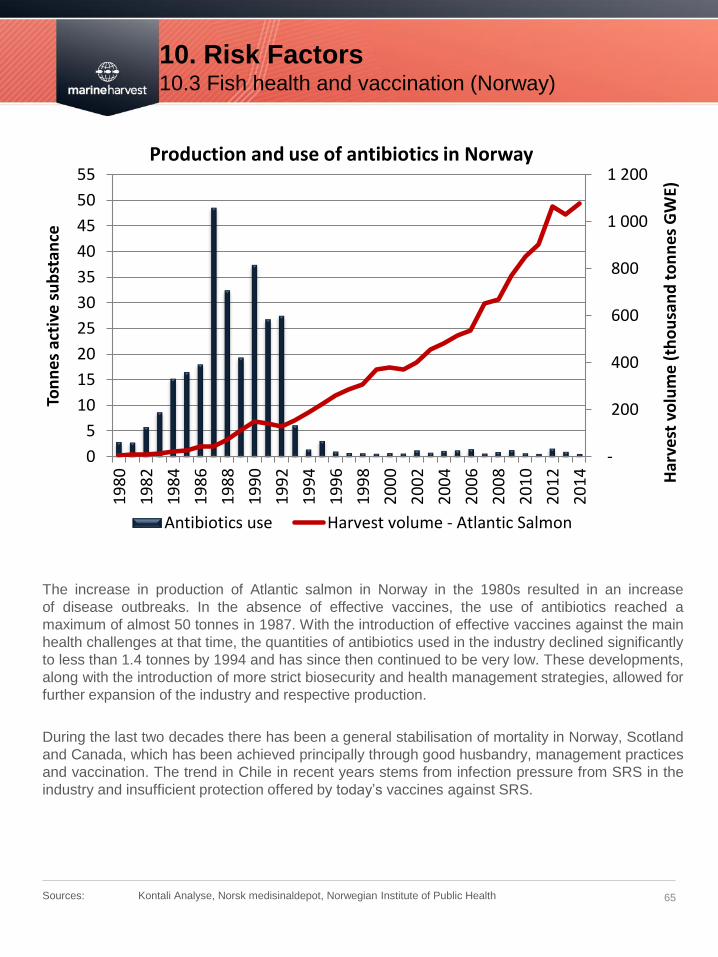
10. Risk Factors 10.3 Fish health and vaccination (Norway)
65 Sources: Kontali Analyse, Norsk medisinaldepot, Norwegian Institute of Public Health
The increase in production of Atlantic salmon in Norway in the 1980s resulted in an increase
of disease outbreaks. In the absence of effective vaccines, the use of antibiotics reached a
maximum of almost 50 tonnes in 1987. With the introduction of effective vaccines against the main
health challenges at that time, the quantities of antibiotics used in the industry declined significantly
to less than 1.4 tonnes by 1994 and has since then continued to be very low. These developments,
along with the introduction of more strict biosecurity and health management strategies, allowed for
further expansion of the industry and respective production.
During the last two decades there has been a general stabilisation of mortality in Norway, Scotland
and Canada, which has been achieved principally through good husbandry, management practices
and vaccination. The trend in Chile in recent years stems from infection pressure from SRS in the
industry and insufficient protection offered by today’s vaccines against SRS.
-
200
400
600
800
1 000
1 200
0
5
10
15
20
25
30
35
40
45
50
55
19
80
19
82
19
84
19
86
19
88
19
90
19
92
19
94
19
96
19
98
20
00
20
02
20
04
20
06
20
08
20
10
20
12
20
14 Har
vest
vo
lum
e (t
ho
usa
nd
to
nn
es G
WE)
Ton
nes
act
ive
sub
stan
ce
Production and use of antibiotics in Norway
Antibiotics use Harvest volume - Atlantic Salmon
10. Risk Factors 10.4 Research and development focus
66
Fish health
Development of better tools for
prevention and control of disease
Vaccine developments/ improvements
Develop new, and optimize use of current
licensed medicines for lice control
Development of non-medicinal
technologies for sea lice control,
including commercial production of
cleaner fish
Environment
Environmental risk assessments and
analysis
Capacity of coastal environment to
assimilate discharges from aquaculture
Interactions between cultivated and wild
species
Genetics and immunology
Tools for health and performance
monitoring of Atlantic salmon
Breeding and selection for disease
resistant stock
Fish welfare
Optimisation of harvest methods
Physiological and behavioural measures
of the welfare of farmed fish in relation to
stocking densities, environmental and
husbandry factors
Feed and nutrition
Fish oil and fish meal substitution in diets
maintaining fish health, performance and
quality.
Functional diets for improved fish health
Bone health and the role of nutrition
Product quality
Measures to reduce prevalence of
melanin (black spots) in flesh
Identify disposing factors and measures
to reduce texture problems
Technology
Most of the technology used in modern
salmon farming around the world today is
standardised. However, further
technological development and
knowledge exchange continue at a
constant pace
According to Zacco (Norwegian patenting office), patenting intensity in the salmon farming industry
has grown rapidly in the last two decades. Considerable R&D is undertaken in several areas and
the most important developments have been seen in the feed and vaccine sectors, done by large
global players. In this industry the majority of producers are small and have not the capital to
undertake and supervise major R&D activities. This is expected to change as consolidation of the
industry continues.
Smolt, on-growing production and processing
The technology used in these phases can be bought ”off the shelf”. Very few patents are granted.
Technology and respective operators are becoming increasingly more advanced and skilled.
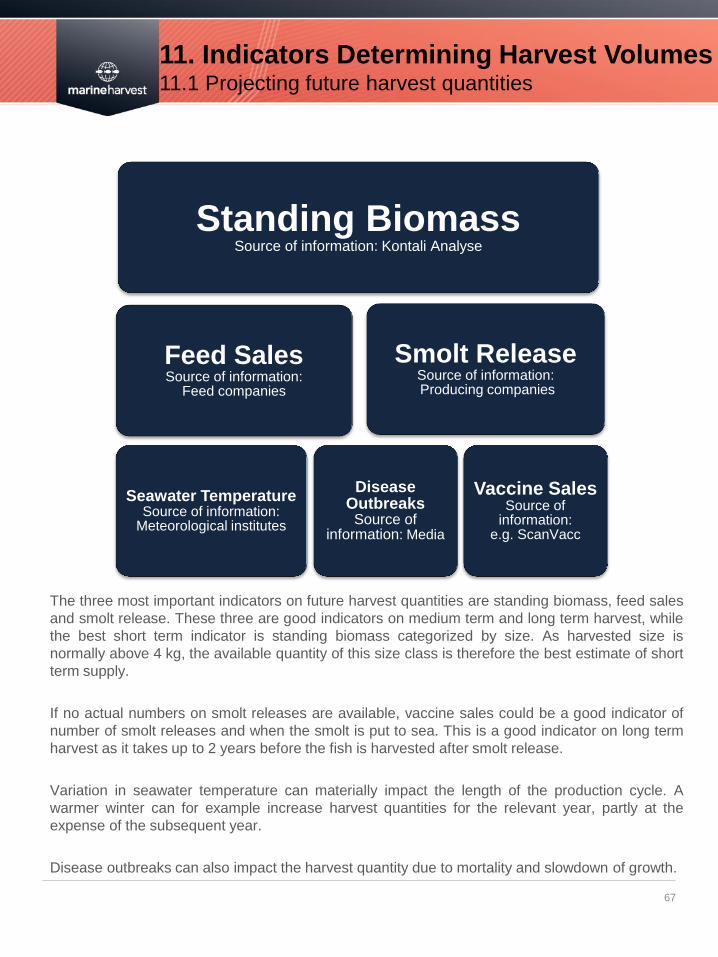
11. Indicators Determining Harvest Volumes 11.1 Projecting future harvest quantities
67
Standing Biomass Source of information: Kontali Analyse
Feed Sales Source of information:
Feed companies
Seawater Temperature Source of information:
Meteorological institutes
Disease Outbreaks
Source of information: Media
Smolt Release Source of information: Producing companies
Vaccine Sales Source of
information: e.g. ScanVacc
The three most important indicators on future harvest quantities are standing biomass, feed sales
and smolt release. These three are good indicators on medium term and long term harvest, while
the best short term indicator is standing biomass categorized by size. As harvested size is
normally above 4 kg, the available quantity of this size class is therefore the best estimate of short
term supply.
If no actual numbers on smolt releases are available, vaccine sales could be a good indicator of
number of smolt releases and when the smolt is put to sea. This is a good indicator on long term
harvest as it takes up to 2 years before the fish is harvested after smolt release.
Variation in seawater temperature can materially impact the length of the production cycle. A
warmer winter can for example increase harvest quantities for the relevant year, partly at the
expense of the subsequent year.
Disease outbreaks can also impact the harvest quantity due to mortality and slowdown of growth.
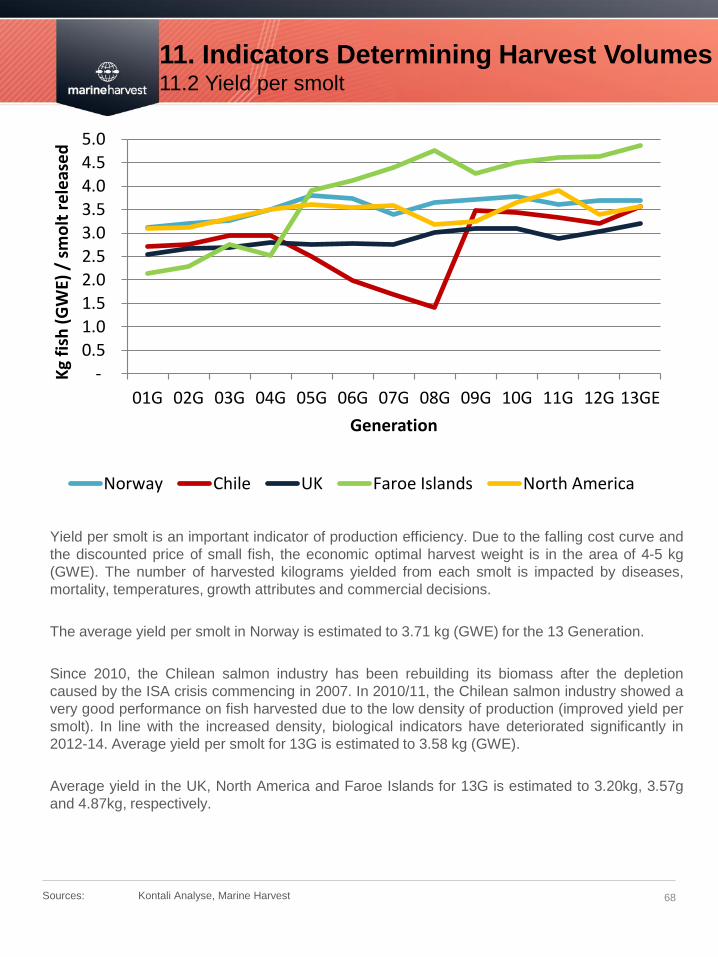
11. Indicators Determining Harvest Volumes 11.2 Yield per smolt
68 Sources: Kontali Analyse, Marine Harvest
Yield per smolt is an important indicator of production efficiency. Due to the falling cost curve and
the discounted price of small fish, the economic optimal harvest weight is in the area of 4-5 kg
(GWE). The number of harvested kilograms yielded from each smolt is impacted by diseases,
mortality, temperatures, growth attributes and commercial decisions.
The average yield per smolt in Norway is estimated to 3.71 kg (GWE) for the 13 Generation.
Since 2010, the Chilean salmon industry has been rebuilding its biomass after the depletion
caused by the ISA crisis commencing in 2007. In 2010/11, the Chilean salmon industry showed a
very good performance on fish harvested due to the low density of production (improved yield per
smolt). In line with the increased density, biological indicators have deteriorated significantly in
2012-14. Average yield per smolt for 13G is estimated to 3.58 kg (GWE).
Average yield in the UK, North America and Faroe Islands for 13G is estimated to 3.20kg, 3.57g
and 4.87kg, respectively.
-
0.5
1.0
1.5
2.0
2.5
3.0
3.5
4.0
4.5
5.0
01G 02G 03G 04G 05G 06G 07G 08G 09G 10G 11G 12G 13GE
Kg
fish
(G
WE)
/ s
mo
lt r
elea
sed
Generation
Norway Chile UK Faroe Islands North America
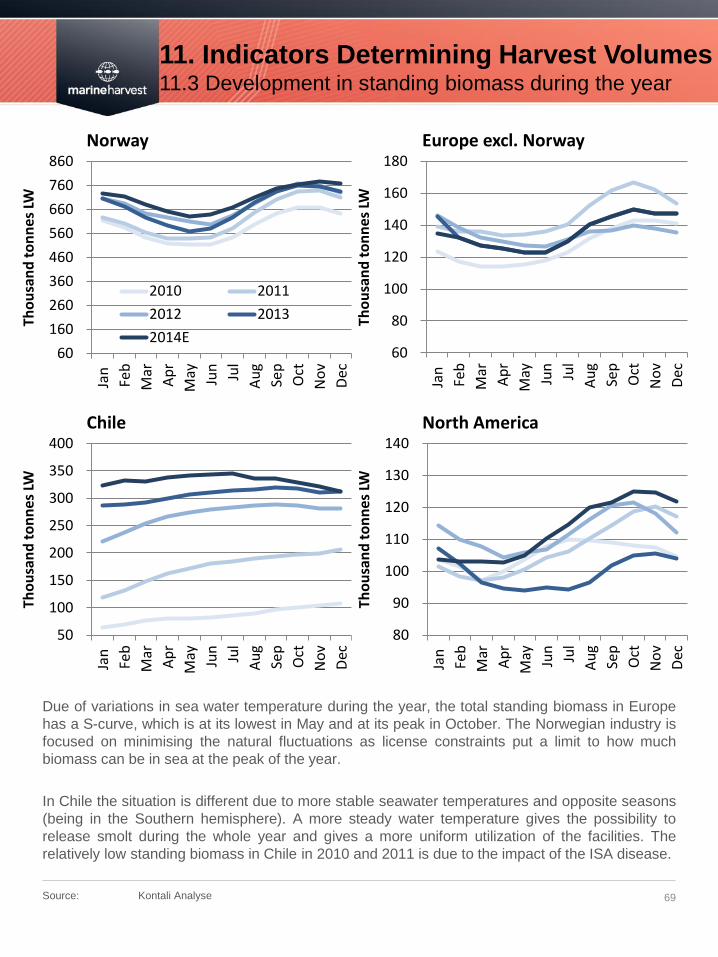
11. Indicators Determining Harvest Volumes 11.3 Development in standing biomass during the year
69 Source: Kontali Analyse
Due of variations in sea water temperature during the year, the total standing biomass in Europe
has a S-curve, which is at its lowest in May and at its peak in October. The Norwegian industry is
focused on minimising the natural fluctuations as license constraints put a limit to how much
biomass can be in sea at the peak of the year.
In Chile the situation is different due to more stable seawater temperatures and opposite seasons
(being in the Southern hemisphere). A more steady water temperature gives the possibility to
release smolt during the whole year and gives a more uniform utilization of the facilities. The
relatively low standing biomass in Chile in 2010 and 2011 is due to the impact of the ISA disease.
60
80
100
120
140
160
180
Jan
Feb
Mar
Ap
r
May Jun
Jul
Au
g
Sep
Oct
No
v
Dec
Tho
usa
nd
to
nn
es
LW
Europe excl. Norway
50
100
150
200
250
300
350
400
Jan
Feb
Mar
Ap
r
May Jun
Jul
Au
g
Sep
Oct
No
v
Dec
Tho
usa
nd
to
nn
es L
W
Chile
80
90
100
110
120
130
140Ja
n
Feb
Mar
Ap
r
May Jun
Jul
Au
g
Sep
Oct
No
v
Dec
Tho
usa
nd
to
nn
es
LW
North America
60
160
260
360
460
560
660
760
860
Jan
Feb
Mar
Ap
r
May Jun
Jul
Au
g
Sep
Oct
No
v
Dec
Tho
usa
nd
to
nn
es
LW
Norway
2010 2011
2012 2013
2014E
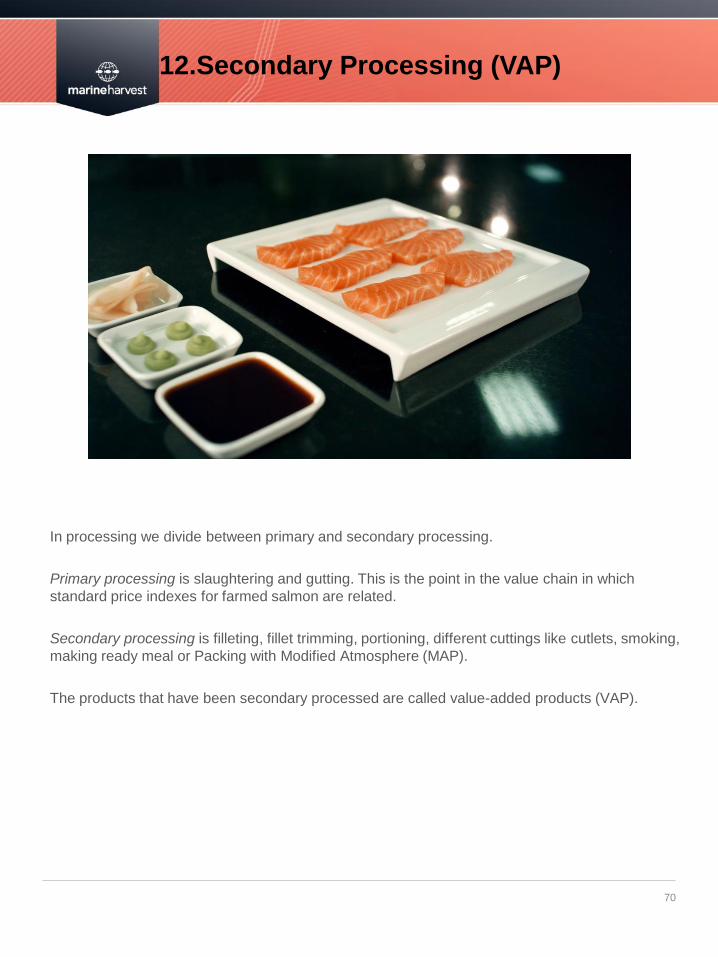
12.Secondary Processing (VAP)
70
In processing we divide between primary and secondary processing.
Primary processing is slaughtering and gutting. This is the point in the value chain in which
standard price indexes for farmed salmon are related.
Secondary processing is filleting, fillet trimming, portioning, different cuttings like cutlets, smoking,
making ready meal or Packing with Modified Atmosphere (MAP).
The products that have been secondary processed are called value-added products (VAP).
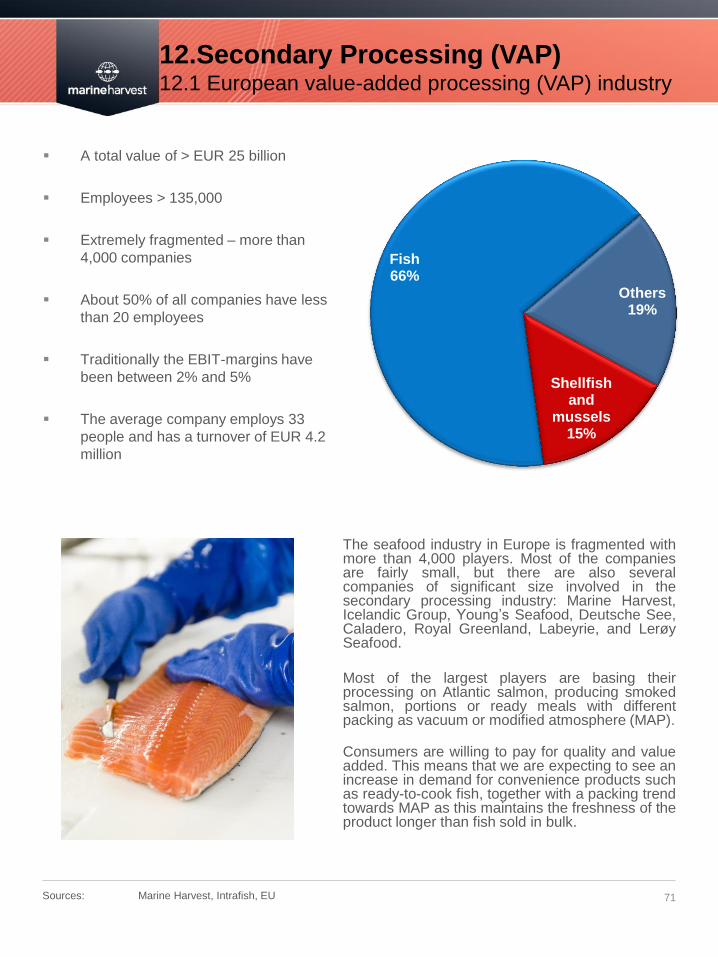
12.Secondary Processing (VAP) 12.1 European value-added processing (VAP) industry
71 Sources: Marine Harvest, Intrafish, EU
A total value of > EUR 25 billion
Employees > 135,000
Extremely fragmented – more than
4,000 companies
About 50% of all companies have less
than 20 employees
Traditionally the EBIT-margins have
been between 2% and 5%
The average company employs 33
people and has a turnover of EUR 4.2
million
Others 19%
Shellfish and
mussels 15%
Fish 66%
The seafood industry in Europe is fragmented with more than 4,000 players. Most of the companies are fairly small, but there are also several companies of significant size involved in the secondary processing industry: Marine Harvest, Icelandic Group, Young’s Seafood, Deutsche See, Caladero, Royal Greenland, Labeyrie, and Lerøy Seafood.
Most of the largest players are basing their processing on Atlantic salmon, producing smoked salmon, portions or ready meals with different packing as vacuum or modified atmosphere (MAP).
Consumers are willing to pay for quality and value added. This means that we are expecting to see an increase in demand for convenience products such as ready-to-cook fish, together with a packing trend towards MAP as this maintains the freshness of the product longer than fish sold in bulk.
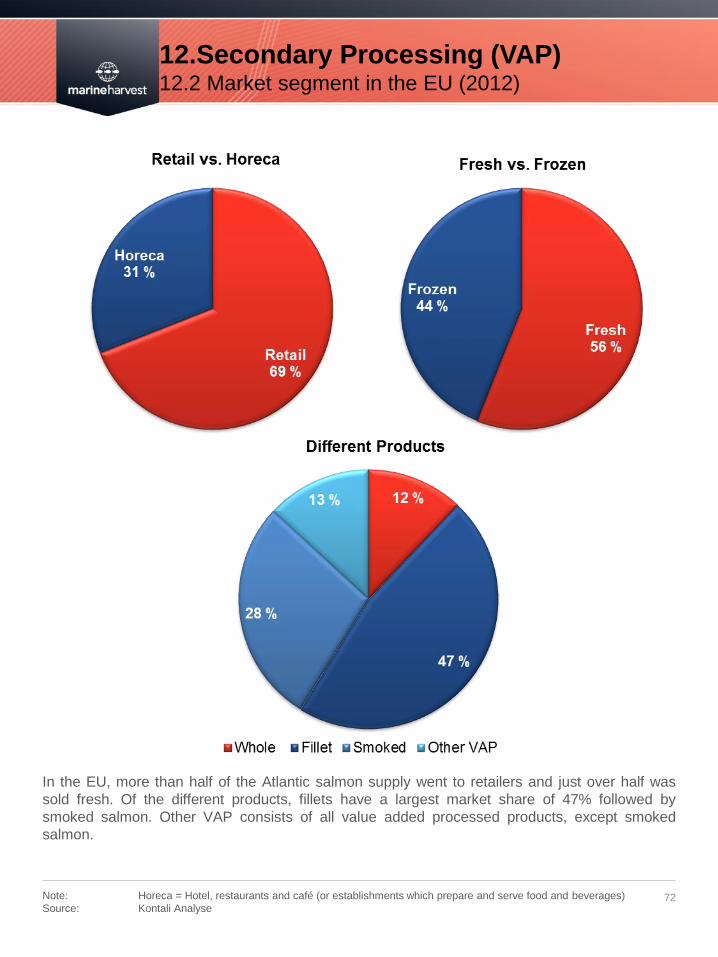
12.Secondary Processing (VAP) 12.2 Market segment in the EU (2012)
72
In the EU, more than half of the Atlantic salmon supply went to retailers and just over half was
sold fresh. Of the different products, fillets have a largest market share of 47% followed by
smoked salmon. Other VAP consists of all value added processed products, except smoked
salmon.
Note: Horeca = Hotel, restaurants and café (or establishments which prepare and serve food and beverages)
Source: Kontali Analyse
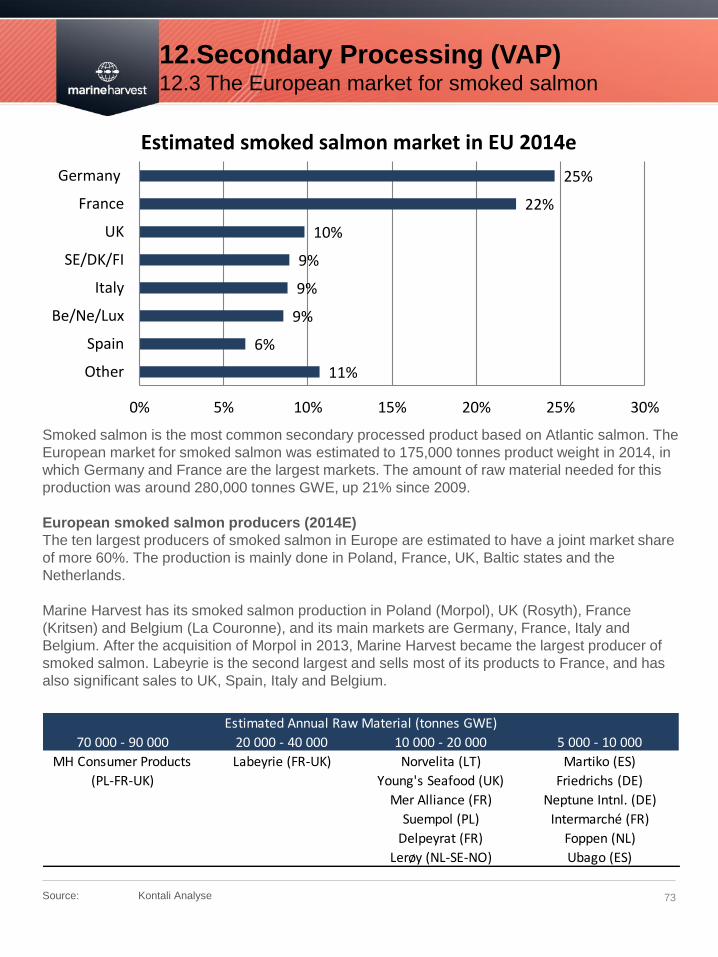
12.Secondary Processing (VAP) 12.3 The European market for smoked salmon
73 Source: Kontali Analyse
Smoked salmon is the most common secondary processed product based on Atlantic salmon. The
European market for smoked salmon was estimated to 175,000 tonnes product weight in 2014, in
which Germany and France are the largest markets. The amount of raw material needed for this
production was around 280,000 tonnes GWE, up 21% since 2009.
European smoked salmon producers (2014E)
The ten largest producers of smoked salmon in Europe are estimated to have a joint market share
of more 60%. The production is mainly done in Poland, France, UK, Baltic states and the
Netherlands.
Marine Harvest has its smoked salmon production in Poland (Morpol), UK (Rosyth), France
(Kritsen) and Belgium (La Couronne), and its main markets are Germany, France, Italy and
Belgium. After the acquisition of Morpol in 2013, Marine Harvest became the largest producer of
smoked salmon. Labeyrie is the second largest and sells most of its products to France, and has
also significant sales to UK, Spain, Italy and Belgium.
11%
6%
9%
9%
9%
10%
22%
25%
0% 5% 10% 15% 20% 25% 30%
Other
Spain
Be/Ne/Lux
Italy
SE/DK/FI
UK
France
Germany
Estimated smoked salmon market in EU 2014e
70 000 - 90 000 20 000 - 40 000 10 000 - 20 000 5 000 - 10 000
Labeyrie (FR-UK) Norvelita (LT) Martiko (ES)
Young's Seafood (UK) Friedrichs (DE)
Mer Alliance (FR) Neptune Intnl. (DE)
Suempol (PL) Intermarché (FR)
Delpeyrat (FR) Foppen (NL)
Lerøy (NL-SE-NO) Ubago (ES)
Estimated Annual Raw Material (tonnes GWE)
MH Consumer Products
(PL-FR-UK)
Appendix
74
In the appendix you can find explanation of key words, as well as information about the Marine
Harvest group such as key financial numbers, the company’s history together with information
about our operations upstream and downstream.
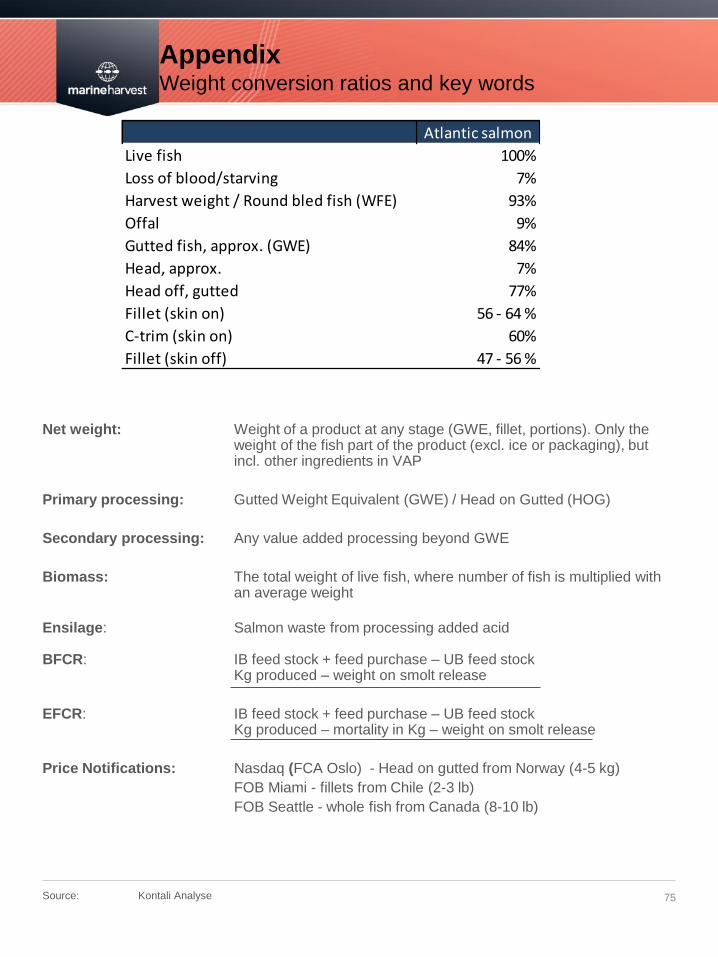
Appendix Weight conversion ratios and key words
75 Source: Kontali Analyse
Net weight: Weight of a product at any stage (GWE, fillet, portions). Only the weight of the fish part of the product (excl. ice or packaging), but incl. other ingredients in VAP
Primary processing: Gutted Weight Equivalent (GWE) / Head on Gutted (HOG)
Secondary processing: Any value added processing beyond GWE
Biomass: The total weight of live fish, where number of fish is multiplied with an average weight
Ensilage: Salmon waste from processing added acid BFCR: IB feed stock + feed purchase – UB feed stock Kg produced – weight on smolt release
EFCR: IB feed stock + feed purchase – UB feed stock Kg produced – mortality in Kg – weight on smolt release
Price Notifications: Nasdaq (FCA Oslo) - Head on gutted from Norway (4-5 kg)
FOB Miami - fillets from Chile (2-3 lb)
FOB Seattle - whole fish from Canada (8-10 lb)
Atlantic salmon
Live fish 100%
Loss of blood/starving 7%
Harvest weight / Round bled fish (WFE) 93%
Offal 9%
Gutted fish, approx. (GWE) 84%
Head, approx. 7%
Head off, gutted 77%
Fillet (skin on) 56 - 64 %
C-trim (skin on) 60%
Fillet (skin off) 47 - 56 %
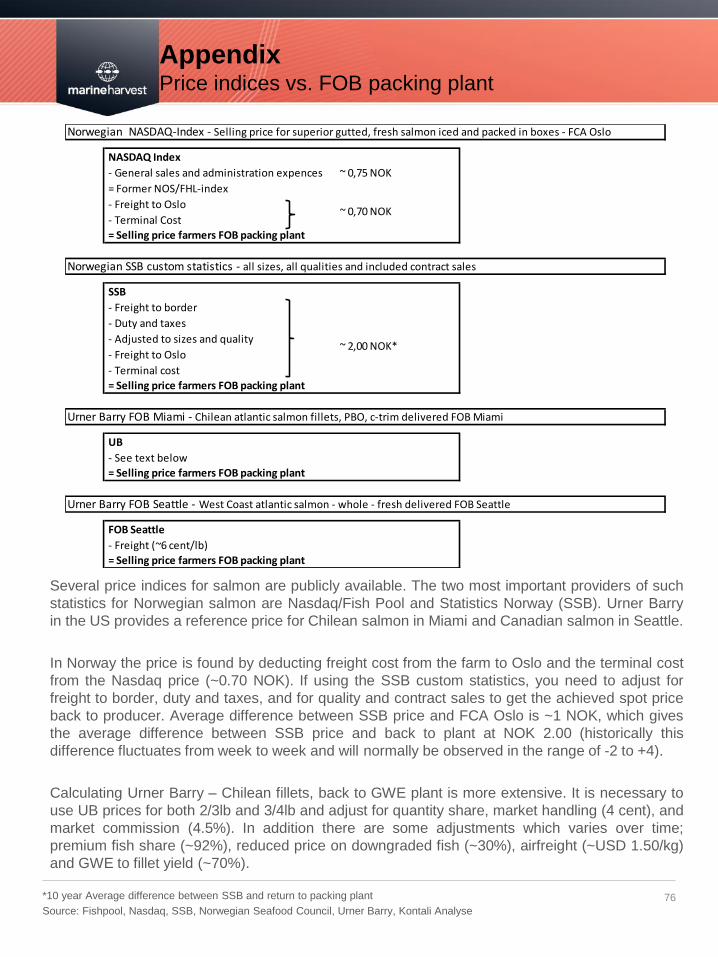
Appendix Price indices vs. FOB packing plant
76 *10 year Average difference between SSB and return to packing plant
Source: Fishpool, Nasdaq, SSB, Norwegian Seafood Council, Urner Barry, Kontali Analyse
Several price indices for salmon are publicly available. The two most important providers of such
statistics for Norwegian salmon are Nasdaq/Fish Pool and Statistics Norway (SSB). Urner Barry
in the US provides a reference price for Chilean salmon in Miami and Canadian salmon in Seattle.
In Norway the price is found by deducting freight cost from the farm to Oslo and the terminal cost
from the Nasdaq price (~0.70 NOK). If using the SSB custom statistics, you need to adjust for
freight to border, duty and taxes, and for quality and contract sales to get the achieved spot price
back to producer. Average difference between SSB price and FCA Oslo is ~1 NOK, which gives
the average difference between SSB price and back to plant at NOK 2.00 (historically this
difference fluctuates from week to week and will normally be observed in the range of -2 to +4).
Calculating Urner Barry – Chilean fillets, back to GWE plant is more extensive. It is necessary to
use UB prices for both 2/3lb and 3/4lb and adjust for quantity share, market handling (4 cent), and
market commission (4.5%). In addition there are some adjustments which varies over time;
premium fish share (~92%), reduced price on downgraded fish (~30%), airfreight (~USD 1.50/kg)
and GWE to fillet yield (~70%).
NASDAQ Index
- General sales and administration expences ~ 0,75 NOK
= Former NOS/FHL-index
- Freight to Oslo
- Terminal Cost
= Selling price farmers FOB packing plant
SSB
- Freight to border
- Duty and taxes
- Adjusted to sizes and quality
- Freight to Oslo
- Terminal cost
= Selling price farmers FOB packing plant
UB
- See text below
= Selling price farmers FOB packing plant
FOB Seattle
- Freight (~6 cent/lb)
= Selling price farmers FOB packing plant
Urner Barry FOB Seattle - West Coast atlantic salmon - whole - fresh delivered FOB Seattle
Norwegian NASDAQ-Index - Selling price for superior gutted, fresh salmon iced and packed in boxes - FCA Oslo
~ 0,70 NOK
Norwegian SSB custom statistics - all sizes, all qualities and included contract sales
~ 2,00 NOK*
Urner Barry FOB Miami - Chilean atlantic salmon fillets, PBO, c-trim delivered FOB Miami
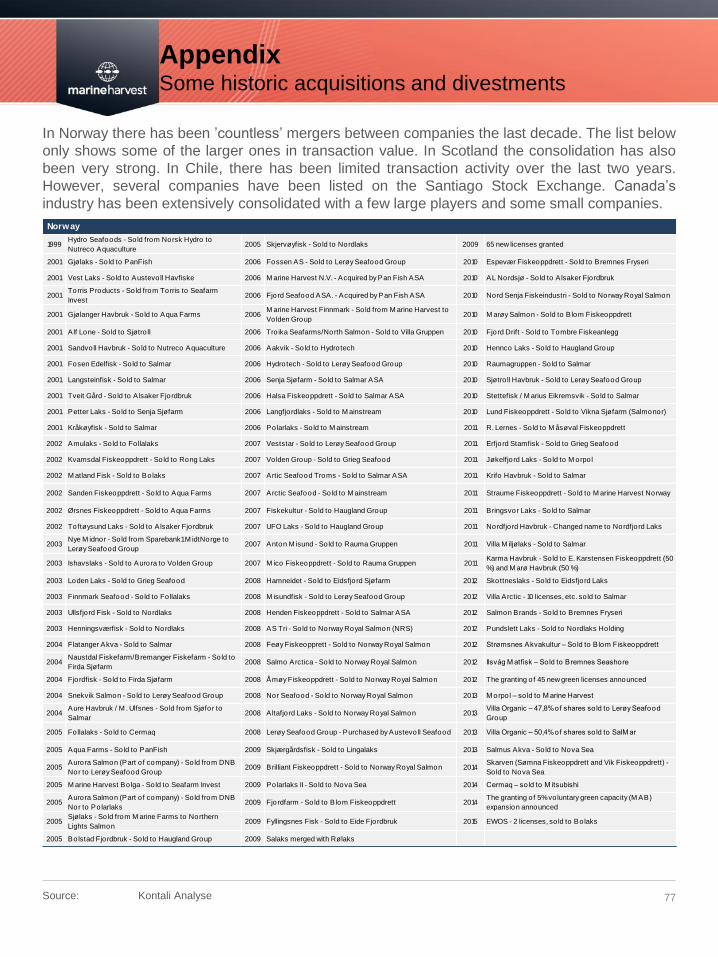
Appendix Some historic acquisitions and divestments
77
In Norway there has been ’countless’ mergers between companies the last decade. The list below
only shows some of the larger ones in transaction value. In Scotland the consolidation has also
been very strong. In Chile, there has been limited transaction activity over the last two years.
However, several companies have been listed on the Santiago Stock Exchange. Canada’s
industry has been extensively consolidated with a few large players and some small companies.
Source: Kontali Analyse
Norway
1999Hydro Seafoods - Sold from Norsk Hydro to
Nutreco Aquaculture2005 Skjervøyfisk - Sold to Nordlaks 2009 65 new licenses granted
2001 Gjølaks - Sold to PanFish 2006 Fossen AS - Sold to Lerøy Seafood Group 2010 Espevær Fiskeoppdrett - Sold to Bremnes Fryseri
2001 Vest Laks - Sold to Austevoll Havfiske 2006 M arine Harvest N.V. - Acquired by Pan Fish ASA 2010 AL Nordsjø - Sold to Alsaker Fjordbruk
2001Torris Products - Sold from Torris to Seafarm
Invest2006 Fjord Seafood ASA. - Acquired by Pan Fish ASA 2010 Nord Senja Fiskeindustri - Sold to Norway Royal Salmon
2001 Gjølanger Havbruk - Sold to Aqua Farms 2006M arine Harvest Finnmark - Sold from M arine Harvest to
Volden Group2010 M arøy Salmon - Sold to Blom Fiskeoppdrett
2001 Alf Lone - Sold to Sjøtro ll 2006 Tro ika Seafarms/North Salmon - Sold to Villa Gruppen 2010 Fjord Drift - Sold to Tombre Fiskeanlegg
2001 Sandvoll Havbruk - Sold to Nutreco Aquaculture 2006 Aakvik - Sold to Hydrotech 2010 Hennco Laks - Sold to Haugland Group
2001 Fosen Edelfisk - Sold to Salmar 2006 Hydrotech - Sold to Lerøy Seafood Group 2010 Raumagruppen - Sold to Salmar
2001 Langsteinfisk - Sold to Salmar 2006 Senja Sjøfarm - Sold to Salmar ASA 2010 Sjøtro ll Havbruk - Sold to Lerøy Seafood Group
2001 Tveit Gård - Sold to Alsaker Fjordbruk 2006 Halsa Fiskeoppdrett - Sold to Salmar ASA 2010 Stettefisk / M arius Eikremsvik - Sold to Salmar
2001 Petter Laks - Sold to Senja Sjøfarm 2006 Langfjordlaks - Sold to M ainstream 2010 Lund Fiskeoppdrett - Sold to Vikna Sjøfarm (Salmonor)
2001 Kråkøyfisk - Sold to Salmar 2006 Polarlaks - Sold to M ainstream 2011 R. Lernes - Sold to M åsøval Fiskeoppdrett
2002 Amulaks - Sold to Follalaks 2007 Veststar - Sold to Lerøy Seafood Group 2011 Erfjord Stamfisk - Sold to Grieg Seafood
2002 Kvamsdal Fiskeoppdrett - Sold to Rong Laks 2007 Volden Group - Sold to Grieg Seafood 2011 Jøkelfjord Laks - Sold to M orpol
2002 M atland Fisk - Sold to Bolaks 2007 Artic Seafood Troms - Sold to Salmar ASA 2011 Krifo Havbruk - Sold to Salmar
2002 Sanden Fiskeoppdrett - Sold to Aqua Farms 2007 Arctic Seafood - Sold to M ainstream 2011 Straume Fiskeoppdrett - Sold to M arine Harvest Norway
2002 Ørsnes Fiskeoppdrett - Sold to Aqua Farms 2007 Fiskekultur - Sold to Haugland Group 2011 Bringsvor Laks - Sold to Salmar
2002 Toftøysund Laks - Sold to Alsaker Fjordbruk 2007 UFO Laks - Sold to Haugland Group 2011 Nordfjord Havbruk - Changed name to Nordfjord Laks
2003Nye M idnor - Sold from Sparebank1 M idtNorge to
Lerøy Seafood Group2007 Anton M isund - Sold to Rauma Gruppen 2011 Villa M iljølaks - Sold to Salmar
2003 Ishavslaks - Sold to Aurora to Volden Group 2007 M ico Fiskeoppdrett - Sold to Rauma Gruppen 2011Karma Havbruk - Sold to E. Karstensen Fiskeoppdrett (50
%) and M arø Havbruk (50 %)
2003 Loden Laks - Sold to Grieg Seafood 2008 Hamneidet - Sold to Eidsfjord Sjøfarm 2012 Skottneslaks - Sold to Eidsfjord Laks
2003 Finnmark Seafood - Sold to Follalaks 2008 M isundfisk - Sold to Lerøy Seafood Group 2012 Villa Arctic - 10 licenses, etc. so ld to Salmar
2003 Ullsfjord Fisk - Sold to Nordlaks 2008 Henden Fiskeoppdrett - Sold to Salmar ASA 2012 Salmon Brands - Sold to Bremnes Fryseri
2003 Henningsværfisk - Sold to Nordlaks 2008 AS Tri - Sold to Norway Royal Salmon (NRS) 2012 Pundslett Laks - Sold to Nordlaks Holding
2004 Flatanger Akva - Sold to Salmar 2008 Feøy Fiskeopprett - Sold to Norway Royal Salmon 2012 Strømsnes Akvakultur – Sold to Blom Fiskeoppdrett
2004Naustdal Fiskefarm/Bremanger Fiskefarm - Sold to
Firda Sjøfarm2008 Salmo Arctica - Sold to Norway Royal Salmon 2012 Ilsvåg M atfisk – Sold to Bremnes Seashore
2004 Fjordfisk - Sold to Firda Sjøfarm 2008 Åmøy Fiskeoppdrett - Sold to Norway Royal Salmon 2012 The granting of 45 new green licenses announced
2004 Snekvik Salmon - Sold to Lerøy Seafood Group 2008 Nor Seafood - Sold to Norway Royal Salmon 2013 M orpol – so ld to M arine Harvest
2004Aure Havbruk / M . Ulfsnes - Sold from Sjøfor to
Salmar2008 Altafjord Laks - Sold to Norway Royal Salmon 2013
Villa Organic – 47,8% of shares so ld to Lerøy Seafood
Group
2005 Follalaks - Sold to Cermaq 2008 Lerøy Seafood Group - Purchased by Austevoll Seafood 2013 Villa Organic – 50,4% of shares so ld to SalM ar
2005 Aqua Farms - Sold to PanFish 2009 Skjærgårdsfisk - Sold to Lingalaks 2013 Salmus Akva - Sold to Nova Sea
2005Aurora Salmon (Part o f company) - Sold from DNB
Nor to Lerøy Seafood Group2009 Brilliant Fiskeoppdrett - Sold to Norway Royal Salmon 2014
Skarven (Sømna Fiskeoppdrett and Vik Fiskeoppdrett) -
Sold to Nova Sea
2005 M arine Harvest Bolga - Sold to Seafarm Invest 2009 Polarlaks II - Sold to Nova Sea 2014 Cermaq – so ld to M itsubishi
2005Aurora Salmon (Part o f company) - Sold from DNB
Nor to Polarlaks2009 Fjordfarm - Sold to Blom Fiskeoppdrett 2014
The granting of 5% voluntary green capacity (M AB)
expansion announced
2005Sjølaks - Sold from M arine Farms to Northern
Lights Salmon2009 Fyllingsnes Fisk - Sold to Eide Fjordbruk 2015 EWOS - 2 licenses, so ld to Bolaks
2005 Bolstad Fjordbruk - Sold to Haugland Group 2009 Salaks merged with Rølaks
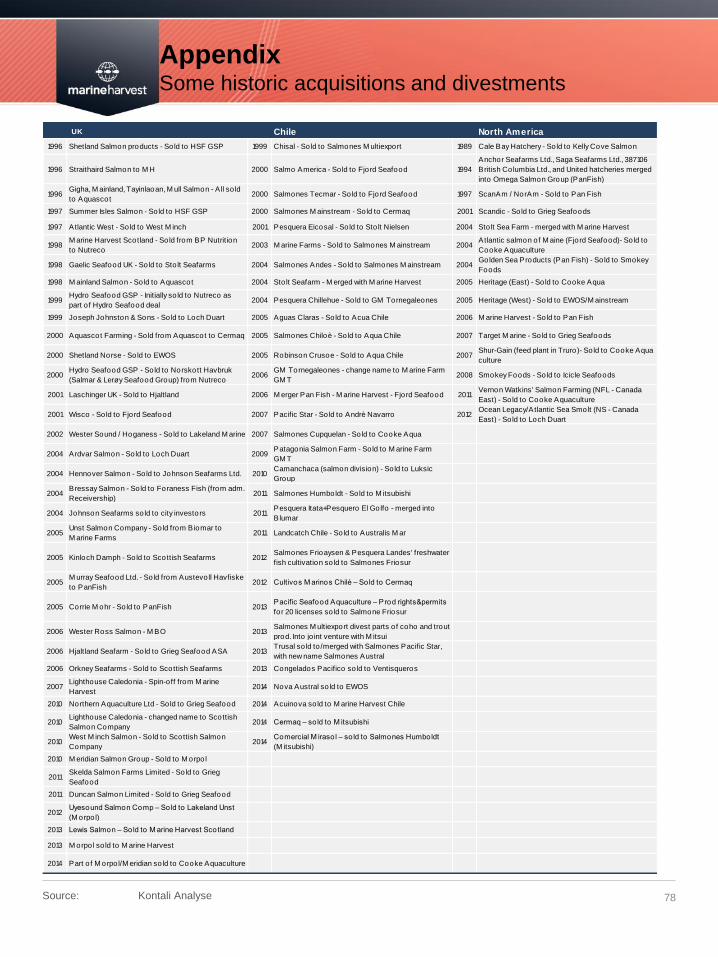
Appendix Some historic acquisitions and divestments
78 Source: Kontali Analyse
UK Chile North America
1996 Shetland Salmon products - Sold to HSF GSP 1999 Chisal - Sold to Salmones M ultiexport 1989 Cale Bay Hatchery - Sold to Kelly Cove Salmon
1996 Straithaird Salmon to M H 2000 Salmo America - Sold to Fjord Seafood 1994
Anchor Seafarms Ltd., Saga Seafarms Ltd., 387106
British Columbia Ltd., and United hatcheries merged
into Omega Salmon Group (PanFish)
1996Gigha, M ainland, Tayinlaoan, M ull Salmon - A ll so ld
to Aquascot2000 Salmones Tecmar - Sold to Fjord Seafood 1997 ScanAm / NorAm - Sold to Pan Fish
1997 Summer Isles Salmon - Sold to HSF GSP 2000 Salmones M ainstream - Sold to Cermaq 2001 Scandic - Sold to Grieg Seafoods
1997 Atlantic West - Sold to West M inch 2001 Pesquera Eicosal - Sold to Sto lt Nielsen 2004 Sto lt Sea Farm - merged with M arine Harvest
1998M arine Harvest Scotland - Sold from BP Nutrition
to Nutreco 2003 M arine Farms - Sold to Salmones M ainstream 2004
Atlantic salmon of M aine (Fjord Seafood)- Sold to
Cooke Aquaculture
1998 Gaelic Seafood UK - Sold to Sto lt Seafarms 2004 Salmones Andes - Sold to Salmones M ainstream 2004Golden Sea Products (Pan Fish) - Sold to Smokey
Foods
1998 M ainland Salmon - Sold to Aquascot 2004 Sto lt Seafarm - M erged with M arine Harvest 2005 Heritage (East) - Sold to Cooke Aqua
1999Hydro Seafood GSP - Initially so ld to Nutreco as
part o f Hydro Seafood deal2004 Pesquera Chillehue - Sold to GM Tornegaleones 2005 Heritage (West) - Sold to EWOS/M ainstream
1999 Joseph Johnston & Sons - Sold to Loch Duart 2005 Aguas Claras - Sold to Acua Chile 2006 M arine Harvest - Sold to Pan Fish
2000 Aquascot Farming - Sold from Aquascot to Cermaq 2005 Salmones Chiloè - Sold to Aqua Chile 2007 Target M arine - Sold to Grieg Seafoods
2000 Shetland Norse - Sold to EWOS 2005 Robinson Crusoe - Sold to Aqua Chile 2007Shur-Gain (feed plant in Truro)- Sold to Cooke Aqua
culture
2000Hydro Seafood GSP - Sold to Norskott Havbruk
(Salmar & Lerøy Seafood Group) from Nutreco2006
GM Tornegaleones - change name to M arine Farm
GM T2008 Smokey Foods - Sold to Icicle Seafoods
2001 Laschinger UK - Sold to Hjaltland 2006 M erger Pan Fish - M arine Harvest - Fjord Seafood 2011Vernon Watkins' Salmon Farming (NFL - Canada
East) - Sold to Cooke Aquaculture
2001 Wisco - Sold to Fjord Seafood 2007 Pacific Star - Sold to Andrè Navarro 2012Ocean Legacy/Atlantic Sea Smolt (NS - Canada
East) - Sold to Loch Duart
2002 Wester Sound / Hoganess - Sold to Lakeland M arine 2007 Salmones Cupquelan - Sold to Cooke Aqua
2004 Ardvar Salmon - Sold to Loch Duart 2009Patagonia Salmon Farm - Sold to M arine Farm
GM T
2004 Hennover Salmon - Sold to Johnson Seafarms Ltd. 2010Camanchaca (salmon division) - Sold to Luksic
Group
2004Bressay Salmon - Sold to Foraness Fish (from adm.
Receivership)2011 Salmones Humboldt - Sold to M itsubishi
2004 Johnson Seafarms so ld to city investors 2011Pesquera Itata+Pesquero El Golfo - merged into
Blumar
2005Unst Salmon Company - Sold from Biomar to
M arine Farms2011 Landcatch Chile - Sold to Australis M ar
2005 Kinloch Damph - Sold to Scottish Seafarms 2012Salmones Frioaysen & Pesquera Landes' freshwater
fish cultivation so ld to Salmones Friosur
2005M urray Seafood Ltd. - Sold from Austevoll Havfiske
to PanFish2012 Cultivos M arinos Chilé – Sold to Cermaq
2005 Corrie M ohr - Sold to PanFish 2013Pacific Seafood Aquaculture – Prod rights&permits
for 20 licenses so ld to Salmone Friosur
2006 Wester Ross Salmon - M BO 2013Salmones M ultiexport divest parts o f coho and trout
prod. Into jo int venture with M itsui
2006 Hjaltland Seafarm - Sold to Grieg Seafood ASA 2013Trusal so ld to /merged with Salmones Pacific Star,
with new name Salmones Austral
2006 Orkney Seafarms - Sold to Scottish Seafarms 2013 Congelados Pacifico so ld to Ventisqueros
2007Lighthouse Caledonia - Spin-off from M arine
Harvest2014 Nova Austral so ld to EWOS
2010 Northern Aquaculture Ltd - Sold to Grieg Seafood 2014 Acuinova so ld to M arine Harvest Chile
2010Lighthouse Caledonia - changed name to Scottish
Salmon Company2014 Cermaq – so ld to M itsubishi
2010West M inch Salmon - Sold to Scottish Salmon
Company 2014
Comercial M irasol – so ld to Salmones Humboldt
(M itsubishi)
2010 M eridian Salmon Group - Sold to M orpol
2011Skelda Salmon Farms Limited - Sold to Grieg
Seafood
2011 Duncan Salmon Limited - Sold to Grieg Seafood
2012Uyesound Salmon Comp – Sold to Lakeland Unst
(M orpol)
2013 Lewis Salmon – Sold to M arine Harvest Scotland
2013 M orpol so ld to M arine Harvest
2014 Part o f M orpol/M eridian so ld to Cooke Aquaculture
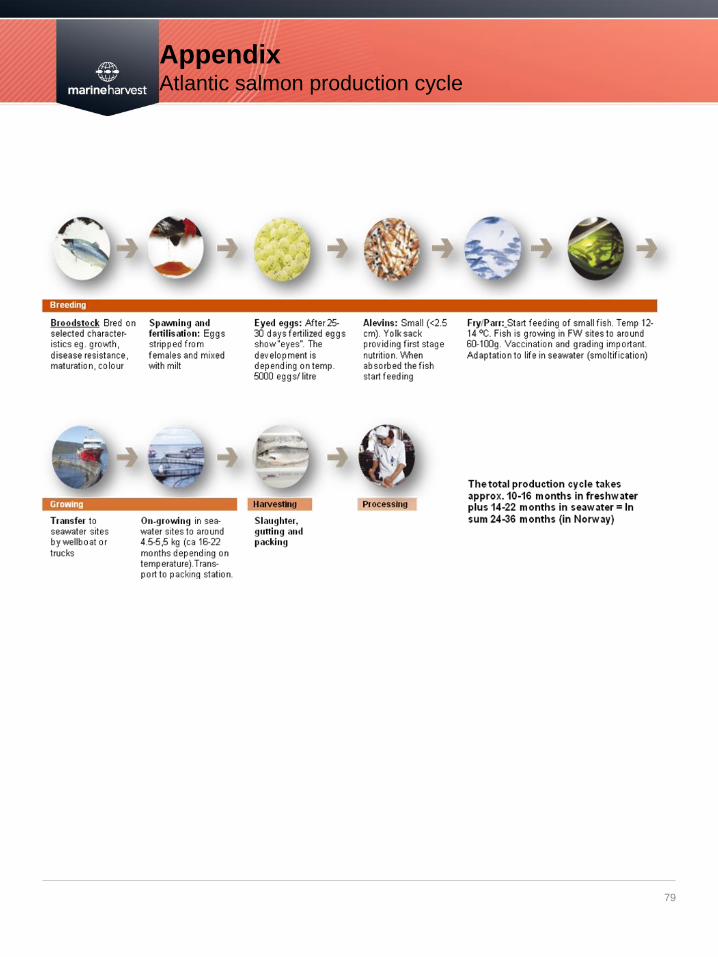
Appendix Atlantic salmon production cycle
79
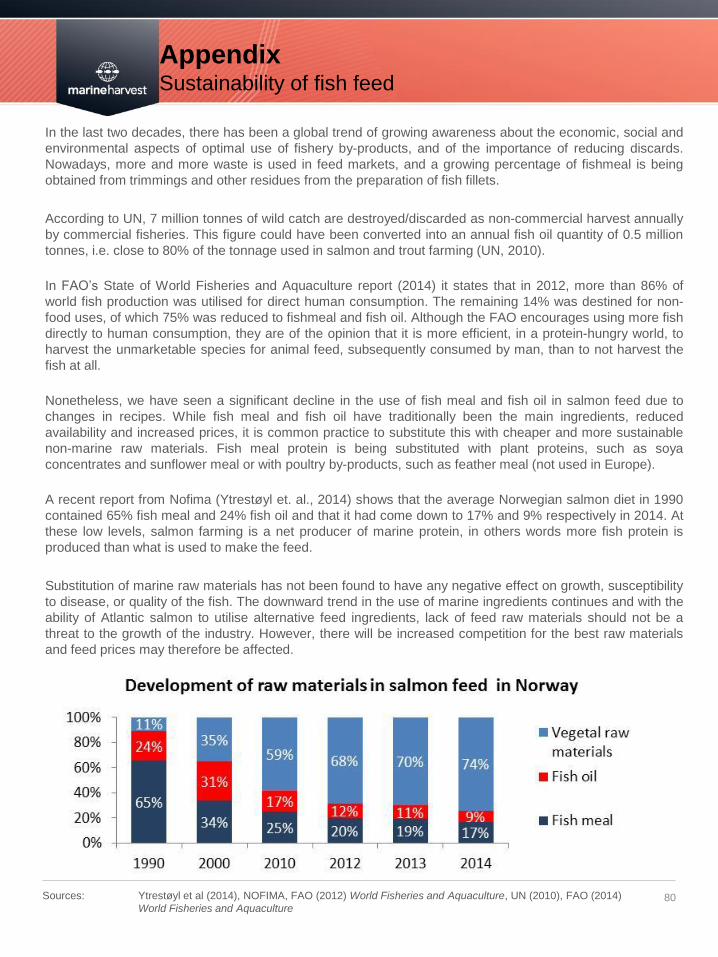
Appendix Sustainability of fish feed
80 Sources: Ytrestøyl et al (2014), NOFIMA, FAO (2012) World Fisheries and Aquaculture, UN (2010), FAO (2014)
World Fisheries and Aquaculture
In the last two decades, there has been a global trend of growing awareness about the economic, social and
environmental aspects of optimal use of fishery by-products, and of the importance of reducing discards.
Nowadays, more and more waste is used in feed markets, and a growing percentage of fishmeal is being
obtained from trimmings and other residues from the preparation of fish fillets.
According to UN, 7 million tonnes of wild catch are destroyed/discarded as non-commercial harvest annually
by commercial fisheries. This figure could have been converted into an annual fish oil quantity of 0.5 million
tonnes, i.e. close to 80% of the tonnage used in salmon and trout farming (UN, 2010).
In FAO’s State of World Fisheries and Aquaculture report (2014) it states that in 2012, more than 86% of
world fish production was utilised for direct human consumption. The remaining 14% was destined for non-
food uses, of which 75% was reduced to fishmeal and fish oil. Although the FAO encourages using more fish
directly to human consumption, they are of the opinion that it is more efficient, in a protein-hungry world, to
harvest the unmarketable species for animal feed, subsequently consumed by man, than to not harvest the
fish at all.
Nonetheless, we have seen a significant decline in the use of fish meal and fish oil in salmon feed due to
changes in recipes. While fish meal and fish oil have traditionally been the main ingredients, reduced
availability and increased prices, it is common practice to substitute this with cheaper and more sustainable
non-marine raw materials. Fish meal protein is being substituted with plant proteins, such as soya
concentrates and sunflower meal or with poultry by-products, such as feather meal (not used in Europe).
A recent report from Nofima (Ytrestøyl et. al., 2014) shows that the average Norwegian salmon diet in 1990
contained 65% fish meal and 24% fish oil and that it had come down to 17% and 9% respectively in 2014. At
these low levels, salmon farming is a net producer of marine protein, in others words more fish protein is
produced than what is used to make the feed.
Substitution of marine raw materials has not been found to have any negative effect on growth, susceptibility
to disease, or quality of the fish. The downward trend in the use of marine ingredients continues and with the
ability of Atlantic salmon to utilise alternative feed ingredients, lack of feed raw materials should not be a
threat to the growth of the industry. However, there will be increased competition for the best raw materials
and feed prices may therefore be affected.
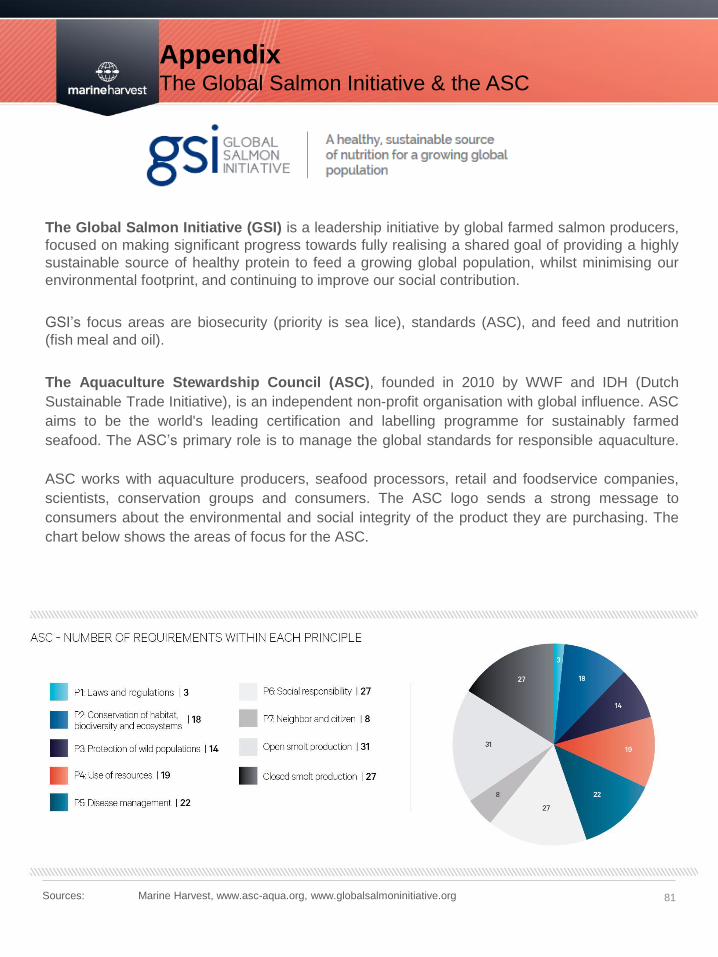
The Global Salmon Initiative (GSI) is a leadership initiative by global farmed salmon producers,
focused on making significant progress towards fully realising a shared goal of providing a highly
sustainable source of healthy protein to feed a growing global population, whilst minimising our
environmental footprint, and continuing to improve our social contribution.
GSI’s focus areas are biosecurity (priority is sea lice), standards (ASC), and feed and nutrition
(fish meal and oil).
The Aquaculture Stewardship Council (ASC), founded in 2010 by WWF and IDH (Dutch
Sustainable Trade Initiative), is an independent non-profit organisation with global influence. ASC
aims to be the world's leading certification and labelling programme for sustainably farmed
seafood. The ASC’s primary role is to manage the global standards for responsible aquaculture.
ASC works with aquaculture producers, seafood processors, retail and foodservice companies,
scientists, conservation groups and consumers. The ASC logo sends a strong message to
consumers about the environmental and social integrity of the product they are purchasing. The
chart below shows the areas of focus for the ASC.
Appendix The Global Salmon Initiative & the ASC
81 Sources: Marine Harvest, www.asc-aqua.org, www.globalsalmoninitiative.org
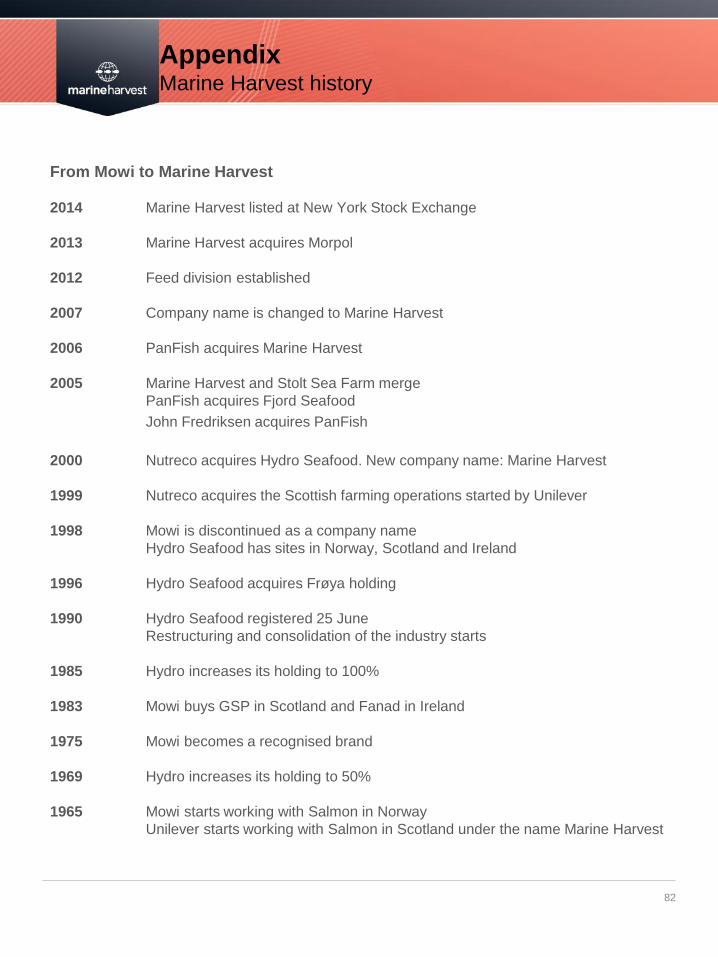
Appendix Marine Harvest history
82
From Mowi to Marine Harvest
2014 Marine Harvest listed at New York Stock Exchange
2013 Marine Harvest acquires Morpol
2012 Feed division established
2007 Company name is changed to Marine Harvest
2006 PanFish acquires Marine Harvest
2005 Marine Harvest and Stolt Sea Farm merge
PanFish acquires Fjord Seafood
John Fredriksen acquires PanFish
2000 Nutreco acquires Hydro Seafood. New company name: Marine Harvest
1999 Nutreco acquires the Scottish farming operations started by Unilever
1998 Mowi is discontinued as a company name
Hydro Seafood has sites in Norway, Scotland and Ireland
1996 Hydro Seafood acquires Frøya holding
1990 Hydro Seafood registered 25 June
Restructuring and consolidation of the industry starts
1985 Hydro increases its holding to 100%
1983 Mowi buys GSP in Scotland and Fanad in Ireland
1975 Mowi becomes a recognised brand
1969 Hydro increases its holding to 50%
1965 Mowi starts working with Salmon in Norway
Unilever starts working with Salmon in Scotland under the name Marine Harvest
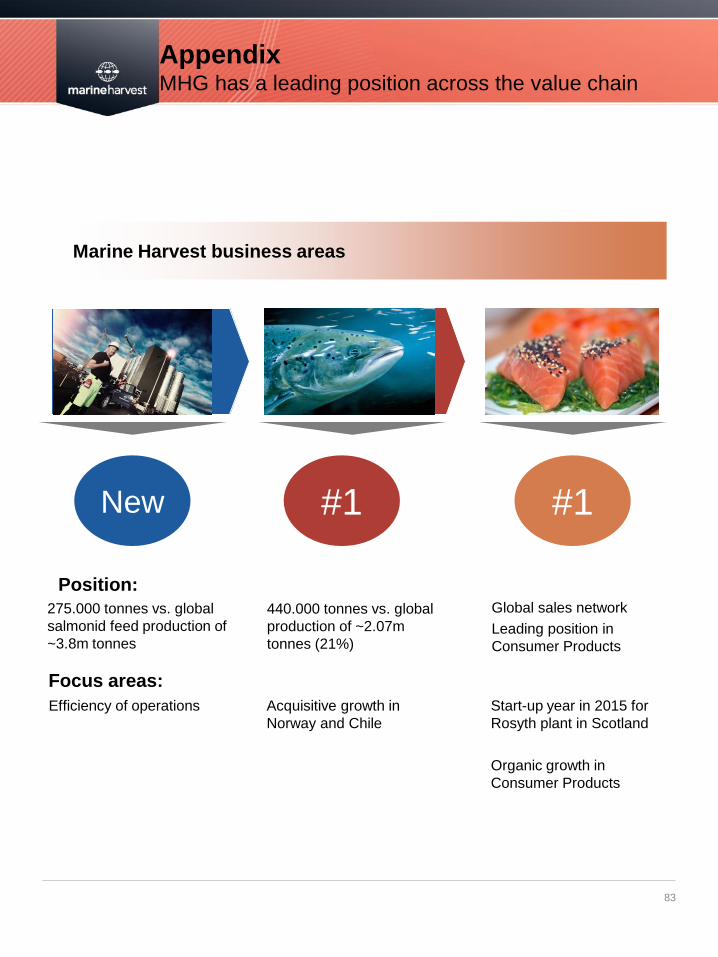
Appendix MHG has a leading position across the value chain
83
275.000 tonnes vs. global
salmonid feed production of
~3.8m tonnes
Marine Harvest business areas
New #1 #1
440.000 tonnes vs. global
production of ~2.07m
tonnes (21%)
Global sales network
Leading position in
Consumer Products
Focus areas:
Efficiency of operations Acquisitive growth in
Norway and Chile
Start-up year in 2015 for
Rosyth plant in Scotland
Organic growth in
Consumer Products
Position:
Bilder Bilder
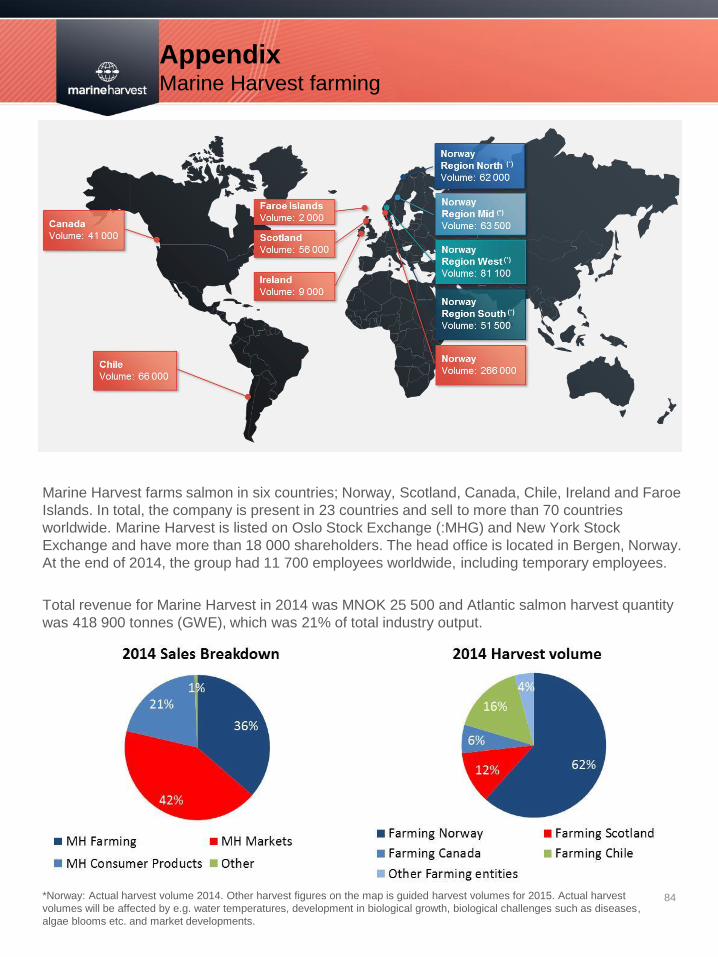
Appendix Marine Harvest farming
84 *Norway: Actual harvest volume 2014. Other harvest figures on the map is guided harvest volumes for 2015. Actual harvest
volumes will be affected by e.g. water temperatures, development in biological growth, biological challenges such as diseases,
algae blooms etc. and market developments.
Marine Harvest farms salmon in six countries; Norway, Scotland, Canada, Chile, Ireland and Faroe
Islands. In total, the company is present in 23 countries and sell to more than 70 countries
worldwide. Marine Harvest is listed on Oslo Stock Exchange (:MHG) and New York Stock
Exchange and have more than 18 000 shareholders. The head office is located in Bergen, Norway.
At the end of 2014, the group had 11 700 employees worldwide, including temporary employees.
Total revenue for Marine Harvest in 2014 was MNOK 25 500 and Atlantic salmon harvest quantity
was 418 900 tonnes (GWE), which was 21% of total industry output.
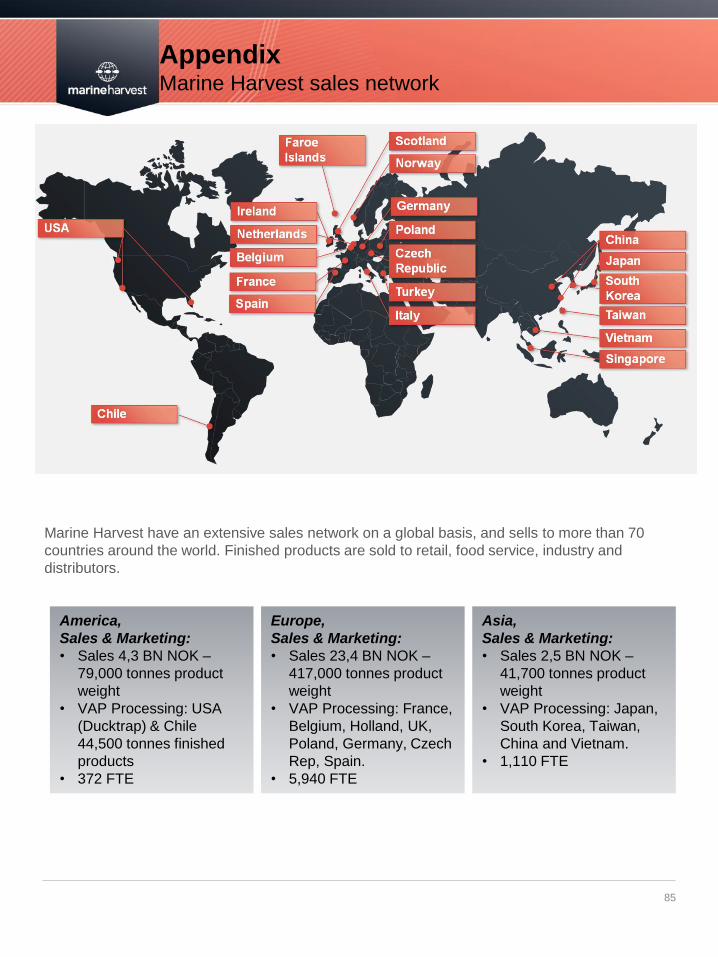
Appendix Marine Harvest sales network
85
Marine Harvest have an extensive sales network on a global basis, and sells to more than 70
countries around the world. Finished products are sold to retail, food service, industry and
distributors.
America,
Sales & Marketing:
• Sales 4,3 BN NOK –
79,000 tonnes product
weight
• VAP Processing: USA
(Ducktrap) & Chile
44,500 tonnes finished
products
• 372 FTE
Europe,
Sales & Marketing:
• Sales 23,4 BN NOK –
417,000 tonnes product
weight
• VAP Processing: France,
Belgium, Holland, UK,
Poland, Germany, Czech
Rep, Spain.
• 5,940 FTE
Asia,
Sales & Marketing:
• Sales 2,5 BN NOK –
41,700 tonnes product
weight
• VAP Processing: Japan,
South Korea, Taiwan,
China and Vietnam.
• 1,110 FTE
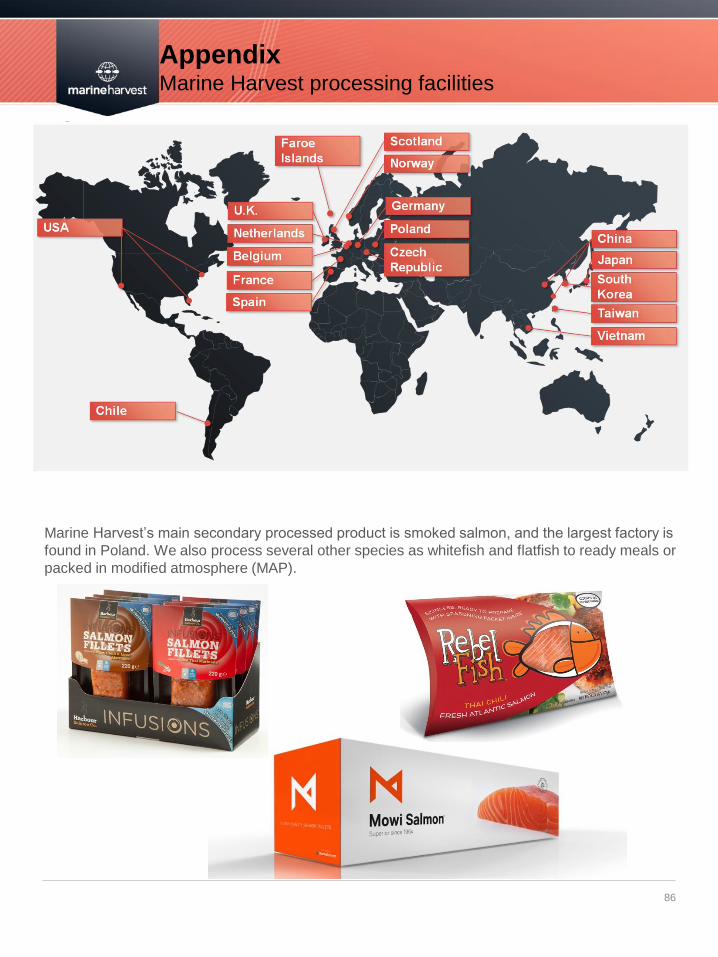
Appendix Marine Harvest processing facilities
86
Marine Harvest’s main secondary processed product is smoked salmon, and the largest factory is
found in Poland. We also process several other species as whitefish and flatfish to ready meals or
packed in modified atmosphere (MAP).
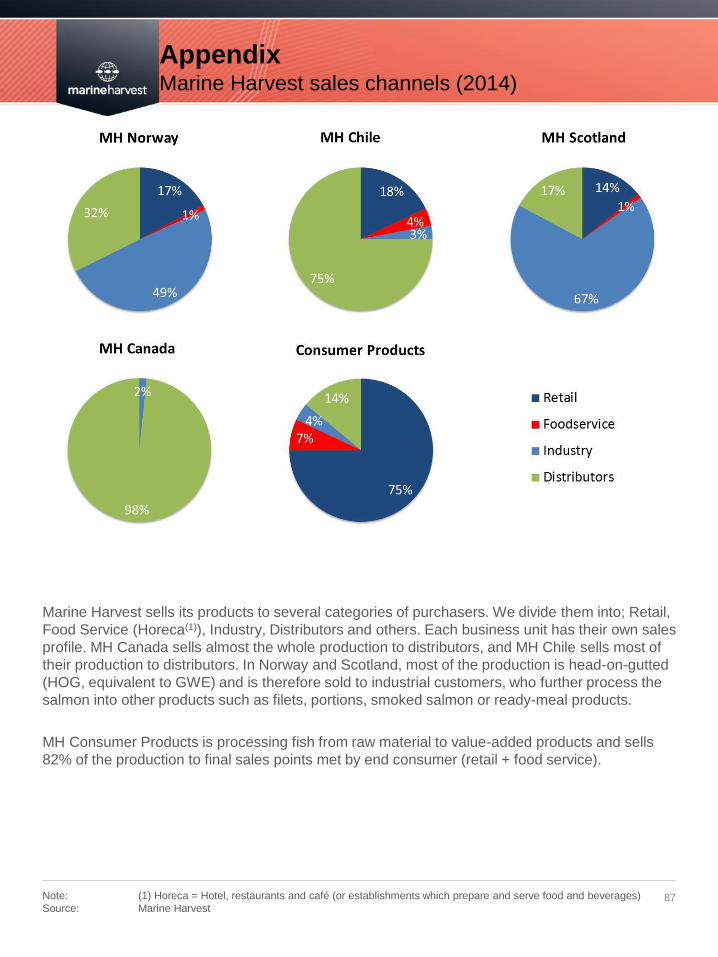
Appendix Marine Harvest sales channels (2014)
87
Marine Harvest sells its products to several categories of purchasers. We divide them into; Retail,
Food Service (Horeca(1)), Industry, Distributors and others. Each business unit has their own sales
profile. MH Canada sells almost the whole production to distributors, and MH Chile sells most of
their production to distributors. In Norway and Scotland, most of the production is head-on-gutted
(HOG, equivalent to GWE) and is therefore sold to industrial customers, who further process the
salmon into other products such as filets, portions, smoked salmon or ready-meal products.
MH Consumer Products is processing fish from raw material to value-added products and sells
82% of the production to final sales points met by end consumer (retail + food service).
Note: (1) Horeca = Hotel, restaurants and café (or establishments which prepare and serve food and beverages)
Source: Marine Harvest
Appendix Sources for industry and market information
88
Marine Harvest: www.marineharvest.com
Other
Kontali Analyse: www.kontali.no
Intrafish: www.intrafish.no
Norwegian directorate of Fisheries: www.fiskeridirektoratet.no
Norwegian Ministry of Trade,
Industry and Fisheries: www.fkd.dep.no
Norwegian Seafood Council: www.seafood.no
Norwegian Seafood Federation: www.norsksjomat.no
Chilean Fish Directorate: www.sernapersca.cl
FAO: www.fao.org
International fishmeal and fish oil org.: www.iffo.net
Laks er viktig for Norge: www.laks.no
Price statistics
Fish Pool Index: www.fishpool.eu
Kontali Analyse (subscription based): www.kontali.no
Urner Barry (subscription based): www.urnerbarry.com
Statistics Norway (SSB): www.ssb.no/laks_en/
NASDAQ: www.salmonprice.nasdaqomxtrader.com