handbook i sensory physiology i · 2010-04-14 · auditory system. as a generalization,...
TRANSCRIPT

.... -..... -._ .. _ .... - -- .... -':"_ .... _.-.- .. "._-Handbook
of Sensory Physiology
Volume V/2
Editorial Board H. Autrum R. Jung W. R. Loewenstein
D.M.MacKay H. L. Teuber
, , I , I , I ,I I
I I I I I I I I
I I I I I I I I I
I I I I
I I
I
I I I I

Auditory System Physiology (eNS) . Behavioral Studies
Psychoacoustics
By M. Abeles G. Bredberg R.A. Butler J. H. Casseday
J. E. Desmedt I. T. Diamond S. D. Erulkar E. F. Evans J. M. Goldberg M. H. Goldstein D. M. Green I. M. Hunter-Duvar
L. A. Jeffress W. D. Neff W. A. Yost E. Zwicker
Edited by
Wolf D. Keidel and William D. Neff
With 209 Figures
Springer-Verlag Berlin Heidelberg New York 1975

Wolf D. Keidel I. Physiologisches lnstitut der UnlversitJit 852 Erlangen, Uniyersitiitsstraf3e 17 (Gennany)
William D. Neff Center for Neural Sciences and Department of Psychology. Indiana Unlvel'slty. :Bloomington. Indiana 47401 (USA)
ISBN 3-540-07000-1 Springer-Verlag, Berlin· Heidelberg· NewYurk ISBN 0-387-07000-1 Springer-Verlag, New York • l;Ieidelberg. Berlin
Library of Congress Cataloging in Publication Data (Revised) Keidel, Wolf Dieter. Auditory system. (Handbook of I!ensory physiology; v. 5). Includes bibliographies and index. CONTENTS; 1. Anatomy. physiology (ear). 2. Physiology (eNS), behavIoral stUdies, psychoacoustics. 1. Hearing. 2. Ear. I. Neff. William D .• joint author. II. Adee, Harlow Whitting, 1911- . III. Title. IV. Series. [DNLM: 1. Neurophysiology. 2. Sensation. WL700 H236] QP361. HS4 vol. 5 [QP461] 591.1'82'08s [596',01'825] 74-415
The use of general descriptive names, trade names, trade marks, etc. in this publication, even if the former are not especially identified, is not to be taken as a sign that such names, as understood by the Trade Marks and Merchandise -Marks Act, may accordingly be used freely by anyone. This work is subject to copyright. All rights are reserved. whether the whole or part of the material is concerned. specifically those of translation. reprinting, reMuse of illustrations, broadcasting. reproduction by photocopying machine or similar means, and storage in data banks. Under § 54 of the German Copyright Law where copies are made for other than private use, a fee is payable to the publisher, the amount of the fee to be determined by .agreement with the publisher.
© by SpringerMVerlag, Berlln . Heidelberg 1975. Printed in Germany.
Typesetting, printing and binding: Briihlsche Universitatsdruckerei GieBen
Chapter 1
Chapter 2
Chapter 3
Contents
Cochlear Nerve and Cochlear Nucleus. By E. F. EVANS. With 49 Figures
Physiological Studies of Audiwry Nuclei of the Pons. By J. M. GOLDBERG. With 20 Figures . . . . . . . . . . . . . . . . . . . . . . . . . 109
Physiological Studies of the Inferior Colliculus and Medial Geniculate Com-plex. By S. D. ERULKAR. With 30 Figures . . . . . . . . . . . . . . 145
Chapter 4 Single Unit Activity of the Auditory Cortex. By M. H. GOLDSTEIN, Jr. and M. ABELES. With 10 Figures .................... 199
Chapter 5 Physiological Studies of the Efferent Recurrent Auditory System. By J. E. DE.MEDT. With 11 Figures. . . . . . . . . . . . . . . . . . . . . 219
Chapter 6 The Influence of the External and Middle Ear on Audiwry Discriminations. By R. A. BUTLER. With 4 Figures ........•......... 247
Chapter 7" Behavioral Tests of Hearing and Inner Ear Dam!loge. By G. BREDBERG and I. M. HUNTER·DuVAR. With 16 Figures ............... 261
Chapter 8 "Behavioral Studies of Audiwry Discrimination: Central Nervous System. By W. D. NEFF, 1. T. DIAMOND aml J. H. CASSEDAY. With 25 Figures. 307
Chapter 9 Scaling. By E. ZWICKER. With 40 Figures . 401
Chapter 10 Localization of Sound. By L. A. JEFFRESS. . 449
Chapter 11 Binaural Analysis. By D. M. GREEN and W. A. YOST. With 4 Figures. 461
Author Index. 481
Subject Index. 503

Chapter 1
Coehlear Nerve and Cochlear Nucleus E. F. EVANS, Keele, Great Britain
With 49 Figures
Cont,ents
1. Introduction 2
II. Cochlear Nerve. 4 A. Tonotopic Organiza,tion . 4 B. Spontaneous Activity. . 4 C. Response to Click Stimuli. 6 D. Response to Single Tonal Stimuli. 10
1. Threshold and Response as a Function of Frequency. II 2. Response as a Function of Intensity. 21 3. Response as a Function of Time. . 23 4. R,esponse to Low Frequency Tones . 24
E. R,espollse to Complex Sounds 30 1. Stimuli . . . 30
a) Two-tone Suppression. 30 b) Excitation by Tone Combinations. 33 c) Interaction of Responses to Two Tones: Linear and Non-linear Aspects 35
2. Noise Stimuli. .. ........... 38 3. Stimuli with Multi.component Spectra: Comb-filtered Noise. 41 4. Effect of Noise on Responses to Click and Tone Stimuli 43
III. Cochlear Nucleus 43 A. Introduction. 43 B. Organization 45
1. Tonotopic Organization 45 2. Functional Organization 46
a) Ventra.! Cochlear Nucleus 46 b) Dorsal Cochlear Nucleus . 50
3. Nature of Sensory Input to Neurones of Cochlear Nucleus 51 C. Spontaneous Activity. . . . 52 D. Response to Click Stimuli. . . . . . . . 52 E. Response to Single Tonal Stimuli. . 53
1. Threshold and Response as a Function of Frequency. 53 2. Response as a Function of Intensity . 54 3. Response as a Function of Time. . 56 4. Response to Low Frequency Tones . 57
F. R.esponse to Complex Sounds 58 1. Two-tone Stimuli . . . . . . 58

2 E. F. EVANS: Cochlear Nerve and Cochlear Nucleus
2. Noise Stimuli. . . . . . . . . . . . . . 3. Stimuli with Multi·component . . . 4. Frequency and Amplitude Modulated Tones 5. Effect of Noise on Responses to Click and Tone Stimuli
IV. Gross Nerve Action Potential Responses .
V. Effects of Activity of Efferent Pathways. A. Cochlear Nerve .
B. Cochlear Nucleus
VI. Discussion in Relation to . A. Cochlear Mechanisms.
1. Cochlear Filtering . 2. Transducer Nonlinearity 3. Generation of Cochlear Nerve Discharges .
B. Cochlear Innervation. . . . . . . . . . . C. Psychophysical and Behavioural Phenomena
1. Critical Band and Other Measures of Frequency Selectivity . 2. Masking ...... . 3. Combination Tones . . . . . . . . 4. Sensorineural Deafness. . . . . . .
D. Coding of Acoustic Stimulus Parameters 1. Frequency . . . 2. Intensity. . . . 3. Sound Complexes
References . . .
Abbreviations AP Gross oochlear action potential. CDT Cubic difference tone (21, - I,). CF Characteristic ("best") frequency. en. Cochlear nerve (acoustic, auditory, nerve). CN : Cochlear nucleus. DeN, VON, A VN, PVN: Dorsal, ventral, antero· and postero.ventral divisions of ON.
58 61 63 67
69
72 72 76
77 77 77 82 83 85 87 87 89 91 91 92 92 94 94
96
FRC Frequency response curve (plot of firing rate versus frequency at oonstant SPL). FTC Frequency threshold curve ("tuning curve"). IHC Inner hair cells of the organ of Corti. OCB Olivooocblear bundle. OHC Outer hair oells of the of Corti. PST Post or peri·stimulus time (applied to histogram). Q'OdB: CFfbandwidth of FTC at 10 dB above threshold. SON Superior olivary nucleus SPL : Sound pressure level relative to 2 x 10-< dyne/cm' (2 x 10-' N/m·).
I. Introduction The first recordings of single neurone activity in the auditory system were
made from the cochlear nucleus of the cat, by GALAMBOS and DAVIS (1943). In these experiments the authors were attempting to record from fibres in the cochlear
Introduction 3
nerve; subsequently, however, they concluded that the recordings had been from aberrant cells of the cochlear nucleus lying central to the glial margin of the VIII nerve (GALAMBOS and DAVIS, 1948). The first successful recordmgs from fibres of the cochlear nerve were made by TASAK! (1954) in the guinea pig. These classical but necessarily limited results were greatly extended by ROSE, GALAMBOS, and HUGHES (1959) in the cat cochlear nucleus and by KATSUKI and co-workers (KATsUKI et al., 1958, 1961, 1962) in the cat and monkey cochlear nerve. Perhaps the most significant developments have been the introduction of tecbniques for precise control of the acoustic stimulus and the quantitative analysis of neuronal response patterns, notably by the laboratories of KIANG (e.g. GERSTEIN and KIANG, 1960; KIANG et al., 1962b, 1965a, 1967) and ROSE (e.g. ROSE et al., 1967; HIND et at., 1967). These developments have made possible a large number of quanti. tative investigations of the behaviour of rep,'esentative numbers of neurons at these levels of the peripheral auditory system under a wide variety of stimulus conditions.
Most of the findings discussed herein have been obtained on anaesthetized cats. Where comparative data are available, substantially similar results have been obtained in other mammalian species (e.g. guinea pig, monkey, rat). Certain significant differences have been noted in lizards, frogs and fish as would be expect· ed from the different morphologies of their organs of hearing (e.g. see FLOOK, 1971; FmsHKoPF Bt at., 1968; FlffiUKAWA and ISHII, 1967), and these will be discussed in the relevant sections. The direct effects of anaesthesia do not appear to be significant at the level of the cochlear nerve, as judged by a comparison with limited data obtained in the unanaesthetized cat (RUPERT et al., 1963) and in one fibre studied for a long period under normal and anaesthetized conditions (Sm. MONS and LINEHAN, 1968). This is not the case at the level of the cochlear nucleus, where barbiturate anaesthesia cim have a profound effect (EVANS and NELSON, 1973a). Unfortunately, most cochlear nucleus studies have been carried out under pentobarbitone anaesthesia. Studies under anaesthesia do offer the advantage of being relatively free from the influences of the middle ear muscles and the efferent auditory system.
As a generalization, experimenters at this level of the auditory system now calibrate their acoustic system at the tympanic membrane, and except where noted, absolute stimulus levels will be given here in dB SPL at the tympanic membrane' . The experimental approach to the cochlear nerve and nucleus follows essentially that of KATsuKI et at. (1958), that is, removal or retraction of the cerebellum in order that a microelectrode may be inserted into the target under d,irect vision. With precautions to ensure freedom from movements of the brainstem, recordings can be routinely made from individual cochlear fibres for several tens of minutes, and from cochlear nucleus cells for several hours. For the criteria and techniques used to distinguish between fibres and cells, and formore detailed technical information on the methods involved, the reader is referred to ROSE et at. (1959), KIANG et al. (1965a), and EVANS (1972b). '
1 In'some laboratories (e.g. KuNG et al., 1967, 1970), it has been the practice to express data in terms of p-p stapes displacement, inferred from averaged measurements of stapes motion on other animals of the same species.

4 E. F. EVANS: Cochlear Nerve and Cochlear Nucleus
ll. Cochlear Nerve A. Tonotopic Organization'
Individual fibr<js of the cochlear nerve innervate relatively restricted areas of the organ of Corti (e.g. LORENTE DE N6"I933a; SPOENDLlN, 1971, 1972). spite of a certain degree of twisting of the cochlear nerve (LORENTE DE N6, 1933a; SANDO, 1965), the distribution of fibres along the cochlea is projected in a tonotopic fashion to the cochlear nucleus (see Section III.B.I). It is not surprising, therefore, that penetrations of the cochlear nerve encounter fibres responsive to a more or less restricted range of tone frequencies (see Section II.D.I), and arranged system· atically according to their optimal, or characteristic, frequencies (CFs). In the cat, the fibres are arranged such that microelectrode penetrations i.n the posterodorsal to anteroventral direction generally encounter fibres with high CFs first, then low CFs, and subsequently with progressively higher CFs. Thus, fibres with higher CFs are located superficially in the nerve, and those with lower CFs more centrally (KlAl<G et ai., 1965a,; EVANSand ROSENBERG, unpublished observations). In the guinea pig, on the other hand', the twisting of the nerve appears to be less com· plete, so that penetratioil!! in the same direction as in the,cat encounter fibres with CFs progressively decreasing from high to lowvaJues (EVANS, 1972b).A progreso sion of frequency sensitivities in the reverse direction to that in the guinea pig is found in the monkey (KATsUID et al., 1962). '
. B. Spontaneous Activity All studies of single fibres in the cochlear nerve have reported activity in the
absence of intentional auditory stimulation. While, for any given fibre the mean rate remains relatively steady for long periods of time, between fibres it varies from less than a few spikes/sec to 100-120 spikes/sec (e.g. NOMOTO et ai., 1964 in the Macaque; KIANG et ai., 1965a" in the cat; ROSE et ai., 1971, in the squirrel monkey; EVANS, 1972b, in the guinea pig). This range does not appear to, to any degree of injury to the fibres themselves, in view of (a) the stability of tJie rate over long periods, and (b) the finrung of fibres with high and low rates apparently adjacent in an electrode penetration. On the other hand, there is somei-dation between the spontaneous discharge rate and the threshold sensitivity of a fibre. In norm';'! animals, there is a tendency for the most sensitive units to have rates of spontaneous disehargein excess of 15/sec (KIANG et ai., 1965a, 1970; ROSE et al.,
1 sec
Fig. 1. Sppntaneons and tone evoked activity of single cochlear Derve fibre. Cat. Tone at characteriBticfrequency, 9.5 kHz, 15 dJl abovethi-esbold, indicated on lower'trace. Positivity upward. Note:- increase in spike. discharge rate'coITespondiiIg to duration of each tone burst;
reduction in discharge ra,te at termination of stimuli
Spontaneous Activity 5
1971). In cats poisoned with kanamycin (KIANG et al., 1970) and in guinea pigs in poor physiological condition (EVANS, 1972b), the affected fibres with abnormally high threshold have low or no spontaneous discharge. These abnormal fibres apart, the distribution of spontaneous rates tends to be bimodal: about a quarter of the fibres have rates below 10/sec; the majority of the reIilainder discharges at rates in excess of 30/sec. Forty percent of all fibres iu cat and squirrel monkey discharge at rates above 50/sec (KIANG et ai., 1965a; ROSE et ai., 1971), and in the guinea pig, above 80/sec (EVANS, 1972b).
'" ,£ 100
2 10 E z
s
a Duration 6f interval (msec)
E
I 50
Fig. 2. Interspike interval histogmms of spontaneous (S) and ,tone evoked (E) activity for a cat cochlear fibre. Tone at OF of fibre; 7.84 kHz. Histograms represent data collected from 5 min and 2 min of spontaneous and evoked activity, respectiVely. Note different time scales.
(From KliNG, 1968)
The spontaneous discJiarge pattern of fibres in the cooblear division of the VIII nerve, in contrast to the vestibular diviSion, is characteristically irregular (KIANG et ai., 1965a; WALSH et ai., 1972; see Fig. 1). Figure 2 shows the distribution of interspike intervals obtained from an an,;Jysis of several minutes of spontaneous discharge in a single cochlear fibre. The semi.logarithmic plot of the distribution has a nearly linear "decay", which may therefore be considered to be approxi. mately exponential. This is characteristic of a Poisson process (KIANG et ai.,-1965a). Furthermore, computations of joint interval statisticJl which indicate that the intervals between spikes are independent, are also compatible with this conclusion (KIANG et 01" 1965a). However, the observed interval distributions have fewer short intervaJs than 'Would be expected on the basis of 'a Poisson process. This can be attributed to the absolute and relative refractory periods following each dis. charge, a conclusion suppOrted by the ,observation that the modal values of the interspike interval histograms nearly all fall wit4in the range: 4-7 msecirre. spectiveof the rate of spontaneous activity (KlANG et ai., 1965a). A detailed
the conditional probability of spontaneous discharge by GRAY (1967) suggests that a ,cooblear nerve fibre has not compieteiy recovered from the effects of the last discharge until after an interval of about 20 msec.

6 E. F. EvANs: Cochlear Nerve and Cochlear Nucleus
The mechanism underlying the spontaneous discharge is unknown. Apart from the possible case of the most sensitive .units (see Section V.A; WIEDEBJIOLD llJId KuNG, 1970), the influence of background acoustic noise CllJl in the main be excluded.
W ALSR et al. (1972) have suggested that the characteristic irregrilarity of the spontaneous discharge rtrlght relate to the stochastic excitation associated with chemical synaptic transmission:Most "bla:ckbox" models of cochlear nerve aCtiVity incorporate a stoch';stic or probabilistic element in the neuvalspike generation process in order to account for the presence of spontllJleoils activity llJId the stochastic nature of the discharge pattern in response to steady tonal stimuli (see Section VI.A.3).
C. Response to Click Stimuli In theory, a click stimulus has uniform over the
frequency minima at frequencies c0ri:esl'0lldingto multiples of the PUlse duration. Repetitive Collcentrations of energy int,() speQtTallln.OS:spaced at the repetitiol' rate: At the rates of click pre.
experimentS {IO/seeor IElSs),the spectrum CllJl be treated as imifoi'ni .
. In praetice, however, clicks are generated by feeding an electrical pulse to an acoustical transducer. The· spectral distribution is distorted by the frequency response of the system, and the tiIDe pattern of thesthnulils is distoI:terl likewise by delayed i'ellections and the "ringing" charaCteristics of the acoustic system. The introduction of carefrilly damped couplers and .condenser microphones as transducers (e.g. KIANG et al., 1965a; MOLNAR et al., 1968) has minimised this problem.
A click stimulus evokes one or a few spikes discharges in a cochlear fibre (Fig. 3A). Although the time pattern of discharge differs from response to response even for stimuli well above threshold, on average the discharg·es occur at preferred times after the cll!lk, as is shown in the post.stimulus time (PST) ·histogram of Fig. 3B asa function of the time.sincethe click stimulus .. This average pattern of aqtiVity is of fibres with CF. below 3-4 kHz (Fig. 3 B-D). For fibres with. CF above 4 kHz, peripdic nature of .the spike distribution is lost (Fig,3E, F), apparently on account of the temporal "jitter"asspciatejl with the spike generation process (see VI.A.3), Figure 3 also indicates that the time interval between preferred periods is related to the CF of the fibre, and Fig. 4 shows that thisTelation is systematic: the ti.me inter.val correspo;uds to the reciprocal of the OF. Furthermore, the latency.of the first peak of the PST lristogram is an inverse function of the CF (Fig. 5).
These findings are consistent with·a tra veiling wave disturbllJlce of the. basilar membrane that takes time to propagate to the apical (lower frequency) regions of the cochlea llJId which exhibits a more or less damped oscillation to a click transient, the period. of oscillation at a given location corresponding to the latter's optimum frequency.(BEKESY, 1960; FLANAGAN, 1962; ROBLES et al., 1972; "WIi..sON llJId JOHNSTONE,1972). .
c CF: 0.64
o. o
Response to Click Stimuli
A
L -v;.
LIlOO I'V --8 msec
o
B
E
msec
F -" '" ,,"',
••• '
o 8 0 8 0 Bmsec
Fig. SA, ll. Response of single cat cochlear fibre to click stimuli. A: Continuous film record of responses to S successive clicks. Upper traces, record from electrode at round window showing click evoked AP response. Lower traces, spike discharges of fibre. Negativity upwards. Note temporal patterning of spikes. ll: PostStimulus time (PST) histogram showing averaged tempo. ral pattern of activity in response to 600 clicks. OF of fibre 0.54 kHz. C·F: PST Histograms for 4 more cat cochlear fibres of differing OF, in comparison with the AP response recorded from the round window. CFs indicated above plotS. Linear ordinate scale: number of spikes: 256, 128,64 and 128 for c..F, respectively. Note periodic envelope of PST histograms for the fibres with lower OFs (B, C, and D). Data samples, 1 min; clicks presented at same level in each case,
at lO/sec. (From KliNG et m., 1965&)
The earliest observed peak in the PST histogram (vd. Fig. 6) is obtained with rarefaction acoustic transients, i.e.: from a movement of the cochl.ear partition
the scala veBtibuli: With condensation transients, the peaks of the PSTHs occur atthnes which interleave with those for clicks of the opposite polarity (lower halves of each histogram in Fig. 6 compared with upper halv:es). This IS consistent with the conclusion (KIANG et al., 1965a; WEISS, 1966; BRUGGE .et 01., 1969; GOBIJCK llJId PFEIFFER, 1969; Dm'FHUIS, 1970) that excitation corresponds with movements of the basilar membrane (llJId therefore associated hair ceil structures) in one direction only; In fibres with a sufficient rate of spontllJleous activjty, the probability of discharge is reduced during periods corresponding to deflections in the direction. Refractory mechanisms are not entirely responsible for this: the reduction of discharge can appear as the earliest sign of oscillatory actiVity (see Fig. 6: histograms at+5 and 30 dB). In all fibres, the combination of
..

8
u
i u. u
E. F. EVANS: Cochlear·Nerve and Coehlear Nucleus
.. ' . : ..
_I ... _
.' ... Interval between PSTH peaks (msec)
Fig. 4. Plot of reciprocal" of CF against the interval hetween the PST histcgram peaks in response te click stimuli, for 56 cat cochlear fibres (see text). (From KliNG .t al., 1965a)
u '" Vl E
0.1
o
".' , • CAT
o GP
o 0
o 0
o
o.
o . . . .. o 0 • o o •• 0
o o. -: 00. 0 • o _ 0 CfJ . . .
o .... -;::(: .. o •.
00. .oeo. 00
000 00
""
10 Characteristic frequency (kHz)
Fig. 5 (Legend see p. 9)
o 00
50
o +5
+30 +1.0
Response tc Click Stimuli
+10 +20dB
+50 +70dB
: .. ,L ... ;
... r' h"--r-""!"':"-T--'r-r-;
II i a i
.8 msec
i 16
9
Fig. 6. Compound PST histcgrams of responses te click stimuli as a function of click level· Cat coehlear nerve. OF of fibre: 0.47 kHz, Click level expressed in dB relative to the "thresh· o1d" response 1evel. Figure compiJed from histograms of responses to rarefaction clicks and to ecndensation clicks (upper and lower halves of eaehcompound histcgram, respectively). Clicks: 100 !L .. b duration, lO/sec. Ordinate scales: linear number of spikes: 64 for 0-10 dB plots;
128 for 20 dB; 256 for 30-70 dB. (Date from KlANG.I al., 1965&)
PSTHs to transients of opposite polarity to form the compound PST histograms shown in Fig. 6, (GoBLICK and PFEIFFER, 1969) demonstrates most clearly the relationship between neur81 discharge pattern and presumed mechanical events.
Figure 6 8lso demonstrates how the pattern of discharge to a click is dependent upon the level of the stimulus. The positions of the peaks shift relatively little over an intensity ra:rige of 60 dB (KIANG et al., 1965a; GOBLrcir and PFEIFFER, 1969). On the other hand, at higher click levels, their rclative heights change, an earlier peak with a latency of 2-4 rosec appears,and the mode of the histogram occurs earlier.
Fig. 5. Latency of coehlear nerve response to click stimuli for fibres in the cat (filled circles, from KIANG et al., 1965a) and the guinea pig (open circles, from EV .... NS, 1972b) as a function of their OF. 'Rarefaction clicks of 100. jJ.sec and 50 !Lirec duration, respectively, presented at lO/seo, at levels from 20--60 dB and from 20-80 dB, respectively, in electrical terms ahove
minimum tene threshold (within 36 dB of click threshold for the cat date)

E. F. EVANS: Cochlear Nerve and Cochlear Nucleus
The number of spikes ruscharged in response to a click stimulus is a function of the snmulus level and the rate of click repennon (KlANG et ai., 1965a). With level, the average number of spilies ilischarged increases monotomcally towards between one to a few spilies per click (fibres mth low CF approachillg the mgher value) at low rates of repetjj;;on (lO/see).At higher rates, th\l number of spilies evoked per click decreases to an average value of about 0.1 at 1000 clicks/sec. The mean overall ruscharge rate, on the other hand, usually illcreases monotomcally. The maximum .maintained djgcharge rate obtained under opnmum conrutions rarely exceeds 100 spikes/sec for clicks (200/sec for tones) (KlANG et al., 1965a; MOXON, 1968). Direct electrical pulse stimulanon of the cochlea (MOXON, 1968) can evoke maintained discharge rates ill excess of 500/sec. The limit on maintained ruscharge rate, therefore, appears to be set by the cochlear elements peripheral to the site of spilie generation.
D. Response to Single Tonal Stimuli In contrast to the responses of neurones at mgher levels of the auditory system,
the behaviour oisingle cochlear fibreSis relatively simple as a function of frequency, stimulus leyel, and Urne, and the population of fibres is reasonably homogeneous ill respect of these properties. Theouly response observed durillg continuous single tone stimulation is excitation (as ill Fig. 1; cat: KlANG et ai., 1965a; squirrel monkey: ROSE et al., 1969; guinea pig: EVANS, 1972b). The threshold stimulus level evokIDg thls response is a relatively simple function of frequency; the firing rate jg related monotomcally to the stimulus level (except at very high levels, vd. later); the response adapts little mth Urne; the illterspilie interval distribution is consistent mth a Poisson process (Fig. 2E), superimposed on wmch, the temporal pattern of the discharges reflects the period of the sinusoidal stimulus at least for stimulus frequencies up. to about 4 kHz. In short, the response properties of cochlear fibres to tone (and to click- sUrnuli as observed above) can to a first approximation be preructed on the basis of the CF of the fibre (KlANGet al., 1965a; KlANG, 1968).
Exceptions to these generalizations have been proposed, particularly from earlier studies. Thus, TAs.AKI, ill the gllinea pig (1954), and NOMOTO et al., in the monkey (1964), obtsilled data wmch they considered to illrucate that there were two populations of fibres. These fibre populations were djgtinguished on the basis of responsiveness, threshold, shape of frequency threshold curve (FTC) and the firing rate versus stimulus level function. Later experiments mth more adequate control of stimulus parameters have failed to uncover such differences; rather, they have provided the explanations for the earlier discrepant data (e.g. KlANG, 1968; EVANS,1972b). These mil be ruscussed in Sections D.l. and 2. The only other contrary reportS, as far as the present author is.aware, is IDhlbition of the spon-taneous activity of a few cochlear fibres described by RU1'ERT et al. (1963) in the unanaesthetized cat and by KATSUXI et ai. (1962) in the monkey. Although RUPERT et ai, concluded that, on latency grounds, their fibres were primary, the illustrated respbnses have latencies which substantially exceed (by more than 10 msec) those obtailled ill studies on fibres under anaesthesia, and the possibility exists that these fibres were part of; or' were influenced by, the descenrung, efferent
Threshold and Response as a FuDction of Frequency II
system. In the case of tbe latter stndy, it has been suggested by KlANG et ai. (1965a) that the "spontaneous" activity was ill fact evoked by ambient room noise and that the inhibition observed was an example o{ the suppression of stimulus-evoked activity iliscussed ill Section n.E.l.a.
Against the above generalization of homogeneity of the mammalian cochlear nerve, recordillgs from the cochlear nerVe of bullfrog and leopard frog (Fm:sHKOPF and GOLDSTEIN, 1963; L1:FFand GOLDSTEIN, 1970), lizard (JOHNSTONE and JOHN-STONE, 1969) and fish (ENGER, 1963; FURUJi:AWA andISlm, 1967) have demonstmt-ed that at least two types' of fibre can be clearly distingujghed, wmch origillate ill anatomically and functionally separate transducer regions. Thus, ill the frog and lizard, fibres can be separated into a "simple" population wmch cannot be irihibited by tonal stimuli and a "complex" population whose response to tonal or vibmtory stimuli can be so inhibited. In fish, VIIlth nerve fibres have been sub-divided illto two groups on the basis of their rate of adaptation to sound stimuli. Nevertheless, these different p.opulations can also be distinguished on the basis of the CFs of the fibres, and fibres mth similar CFs share similar properties.
I..Threshold and Response as a Function of Frequency Rapid determinati.ons of threshold of cochlear fibres as aiunction of frequency
can be made by a variety of methods: by scanlling across the relevant frequency range mth continuous tones (Fig. 7), by 'the classIcal manner of successively approximating the frequency of a gated tone (with finite rue and fall Urne to avoid transients) towardS the .optimal frequency at each intensity until a change in rate of ruscharge is detected (Fig; 9);or by autbmatic.or semi-automatic methods of "tracillg" the 'threshold as the. stimulatillg tone moves continuously across the responsive region (KIANG et al., ·1970; EVANS et al., 1970). These methods yield consistentresults (e.g. KIANG et al., 1965a), although small illexplicable changes ill pure tone and noise threshold from mIDute to minute have been observed in some fibres, ill contrast to their "neighbours" (EVANS, ROSENEERG, and WILSON, unpublished results). The arbitrary choice of a "threshold" criterion (e.g. the boundary of the response area ill Fig. 7) enables the frequency threshold ("tun-illg") curve (FTC) to be delIDeated. The frequency correspondIDg to the mIDimum threshold (tip) of the FTC defines the "characteristic frequency" (CF) of the fibre.
Early studies of the minimum thresholdS of cochlear fibres led to the conclusions that they were mdely distributed (over a range as great as 60 dB) at any frequency (e.g. KIANG et ai., 1965a) or that they fell into two groups of high and low threshold correspondIDg to fibres innervating. inner and outer hair cells respectively (e.g. KATSUXI et al., 1962). Subsequently, KIANG (1968) has shown that. when sufficient data ate collected from a single cat cochlear nerve (i.e. are not pooled across ears and animals) the rustribu:tion pf thresholds becomes restricted to less than 20 dB at any frequency (Fig. 8). Withill tms limited range, there is some tendency for fibres With the lowest. spontaneous discharge rates to have the mghest thresholds (KlANG et al., 1970). While there are considerable variations in djgtribution from
animal, the neural thresholdS approach the average behavioral threshold for that species, mth the exception of the higher frequencies (Fig. 8, interrupted lille). These findIDgs have been confirmed in the cat by EVANS et al. (1970, and to
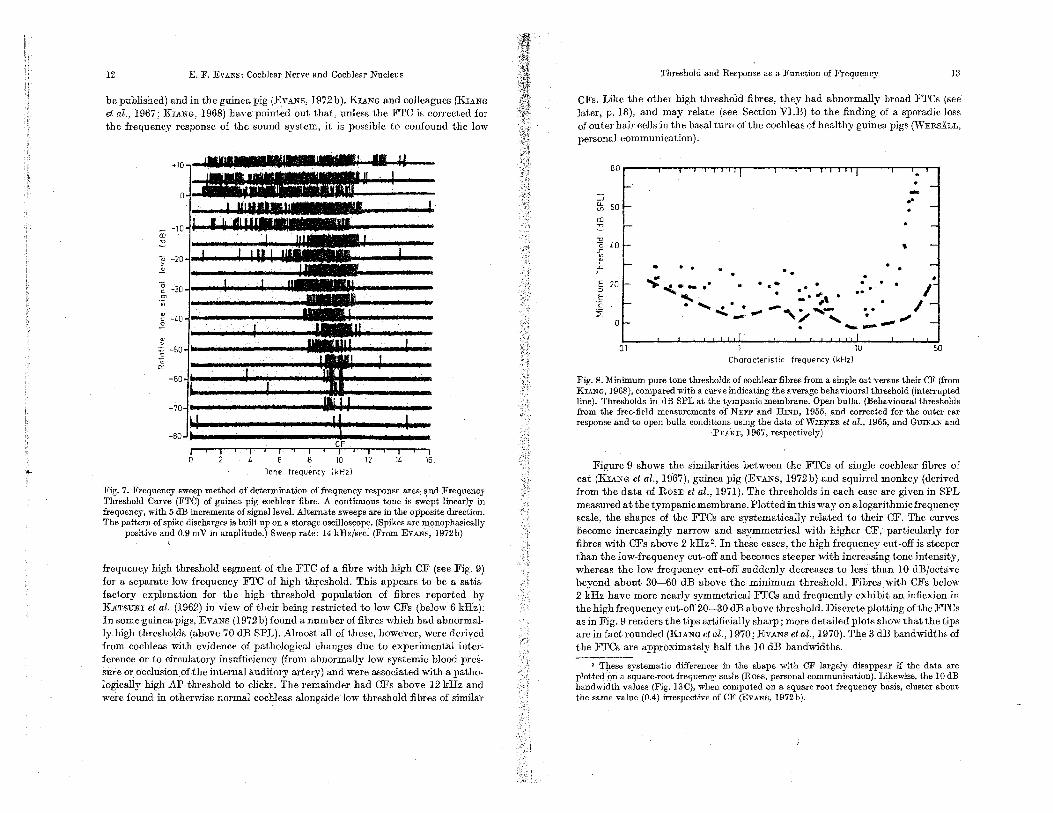
12 E. F. EVANS: Cochlear Nerve and CochleaT Nucleus
be publisbed) and in the guinea pig (EVANS, 1972b). KuNG and colleagues (KrANG ef al., 1967; KIANG, 1968) have pointed out that, unless the FTC is cOlTected for the frequency response of the sound system, it is possible to confound the low
OJ
] 0 c '" . -40 c 0 .
.. ........ " .. · 0;
'" ...
14 16 10ne frequency
Fig. 7. Frequency swe.ep method of determination of frequency response area Frequency Th:reshold Curve (FTC) of guinea. pig cochlear fibre. A continuous tone is swept linearly in frequency, with 5 dB increments of signal level. Alternate sweeps are in the opposite direction. The pattern of spike discharges is built up on a storage osciJ]oscope. (Spikes are lllonophasjcally
positive and 0.9 mV in amplitude.) Sweep rate: 14 kHz/sec. (From EVANS, 1972b)
frequency high threshold segment of the FTC of a fibre with high CF (see Fig. 9) for a separate low frequency FTC of high threshold. This appears to be a. satis-factory explanation for the high threshold population of fibres reported by KATsmrr et al. (1962) in view of their being restricted to low CFs (below 6 kHz). In some guinea. pigs, EVANS (1972 b) found a number of fibres which had abnormal-lyhigh thresholds (above 70 dB SPL). Almost all of these, however, were derived from cochleas with evidence of pathological changes due to experimental inter-ference or to circulatory insufficiency (from abnormally low systemic blood pres-sure or occlusion of the internal auditory artery) and were associated with a patho-logically high AP threshold to clicks. The remainder ha.d CFs above 12 kHz and were found in otherwise normal cochleas alongside low threshold fibres of similar
Threshold a,nd Response as a, Function of Frequency 13
CFs. Like the other high threshold fibres, they had abnormally broad FTCs (see later, p. 18), and may relate (see Section VI.B) to the finding of a sporadic loss of outer hair cells in the basal turn of the cochleas of healthy guinea pigs (WERSALL, personal communication).
80
-' -' "- 50 -V1
<lJ '0 -'0 a 40 -l - . . E 20 - ... :0 E
f-::;:
Oi-
01
. . .. " . .
'1 . -.. --
-. .. . . I " ... .... _ ... ... e-;,. _
-"\. """ . . I / ,-.:...- ..... -
1 ,I 10 50
Characteristic frequency (kHz)
Fig. 8. J\.iinimum pure tone thresholds of cochlear fibres from a single cat versus their CF (from KUNG, 1968), compared with a curve indicating the average behavioural threshold (interrupted line). Thresholds in dB SPL at the tympanic membrane. Open bulla. (Behavioural th:resholds from the free-field measurements of NEFF and HIND, 1955, and corrected for the outer ear response and to open bul1a conditions using the data of V\TIENER et al., ] 965, and GUINAN and
·PEA..KE, 1967, respectively)
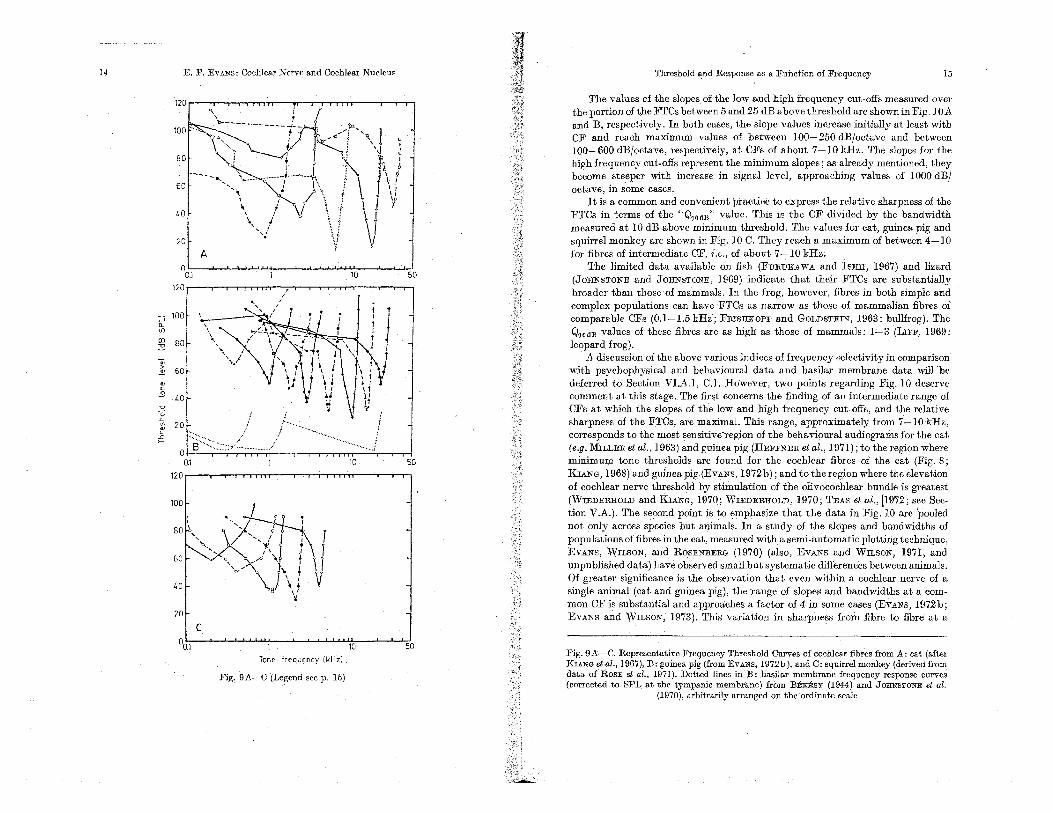
Figure 9 shows tbe similarities between the FTCs of single cochlear fibres of cat (KuNG et al., 1967), guinea pig (EVANS, 1972b) and squilTel monkey (derived from the data of ROSE et al., 1971). The thresholds in each case are given in SPL measured at the tympanic membrane. Plotted in this wayan alogarithmic frequency scale, the shapes of the FTCs are systematically related to their CF. The curves become increasingly nalTow and asymmetrical with bigher CF, particularly for fibres with CFs above 2 kHz '. In these cases, the high frequency cut-off is steeper than the low-frequency cut-off and becomes steeper with increasing tone intensity, whereas the low frequency cut-off suddenly decreases to less than 10 dB/octave beyond about 30-60 dB above the minimum threshold. Fibres witb CFs below 2 kHz have more nearly symmetrical FTCs and frequently exhibit an inflexion in tbe high frequency cut-off20-30 dB above threshold. Discrete plotting of tbe FTCs as in Fig. 9 renders the tips artificially sharp; more detailed plots show that the tips are in fact rounded (KIANG etal., 1970; EVANS etal., 1970). The 3 dB bandwidths of the FTCs are approximately half the 10 dB bandwidths.
2 These systema.tic differences in the shape with OF largely disappear if the data are plotted· on a frequency scale (Ross, personal communication). Likewjse, the 10 dB bandwidth values (Fig. 130), when computed on a square root frequency basis, cluster about. tbe same value (0.4) irrespective of CF (EVANS, 1972b).
14 E. F. EVANS: CochleaJ" Nerve and Cochlear Nucleus
:::; 100 ll. Vl aJ 80 ::s 0;
60
c .B 40
20 ....... . ..if .l ....................................... .
(l1 10 50
20
c 10 50
Tone frequency I kHz)
Fig, 9A-C (Legend see p. 15)
Threshold and Response as a Fililct;on of Frequency 15
The values of the slopes. of the low and high frequency cut-offs measured over the portion of the FTCs between 5 and 25 dB above threshold are shown in Fig. lOA and B, respectively. In both cases, the slope values increase initially at least weith CF and reach maximum vaJues of between 100-250 dB/octave and between l00-600dB/ociave, respectively, at CFs of about 7-10 kHz. The slopes for the high frequency cut-offs represent the minimum slopes; as already mentioned, they become steeper weith increase in signal level, approaching values of 1000 dB/ octave', in some cases.
It is a common and convenient practice to express the relative sharpness of the FTCs in terms of the "Q,odB" value. This is the CF divided by the bandweidth measured at 10 dB above minimum threshold. The vaJues for cat, guinea pig and squirrel monkey are shown in Fig. 10 C. They reach a maximum of between 4-1 0 for fibres of intermediate CF, i.e., of about 7-10 kHz.
The limited data available on fish (FuRUKAWA and ISHII, 1967) and lizard (JOHNSTONE and JOHNSTONE, 1969) indicate that their FTCs are substantially broader than those of maJnmals. In the frog, however, fibres in both simple and complex populations can have 'FTCs as narrow as those of mammalian fibres of comparable CFs (0.1-1.5 kHz; Fru:SHKoPF and GOLDSTEIN, 1963: bullfrog). The Q,odil vaJuesof these fibres are as high as those of mammaJs: 1-3 (luFF, 1969: leopard frog).
A discussion of the above various indices of frequency selectivity in comparison' weith psychophysical and behavioural data and basilar membrane data weill -be deferred to Section VI.A.l, C.1. However, two points regarding Fig. 10 deserve comment at this stage. The first concerns the finding of an intermediate range of CFs at which the slopes of the low and high frequency cut.offs, and ,the relative sllarpness of the FTCs, are maxinlal. This range, approximately from 7-10 kHz, corresponds to the most sensitive'region of the behavioural audiograms for the cat (e.g. MILLER et al., Hi63) and guinea pig (HEFFNER et aI., 1971); to the region where minimum tone thresholds are found for the cochlear fibres of the cat (Fig. 8; KIANG, 1968) and guinea pig (EvANS, 1972b); and to the region where the elevation of cochlear nerve threshold by stimulation of the olivocochlear bundle is greatest (WIEDEllJIOLD and KIANG, 1970; WIEDERHOLD, 1970; TEAs et aI., 11972; see Sec-tion V.A.). The second point is to emphasize that the data in Fig. 10 are 'pooled not only across species but animaJs. In a study of the, slopes and bandweidths of populations of fibres in the cat, measured weith a semi-automatic plotting technique, EVANS, WiLSON, and ROSENBERG (1970) (also, EVANS and Wn,sON; 1971, and unpublished data) have observed small but systematic differences between animals. Of greater significance is the observation that even weithin a cochlear nerve of a single animaJ (cat and guinea pig), the range of slopes and bandweidths at a com-mon CF is substantial and approaches a factor of 4 in some cases (EVANS, 1972b; EVANS and WILSON, '1973). This variation in sharpness from fibre to fibre at a
Fig. 9A-C. Representative Frequency Threshold Curves of cochleaJ" fibres from A: cat (after KliNG etal., 1967),13: guinea pig (fromEvANs, 1972b), and C: squirrel monkey (derived from data or ROSE et al., 1971). Dotted lines in 13: basilar membrane frequency response curves (corrected to SPL at the tympanic membrane) from 13Ensy (1944) and JOHNSTONE et al.
(1970), arhitrarily arranged on the ordinate soale

16 E. F. EVANs: Cochlear Nerve and Cochlear Nucleus
common CF correlates to some extent (at least in the guinea pig) with the thresh-old of the fibre. Thus, the lower the threshold, the sharper the FTC tends to be
, (EVANS, 1972b; EVANS and WlLSON, 1973). On top of the systematic variation in shape ·of the FTC of cochlear fibres with
their CF (as plotted on a logarithmicfrequency scale), therefore, there are variations from fibre to fibre and from animal to animal. The latter, non-systematic, varia-tions, (at least in the material of KIANG et al., 1965a, 1967; EVANS et al., 1970, in the cat; EVANS, 1972]), in the guinea pig) do not fall into two well-defined popu-lations, as was reported by KATSUKI et al. (1959) for the cat. The latter authors descrihed two kinds of response area: symmetrical and asymmetrical, which appeared to correlate to a certain extent with high and low threshold, respectively, and which were held to relate to the innervation of inner and outer hair cells. As has already been mentioned, it is clear that the high threshold, symmetrical, FTCs of low CF may be accounted for by the absence of correction of their FTCs for the response of the sound system at the tympanic membrane. Similar considera-tionsmay be responsible for the remaining differences in shape of FTCs of higher CF in their data, or they would appear to represent the extremes of the variation
--' ..0 g 200
m
'" c-o Ui
<; , "8 100
u: ..J
A 0
0.1
. " .. ,.
.. ':.J.,.", . " ... . . ...... .• v! .. r-. •• ..:j. . ,.¥. '. '-= I .' • -,.... ..... . .. -:. . .:" ..
• • • .: ·-·t •• • c. •
.. ...... ..... ..... ...... ............ -A-..... ..... . 1 10 Fig. lOA
.
50
Fig. lOA-C. Measurements of slopes of low frequency cut-offs (A), high freqoeucy cut-off's (B), aod relative sharpness (C),ofFTCs of oochlear fibresfrQm cat, guinea pig, and squirrel monkey, versus their CF. S]opes"nieasU'rBd region dB apove"minimum threshold. Relative sharpness measured as the Q,'oB value, i.e.: CF/bandwidth of FTC at 10 dB above minimum threshold. Symbols indicats animal and source. Cn: cochlear nerve data for cat, from EVANS and WILSON, 1971; guinea pig (GP) from EVANS, 1972b, and squirrel monkey (SM) from Fig. 9 C. Small open circles: values for fibres with pathologically high thresholds in guinea pig (see text). Star syinbols: analogous measur-ements from basilar membrane frequency response data of VON BEnsy (1944: B) in guinea pig, RHODE (1971,1973: R) in squirrel monkey;
WILSON and JOHNSTONE (1972: W) and. JOHNSTONE et 01. (1970): J) in guinea pig
1l in ::: .. c-o -;;;
'0 , il u: :I
ro "0
'" o
600
500
300
200
100
0 0.1
14
12
10
6
c 0.1
B
Threshold and Response as a Function of Frequency
,.
... .'" .:. ..- .. : . .. . .' o ....• " ....... . .:,.: , . . .
,. (i:") y. .' 0 QJ.'. '/0.. •• or:;o, " •• • • •• I. • • .-
. . :,.-.. 7' • "*' (,!···Q.······O . .:J '-a .;' Q, ••••••••••• • •••••••• * • 0 ............ 1lJ. 0 q, 0
o
10 Characteristic frequency {kH2J
cn:. CAT
'0 GP
o SM
bm:* B IGPJ
-{::{ RISMJ
o WIGPJ
* J IGPJ
. .- .... . . . . . . t:. e. • ...,,,owt;.., • ':. •• II.. .,
•••• :.. t' a.:. a. .\ .. ;1 ...... . ·l..·'It.=:·o.·.· ... • • 'Va: ..... ._
f'.(; :.' '. • •• a. .;,: 0
-.,['" I • 0 ... . • .1 0 & .. . .@ ...... ,* ... .............. ••••••••••••••••••
10 Characteristic frequency {kH21
Fig. JOB and C
o
17
50
-
--
50

18 E. F. EVANS: Cochlear Nerve and Cochlear Nucleus
noted above. In this connection, it is of interest that the same authors were unable to differentiate into two groups, on the basis of shape, cochlear fibres in the monkey, on account of the "variety of intermediate types" (KATSUKI et al, 1962, p. 1402).
In all of the above considerations, the group of fibres mentioned earlier (p. 13) with pathologically high thresholds (i.c.: above 70 dB SPL) has been excluded. These were obtained in the guinea pig only, under conditions of apparent and pre-sumed cochlear pathology (EVANS, 1972b). The FTCs of these fibres are clearly anomalous, being very broadly tuned, and resemble the normal FTC, shown in Fig.9B but with the narrowly tuned lower threshold tip section (20-40 dB) missing. Measurements of the cut-off slopes and the relative sharpness of these fibres are given as the open circles in Fig. 10A-C, indicate their anomalous degree of tuning.
That anoxia can selectively decrease the sharpness of tuning of single cochlear fibres has been shown in recent experiments in the cat (EVANS, 1974a, c). Revers-ible loss of the low threshold, sharply tuned segment of the FTC, leaving behind the high threshold broadly tuned segment, can occur after only a few minutes of hypoxia. Local instillation of KCN (at concentrations of less than 10-3 M) into the scala tympani, or intra-arterial injection of Frusemide, a potent OtOtOXlC dlUretlC, can produce identical reversible effects on the FTC without apparent action on the cochlear microphonic (EVANS and KLINKE, 1974; EVANS, 1974c, d). Other mfluen-ces can also modify the threshold and shape of the FTC. Electrical stimulation of the olivo cochlear bundle and prior exposure to long-term high level tonal stimuli at the CF cause a relatively greater elevation of the threshold at the CF than at other frequencies; that is to say, the FTC becomes less sharp (KiANG et al., 1970). The addition of background noise at increasing levels produces a progressive elevation in the tip of the FTC (KiANG el. al., 1965), but without suhstantia110ss of tip bandwidth until saturation of the discharge rate makes determination of response threshold difficult (EVANS, 1974d). It is interestmg that under cond,tIOns of continuous noise stimulation, the saturation discharge rate becomes progressIvely reduced as the level of background noise is raised (EVANS, 1974d).
Complementary to the above descriptions of the frequency of cochlear fibres, are representations of their frequency response, response rate versus frequency curves, (FRCs). These have been studied in most detail by ROSE and his coworkers in the squirrel monkey (ROSE et al., 1967,1971; Hnm et at., 1967; HIND, 1972), and examples are shown in Fig. ll. Each curve depicts the avelage main-tained discharge rate (measured over several seconds continuous wne stimulation) as a function of frequency at a constant sound pressure level at the tympanic memhrane. The FTCs of Fig. 9C were obtained from these iso-intensity rate curves by plotting the frequencies and stimulus levels evoking a constant rate of response near threshold, in other words by using as a criterion of "threshold", an isorate condition just above the spontaneous firing rate.
The considerahly different appearance of these curves from the FTCs arises partly from the linear frequency scale, hut mainly from the manifest non-linearity of the response rate as a· function of stimulus level, with its limited dynamic range, which will be described in detail in the next section. Thus, comparing the FRCs of Figs. II C and 12A, from two fibres of similar CF, the two sets of curves look very dif-ferent. Fig. 12C, however, shows that the FTCs derivable from the two sets of data
u
:Y
'" "2 '" [" c
0
Threshold and Response as a Function of Frequency 19
(Curves c and a respectively) are in fact very similar. Figure 12B shows, from the same fibre as 12A, a plot based on the number of discharges synchronized to the stimulus waveform (see Section II.D.4). It has been claimed (ROSE et al., 1971; l\10LLER, 1972) that the differences hetween the plots of Fig. 12A and B indicate that the frequency selectivity is much more pronounced with respect to stimulus
A B 200 c
50
1.0 0.5
F 0 E
150 150 150
100 100 100
50 50
15 2.7 0 50 W 5 Tone frequency 1kHz)
Fig. 11. Iso-intensity frequency response curves of 6 squirrel monkey cochlear fibres. Mean rate of discharge to several, seconds of continuous stimulation at frequencies and intensities (in dB SPL) indicated. Note linear frequency scale and different expansions. Range of spon. taneous discharge rates and means indicated by brackets and M (or arrow) respectively. ,:rrianguJar points: no significant degree of s;ynchronization of activity to cycles of stimulus,
(From ROSE et al., 1971)
locking than to mean discharge rate. Figure 12C, Curve b, however, sbowsa plot analogous to a FTC derived from the curves of Fig. 12B using a constant syn-chronized rate criterion (50 synchronized spikes/sec). (The ordinates of the two plots have been shifted for convenient comparison.) If anything, the "synchronized isorate contour" (Curve b in Fig. 12C) is less sharp than the FTC hased on a mean rate criterion (Curve a).
Similarly, it has heen claimed that the hroadening of the FTCs with increase in stimulus level is an indication of degradation of cochlear filtering properties at suprathresho1d levels. If, however, isorate contours with higher rate criteria are plotted as in Fig. 13, these do not exhibit systematic changes in shape and band-
1.5

20
u 150 ., :n ::< 100 '0. "' '0 ij; 50
.D E '" z
..J 0... If)
lD "0
100
80
60
1.0
20
E. F. EvANS: Cochlear Nerve and Cochlear. Nucleus
A mean B synchronized
75dBo5
150
_65 ,<::::95
C
75 -65 .-55
LL...:......;"...-....,:--'---c-=--'·- "dB 0.5 ·1.5 2D 0
Tone frequency (kHz)
- 100 0.:
0 '" t--:'\ 1·_ 80 \. b\, i
c'. , i I ""'\ .vi ..... A - 60
" 'j ..J 0... If)
lD
1 "0
- 1.0
- 20
Tone frequency (kHz)
Fig. 12 A-C. :Rela.tionship between FRCs (using mean and synchronized rate measures), FTC and analogous plots. Squirrel monkey cochlear nerve. A: Iso.mtenslty fre-quency response curves for a· .cochlear fibre with a high spontaneous discharge. rate (range and mean indicated to right of plots). B: plots of the "synchronized': discharge rate for same fibre, i.e.: the number of spikes discharged during the more effectIve half-cycle of the stImulus minus the number during t:p.e less effective half-cycle, expressed as a rate per sec. (From ROSE et al., 1971.) C: intensity versus frequency curves (analogous to. FTC but using threshold res]lonse Criteria) derived fromFRCs of A and B WIth !TC of a fibre WIth. low spontaneoUs discharge rate (derived from Fig. 11 C). (a) (open CIrcles): Iso-rate contour for discharge rate of 120 spikes/sec (20% above spontaneous rate) for frequency response. curves in A.· (b) (open squares): contour for rate of derived from frequency response curves in B. (c) (filled CIrcles): FTC derIved from Iso-mtenslty frequency response curVes of Fig. 11 C(8 spikes/sec criterion of "threshold"). Cu,;es a and c use the right hand ordmate. Note similarity between the 3 FTCs, compared WIth marked
difi'erences:between the iso-intensity frequency response plots
Response as a Function of Intensity 21
width, at least within the range of stimulus levels before saturation of the rate response precludes accurate measurement. The isorate data of SACHS and KIANG (1968) also support this conclusion. Above these relatively high levels, the filtering properties may indeed deteriorate; the evidence for this and the consequences will be discussed later (Section VI.A.!).
100
BO :J !l. V)
<D "C
60
] . c
'" .0
20 0.1 10
Tone frequen·cy (kHz)
Fig. 13a, h. Iso-rate response contours. for two cochJeat: Mean discharge rate, in spikes/ sec, indicated above respective curve. a: Cat (EVANS, ROSENBERG, and Wn.sON, unpublished data). Mean sJlOntaneous rate: 50 spikes/sec. b: Squirrel monkey; derived from Fig. HE (data from ROSE et oZ., 1971). Negligible spontaneous discharge rate. The differenoe in band-width between it and b probably reflects individual variation and that with CF, rather than
any species difference (see Fig. fO)
In sui:runary, the above considerations the care necessary to relate and interpret various measures of cochlear fibre activity as a fUllction of frequency. Viewed thus, the data point more to systematic changes in shape of the cochlea.r filtering characteristic with the CF of a fibre than to differing individual character-istics suggestive of differences in cochlear innervation pattern, as suggested by HmD (1972) on the basis of FRO data alone. The FTC and suprathreshold isorate data indicate the characteristics of the cochlear filter function from which has been eliminated the non-linear response characteristics of the cochlear nerve excitation process. The FRC, on the other hand, indicates the limite which may be set upon the central representation of the cochlear filtering by the non-linear rate behaviour of the cochlear fibres. In particular, it indicates the surprisingly limited dynamic range of the system through which, in terms of discharge rate, the results of peri-pheral filtering are transmitted to the central regions of the auditory nervous system, at leaSt in the anaesthetized animal (see Section VI.D.l).
2. Response as a Function of Intensity To. a .first approximation, the discharge rate of a cochlear fibre is a monotonic
function of stimulus intensity, as sho:wn in Fig. 14 (KATSUlU et al., 1962; NOMOTO et al., 1964; KIANG et al., 1965a; KIANG, 1968; EVANS, 1974d)_ The maximum

22 E. F. EvANS: NeI"Ve and Cochlear Nucleus
rate, arid dynamic tange, like the spontaneous discharge rate, differs from fibre to fibre; but, generally, the higher the spontaneou.s rate, the .higher the maXimum discharge rate (K:uNG et al., 1965a). The dynamic range, in terms of stimulus. level, rariges from 20-50 dB. Fignre 14A shows that the rate· intensity function for a single fibre may also differ to a small extent depending on the stimulus frequency (EVANS, ROSENBERG, and WILSON, un-published observations; EVANS, 1974d).ln general, for frequencies at and above the CF, or as in Fig. 14A Olily above the CF, the functions are less steep than those for frequencies below the CF. Not all fibres show these systematic dif-
200
100
.!!! 0 ! 10
.:H :: '" '" 1; .
-::; 200
is
;00
kHz 01.2 IJ, 1..1. <> 1.7 o 2:2 CF • 2.4 • 26 • 2.8 ·.3.0
A 20
kHz 08.0 • 9.0 <> 9.5 v 10.0 o 10.6 CF • 11.0 · 11.5 • 12.0
B
30 40 50 60 70
dB SPL
Fig,'14. Discharge rate versus stimulus intensity cW'Ves for two cat cochlear fibres, with OFs of 2.2 kH.z fibre .s.in Fig. 13a) and 10.6 kHz (B). Open.symbols and interrupted
for at. ?r OF; filled ?in,e.s, frequencies above' OF .. Note: in' A, differences of:rate :between ' freqruinciesabove. and helow the OF. ROSENllERG, and WILSON, unpublished data)
Response as a Function of Time 23
ferencies with frequency (Fig. 14B). Similar rate functions are illustrated by WIEDERHOLD (1970; Fig. 6), and can be derived from the data of ROSE et al. (1971). This dependence of the rate function on frequency is likely to be responsible for the systematic shift of the peak discharge rate of some FRCs lower frequencies with increase in stimulus level above threshold (e.g. see Fig.lIC-E).
NOMOTO et al. (1964) described two groups of fibres possessing what was termed a "crossed-ramp" and ramp" type of rate-intensity function respectively. These two types are consistent with those of Fig. 14A and B respectively, although the data of ·NoMoTo et 01. are less complete. NOMoTo et al. regarded the existence of the two types as evideDce for different kinds of cochlear fibres; specifically, the external spiral and internal radial fibres respectively. This speculation however, has not been well received (e.g. KIANG at al., 1965a). Clearly, there is room for a more systematic study of these rate functions and their significance.
At very high stimulus levels (90 dB SPL and above) the maintained discharge rate can de.crease with increase in·stimulus level, i.e. ; the rate response becomes non-monotonic; KIANG et al. (1969) and K:uNG and MOXON (1972) have reported a curious phenonienon at these levels, where within a few dB; the discharge rate drops towards the spontaneous rate and rises again to a maximum. This notch in the rate-intensity function is found ill fibres of widely differing CF at comparable sound pressure levels, although it is said to occur at somewhat lower levels for tones below the CF. Its be accounted for by interference between two-out-of-phase excitation processes, one with low threshold accountingfor the lower portion of the rate intensity function, and a higher threshold process responsible for the portion above approximately 90 dB SPL .. In support of this _hypothesis, for fibres of low CF imd at low frequencies (where phase relations can be observed), substantial changes in the relative phase of the discharge pattern occur as the stimulus level is raised through the region of the notch. (See also discussion in Section V1.B).
3. Response as a Function of Time Figure 15 shows the typical time-course of discharge of cochlear fibres to short
duration tone (A) and noise stimuli (B). The rate of firing reaches a maximum within a few msec of stimulus onset and adapts at a increasingly slower rate with time. At the cessation of the stimulus, the firing rate drops beiow the spontaneous level transiently before recovery (as in Fig. I). This pattern of response is charac-teristicof all cochlear fibres and, in qualitative terms, is relatively independent of the nature and parameters of the stimulus, i.e. tone, noise, frequency and intensity, and whether the efferent innervation of the cochlea is intact or not (Fig. 15B; KIANG et 0,1., 1965a; KIANG, 1968). However, the magnitudes of the transient excitation and suppression, following the onset and termination of the stimulus, depent on the level, and for the transient suppression, on the duration of the tonal stimulus; Thus, near threshold, the former becomes less (Fig. 15B, -70 dB); whereas the duration and degree of the latter increase with the level and duration of the signal.

24 E. F. EVANS: Cochlear Nerve and Cochlear Nucleus
4.98 1.82 10.34 kHz
"'1"
L ... .. L.
iI.:J·· .. ·:I---! 1 sec
-70
:]Hi4±;:, -60 -50
I Noiso I Fig. 15A, B. of response of cat cochlear fibres to tone and noise bursts. PST histograms. A: 4 differeut .fibres of the CF indicated. Linear ordinate scale, number of spikes per pin; 2 min da.ta; tone a.t CF, 0.5 sec presented l/see. B: Effect of Ieve} ofstimu]us on time-course (similar for tones and noise bursts). 50 msec noise burst beginning approx. 2.5 msec after zero time of PST, repet.ition rate: lO/sec. Relative signaJ level indicated above
each PST histogram. (From IlliNG et al., 1965a)
4. Response to Low Frequency Tones Responses of cochlear fibres to tones of frequency lower than 4-5 kHz pre-
ferentially occur during a restricted segment of the cycle of the sinusoidal stimulus, i.e. the discharges are "phase. locked" : Fig. 16, (TASAlU, 1954 in the' guinea pig; RmERT et 01.,1963; KIANG et al., 1965a in the cat; KATSmU et 01.,1962; ROSE et al., 1967 in the monkey; FRISHKOl'FF and GOLDSTEIN, 1963 in the bullfrog; FuRUKAWA and ISIDI, 1967 in the fish). This phenomenon has been studied most thoroughly by ROSE and his colleagues in the squirrel monkey cochlear nerve (ROSE et 01., 1967, 1968, 1971; ANDERSON et al., 1971; HIND, 1972).
The probability of discharge of a fibre (irrespective of its CF) to a sufficiently intense low frequency tone appears to be a function of the displacement of the cochlear partition in one direction (Figs. 16B, 17, 18). Thus "folded" time histo· grams ("period histograms"), of the distribution of discharges relative to the period of the stimulus sinusoid, mirror the effective half.cycle of the stimulus (Figs. 17 and 18), and a compound histogram (Fig. 16B) can be constructed by repeating the analysis with inversion of the polarity of the stimulus (ARTHUR et al., 1971). Thus, while the mean discharge rate is given by the FRC, the cadence of discharge is governed by the cadence of the stimulus cycles and the ability of the fibre to "follow" the stimulus (Fig. 17).
B· • N'\ .IM j :. i
16A, B. Synchronization of responses of cochlear fibres to lOW-frequency tones. A: COD-tmuous fil;>, of response of gninea pig fibre to tone of 0.3 kHz, near threshold. B: com. pound perlOd histcgram (see text) of response of cat cochlear fibre to continuous tone at CF of 1..498 kHz, 63 dB SPL. (From et al.., 1971..) Waveform of stimulus tone superimposed.
Contmuous tone of 76 sec duration
40
20
! kH2,96C>J .. 162/5ec
3kHz,66% 1461 sec
2 kHz, 83'!. 122/5ec
4 kHz,5B% 179/5ec
Time (1'5ecl
2.5kH2J 73% 124/50c
5 kHz,56% 174/50c
Fig,,) 7. Degree. of synchronization of response cochlear ·fibre to tones of differing frequency. SqUIrrel CF of fibre: 4 kHz. Tones presented at 90 dB SPL at frequencies indicated above perlOd hIstograms. Scale of each histcgram and bin width adjusted to span one period of
tone. Ordinate scales: percentage of the total number of spikes falJing in respective bll:, figure above histogram: "coefficient of synchronization" i.e. number of
m most effective h.alf.cycle as percentage of total (100% = complete synchroni. 50% = no discharge rate in spikes/s,ec indicated over each
Note max.lmum of 'synchronization to lowest frequencY; progressive reduc. tlOn m degree Wlth mcrease In tone frequency. Spontaneous discharge rate: 64 spikes/sec.
(From ROSE et al., 1967)

26 E. F. EVANS: Cochlea,r Nerve and Cochlear Nucleus
Figure 17 shows the progressive loss of synchronization between discharge pat-tern and stimulus cycle as the stimulus frequency is increased. In the case illustrat-ed, this loss occurs in spite of the greater effectiveness of the higher frequencies in terms of the mean discharge rate. In the experience of ROSE et aI., (1967), phase-loclting fades out for most fibres for frequencies above 4-5ltHz though they do report significant synchronization in some fibres at frequencies up to 12 kHz.
50 60 dB
.D 70 80 gOdS
Fig. 18. Synchronization of response of cochlear fibre with level at OF (1.1 Squirrel monkey. Stimulus level in dB SPL indicated above each penod Pe:lOd of histogram: 912 f.Lsec._Histograms fitted by sinusoids of constant phase dIffermg amplitudes. Note preservation of stimulus waveform period histogram even at level: above level producing saturation of the Tate response (70 dB SPL); The FRO of thIS fibre IS shown m
Fig. 11 C. (From ROSE ef 01., 1971)
Many spontaneously discharging fibres display a detectable degree of phase synchronization at stimulus levels 10-20 dB below the thrcshold for'an increase in mean discharge rate (ROSE ef al., 1967; EVANS, 1972b). This synchronization, in addition, is maintained at stimulus levels above those producing a saturation of the mean discharge rate (Fig. 18). These considerations mean that the dynamic range over which phaselocking is obtained is far in excess of the 20-50 dB limit for the mean discharge rate.
It is clear from Fig. 16 A and from interspike interval histogram analyses (Fig. 19) that a fibre does not discharge once every cycle of a low frequency stimulus waveform but predominantly to integral multiples of the waveform cycle (ROSE et al., 1967). Exceptions to this generalization occur at very low stimulus frequencies where multiple discharges .sometimes occur, and at higher frequencies, where the refractoriness of the fibre eliminates interspike intervals below about 0.7 msec (ROSE et al., 1967). At lower stimulus levels (or at frequencies where the stimuli are less effective, as in Fig. 19A, F), there is an increase in the relative pro-portion of longer intervals, corresponding to the decrease in mean rate. It is clear that, for intervals longer than 0.5 msec, it is not refractoriness which determmes
I '0 w
E z
Response to Low Frequency Tones 27
whether or not a cycle is effective. ROSE et al. (1967) calculated the conditional probability of discharge and found it to be nearly constant at anyone frequency ,:rrespect,:ve (after the refractory interval) of when the previoW! dischat"{!e occurred. In their words (ROSE et al., 1968) " ... a sinusoidal stimulus acts in general as if it consisted of as many individual stimuli as there are cycles". They concluded, therefore, that the events determining the effectiveness of a cycle took place peripheral to the spike generation process which is assumed to be responsible for the properties of refractoriness.
A B c 120 j O"OSkHz
)' i.O kHz j 72/sec
60 i 1
4 .. J J , 10 15 20
.. .... ; ... ', ... ' ... o 10 15
D
1201 1.5 kHz
23"/ sec
J 0
0 .. '0 ..... 'le)' is' ... 20
E 2.0 kHz
178/ sec
20
10 Duration of interval (msec J
10
F 2.3 kHz 83/ sec
15
Fig. 19. Interspike interv-al distributions of response of sirtgle cochlear fibre to- tones at. dif. monkey. frequency :md mean response rate (in spikes/sec)
mdlCated a,hove each hIstogram. Intenslty of all tones: 80 dB SPL; tone duration:. 1 sec. Data comprise responses to 10 presentations of stimulus. :Bin width: 100 !-lsee. Dots below abscissa. indjcate integral mulUples of period of stimulating tone. CF: approJ( 1.6 kHz. Note different
time scales of E and F. (From ROSE ef al., 1968)
20
The phase of the stimulus cycle a.t which the probability of discharge is maxi-mum differs systematically from fibre to fibre according to the CF, and, for a single fibre,according to the stimulus frequency and MOLNAR, 1970; ANDER-SONet al., 1971). PFEIFFER and MOLNAR (1970) computed the phase lag (relative to the round window Cl\i) of the fundamental component from Fourier analysis of period histograms obtained from cat cochlear fibres. For fibres of CF lower than 2 kHz, this was an approximately linear function of frequency, although a better

28 E. F. EVANS: Cochlear Nerve and Cochlear Nucleus
fit to the data wae ohtained by two straight lines intersecting at a point close to the CF in some but not all cases (Fig. 20). For fibres with CF a.bove about 1.1 kHz, the phase lag increased more rapidly wit,h frequency for frequencies above the CF; for fibres with lower CF, the reverse tended to occur. GOLDSTEIN et a/. (1971) have
'6 11 } 'D C
'j; 'D C e :" 0;
!? ID
0 .c 0..
Tone frequency 1kHz)
Fig. 20. Phase of response synchroniza,tion relative to round window cochlear microphonic potentia} for II cochlear fibres from the cat. Computed by Fourier transform of period histo-grams obtained at different frequencles of continuous tone stimulation at constant intensity. OF of fibres (in kHz) given above each plot. Note break-point occurring at about CF for each fibre. II, III, IV: phase characteristics of cochlear microphonic potential recorded by differ-ential electrodes in second, third, and fourth turn, respectively, of guinea pig cochlea. (From
PFEIFFER and MOLNAR, 1970)
reported similar findings. From more limited data in the squirrel monkey, ANDER· SON ef al. (1971) obtained linear phase versus frequency plots from which they derived a total time delay (acoustic plus cochlear plus neural) for each fibre (Fig. 21A). On the assumptions that the middle ear transmission delay could be neglected, and that the neural transmission amounted to 1 mscc (the asymptote of Fig. 21 A), they obtained the estimated "travel times" of the cochlear disturbance to the points of innervation of the cochlear partition shown in Fig. 21 B. The interpretation of this "travel time" is, however, made difficult by the suggestion
Response to Low Frequency Tones 29
of GOLDSTEIN et al. (1971) and DUIFHllS (1972) that the measured delay must include a fa.ctor corresponding to the "respollse time" of the cochlear filter (see Section VIAl).
In contrast to the behaviour with frequency, PFEIFFER and MOLNAR (1970) and ANDERSON et aI., (1971) showed that the phase lag between response and stimulus was relatively unaffected by stimulus level. For most fibres studied in the material of ANDERSON et al. (1971), the phase lag increased stimulus level (less than
" no
E
i g: E 'D no '0
w
" no on E
10
G.l
A
. . ,-. . •• oJ' .. ,
·s -, •• ., .. . . .. 100
B
. •
o'
10 100 Characteristic frequency 1kHz)
Fig. 21. A: Delay times of synchronized spike responses. 58 cochlear fibres in squirrel monkey. Delays from slope of phase versus frequency curves (as in Fig. 20) for each fibre, and plotted agamst CF. of fi?re. Values corrected for acoustic delay in sound system, and, there-fore, travel tIme III cochlea plus synaptic and neural conduction delays. B: Cochlear traveJ tlmes calculated from data of A, after subtracting] rusec average neural delay estimated from asymptote of A (interrupted line), and plotted against each fibre's CP. (From ANDERSON
ef al., 1971)

30 E. F. EVANs: Cochlear Nerve and Cochlear Nuc]eus
90') for frequencies below the CF, and vice-versa" At frequencies at or near the CF, little or no change of relative phase with level occurred (e,g. Fig. 18). On the other hand, as has already been mentioned (Section II.D.2), at very high stimulus levels very large changes in response. phase have been reported to accompany dramatic changes in the discharge rate (KIANG et al., 1969; PFEIFFER and MOLNAR', 1970).
A consideration of these findings in relation to questions of cochlear mechanics and innerva,tion will be deferred to Section VLA. and B.
E. Response to Complex Sounds
1. Two-tone Stimuli a) Two-tone Suppression. Perhaps the best known phenomenon arising from
the interaction between two tones at tbis level is that, known as two-tone inhibition or suppression, which is found in many species (monkey: NOMOTO et al., 1964; HIND et.al., 1967; fmg: FRISHKOPF and GOLDSTEIN, 1963; LIFF and GOLnSTEIN, 1970; bat: FRISHKOPF, 1964; cat: KIANG et a.l., 1965a; KIANG, 1968; SACHS and KIANG, 1968; SACHS, I 969; ARTHUR et al., 1971). As will be made clear subsequent-ly, the term suppression is to be preferred, to distinguish the phenomenon at the cochlear nerve from that with different characteristics at the cochlear nucleus and higher levels of the auditory system, where lateral inhibitory influences can be clearly inferred (e.g. GALAMBOS, 1944; GREENWOOD and MARUYAMA, 1965).
The phenomenon entails the suppression of activity evoked by one stimulus (tone or noise) by a second tone over a restricted range offreqnencies and intensities (Fig. 22). Its properties have been described in detail by SACHS and KIANG (1968), and ARTHUR ef al. (1971). The former authors were ahle to demonstra,te suppression in every fibre examined (ct. NOMOTO et al., 1964)_ The situation most commonly examined is where the response to a continuous tone (CT) at the CF of a fibre is reduced by a second tone, generally of higher level; within a band of frequencies adjacent to or even slightly overlapping the excitatory response area of the fibre (Fig. 22B). This implies that the second, (suppressing) tone can, on its own, produce either no response or excitation (Fig. 22A, C). Figure 22B also indicates the asymmetry of the suppressive frequency bands, extending down towards the CT intensity only on the high frequency side. There is some evidence that with an exciting CT stimulus at a higher level, the suppressive frequency bands are shifted vertically upwards from the situation shown in Fig. 22B, so that the degree of overlap is greater (NOMOTO ef al., 1964).
There is a non-monotonic relationship between the response to, and the inten-sity of, the "suppressing" tone (Fig. 22C; ARTHUR et al., 1971). This would he expected as the latter progressed through the suppressive sideband into the ex-citatdry response area (vertically upwards in Fig. 22B).
HIND ef al. (1967), BRUGGE et al. (1969), and ARTHUR et al. (1971) have shown that the discharge pattern under conditioris of two-tone suppression retains phase: locked information of both tones. Thus compound period histograms (vd. Fig. 16B)
Two-tone Stimuli 31
obtained under these conditions can be approximated by a waveform containing the two frequency components comprising the stimulus (as in Fig. 24).
The suppression has a latency of the same ordci' as excitation, i.e_ it occurs within a few msec of the onset of the suppressing tone (NOMOTO et al., 1964; ARTHUR et al., 1971). For the initial part of the suppressing tone, the, suppression
TB -' n. U1 (l)
:0' TS -0
" TC ] A
dB 75
'n=' Tone frequency 1kHz)
65 .+-.. !ttl
55 ... 11111111
1,5 II. .111.11 35 .. Lnr 25 IIU IIIltM
1--1 f---i TS C CT
li'ig. 22A-C. Two-tone suppression in cochlear fibres. A: continuous film records of response of fibre to tone burst (TB) at 0.8 kHz, 80 dB SPL (upper record) and to identical tone burst superimposed upon exciting continuous tone (OT) at 11.3 kHz, 77 dB SPL (lower record). Monkey. (From NOMOTO et al., 1964.) B: Frequency response areas of single.tone excitation (open circles) and of tones which suppress response to continuous tone of the frequency and level indicated by the triangle (filled circles and hatched areas). Continuous outlines represent "threshold" response criteria of mare than 20% above the spontaneous discharge rate and 200/0 below the response to the CT alone for excitatory and suppressive areas, respectively. Cat. (From A;RTHUR et al., 1971.) C: PST histograms of response to 100 msce tone bursts alone (left) and superimposed OD continuous tone at OF (right) as a function oflevel of tone burst. Contino uous tone: 8.08 kHz, 28 dB SPL; tone burst frequency: 8.893 kHz. Repetition rate: 5J.ec.
Average of 128 responses. Time bar: 50 msec. Oat. (From ARTHURe! al., 1971)

32 E. F. EVANS: Cochlear Nerve and Cochlear Nucleus
may be complet,e, but a greater or lesser degree of adaptation ensues. The time course of this "adaptation" is generally slower than that of excitation of the fibre (Fig. 22; LIFF and GOLDSTEIN, 1970). On termination of the suppressing tone, a prominant rebound of discharge occurs (Fig. 22 C) comparable to the excitatory transient at the beginning of the response to a steady tone.
A matter of some controversy (e.g. MOUSHEGIANet al., 1971) is whether two tone suppression can produce a maintained depression of the activity of a fibre below the spontaneou.s discharge level. SACHS and KIANG (1968) claimed that this did not occur for more than the initial several hundreds of msec, although certain of their records (e.g. Fig. 2, - 40 dB of SACHS and KUNG, 1968) suggest that it can occur for a few seconds, at least. All the above observations are, however, con-sistent with the hypothesis (ARTHUR et al., 1971) that the initial suppression below the spontaneous discharge rate is characteristic of the cochlear fibre behaviour which follows the termination of excitation, i.e. postexcitatory depression (Section II.D.3). On this basis, the time-course of the suppression below the spontaneous level will depend upon the duration of the excitation preceding the onset of the two-tone suppression. The fact that, in the usual two· tone suppression paradigm, there has been at least several seconds of continous excitation before the application of the suppressing tone would ensure that in these circumstances the time Course of the suppression below the spontu.lWOUf level would exceed that of excitation (as observed by LIFF and GOLDSTEIN, 1970). In the case of the data of SACHS and KIANG (1968), the unsuppressed excitation had been continuously present for over 20 sec before the onset of the suppressing tone. This explanation also enables an understanding of the observation of NOMOTO et al. (1964) that when the time order of the stimuli was interchanged, i.e. a tone burst at the CF was superimposed on a continuous tone which was suppressive in the usual two-tone paradigm, a transient suppression below the spontaneous level was not obtaiued. The suppression pro-duced in the two-tone situation, therefore, occurs as if the exciting tone had merely been interrupted or abruptly attenuated. On this view, the transient total suppres-sion and the transient excitatory "overshoot" corresponding to the onset and termination, respectively, of the suppressing tone are both effects idCl.'tical to those occurring when a single exciting tone is turned off and on, respectively.
The mechanism by which the effects of an exciting tone are suppressed is still obscure. It is clear that it does not involve the descending efferent (inhibitory) pathway, because two· tone suppression can be recorded from fibres in the periph-eral stump of the sectioned cochlear nerve (FmsHKoPF and GOLDSTEIN, 1963; KIANG et al., 1965a) and after section of the crossed and uncrossed olivocochlear tracts and their subsequent degeneration (KIANG, 1968). The anatomical (e.g. SPOENDLIN, 1971) a,nd physiological evidence is equally overwhebning against a lateral inhibitory mechanism involving synaptic connections between hair cells and/or afferent fibres. Thus, the latency, time-course, and quantitative character-istics differ from those associated with lateral inhibition in other systems, e.g. Limulus eye (FURMAN and FRISHKOPF, 1964; SACHS, 1969; LIFF and GOLDSTEIN, 1970; ARTHUR et al., 1971). Furthermore, the application of strychnine is without effect (NOMOTO et al., 1964). The possibility exists, however, of electrotonic inter-action between the nnmyelinated segments of outer spiral and inner radial fibres at the habenula perforata, where the two sets of fibres become intimately opposed
33
(e.g. SPOENDLIN, 1972). ARTHUR et al. (1971) have suggested that any interaction must occur peripheral to the stage of rectification associated with generator or a,ction potential init.iation, because of the preservation of waveform interaction in the spike discharge })atterns. However, SACHS (1969) claims that a shunting model of interaction (e.g. FURMAN and FmsHKoPF, 1964) is not supported quantItatIVely by the data on two-tone suppression. An alternative possibility has been suggested by the similarities between two-tone suppression in the cochlear nerve and an ana.]ogous reduction of the cochlear microphonic, where the latter could be modelled qualitatively by a system comprising a non-linearity associated with one or two filtering processes (ENGERBRETSON and ELDREDGE, 1968; PFEIF-FER, 1970). In PFEIFFER'S model, designed to account for two-tone suppression at the cochlear nerve level, the nonlinearity is sandwiched bet.ween an input filter of low frequency selectivity (equivalent to that of the basilar membrane) and an output filter with a sharper frequency selectivity (equivalent to that of the FTC). The model generated asymmetric suppressive side bands overlapping the ex-cJl;atory response area, and, in addition, a significant intermodulation distortion component at a frequency of 2/, - /, (where /, and /, are the frequencies of tI,e two primary tones). This product is in fact observed at the cochlear nerve level (GOLDSTEIN and KlANG, 1968; see below).
b) EXcitation!)y Tone Combinations. NOMOTO et al. (1964) Were the first to demonstrate that two tones of appropriately differing frequencies, neither of which alone excited a cochlear fibre, could, when presented together, nervertheless evoke a response. This phenomenon has since been investigated in detail by GOLDSTEIN and KIANG (1968) and hy GOLDSTEIN (1970, 1972) who have shown its relation to the most conspicuous combina.tion tone perceived under these conditions; namely one of frequency 2/, - /" where I, and /, are the frequencies of the primary tones and where 1 < /2//' < 2. Two examples are ShaWl) in Fig. 23, where the frequencies of response area of the fibre are so arranged that the frequency 21, - I. cornOldes Wlth the CF of the fibre. A brisk response is obtained, which in the case of the fibre of low CF is time-locked to the cycle of a reference 2 f - 1 signal generated electrically from the two primary signals (Fig. 23B). ,.
The response to the tone combination behaves as if a component of the 21, - I, frequency were actually present in the stimulus (GOLDSTEIN and KuNG, 1968). Thus, the responses are phase-locked to individual cycles of a reference 2 I - I signal (when the combination tone frequency was below 4 kHz) as in Fig. 23B; the synchronized responses can be cancelled by adding a tone of appropriate phase and frequency 21, - I. to the stimulus ensemble; the response discharge rate shows a similar dependence upon signal level as for single tone stimuli.
In other aspects also the cochlear fibre data are analogous to psychophysical data (ZWICKER, 1955; GOLDSTEIN, 1967, 1970). In particular, the degree of synchronization of the cochlear nerve activity with the 2 I, - I, frequency is not strongly dependent upon stimulus level, as if the stimulus contained a combination tone with nearly constant relative amplitude. Furthermore, the response to the combination tone decrements with separation of the frequency of the primaries at an estimated rate of the order of 100 dB per octave and above, in terms of equiva-lent stimulus change (GOLDSTEIN and KlANG, 1968) and the level of a cancelling 21, - 'I, tone (GOLDSTEIN, 1970). This frequency dependence indicates that the site

34
SP
E. F. EVANS: Cochlear Nerve and Cochlear Nucleus
A
' .... !,. ... .,. !d,*, "edt
,,'".t",'; hi
f1
B
2001' .... . f1 + f2 : .: .: .: li: ::. · . ... . .... · .. · ..
o '. I o msec
Fig. 23A, B. Excitation of cat occhlear fibres by ocmbination tone 2/,- I, (see text). A: Time histograms of spike activity in presence of: no stimulation (SP); tone 1 alone, at 10.00 kHz, 59 dB SPL (I,); tone 2 alone, at 12.15 kHz, 69 dB SPL (I,); Tone 1 and tone 2 together (/, + I;)· Presentation time and duration of the two tone bursts i.ndicated under lowest histogram. &petition rate: 10/oec. Note vigorous response to combination of tones (21, - I, fails on OF of fibre: 7.88 kHz) in comparison with negligible response to either tone aione. B: Period histograms ofresporioetotwotones alone (1,: 5.5 kHz and,!.: 4.13 kHz) and to combined tones (I, + I,); of fibre with low CF (2.69 kHz). Each histogram is synchronized to the fundamental frequency ofthe hll.l'IDonicaJly related (4 :, 3) primary tones. The response to the tone combina-tion exhibits a ,period of synchTonizatJon equal to about half the histogram period, i.e.: COJTe-.ponding to the '2/,":': I. combination tone (2.76 kHz), close to the CF of the fibre. Spon-
taneous rate: 5 spikes/sec. (From GDLDSTEIN and KIANG, 1968)
Two-tone Stimuli 35
.of the generation .of the distortiDn prDduct must be central to the middle ear (because .of the latter's relatively level frequency respDnse) and that the prDcess respDnsible fDr the distDrtiDn must be nDt simple DverlDading but an "essential" (i.e. level-nDrmalized) Ddd-Drder nDnlinearity (GoLDSTEIN and KuNG, 1968; GDLD-STEIN, 1970)_ In .one CuriDUS respect, hDwever, the neurDphysiDIDgical and pSyChD-physical data disagree: the measured phase .of the psychDphysical cDmbinatiDn tDne changes with the level .of the primary stimuli, whereas that .obtained in the cDchlear nerve recordings dDes nDt (GDLDSTEIN, 1971: QPR ND. 100, p.202; GDLDSTEIN, 1972). There is as yet nD explanatiDn fDr this discrepancy.
There have been attempts tD aCCDunt fDr SDme, at least, .of these phenDmena .on the basis .of the nDn-linear threshDld detector mechanism in the cochlear nerve spike generatiDn process (DE BOER et al., 1969). Such a process alDne, cDuld nDt, however, accDunt fDr the excitatiDn .of a fibre by a combinatiDn .of tWD tDnes, each .outside the response area. In addition, the hypothesis of DE BOER et 01. (1969) is nDt cDnsistent with the .other physiological findings, in particular: the absence of cubic intermDdulation prDducts higher than the primary frequencies predicted by the hypDthesis (DE BDER, 1970, p. 246); the observed degree .of synchrDny of cDchlear fibres to the combination tone compDnent (GOLDSTEIN, 1972); and the interspike interval histograms .obtained by GDLDSTEIN and KuNG (1968), (HA.LL 1971).
BDERGER and GRUllER (1970) have reported that some but not all cDchlear fibres of low OF in the'cat could be excited by multicompDnent signals consistJng of the 3rd to 6th harmonics of a fundamental which coincided with the OF, but which was absent from the signal (i.e. a "residue" or "missing fundamental" signal). NDne of the cDmponents, individually, evoked responses, whereas respDnses could be evoked by the cDmposite signal at levels comparable to the threshold level for tones at the OF. These lDW reiative thresholds were obtained from fibres with low OFs, i.e. about 0.2 kHz. The absolute levels were well below those expected to produce significant amounts of difference tDne through distortion in the ear (see e.g. GDLDSTEIN, 1970). BDERGER and GRUllER have suggested that this phenDme-nDl) may be related to the perceptiDn of the "missingiundaDlental" with similar stimnli by man. On the face .of it, this wDuld seem unlikely, in view .of the finding (LICKLIDER, 1954) that whereas the percept can be masked by signals at the frequencies .of the cDmponents, it cannDt be masked by signals at the frequency of the perceived fundamentaL
c) Interaction of Responses to Two Tones: Lineax and Non"linear Aspects. A detailed investigatiDn of the effects .of two tone stimulation on the discharge pattern of the cDchlear fibres of the squirrel monkey, with analogous techniques to thDse described in Section ll_DA above, has been made in ROSE'S labDratory (HIND et al., 1967; RDSE et al., 1968; BRUGGE et al., 1969; ROSE et 01.; 1969; RDSE, 1970; HIND et al., 1970). The findings appear to hold for tones which are related or unrelated harmonicalJy. The above authDrs have shown that, within certain limits,
. time-pattern of disch,arges reflects, to a first approximation, a rectified versiDn of the ",aveform of the combined stimulus tones.
FigUre 24 illustrates the nature of the interaction when the relative amplitude (A) and relative phase (B) of the two component tones is varied .over appropi'i8.te

36
A
f, (0798 kHz) 80
f2 (1.064 kHz) 100
E. F. EVANS: Cochlear Nerve and Cochlear Nucleus
80 90
80 80
80 dB
70 SPL
Fig. 24A, B. Interaction of two tones as a function of relati:e amplitude and phase. A: Period histograms of activity of a squirrel monkey cochlear fibre III of kHz at fixed intensity (80 dB SPL) combined with a 1.064 kHz tone at mtensltles: (l) 100 dB S!,L, (2) 90 dBSPL, (3) 80 dB SPL, and (4) 70dB SPL. ofresponses to two presentatJOns oftolle combination, each of 10 sec duratIOn. DUTatlOn ofhlstogram correspo:r:ds to the perlOd of the fundamental frequency of the two harmonically related (3: 4) tones (M.: 0.266 kHz). Ordina,te: linear number of spikes in respectjve hin. Note almost complete dommatlOn of dischaI'ge patterns by more intense tone in 1 and 4. Each is fitted by a ,;a,veform obtained by linear addition of the two primary waveforms (f 1 and t 2) In the as that for the waveforms fitting the responses to each primary alone, but at arbItrary relatIve amplit.udes (see text). (From BRUGGE et. al., 1969.) B: Compound period hlstograIllB of activity of a cat cochlear fibre in response to a combination of two exciting tones of frequenCIes 0.538 and 0.807 kHz. Relative phase between primary stimulus tones indicated above the Lower half of each hjstogram obtained by repeating ana,lysis with polarity of stimulus Inverted in a manner analogous to that of Figs. 6 and 1613. (Duration of the histograms to the period of the fundamental frequency of the two (2: 3) 2.C.: 0.269 kHz.) \Vaveforms beneath histograms obtained by Imear of two waveforms at. fixed (arbitrary) amplitudes and of the same relatIve phase as m the stImulus, leading to the response indicated in the appropriate period histogram. (From GOELICK and
PFEIFFER, 1969)
values. Interaction occurs over a range of relative intensities restricted to 20 to 30 dB. At each end of the range, the discharge pattern (as indicated by the period histogram) is dominated hy the more effective tone. 'l.'hus, in the case illnstrated hy Fig. 24, this occurs when the 12 tone is 20 dB higher in level than the I, tone (Fig. 24, A.l) and when the level of I, is 10 dB higher than that of I, (FIg. 24, A.4).
Stimuli 37
At intermediate rela.tive levels, the discharge pattern reflects the interaction between the two component tones. These discharge patterns can be fitted, to a first approximation, hy a linear addition of two waveforms of the same frequencies of the stimulus tones hut of arhitrarily chosen relative amplitude and phase, as
by the superimposed waveforms of Fig. 24A. Within this limited range of relative stimulus levels, ROSE et al. (1971) showed that a reasonahle fit could he ohtained by adjnsting the amplitudes of the matching sinusoidal components in the same ratio as in the stimulus. From this, it would appear that the amplitude ratio of the effective stimulating waveform of the cochlear transdnction process changes very nearly as the ratio in the delivered sound.
Likewise, cbanges in the relative phase of the two stimulus components (Fig. 24B) introduces changes in the discharge pat,tern which can be fitted hy linear addition of two sinusoids with the same changes in relative phase (BRUGGE et al., 1969; GOBLICK and PFEIFFER, 1969). In many cases, good fits could he ohtained to the empirical comhined i,one period histograms by using as a starting point the phase of fits to the responses to the individual tones.
These patterns of interaction descrihed ahove are maintained over a wide range of ahsolute levels of the two component stimuli, even at high levels where the discharge rate of the fihre is saturated. Under the latter conditions, the period histograms indicate that the complex waveform is preserved at the excitation process (as in the single tone situation illustrated in Fig. 18) in spite of saturation of the spike generation process (BRUGGE €I 01., 1969).
Intera.ction between two tones can be demonstrated a.t frequencies inside and outside the frequency response area for the fihre. The ahsolute stimnlus levels required for interaction to occur, however, appear to he related to the frequency response area, but not in a simple fashion (Hnen et a.1., 1(67). It a.ppears from the data of HIND et al. (1967) that, for frequencies well inside the response area, the levels of a tone required for it to achieve a certain degree of synchronization of the response in the presence of another effective tone are to a large extent governed by its effectiveness in driving the fihre on its own. This is not the case for peripheral frequencies, however, which can he more effective in terms of their dominating of the discharge pattern that their rate response would predict.
Indeed, tones at peripheral freqnencies which have no effect on their own on the discharge rate can nevertheless dominate the discharge pattern. In this con-nection, HIND et a.l. (1970) made the interesting ohservation that under these con-ditions, the discharge rate evoked by the combined stimuli tends towards the rate for the tone alone which is dominating the discharge pa.ttern. Thus, the discharge rate to comhined stimuli can be suhstantially less than that for the most effective tone alone, if the latter is paired with a tone of peripheral frequency which alone is relatively ineffective. The possihle relationship of this to the two-tone suppression phenomenon discussed ahove has heen suggested hy HIND et al. (1970). It is clear from their data, however, that domination of the discharge rate by a second tone of peripheral frequency can occur even when the discharge pattern has not heen dominated hy the second tone.
Thus, stimulation of a fibre (66-107-2 in HINn et al., 1967, Ta.ble I) with a second tone of 3 kHz at 90 dB SPL reduced the discharge raj,e to 54%, whereas the coefficient of synchroni-zation of the discha,rge pattern to the second t.one was only 57.9% , compared with a value of

38 E. F. EVANS: Cochlear Nerve a.nd Cochlear Nucleus
870;; for the other tone. (500/0 = no synchronization; "100%" = complete }?or °comparison, a, tone of 3 kHz at 80 dB SPL ha.d no significant effect on dIscharge rate and gave a, synchronization coefflcient of 55% •
A clear understanding of these interaction phenomena obviously awaits further
data. . ff t' Another curious feature of the interactions is that the relatlve e ee lYeness of the constituents of a two-tone combination depends on the absolute level of the two. If a given relative level difference is maintained while the absolute levels are changed, both the relative phase and ampl:tudes of matchmg stituent waveforms have to be adjusted for the combmatJOn to fit the perJOd histograms. In particular, HIND et al. (1967), BRUGGE et al. (1969), and. ROSE et al. (1971) observed that the component of a tone pair which was less effectlYe at lower stimulus levels could dominate the discharge pattern of the response at hlgher levels. This non.linearity in relative effectiveness of phase-loekmg amount;:'d to 5-12 dB when the levels of both components tones were changed by 5.0- ,0 dB (ROSE et al., 1971), Over a smaller dynamic range, e.g. 20 dB, and phase non-linearities become negligible (as already noted). It lS mterestmg to note that, in the illustrated examples of this phenomenon m above reports, the initially Hless effective" tone was the lower frequency tone ill.each case.
From a study of the interspike interval distributions obtamed under two tone stimulation, ROSE et al. (1969) observed tha,t the predominant intervals correspond-ed, as would be expected, to that of the period of the stiniulating waveform ex-cursions. It was concluded that the proba,bility of occurrence of a spike dlscharge was a function of the amplitude of the excursion (in one direction only). Thus, when one or other primary dominated the response to the com tones, pre-dominant intervals were grouped around the integral multlples of the penod of that primary. On the other hand, when the two tones contributed about equally to the combined response, the predominant intervals corresponded to the overall period of the complex sound (i.e. that of the fundamental frequency of two harmonically related tones), or integral multiples thereof. In numbers of intervals were observed corresponding to frequenCles hlgher than the lower primary. The values of these latter intervals were critically dependent upon the relative phase and amplitude of the primaries, in contrast to those correspond-ing to the fundamental period.
The possible significance of the above on the patte:-ns of :-esponse .evoked by stimulation with more than one tone, inrelatlOn to the codmg of.mformatlOn pm-taining to perceived combination tones will be discussed later (SectlOn VLC.3., D.l).
It must be emphasised that the above data were obtained under conditions of maintained (ca. 10 sec) stimulation (including the response to the onset of the tone). While it does seem unlikely that the conclusions denved Wll1 not hold for stimuli of shorter duration, some of the more puzzling features (e.g. m relatIOn to the rate response) could conceivably be determined by adaptation phenomena.
2. Noise Stimuli 1'he responses of cochlear fibres to broadband noise have been
analysed in two different ways, both of which have gIven nse to slmllar concluSIOns on the nature of the cochlear filter.
Noise Stimuli 39
The first approach has examined the time-structure of the suprathreshold discharge pattern of cat cochlear fibres and its correlation with the waveform of the noise stimulus (DE BOER, 1968, 1969,1970; DE BOER and JONGKEES, 1968). By an ingenjous procedure of Hreverse" or "triggered" correlation, where the cross-correlation function between the waveform of the noise stimulus and the ensuing spike discharge pattern is computed, these authors have been able to derive the impulse response of an hypothetical lineal' cochlear filtering system "seen through" the non-linear excitation process of the cochlear nerve (DE BOER and KUYPER, 1968). From the impulse response, the frequency response of an equivalent linear filter was computed and found to approximate to the observed pure tone FTC within the 10-20 dB range of the method. In other words, under broadband conditions, the discharge pattern is determined by a filtered version of the noise signal, the characteristics of the filter approximating to that of the FTC of the fibre. This result is of course limited to fibres with CFs below 4 kHz, as beyond this frequency, the phase-locking of the discharge pattern to the stimulus drops out. This correspondence between the computed filtcr function and the FTC obtained for a relatively wide range of noise levels, in one case, over a range to 60 dB above threshold (DE BOER 1969, 1970). DE BOER andDE JONGH (1971) and DE JONGH (1972) have simulated the hypothetical filter (computed from the cross-corre-lationfunction between noise stimulus and spike discharge pattern), used this simu-lated filter to filter a pseudorandom (i.e. repetitive) noise waveform, and then compa-red the actnalmoments of discharge with this filtered waveform. A result of such a
Fig.--26. Time-pattern of discharges of cat cochlear fibre to pseudo-random broadband noise stimulus. Bars: time histogram of average number of I3pike discharges related of the period of repetition of the pseudo-random Doi,se stimulus. Waveform: filtered version to the stimulus waveform. Characteristics of the filtering operation simulate those of the particular cochlear
fibre whose responses are indicated in the superimposed histogram (see text). (From DE;r ONGH, 1972)
comparison averaged over many repetitionsofthe waveform is shown inFig.25. W'hi-Ie the authors interpret their data in terms of the efficacy of "zero crossings" of the waveform, the similarity between this situation and that described in SectionII.D.4 and E.l above is such to suggest the more obvious explanation that, to a first approximation, the probability of discharge is proportional to the amplitude of unidirectional excursions of the filtered waveform presumed to be acting at the site of excitation (see Section VLA.3).
In this cOmiection, it is interesting to note that a better fit between the :filtered waveform and the spike discharge would have been obtained if the waveform had been subjected to a.
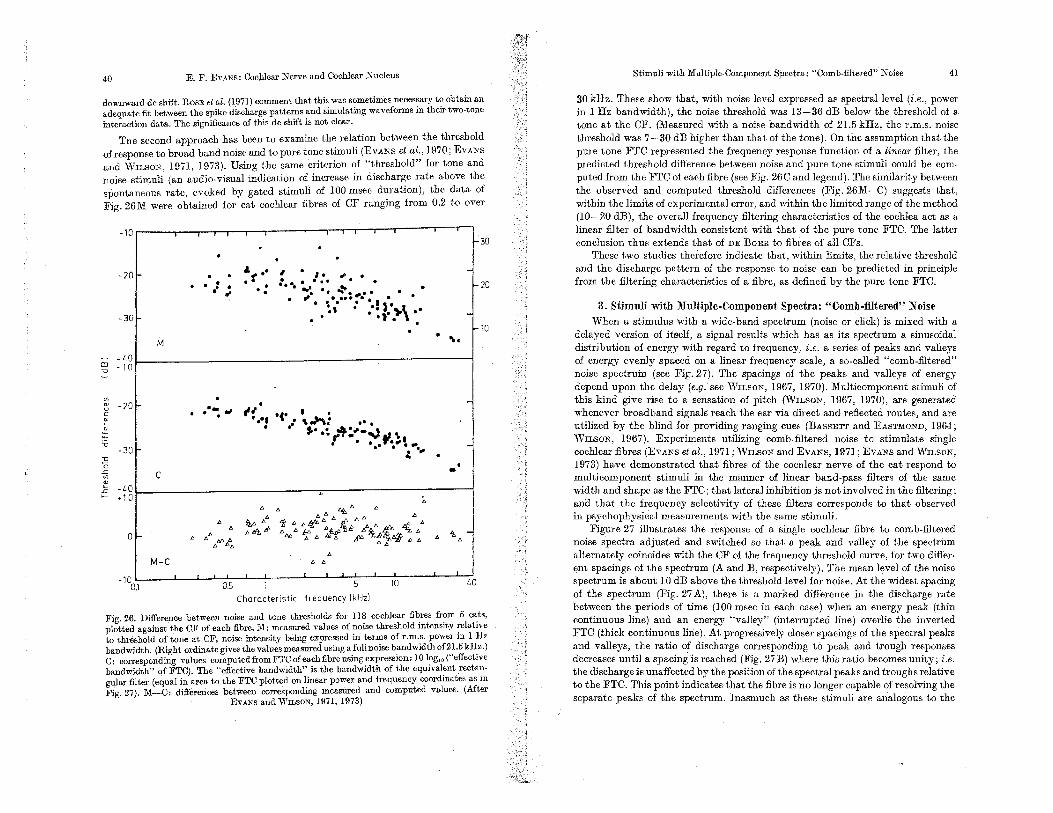
40 E. F. EvANS: Cochlear Nerve and Cochlear Nucleus
downward dc shift. ROSE et al. (1971) comment that this was sometimes necessary to obtain an adequate fit between the spike clischarge patterns and simulating wa,veforms in their two·tone interaction data. The significance of this de shift is not clear.
The second approach has beento examine the relation between the threshold of response to broad band noise and to pure tone stimuli (EVANS et al., 1970; EvANS and WILSON, 1971, 1973). Using the same criterion of "threshold" for tone and noise stimuli (an audio-visual indication of increase in discharge rate above the spontaneous rate, evoked by gated stimuli of 100 msec duration), the data of Fig. 26M were obtained for cat cochlear fibres of CF ranging from 0.2 to over
-20
-30
M
. . . . : . . .". ... ' .f .. . , • J' "".' :... . ..,. . • e •• -:.,..... • ••
• \. •• I ... , .
-
. • 'I..
ro
'" -20 c: '" '0
-30
. ...
Characteristic frequency 1kHz)
30
20
10
Fig. 26. Dilference between noise and tone thresholds for liS cochlear fibres from 5 eats, plotted against the OF of each fibre. M: measured values of noise threshold intensity to threshold of tone at OF, noise intensity being expressed III terms of r.m.s. power In 1 Hz bandwidth. (Right ordinate gives the values measured using a full noise bandwidth of 21.5 kHz.) C: corresponding values computed from FTC of each fibre using expression:, 10 log" ("effective bandwidth" of FTC). The "effective bandwidth" is the bandwidth of the equivalentrectan-gular filter (equal in area to the FTC plotted on linear power and frequency coordinate. as in Fig. 27). M--C: differences between corresponding measured and computed values. (After
EVANS and Wn.sON, 1971, 1973)
Stimuli with Mult,jple-Component Spectra: "Comb-filtered" Noise 41
30 kHz. These show that, with noise level expressed as spectral level (i.e., power in ) Hz bandwidth), the noise threshold was 13-36 dB below the threshold of a tone at the CF. (Measured with a noise bandwidth of 21.5 kHz, the Lm.s. noise threshold was 7-30 dB higher than that of the tone). On the assumption that the pure tone FTC represented the frequency response function of a linear filter, the predicted threshold difference between noise and pure tone stimuli could be com-puted from the FTC of each fibre (see Fig. 26C and legend). The similarity between the observed and compnted threshold differences (Fig. 26M-C) suggests that,
the linoits of experimental error, and within the limited range of the method (10-20 dB), the overall frequency filtering characteristics of the cochlea act as a linear filter of bandwidth consistent with that of the pure tone FTC. The lattsr conclusion thus extends that of DE BOER to fibres of all CFs.
These t,wo studies therefore indicate that, within limits, the relative threshold and the discharge pattern of the response to noise can be predicted in principle from the filtering characteristics of a fibre, as defined by the pure tone FTC.
3. Stimuli with Multiple-Component Spectra: "Comb-filtered" Noise When a stimulus a wide-band spectrum (noise or click) is mixed with a
delayed version of itself, a signal results which has as its spectrum a sinusoidal distribution of energy with regard to frequency, i.e. a series of peaks and valleys of energy evenly spaced on a linear frequency scale, a so-called "comb-filtered" noise spectrum (see Fig.27). The spacings of the peaks and valleys of energy depend upon the delay (e.g.' see WILSON, 1967, 1970). Multicomponent stimuli of this kind give rise to a sensation of pitch (WILSON, 1967, 1970), are generated whenever broadband signals reach the ear via direct and reflected routes, and are utilized by the blind for providing ranging cues (BASSETT and EASTMOND, 1964; WILSON, 1967). Experiments utilizing comb-filtered noise to stimulate single cochlear fibres (EVANS et al., 1971; WILSON and EVANS, 1971; EVANS and WILSON, 1973) have demonstrated that fibres of the cochlear nerve of the cat respond to multicomponent stimuli in the manner of linear band-pass filters of the same width and shape as the FTC; that lateralinhibitionjs not involved in the filtering; and that the frequency selectivity of these filters corresponds to that observed in psychophysical measurements with the same stimuli.
Figure 27 illustrates the response of a single cochlear fibre to comb-filtered noise spectra adjusted and switched so that a pea)<: and valley of the spectrum alternately coincides with the CF of the frequency threshold curve, for two differ-ent spacings of the spectrum (A and B, respectively). The mean level of the noise spectrum is about 10 dB above the threshold level for noise. At the widest spacing of the spectrum (Fig. 27 A), there is a marked difference in the discharge rate between the periods of time (100 msec in each case) when an energy peak (thin continuous line) and an energy "valley" (interrupted line) overlie the inverted FTC (thick continuous line). At progressively closer spacings of the spectral peaks and valleys, the ratio of discharge corresponding to peak and trough responses decreases until a spacing is reached (Fig. 27B) where this ratio becomes unity; i.e. the discharge is unaffected by the position of the spectral peaks and troughs relative to the FTC. This point indicates that the fibre is no longer capable of resolving the separate peaks of the spectrum. Inasmuch as these stimuli are analogous to the

42 E. F. EVA1\s: Cochlear Nerve and Cochlear Nucleus
luminosity gratings employed in studies of the visual system (e.g. CAMPBELL et al., 1969), we can say that the fibre has rea,ched the limit of its "grating acuity". These responses can be quantitatively matched by the responses of a linear band-pass filter of identical frequency response characteristics to that of the fibre's FTC. The
A 1.0
II! II' II i
OS
B
A A A A II A
0.5
:! i Iii I • II I III
JUlSL ) \!r/'"'VI, ./ \ 2.0 a a 0.5 1.5 1.0
Frequency 1kHz)
Fig. 27 A, B. Response of cat cochlear fibre to noise stimuli, widely (A) and narrowly (B) spaced. Filled circles and thick continuous line: FTC of fibre plotted as a bandpass filter function in linear relative power and frequency coordinates. A: 'Videst spacing. Thin can· tinuous sinusoid: envelope of "norma]" comb·filtered noise spectrum, with the first energy pca,k of the spectrum coincident with CF of fibre (1.37 kHz). Dashed sinusoid: envelope of "inverted" spectrum, i.c.: with energy minimum at CF of fibre. Inset: continuous film record of spike discharges in response to noise, alternated every 100 msec between normal and rnverted conditions according to the switching waveform shown on the lowest trace. Middle trace shows oscillogram of noise stimulus. 13: Narrowly spaced spectrum, with peak spacing of 0.2 kHz. Envelope of normal spectrum only shovm (thin sinusoid). Otherwise as in A. Note discharge unrelated to alternation of normal and inverted
spectra (see text). (From EVANS and WILSON, 1973)
fact that, this match obtains for all spacings is evidence against the involvement of lateral inhibition in the production of the fibre's narrowly tuned FTC. Lateral inhibition would be expected to produce systematic deviations from the predicted linear filter values such that the response to widely spaced spectra was reduced and that to intermediate spacings was enhanced (vd. l'tATLIFF, 1965 for an analo-gous caSe in vision).
Cochlear Nucleus: Introduction 43
A comparison of the limit of "grating acuity" (established as above) for cat cochlear fibres covering a wide range of CF., with analogous psychophysical measurements (WILSON and EVANS, 1971; EVANS and WILSON, 1973) suggests that the limits upon the freguency resolving power of the auditory system for multicomponent signals are already largely determined at the level of the cochlear nerve (see Section VI.C'!).
4. Effect of Noise on Responses to Cliell and Tone Stimuli KIANG et al. (1965a) have demonstrated that the responses to click and tone
burst stimuli can be attenuated and finally abolished as the level of a background broadband noise stimulus is progressively raised. In both cases, the initial com-ponent of the click and tone responses is attenuated relatively more than the later components.
From the data of KIANG et aZ., the total "masking" of the click and tone re-sponses appeared to be obtained when the level of the continuous noise stimulus was higb enough to cause saturation of the fibres' maintained response. Inter-estingly, trus rate was substantially lower than the discharge rate evoked by the onset of the tone alone (see p. 18 and EVANS, J 974d). vVhether this represents an "exhaustion" of some metabolic process, or what the nature of the interaction is, waits upon more data.
III. Cochlear Nucleus A. Introduction'
\Vhile all fibres of the cochlear'nerve terminate in the cochlear nucleus complex (STOTLER, 1953; POWELL and COWAN, 1962), the cells of the nucleus receive greatly differing numbers of terminals and modes of termination (e.g. CAJAL, 1909; POL-JAR, 1926; LORENTE DE N6, 1933a, b; STOTLER, 1949; RASMUSSEN, 1957; HAR-RISON and WARR, 1962; POWELL and ERULRAR, 1962; HARRISON and IRVING, 1965,1966; OSEN, 1969; COHEN et al., 1972). For the purpose of this review the simplest and morphologically most conspicuous anatomical sn bdivision (Fig. 28) will be utilized, namely into dorsal (DCN) and ventral (VCN) divisions, the latter further subdivided into anteroventraJ (AVN) and posteroventral (PVN) nuclei. It must nevertheless be remembered that there are at least 9 distinct cell types within the complex (OSEN, 1969, in the cat), and that their distribution is not limited by the boundaries of these divisions.
In contrast to the relativeJy homogeneous properties of cochlear fibres, the behaviours of different neurones of the cochlear nucleus exhihit great variety. To a first approximation, the properties of cells in the VCN differ little from those of the primary fibres, whereas cells in the DCN show a great variety of differences. 'Vhile such differences were noted in the earlier studies of the cochlear nucleus (e.g. GALAMBOS and DAVIS, 1943, 1944; ROSE et aZ., 1959; MOUSHEGIAN et al., 1962) it is onlyre.cently that they have been related systematically to location witrun the nucleus. PFEIFFER and KIANG and their colleagues (PFEIFFER and KIANG, 1965; KIANG et al., 1965b; KIANG, 1965; PFEIFFER, 1966b; KIANG et aZ., 1973) have

44
c ::>
50
E. F. EVANS; Cochlear Nerve and Cochlear Nucleus
•
en
Fig. 28. Gross and tonotopic organization of the cochlear nucleus (cat). Sagittal section through medial region of eN (and adherent cerebellum dorsally) stained with Thionine. Caudal and rostral to left and right respectively. Major suhdivisions into.dorsal (DON) and antero· (AVN) and postaroventral (PVN) nuclei indicated approximately by interrupted lines. Incoming and branching cochlear fibres indicated by cn and arrow. Solid line and indicate electrode track and rom depth from dorsal surface. Above is plotted the OFs of 21 units found •. t the
indicated depths
undertaken a classification based on the interspike interval statistics of the sponta-neous activity and on the time course of the response to tones at the CF about 20 dB above threshold. EVANS and NELSON (1966a, b; 1973a, b), in a comple-mentary study of .unit responsiveness as a function of stimulus frequency (e.g. Figs. 30-32), have shown that there are systematic differences in the distribution
Tonotopic Organization 45
of inhibitory and excitatory influences. Their survey was carried out with tones within 20-40 dB of threshold.
All a,ttempts at classification of response properties face a number of difficulties. In the first place, many anaesthetic agents (including barbiturate and urethane) have a ·profound effect on the responses of neurones in the DCN (EVANS and NEL-SON, 1973a, b). Such anaesthetics tend to obliterate the differences in properties between the DCN and VCN, and it is unfortunate that all studies of single units in the DCN; with exception of those by EVANS and NELSON (1973a, b) have been carried out Ul1uer barbiturate or urethane anaesthes;a. Secondly, the response properties of many in the cochlear nucleus, unlike those of the cochlear nerve are modified qualitatively by changes in stimulus parameters such as frequency: intensity, and repetition rate. Thirdly, different microelectrodes may' sample dif-ferent popUlations of cells, and, in any case, less accessible and less extensive regions (such as the nuclei lateraJis and interstitiaJis of LORENTE DE N6, 1933b) and small-celled areas (e.g. the molecular and granular layers of the DCN) are likely to be under-represented. On the other hand, the use of large tipped elec· trodes by most workers who have explored the CN minimised the chance of record· ing from primary afferent fibres (KIANG, 1965).
Such technical variables as the above inevitably make impossible the complete reconciliation of the findings by different researchers; nevertheless, there are sufficient parallels that a synthesis is possible and useful. While response types cannot be correlated exclusively with regions, they can be related at least to sub· division and may turn out to be related to cell type (see, e.g. KIANG et 01., 1973). A general survey of single unit behaviour in relation to the organization of the cochlear nucleus will therefore be attempted, before' proceeding with a more detailed account which will seek to emphasise the major differences in unit pro· perties between the cochlear nucleus and cochlear nerve.
B. Organization The fibres of the cochlear nerve divide within the VCN into an anterior "ascend·
ing" branch which innervates the A VN, and a posterior or "descending" branch which innervates the PVN. The innervation of the DCN is less clear, but appears to arise from a continuation of the posterior branch (SANDO, 1965; OSEN, 1970; COHEN et al., 1972). In addition, the DCN receives a large projection of "association fibres" from theAVN (LORENTE DEN6, 1933b; lliRRISON and WARR, 1962; OSEN, 1970), and the DCN and VCN terminals from the descending, efferent system (RASMUSSEN, 1960, 1964, 1967).
1. Tonotopic Organization ROSE et 01. (1959, 1960) were the first to· show that there was a triple represen.
tation of the cOchlea in the cat CN, namely in each of the three major subdivisions. Within each subdivision the OF. of the cells are arranged in strict sequence from high to low frequency in the dorsal to ventral, posterior to anterior, and medial to lateral directions (Fig. 28). This means that as a microelectrode traverses the boundary between two divisions, a discontinuity in CFs will be observed (e.g.

46 E. F. EVANS: Cochlear Nerve and Cochlear Nucleus
between DCN and AVN in Fig. 28). In the granular cell region between the DCN and A VN, the frequency representation is haphazard or reversed.
This strict, thrice-repeated tonotopic organization results from the orderly branching and distribution of the cochlear fibres (LORENTE DE N6, 1933a; SANDO, 1965). It ho.s been confirmed by other workers and in other species: cat (PFEIFFER and KlANG, 1965; EVANS and NELSON, 19730.), chinchilla (MAST, 1970a), gerbil (SMITH and ZWISLOCRI, 1971), bird (KONISHI, 1970), crocodile (CAIMAN: MANLEY, 1970a).
2. :Fundional Organization a) yeN. To a first approxima.tion, the responses to clicks and tones of neurones
in VCN resemble those of the cochlear nerve, and are relatively unaffected by anaesthesia (EVANS and NELSON, 1973a). The latencies of the responses to supra-threshold click and tone stimuli are about 1 msec longer than those of cochlear fibres of comparable CF, i.e. range from 2-5 msec (RADJONOVA and PoPov, IlJti5; EVANS and NELSON, 1973b). Tbeir FTCs closely resemble those of primary fibres, as in Fig. 9 (KIANG et al., 1965b). The predominant response to steady tones is excitation, and the discharge rate is a monotonic function of intensity. In the majority of units, the time course of the response resembles that of primary neu-rones (Fig. 29F, G, K, L), but, in a small number, the rate of adaptation is very rapid (Fig. 291, N). In less than 10% of the neurones in the survey of EVANS and NELSON (1973a) were inhibitory responses to pure tones observed (as in Fig. 30).
By the criteria of PFEIFFER and KIANG and their colleagues (KIANG et al., 1965 b; PFEIFFER, 1966b), neurones located in the anterodorsal region of the A VN can be distinguished from those in the remainder of the AVN and in the PVN. The cells of the anterodorsal region of A VN are the large spherical cells of OSEN (1970) which receive only a few (three or so) very large terminals, the so-called calyces (bulbs) of HELD. Characteristic prepotentials are observed in extracellular record-ings from these neurones (Fig. 29P; PFEIFFER, 1966a). These appear to relate to discharges in the cochlear fibre terminals, and their constant relation to the cell discharges suggests that each input spike in anyone afferent terminal generates an output spike in the CN cell providing that the input spike does not fall within the refractory period of spikes generated by the other terminals (MOLNAR and .PFEIF- . FER, 1968; see (3) below). The spontaneous discharges are irregular, the interspike
Fig. 29A-R. Categorization of eN units on basis of time course ofresi)Qllse.ln each column, the first three rows represent the same unit whose responses are typical of the location indicated below plots. A-E: interspike interval histograms of spontaneous activity. F-J: High tiDD PST histograms of response to 25 msce tone burst at OF of unit. K-O: PST hlstograms of response to long duration tone' (0.9 sec) ut CF. P: waveform of extracellulal'Jy recorded potential from unit in anterodorsal cochlear nucleus CA-D A VN). Note positive pre· synaptic potential at of time bar preceding the negative post-synaptic unit 'spike bY"about 0.5 msec. Q: "dot display" ofindividual responses of a "chopper type" unit. Ea,ckd6t represents one spike, and adjacent horizontal rows response to successive tone bursts commencing at time zero. R: PST histogram to 0.9 sec tone of a' different unit in DON from 0, with "build-up" time course. Ordinates: numbers of intervals (A-E) and Spik:3S (F-H) per bin. Abscissae indicate linear time in msec (A--'-J, Q) and sec (K-O, R); tone bursts indica,ted by
bars. (After KIANG et al., 1965b; PFElFFER, 1966)
w
u
Functional Organization
o , .... , .... : .... , ..... L 000 f3 Q
;;.i'j.; = I:
.. : : .... : .... : .... : .... :
o II)
o
,-
-j- ".1
,..
I>- Ii z ;a 0
.!.:
47
z u o

60
in :':'. ru .§ '0 40 co 0>
''';
w > 0
&
48 E. F. EVANS: Cochlear Nerve and Cochlear Nucleus
interval statistics resembling those of cocblear fibres, with the exception that the rat,e of decay of the histogram function is somewhat greater than exponential (Fig. 29A; see (3) below). In all other respects the responses are "primary-like" (Fig. 29F, K).
The cells of the remainder of the A VN, PVN and the interstitial nucleus (in the root of the cochlear nerve) have similar latencies to the anterodorsal AVN units but can be divided into 3 categories on the basis of the interval statistics of the spontaneous activity and high resolution PST histograms of the responses to hrief tone bursts (Fig. 29B-D, G-I). The first. category, termed "primary-like", i, characterised by an exponential decay of the interval histogram analysis of sponta-neous activity (Fig. 29B) and a tone response pattern resembling that of primary
A 16lt:. "On"
...... --
16 1 c "Ojj" 0 __ ...... _ - .
o ill o 5 10 Tone frequency 1kHz)
...-=. .. _ ...................... ,
F l:.'L:: 50 kHz 5.2 kHz
- -' - ------, -
4B kHz
1 sec
Fig. aOA-H. Frequency response area, frequency responses, and time courses of unit in DON. A: Exdtatory (stippled) and inhibitory (cross-hatched) response areas. Threshold expressed in terms of relative signa.llevel to-transducer. The values given represent dB SPL at the CF. The SPLs at other frequencies are within 5 dB of these va1ues. Band C: frequency response grams of mean resporise in a 100 ruseo period during (B) and immediately following (0) 100 msec tone bursts of randomly presented frequency-at 20 dB above threshold; Spontaneous discharge rate indicated by bars against ordinate. Note upper and lower frequency inhibitory side.bands, a,nd occuning over_similar band as the PST histograms of response to 0.3 sec tone burst (bar) at the frequencies indicated (in kHz), at sa·IDe stimulus level as Band C. Ordinates: total number of spikes per bin, as a result of 53,22,79,41, and 36 tone presentations respectively. Note "pauser", and time courses in E, F, and G respectively, and inhibition of spontaneous activity during and following
the tone in D and H. (From EVANS and NELSON, 1973a)
Functional Organization 49
(Fig. 29G; L). Units of the second category have a variety of interval statlstlCs (mcludmg modes longer than 12 msec and slower than exponential h- t _ gram deca v' e n F 29 C) 1'h IS a -.-. .., '-", ·tf· . ey are, however, characterised q- regularit of dIscharge t.o to.nes (FIg. 29 Q) which produces a. periodic "ripple" in the pattern to brJef tones (Fig. 29H) - hence the descriptive t,crm "chopper-t;pe"
A
in 70 .. 0 ::'::
w > .. C w
'0 §,
50 'Vi .. B
'0 ru '" CF
30 3 10 kHz 30
inllibiwry DeN unit Rel t · . l l l' - ry ( pp ) and mhlbltory (cross-hatched) resp' ome areas a Ive sIgna eve equals dB SPL at OF ( F' 30 . '. PST histograms ordered in frequency Ig .. l' . t three-dimensional arrays of
as indicated in A). Tone . rna,,' mg Ta,te lD spIkes/sec Note exte . H "f' h'b" '.
band "island" of delayed ("build- ") "_ "t t' llillve sea 0 III 1, ItlOD lTI D with narrow up eXCl a Ion at 21 kHz. (From EVANS and NELSON, 1973a)

',i;,
d Cochlear Nucleus E F EVANS: Cochlear Nerve an 50 . . t' 't and
. have little or no spontaneous ac " neurones. Units of the thIrd category (Fi 29D I N). These are telmed on exhihit a, transient response to region of the PVN (KIANG units. They are particularly found m t et al., ]973).
c
A
10
,--CF
20 30 kHz
Firing rate (spikes/sec)
j /11111111111111' /1111 ill! : :'f:I'j ,1,,,,,:1, illlll!: • .. 1SfC
. f hoil inhibitory;DeN unit (unanaesthe. response and tIme OOUTse 0 W y. , I level equals dB SPL at Fig. 32A-C. Inhibitory response area. onse to 0.4 sec tone at tized C\l;''6e:dimensional array of PST °dur! and following, tone. OF (see F'g. 3!,! ld Note inhibition of spontaneous ":C!:,VlJ'eN Ir1ibitionofspontaneous
A, B, but also fOdUDd intaUDtl'Oann OF, 15 dB above threshold. (From '. . th :ff r reboun exCl . activity during tone WI 0 0 EVANS and NELSON, 1973a)
h ' 1001 of DeN units exhibit th t' d cat less t an to Th b) DeN In the unanaes e lZe , '(E s, and NELSON, ]973a). e • . f' fibres VAN , . .. behaviour resembhng that 0 .prlmary te r lesser admixtures of inh,b,tory responses of the remainder a:we. of spontaneous activity and and excitatory influences, as stimulus leve!., The latency of the non'monotonic response IpS WI all longer thari those in the VCN, and resporises tocJick and tone stimuh are ] 965 ; EVANS and N ELS.O::',. ] 973 b).
nge, frorri4-12 msec (RADIONOVAan , tal excitation with inhlbltlOn over ra , '" , ange from cen r '. . h' The frequenc:y:responseareas, r . b d (Fi ,30) through predommant m ,. one ,.or,more adjacent frequency Slde- an s g ,
I
l-
I I f
I i
Nature of Sensory Input to Neurone. of eN 51
bitory response bands associated with a narrow excitatory response band (Fig. 31), to inhihition only (Fig. 32). The complex time-courses of the responses associated with apparently contiguous inhibitory and excitatory hands indicate that the response regions in fact overlap (Figs. 30F, G and 31 C, D). The proportions of DCN units exhibiting side-band, predominant, or total inhibition were about 20, 20, and 50 % respectively in the unanaesthetized cat, compared with 40, 0, and 10%,in pentobarbitone or halothane anaesthetized cats (EVANS and NELSON, 1973 a). These anaesthetic agents thus exert a profound effect on the DCN in reducing the predominance of inhibition.
On the basis of their PST histogram analyses of tone evoked activity, KlANG et al. (1965b) and PFEIFFER (1966b) observed in the anaesthetized cat a category of unit Dot found in the VCN, which they termed a "pauser type" (Fig. 29J). This type of PST histogram was also common in the DCN data of EVANS and NELSON (1973a), but, as Figs. 30 and 31 indicate, it is not invariant of stimulus frequency or level. Figure 29R alld Fig. 30G illustrate another type of time-course that is characteristic of some units in the DCN, namely, where the diScharge rate increases (instead of adapting) with time. This pattern of behaViour Was termed "buildcup" by ROSE ei til. (1959); it is dependent upon the repetition rate as shown in Fig. 34 (also see PFEIFFER, 1966b). Units of the "chopper" and "on" categories were also found in the DeN. Analyses of the interval statistics of the spontaneous activity revealed almost symmetrical distributions in some DCN units (Fig. 29E) and that the majority of the DCN interspike interval histograms had modal values over 10-20 msec, in contrast to the situation in the VCN (PFEIFFER and KuNG, 1965).
3. Nature of Input to Neurones of eN With its diversity of response, related ,to the morphology, the Cochlear nucleus
is ideally suited to studies of the functional significance of different patterns of innervation.
PFEIFFER and MOLNAR (1968) have been able to nt to the observed interspike interval statistics of primary and VCN neurones, input-output models 'with assumptions which_correlate well with the anatomy. In the anterodorsal A VN, the statistics are consistent with a superposition of 3-4 input renewal processes, Where (apart from its refractory period) the cell discharges each time a discharge appears on one of the 3 -4 input nbres: These cells are innervated via the large calyces of Held by 3 or so cochlear fibres (CAJAL, 1909). Certain cells in tbe PVN have discharge patterns consistent with a model where each output discharge requires the accumulation of a number of discharges from a large number of input fibres, a situation consistent with the morphology of the region.
In a remarkable series of experiments, KOEBllER et ai, (1966) have demonstrat_ ed that the spontaneous discharge of units in the VCN is dependent upon the activity of the cochlear nerve input, Acute (and chronic) interruption of the nerve eliminated the spontaneous activity of all units in the A VN and 'of almost all in the PVN. In contrast, the spontaneous rates and interval statistics of units in the DCN weie unaffected. This finding correlates with the con,clusion, on anatomical grounds (STOTLER, 1949; RASMUSSEN, 1957; POWELL and COWAN, 1962; fuR-RISON and W.A.RR, 1962; OSEN, 1970; COHEN et al., 1972), that the cells ofthe DCN

52 E. F. EVANS: Cochlear Nerve and Cochlear Nucleus
receive at most only a small proportion of the total number of their afferents from the cochlear nerve. In a series of experiments, EVANS and NELSON (1968, 1973b) have implicated the intranuclear fibre pathway runmng between the AVN and the DCN (LORENTE DE N6, 1933b; see :Fig. 49) as the mediator of the predominant inhibitory sensory input to the DCN, seen particularly in the unanaesthetized pre. paration. This inhibition has too short a latency (4-6 msec) for it to be mediated by the efferent auditory system, and it can be evoked by tones after interruption of descending pathways. Furthermore, it can be evoked hy direct electrical stimu· lation of tbe cells of the AVN or tbe fibres of the intranuclear pathway itself. These data give further grounds for the conclusion, from the greater complexity of response, the longer latency, and susceptability to anaestbetic agents of cells in the DCN compared with those of the VCN, that the DON is a higher than second· order nucleus.
C. Spontaneous Activity The range of spontaneous rates from cell to cell in the CN is at least as great as
that in the cochlear nerve, from 0-150 spikes/sec (PFEIFFER a,nd MOLNAR, 1968; EVANS and NELSON, 1973a). The latter authors found a slightly higher mean mte in cells of the VCN (29/sec) compared with those of the DCN (20/sec) in the an· aesthetized cat, consistent with the former authors' report of a relative dearth of units in the AVN rates below 10/sec.
Mention has already been made (Section III.B.2,3) of the finding and possible significance of the variety of interspike interval distributions in the CN. In addition to distributions identical or similar to those obtained in the cochlear"nerv.e, i.e. quasi.Poisson (Fig. 29A-C; VIERNSTEIN and GROSSMAN, 1961; RODIECR et al., 1962; PFEIFFER and KIANG, 1965), more symmetrical and restricted distributions are encountered, particularly in the DCN (Fig. 29E; PFEIFFER and KlANG, 1965). This means that some units in the DCN have a comparatively regular spontaneous activity, and adds further weIght to the argument that tbe activity of DCN cells is less dependent than that of the VCN on input from the cochlear nerve (Sec. tion IILB.3 above). This argument is based partly on the finding of KOERBER et al. (1966) that the spontaneous activity of cells in the VCN is abolished by section of the cochlear nerve, while that of the DCN is :effected.
D. Response to Click Stimuli Not all units in the DCN are driven by click stimuli (ROSE et al., 1959); others
are very sensitive. In the sample of ROSE et al. (1959), thresholds of response to click stimuli ranged from 10-75 dB above tbose to CF tones. (The click stimuli had approximately the same threshold for normal human hearing as 2 kHz tones). Some of their umts in the DCN were exquisitely sensitive to the click level, and required only a 4 dB increase to raise the probability of a response from zero to 100%.
The ability of CN umts to "follow" repetitive clicks has received a good deal of attention. At least two types of behaviour have been found. In the first, resembling
Threshold and Response as a Function of Frequency 53
that of 1,he cochlear nerve, the discharge rate increases monotonically with click rate, while the probability of discharge per click decreases with click rates in eXCess of 10-100/sec. The second group of units, which exbibit transient responses to tones, generate one spike for every click at click rates of up to 100-800/sec (KIANG etal., 1962 a in the cat; 1969b in the rat). Thereafter, the probability of d,scbarge and the mean discharge mte, drop off abruptly towards zero. KONIsm (1969 a) has pointed out that this 1 : I response can be maintained in some units in the bird up to click rates in excess of 1000/sec.
Tbe PST histograms of responses to clicks of "primary.like" cells CFs below 4 kHz in the AVN exhibit the multiple peaks characteristic of cochlear fibres. On hand, cells of the "chopper", "on" and "pauser" types had hlstograms "ryth smgle peaks only, irrespective of their CF (KIANG et al., 1965b).
The latenCles of response to click stimuli have already been mentioned (IIl.B.2). "
E. Response 10 Single Tonal Stimuli The varieties of response and their relative preponderance in the different
divisions of the CN have already been outlined (III.B.2; Figs. 29- 32). It will be necessary, however, to add a qualification in respect of the group of units exhibit. ing transient ("on") responses to tones. The proportion of these units found ranged from 1-20% as follows: 1 % EVANS and NELSON (1973 a) ; 8% PFEIFFER (1966b); 20% RADIONOV .. (1965, 1971), lIi[OLLER (1969b). In the latter studies where these units accounted for one fifth of the total encountered, the possibilily exists that some at least of these responses represent those of high CF units stimulated by the energy dispersion associated with the very sbort tone onset times used in tbe studies. This could account for tl;te finding by MOLLER (1969b) and RADIaN OVA (1971) tbat the umts had very high threshold, broadly tuned FTCs, and for the otherwise surprising independence found by RADIONOVA (1971) of the threshold upon tone duration (for durations as short as 1 msec) compared witb that of nmts where the response to tones was sustained. Furthermore, the thresholds of RADIO. NOVA'S transient unite were sensitive to the rise time of the tonal stimuli and transient responses were often present at the abrupt termination of the tone;. The transiently responding units in tbe surveys by PFEIFFER (1966b) and EVANS and NELSON (1973a), on the other hand, had relatively normal thresholds.
1. Threshold and Response as a Function of Frequency With the possible exception of the "transient unite" 1l1entioned above, there is
no evjdence to suggest that the range of minimum thresholds of CN cells is any less restricted than in the cochlear nerve (MAST, 1970a). Similarly, the minimum unit thresholds approach the thresbold of behavioural respoDse ("audiogram") of the ammal as in Fig. 8 (cat: GALAMBOS and DAVJS, 1943; rat: MOLLER, 1969a; chinchilla: MAST, 1970a; bird: KONlsm, 1969b, 1970). Km;Ism (1970) has shown that a striking correlation exists between the range of unit CFs in different birds with the frequency components of their song. MANLEY (e.g. 1970b) has demon. strated a relationship between the range of CFs and basilar membrane measure. ments in different species of reptile.
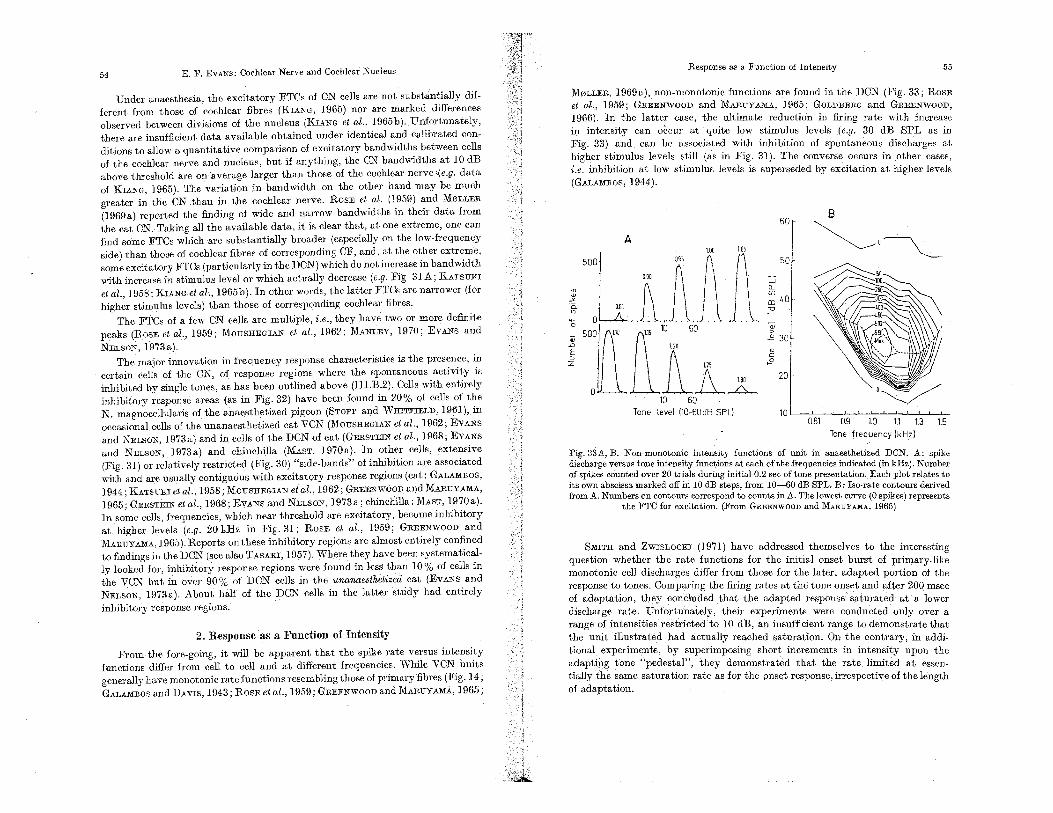
54 E. F. EVANS: Cochlear Nerve and Cochlear Nucleus
Under anaesthesia, the excitatory FTCs of CN cells are not substantially dif-ferent from those of cocblear fibres (KIANG, 1965) Dar are marked differences obsm'ved between divisions of the nucleus (KlANG et al., 1965b). Unfortunately, there are insufficient data available obtained under identical and calibrated con-ditions to allow a quantita.tive comparison of excitatory bandwidths between cells of the cochlear nerve and nucleus, but if anything, the CN bandwidths at 10 dB above threshold are on average larger than those of the cochlear nerve '(e.g. data of KIANG, J965). The variatioD in bandwidth on the other hand may be much greater in the CN than in the cochlear nerve. ROSE et al. (1959) and M0LLER (1969a) reported the fulding of wide and narrow bandwidths in their data from the cat CN. Taking all the available data, it is clear that, at one extreme, one can find some FTCs which are substantially broader (especially on the low-frequency side) than those of cochlear fibres of corresponding CF, and, at the other extreme, some excitatory FTCs (particularly in the DCN) which do not increase in bandwidth with increase in stimulus level or which actually decrease (e.g. Fig 31A; KATSURI et aZ., 1958; KIANG.et aZ., 1965 b). In other words, the latter FTCs a.re narrower (for higher stimulus levels) than those of corresponding cochlear fihres.
The FTCs of a few CN cells are muJt,iple, i.e., they have two or more definite peaks (ROSE et al .. , 1959; MOUSHEGIAN et al., 1962; 1970; EVANS and NELSON, 1973a).
The major innova.tion in frequency response characteristics is the presence, in certain cells of the CN, of response regions where the spontaneous a.ctivity is inhibited by single tones, as has been outlined above (III.B.2). Cells entirely inhibitory response areas (as in Fig. 32) have been found in 20% of cells of the N. magnocellularis of the anaesthetized pigeon (STOPP and WHlTFIELn, 19!J1), in occasional cells of the unanaesthetized cat VCN (MOUSHEGIAN et a.l., 1962; EVANS and NELSON, 1973a) and in cells of the DCN of cat (GERSTEIN et al., 1968; EVANS and NELSON, 1973a) and chinchilla (MAST, 1970a). In other cells, extensive (Fig. 31) or relatively restricted (Fig. 30) "side-bands" of inhibition are associated with and are usually contignous with excitatory response regions (eat: GALAMBOS, 1944; KATSUKI et al., 1958; MOUSHEGIAN et aZ., 1962; GREENWOOD alld Jl1iRUYAMA, 1965; GERSTEIN et al., 1968; EVANS and NELSON, 1973a; chinchilla: MAST, 1970a). In some cells, frequencies, which near threshold are excitatory, become inhibitory at higher levels (e.g. 20 kHz in Fig. 31; ROSE et aZ., 1959; GREENWOOD and MARUYAMA, 1965). Reports on these inhibitory regions are almost entirely confined to findings in the DCN (see also TASAKI, 1957). Where they have been systematical-ly looked for, inhibitory response regions were found in less than 10% of cells in the VCN but in over 90% of DCN cells in the unanaesthetized cat (EVANS and NELSON, 1973a). About half of the DCN cells in the latter study had entirely inhibitory response regions.
2. Response as a Function of Iutensity From the fore-going, it will be apparent that the spike rate versuS intensity
functions differ from cell to cell and at different frequencies. 'Vhile VCN units generally have monotonic rate functions resembling those of primary fibres (Fig. 14; GALAMBOS and DAVIS, 1943; ROSE et al., 1959; GREENWOOD and MARUYAMA, 1965;
Response as a }""unct.ion of Intensity 55
MOLLER, 1969a), non-monotonic functions are found in the DCN (Fig. 33; ROSE et aZ., 1959; GREENWOOn and Jl1ARUYAJI1A, 1965; GOLDBERG and GREENWOOD, 1966). In the latter case, the ultimate reduction in firing rate with increase in intensity can occur at quite low stimulus levels (e.g. 30 dB SPL as in Fig. 33) and can be associated with inhibition of spontaneous discharges at higher stimulus levels still (as in Fig. 3]). The converse occurs in other cases i.e. inhibition at low stimulus levels is superseded by excitation at higher (GALAMBoS, ]944).
Tone level 110-60d8 SPU 10 0.81 0.9 1.0 1.1 13 1.5
Tone frequency 1kHz)
F.ig. 33A, B. functions of UDjt in anaesthetized DCN. A: spike dlsch.arge versus tone mtenslty functIOns at each of the frequencies indicated (in kHz). Number
splkes over 20 during initial 0.2 sec of tone presentation. Each plot relates to lts own abscIssa marked off ill 10 dB steps, from 10-60 dB SPL. B: Iso-rate contours derived from A. Numbers on contOlU'S correspond to counts jn A. The lowest curve (0 spikes) represents
the Fl1C for excitation. (From GREENWOOD and MARUYAMA, 1965)
and ZWISLOCKI (1971) have addressed themselves to the interesting questJOn whether the rate functlOns for the initial onset burst of primary-like monotonic cell discharges differ from those for the later, adapted portion of the response to tones. Comparing the firing rates at the tone onset and after 200 msee of adaptation, they concluded that the adapted response saturated at a lower discharge rate. Unfortunately, their experiments were conducted only over a range of intensities restricted to 10 dB, an insufficient range to demonstrate that the unit illustrated had actually reached saturation. On the contrary, in addi-tional experiments, by superimposing short increments in intensity upon the adaptipg tone "pedestal", they demonstrated that the rate limited at essen-tially the same saturation rate as for the onset response, irrespective of the length of adaptation .
. A,., . _____________________ _

56 E. F. EVANS: Cochl.,.,. Nerve and Cochlear Nucleus
3. Response as a Function of Time In Section III.B.2, 8Jld Figs. 29- 31, the different time courses of reSponses to
steady tones ("primary-like", "chopper", "0'0", and "pimser" type;S) and their relationship to location within the CN have been outlined aeeording to the cJassifi: cation of KIANG etal. (1965); PFEIFFER (1966b). With the exceptionofthe chopper. type time-courses, the different types have been noted by other workers (e.g. ROSE et al., 1959; MOUE;HEGlAN et al:, 1962; GREE:t<:WOOD8Jld MARuYAMA, 1965; EVANS and NELSON, 1973a). In addition, as noted, purely inhibitory responses with time courses the inverse of those of primary-like excitation (Fig. 32) 8Jld with (Fig. 320) and without (Fig. 32B) 8Jl "off" response have been fouod in the DCN (GALAM-BOS, 1944; MOUSHEGIAN et al., 1962; GREENWOOD and MARUYAMA, 1965; MAST, 1970; EVANS 8Jld NELSON, 1973a).
The "chopper" type of PST histogram is produced by a discharge pattern which is relatively regular in time (i.e. the intervals between successive spike discharges are approximately constant) and which is synchronized to the onset of the tone (Fig. 29 Q). Since the preferred interSpike interval is of the order of 3 msec, high resolution histograms are required to demonstrate the "chopper" appearance (compare Fig. 29H with M). This preferred interval is unrelated to the tone fre-quency, phase of tone inset, and the OF of the cen, and is relatively invariant of tone level (PFEIFFER, 1966b).
The "chopper" and "on" time-courses are over a wide range of effective stimulus frequencies and levels (I'FEIFFER, 1966 b ; EvANS and NELSON, 1973a). This is not, however, the case for the DON units where ex-citatory.inhibitory admixtures are evident in their responses (Figs. 30, 31; ROSE
A B 1iIIIlIiiiiliiiiiii' •• Rllliiilili
... .. 0.8 sec 0.8 sec
256
128
0, ......... : ......... 1 ••••••••• = ••••••••• :
• 0.8 seC'
Fig. 34A7 B. Effect of on. tiine C?urse of in DON .cat); 0.5 sec tone at CF, 20 dB above threshold. IWpetitioD rate: 1 per 3 sec in A; 1 per 0.8 in E. Ahove are shown continuous film records taken during PST histograms (below) of 32 ahd
43 tone presentations respectively
Response to Low.frequency Tones 57
et al., 1959; GREENVI;OOD and· MAB.UYAIIIA, 1965; PFEIFFER, 1966b; EVANS and NELSON, 197380). Pre.exposure to stimuli can modify the rate of adaptation of response (ROSE et al., 1959) or convert a "primary.like" time course into one characteristic of "build.up" units (Fig. 29R), The latter effect appears to result from a more powerful and long-lasting off.suppression seen in the responses of many ON cells (particularly in those in the DCN) compared with those of cochlear fibres (Fig. 34; EVANS, 1971; EVANS and NELSON, 1973a). From the relation observed between the duration. of off·suppression and the duration and level of the stimulus tone, STARR (1965) concluded that the off suppression was a form of post-excitatory depression representing some ·metabolic effect of acti-vity. However, this cannot be so for many units, particularly those in the DON. Here, the frequency range over which the off-suppression is observed is not. identical with that which evokes the preceding excitation (e.g., Fig. 30C) and, m. many cases, off· suppression follows a response which is inhibitory (e.g., FIg. 300, G, H; Fig. 31D: responses between 16.5 and 22.5 kHz). Fur. thermore, in some. units the duration of off-suppression is relatively invariant, of tone dura.tion. These observations strongly suggest that the powerful off.' suppression seen in many ON units results. from active inhibitory mechanisms, and STARR and BRITT (1970) have succeeded in demonstrating, by intracellular recording, hyperpolarizing potentials during the post. stimulus period and inhi-bition, during these periods, of dischargeS evoked by intracellular current in-jection.
4. Response to Low-frequency Tones "Phase-locked" responses (ct. II.DA) in the cat ON were first reported by
GALAMBOS and DAv:rS (1943) and were consistent with an upper limit of neural following of about 4 kHz. Uulike the situation in the cochlear nerve, however, not all ON. units of low OF exhibit phase locking. to the cyelesof low frequency tones within their response areas (RUPERT and MOUSHEGlAN, 1970: kangaroo rat VCN;
1971: RUPERT and MOUSHEGIAN (1970) described a group of units III the "' ON which appeared to give phase-locked responses only ·over a narrow range of low frequencies (e.g. lesS than 0.5" kHz). (It is not clear however whether in some of their cases phase-locked responses were being confused with or were receiving interference from chopper types of response.) On the basis of these studies, RUPERT and MotrsHEGlAN (1970) have suggested that this response diver-sity may correlate with the heterogeneous morphology of the kangaroo rat VON.
the cat, the other hand, LAVINE (1971) found the heterogeneity of phase-locking propertIes to oeeur only in the DCN. Those units which showed phase. locking exhibited a variation in the preferred phase of discharge with stimulus frequency, which was relatively unaffected by changes in stimulus levels as found in the. cochlear nerve (II.D.4). '
. Large have been used to record gross potentials which correspond to the cycles of stImuli up to frequencies of 2 to 3 kHz - the so-·called "frequency follow-ingresponse" of MARSH and WORDEN (1968; see also MARSH et al., 1970). STARR and
(1971) have mapped out these responses in the cat ON and found them to ·have larger amplitudes in tneVON .than in the DCN. This may relate to the narrower distribution of response latencies in the'VCN.
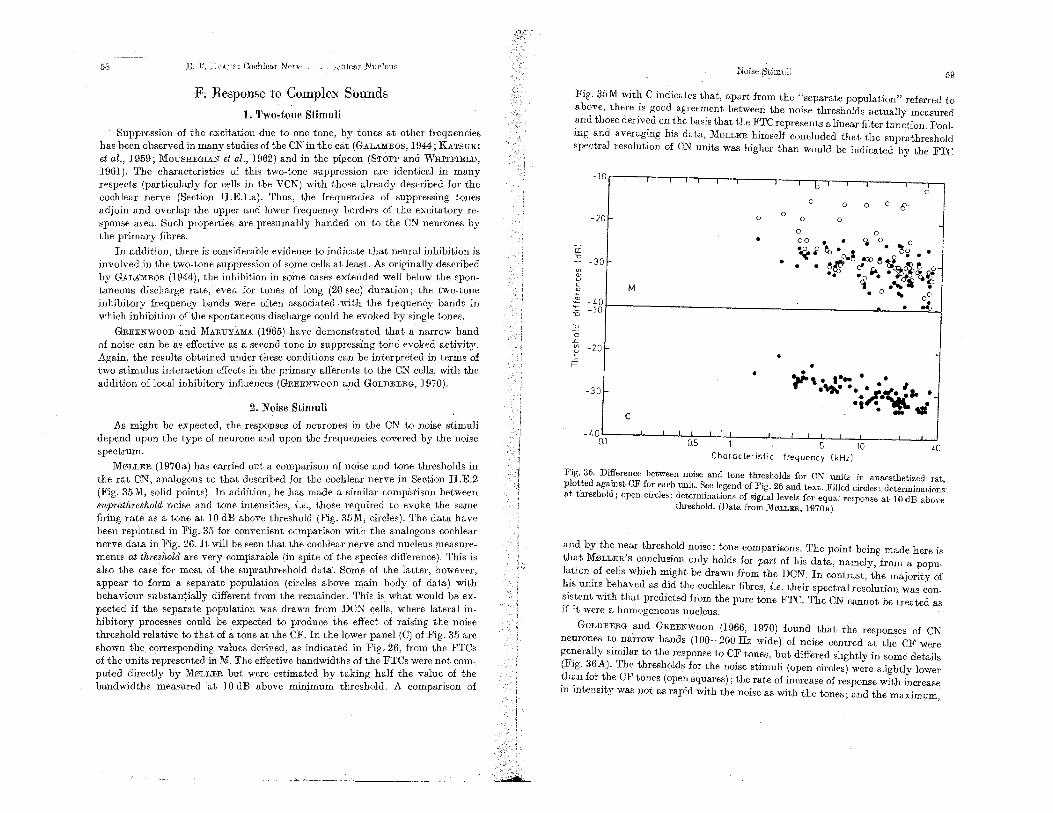
58 E. F. ::v.A:-:-s: Cochlear NervL . __ U ..)vhJear Nucleus
F, Response to Complex Sounds 1. Stimuli
Suppression of the excitation due to one tone, by tones at other frequencies has been observed in many studies of the CN in the cat (GALAMBOS, 1944; KATsUKI et al., 1959; MOUSHEGlAN et al., 1962) and in the pigeon (STOPF and "THITFIELD, 1961). The characteristics of this two·tone suppression are identical in many respects (particularly for cells in the VCN) with those already described for the cochlear nerve (Section H.E.l.a). Thus, the frequencies of suppressing tones adjoin and overlap the upper and lower frequency borders of the excitatory reo sponse area. Such properties are presumably handed on to the CN neurones by the primary fibres.
In addition, there is considerable evidence to indicate that neural inhibition is involved in the·two·tone suppression of some cells at least. As originally described by GALAMBOS (1944), the inhibition in some cases extended well below the spon-taneous discharge rate, even for tones of long (20 sec) duration; the tone inhibitory frequency bands were often associated with the frequency bands in which inhibition of the spontaneous discharge could be evoked by single tones.
GREENWOOD and MARUYAMA (1965) have demonstrated that a narrow band of noise can be as effective as a second ton.e in suppressing tone evoked activity: Again, the results obtained under these conditions can be interpreted in terms of two stimulus interaction effects in the primary afferents to the CN cells, with the addition of local inhibitory influences (GREENWOOD and GOLDBERG, 1970).
2. Noise Stimuli As l!1ight be expected, the responses of neurones in the CN to noise stimuli
.:iepend upon the type of neurone and upon the frequencies covered by the noise spectrnm.
MeLLER (1970a) has carried out a comparison of noise and tone thresholds. in the rat CN, analogous to that described for the .cochlear nerve in Section H.E.2 (Fig. 35M, solid points). In addition, he has made a similar compatison between 8uprathreslwld noise and tone intensities, i.e., those required to evoke the same firing rate as a tone at 10 dB above threshold (Fig. 35M, circles). The data have been replotted in Fig. 35 for convenient comparison with the analogous cochlear nerve data in Fig. 26. It will be seen that the cochlear nerve and nucleus measure-ments at thre8hold are very comparable (in spite of the species difference). This is also the case for most of the suprathreshold data. Som.e of the latter, however, appear to form a separate population (circles above main body of data) with behaviour substanti<illy different from the remainder. This is what would be ex. pected if the separate population was drawn from DCN cells, where lateral in-hibitory proceSses could be expected to produce the effect of raising the noise threshold relative to that of atone at the CF. In the lower panel (C) of Fig. 35 are shown the corresponding values derived, as indicated in Fig. 26, from the FTCs of the units represented in M. The effective bandwidths of the FTCs were not com-puted directly by MeLLER. but were estimated by taking half the value of the bandwidths measured at 10 dB above. minimum threshold. A comparison of
Roise 59
Fig. 35M with C indicates that, apart from the "separate population" referred to above, there is good agreement between the noise thresholds actually measured and those derived on the basis that the FTC represents a linear filter function. Pool-ing and averaging his data, MeLLER himself concluded that the suprathreshold spectral resolution of CN units was higher than would be indicated by the FTC
-10
-20
m 'C
-30
c M :" '" -.0
'0 -10 'C 0 .IO on -20 '" ;5
-30
C
-.0 0.1
o o o
o o 0 0 e
o
o
o 0 00 • • ,,0 0 _0 0 -, - _ -,.:- 0.0 .., -- - e!!1 d' n. 0 -. • ..... '* _,I_
• 0... 0
-"IJ.,. ..... • r .""....;..,'Ie.
•• •• :!'" ttl
m Characteristic frequency (kHz)
Fig. 35. Difference between noise and tone thresholds for eN units in anaesthetized rat plotted against CF for each unit. See legend of Fig. 26 and text. Filled circles: a.t threshold; open circles: determinations of signal levels for equal response at 10 dB above
threshold. (Data from MeLLER, 1970a)
and by the near threshold noise: tone comparisons. The point being made here is that MeLLER'S conclusion only holds for part of his data, namely, from a popu-lation of cells which might be drawn from the DCN. In contrast, the majority of his units behaved as did the ·cochlear fibres, i.e. their spectral resolution was con-sistent with that predicted from the pure tone FTC. The CN cannot be treated as if it were a homogeneous nucl.eus.
GOLDllERG .and GREEl\'WOOD (1966, 1970) found that the responses of CN neurones to narrow bands (100-200 Hz wide) of noise centl'ed at the C:F were generally similar to the response to CF tones, but differed slIghtly in some details (Fig. 36A). The thresholds for the noise stimuli (open circles) were slightly lower tl,an for the CF tones (open squares); the rate of increase of response with increase in intensity was not as rapid with the noise as with the tones; and the maximum,

60 E. F. EVANS; Cochlea,r Nerve and Cochlear Nucleus
saturated, discha.rge rates in some cases was lower with noise compared with tones. These effects are presumably reJated to the considerable fluctuations in amplitude, characteristic of such narrow noise bands.
In many units, widening the bandwidth of the noise stimuli about the CF produced summation effects as would be expected from the considerations of Sect.ion II.E.2. That is, doubling the bandwidtll (at consta,nt spectrum level) had
Ul .::: :J E Ul
A
0 -20 o
B
20
20 LO
Q
60 0.1 1 10 10
b
10.1 0.8 0.1 0.8 0,1 0.8
Level IdB SPLl 10
Fig. 36A, 13. Effect of widening noise bandwidth on two units in the cat eN with A, monotonic and B, nonmonotonic intensity functions. A in PVN; Bin DCN. Left,·hand plots (a): Number of spikes per 200msec stimulus, square symbols: tones at CF, open circles: narrow band (A: 200Hz; B: 60Hz) noise centred on CF (13.4 kHz in A; 0.8 kHz in B). Righthand plots (b: saBd circles): number of spikes per 200 msec stimulus of band-limited on t.he CF) of increasing bandwidth at constant spectrum level (left to right: expressed in kHz in upper abscissae and as relative intensity in 10 dB steps in the lower abscissae) and increasing
spectrum level (lower to upper plots). (From GREENWOOD and GOLDBERG, }g70)
Stimuli with Multicomponent Spectra 61
the same effect on the response as increasing the spectrum level by 3 dB, until the noise bandwidth approached the effective bandwidth of the FTC. Thereafter, widening the noise band had progressively less effect on the response (as the incre-ments in bandwidth and, therefore, power lay ontside thc "'TC bandwidclc \ This wa·s not the case however in all units: ill some, summation occurred only up to a certain bandwidth beyond which the neurone's discharge rate actually decreased towards, and in some cases below, the spontaneous level. For the latter units which had monotonic rate-intensity functions (drawn from DCN and PVN), the band-widths at which suppression began to appear ranged from about 1-4 kHz, tending towards the lower values at higher spectrum levels (Fig. 36A). For non-monotonic units (found in the DCN), on the other hand, these bandwidths were below 0.4 kHz (Fig. 36B). In these cases, presumably, the widening noise bands are encroaching on lateral inhibitory side· bands (Section III.B.2.b). It is doubtful whether a sub-stantial reduction in the input from primary fibres is involved by a mechanism analogous to that of two-tone suppression, in view of thc fact many CN neurones do not show this suppression with increase in band"idth, and in view of the flnd-ings discussed in Section H .E.2.
The narrower bandwidths of summation found in nonmonotonic DCN cells presumably reflect the greater incursions of the inhibitory sidebands in these units.
3. Stimuli with Multicomponent Spectra l\f0LLER (1970b) has carried out an ingenious experiment in which the re-
sponscs to paired click stimnli of units in the rat CN were measured over a wide range of separation of the clicks. He interpreted his results in temporal terms (i.e. interference between two damped oscillatory responses' of the peripheral auditory analyser), but they could equally he looked at in spectral terms, for paired click stimuli generate short term comb:filtered spectra where the spacing of the spectral peaks and valleys is related to the click pair separation (vd. Section H.E.3). Figure 37 A shows the responses of a unit to paired click stimulation, where the interval is varied from about 50-1000 [Lsec. After converting the response (number of discharges per click pair) into terms of the equivalent stimulus level, an a,uto-correlation function was computed of the system's impulse response (Fig. 37B, interrupted line). The thin continuous line in Fig. 37B represents the autocorre-lation function computed, by inverse Fourier transform, of a near threshold iso-rat,e function for the unit (analogous to the FTC). MeLLER found that a better fit could be obta,ined between observed and computed antocorrelation fnnctions if the response area used for the computed continuous line in Fig. 37 B was halved in bandwidth. From this he suggested that the peripheral analyser had a higher spectral resolution with regard to double click stimulation than it had for tones. Such a conclusion conflicts with findings in the cochlear nerve (discussed in II.E.3), where the results of comb-flltered noise stimulation were consistent with the cochlea acting as a simple linear filter of eqU!.!1 bandwidth to tones and multicom-ponentspectral stimuli. However, it is clear from Fig. 7 of M0LLER (1969a) that the isorate contour chosen from the data on that unit by MOLLER (1970b) was somewhat anomalous and was wider in than the snprathreshold isorate contours obtained for the same unit imd than the average for the rat eN (MOLLER, 1972 b: Fig. 20). If he had used one of the suprathreshold isorate contollrs (which
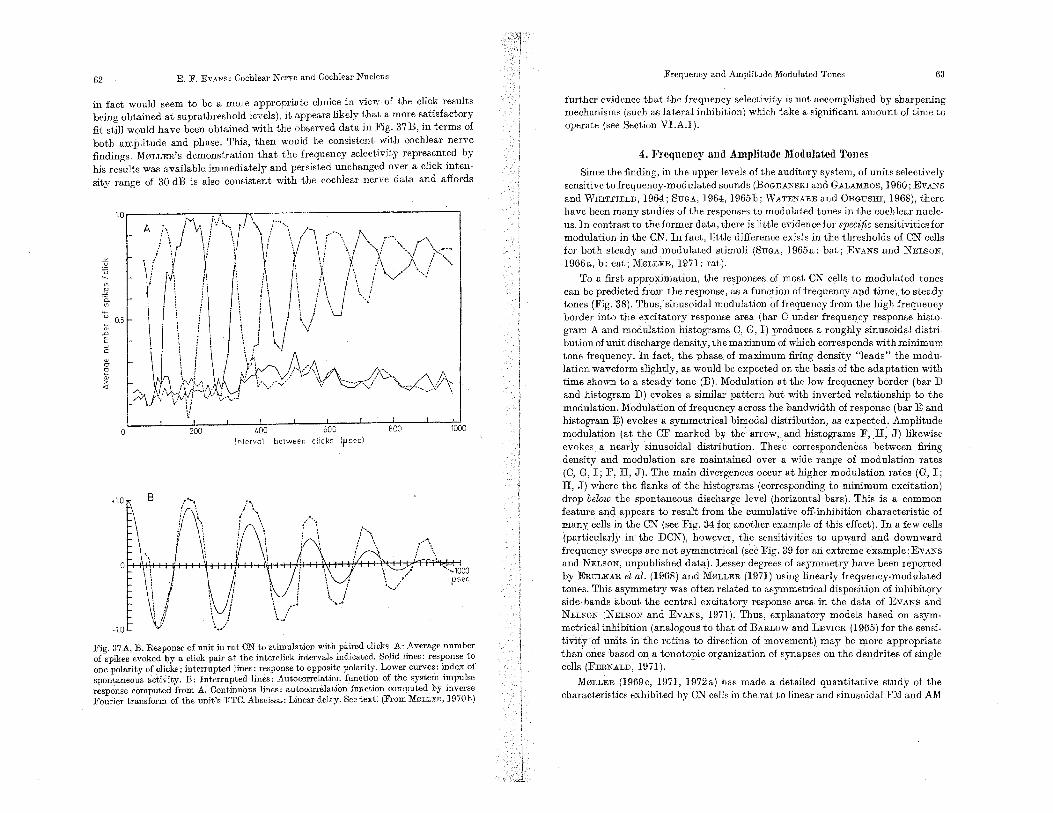
62 E. F. EVANS: Cochlear Nerve and Cochlear Nucleus
in fact would seem to 'be a more appropriate choice in view of the click results being obtained at suprathreshold levels), it appears likely that a more satisfactory fit still would have been obtained with the observed data in Fig. 37 B, in terms of both amplitude and phase. This, then would he consistent with cochlear nerve findings. MOLLER'S demonstrat,ion 1.hat the frequency selectivity represented hy his results was available immediately and persisted unchanged over a click inten-sity range of 30 dB is also consistent with the cochlear nerve data. and affords
1.0
x u U
x 'g-'0 0.5 ID
.D E C
ID
"" C
> <1
200 .00 500 800 1000 Interval between clicks (psec)
Fig. 37 A, B. Response of unit in rat ON to stimulation with paired A: Average number of spikes evoked by a click pair at the interclick intervals indka,ted. Solid lines: response to one polarity of clicks; interrnpted lines: response to opposite polarity. Lower curves: index of spontaneous activity. B: Interrupted Jines: Autocorrelation function of the system impulse response computed from A. Continuous Hnes: autocorrelation function computed by inverse Fourier tranSfOl'ID of the unit's FTC. Abscjssa: Linear delay. See text: (From M0LLER, 1970b)
Frequency and Amplitude Modulated Tones 63
further evidence that the frequency selectivity is not accomplished by sharpening mechanisms (such as lateral inhibition) which take a significant amount of time to operate (see Section VI.A.l).
4. }'requency and Amplitude lIlodulated Tones Since the finding, in the upper levels of the auditory system, of units selectively
sensitive to frequency-modulated sounds (BOGDANSru and GALAMBOS, 1960; EVANS and WmTFIEJ"D, 1964; SUGA, 1964, 1965b; WATENABE and OllGUSm, 1968), there have heen many studies of the responses to modulated tones in the cochlear nucle· us. In contrast to the former data, there is little evidence for specific sensitivities for modulation in the CN. In fact, little difference exists in the thresholds of CN cells for hoth steady and modulated stimuli (SUGA, 1965a: bat; EVANS and NELSON, 1966a, b: cat; M.0LLER, 1971: rat).
To a first approximation, the responses of most CN cells to modulated tones can be predicted from the response, as a function of frequency al1d time, to steady i.ones (Fig. 38). Thus, sinusoidal modulation of frequency from the high frequency border into the excitatory response area (bar C under frequency response histo-gram A and modulation histograms C, G, I) produces a roughly sinusoidal distri-bution of unit discharge density, the maximum of which corresponds with minimum tone frequency. In fact, the phase of maximum firing density "leads" the modu-lation waveform slightly, as would be expected OIl the basis of the adaptation with time shown to a steady tone (B). :J\1odulation at the low frequency border (bar D and histogram D) evokes a similar pattern but with inverted relationship to the modulation. Modulation of frequency across the bandwidth of response (bar E and histogram E) evokes a symmetrical bimodal distribution, as expected. Amplitude modulation (at the CF marked the arrow, and histograms F, H, J) likewise evokes. a nearly sinusoidal distribution. These correspondences between firing density and modulation are maintained over a wide range of modulation rates (C, G, I; F, H, J). Tbe main divergences occur at higher modulation rates (G, I; H, J) where the flanks of the histograms (corresponding to minimum excitation) drop below the spontaneous discharge level (horizontal bars). This is a common feature and appears to result from the cumulative off-inhibition characteristic of many cells in the CN (see Fig. 34 for another example of this effect). In a few cells (particularly in the DCN), however, the sensitivities to upward and downward frequency sweeps are not symmetrical (see Fig. 39 for an extreme example: EVANS and NELSON, unpublished data). Lesser degrees of asymmetry have been reported by ERULRAR et al. (1968) and lIi0LLER (1971) using linearly frequency-modulated tones. This asymmetry was often related to asymmetrical disposition of inhibitory side-ba.nds about the central excitatory response area in the data of EVANS and NELSON (NELSON and EVANS, 1971). Thus, explanatory models based on asym-metrical inhibition (analogous to that of BARLOW and LEVICK (1965) for the sensi-tivity of units in the retina to direction of movement) may be more appropriate than ones hased on a tonotopic organization of synapses on the dendrites of single cells (FERNALD, 1971).
M0LLER (1969c, 1971, 1972a) has made a detailed quantitative study of the characteristics exhihited by CN cells in the rat to linear and sinusoidal FlIi and AJ\I[

64 E. F. EVANS: Cochlear Nerve and Cochlear
at. higher rates of frequency changc than so far discussed. Under these conditions, two main departures occur from a discharge pattern whlCh slmply corresponds to the modulation. Firstly, the handwidth of the units' response aTea appears t,o hecome na.rroweT at intermediate modulation rates (Fig. 40A: 12.8 and 25 sweepsl
32 A
16
F
:;J 128 .Y-o.
i.J) 0 ........................................ . - ... ......... -'--. .....................
- ............... - ....... .......... " .. ...-
128
0 .................... , ........ ·.· ...... ··· --, ...... "..--------
O ..
I
E H
... --- ..... .. ----
J
---'--••••••••••••••• <' -"'---
Fig. 38A-J. (Legend see p. 65)
Frequency and Amplitude Modulated Tones 65
sec). This is prohably a result of cumulative off-inhibition preferentially diminishing the responses to the less effective (flanking) frequencies. Secondly, at intermediate modulation rates (50-300 cis faT sinusoidal modulation) the modu-btion of the response discharge densit.y rea.ches a maximum, for both FM and AM
A B
..2 .. -.. _ ........ - ---, ,.,. .... r ............ --"'" "-'--
Fig. 39A, B. Uncommon t:.ype of response of ON unit to frequency modulation. Cat A VN. A: Frequency response histogram of response to 100 mseo tones at 30 dB above threshold. B: Asymmetrical :response distribution to frequency modulation positioned across response area, (bar below A). Modulation rate: 1 cis. Optimum response to upward frequency changes.
Data collected for 30 sec
(Fig.40B), and, for AM, exceeds the stimulus modulation depth by factors of 2-15 dB, as in Fig.40B (MOLLER, 1972a). Sinusoidally amplitude-modulated noise had similar effects. Fig. 40B, Cindicates that, for many units, amplitude and phase chara.cteristic of the response to FM and AM are very similar, at least when the FM is not such as to produce an inverted or bimodal rela.tionship between response £ring density and the modulation waveform (as in Fig.38C and E respectively).
GLATTRE (1969) has looked at the responses of CN units to square wave modula.ted AM tones of high frequency for evidence of "de-modulation" of the signal, i.e. responses to the modulation in units of CF corresponding to the modu-
Fig. 3SA-J. Common types of response of CN unit to frequency and amplitude modulated tones. Oa,t PVN. All analyses at 20 dB above threshold. A: Frequency response histogram (see Fig. 30) of response to 100msec tones as a function of frequency. "8: PST histograni at C]I. C, G, I: Modulation histograms of averaged firing density in resuonse to sinusoidal frequency modulation over band of frequencies indicated by bar C under A. \Va,veform of modulation indicated under modulation histogram. Modulation rate: 1, 10,40 cis in C, G, J respectjvely. D: Frequency modulation over band of frequencies D; Modulation rate: 1 cis. E; Frequency modulation symmetrical1y across excitatory response a,rea (E). Note symmetrical double peaked distribution of discharge, correspondmg to modulated frequency crossing CF twice per tion cycJe, F, H, J: AmpJitude modulation (depth 80%) at CF (F) at modulation ra.tes of 1, 10, and 40 cis respectively. At the higher rates of modulation (G, I, H, nott:: depression of "tails" of distributions below spontaneous level (indicated by bars against ordinates). Da,ta collected
for about 30 sec in each analysis

60 E. F: EVANS: Cochlear Nerve and Cochlear Nucleus
1.6 ..... 1_ .... j 3,2 __ ..A..
6.4 .... 1"--.... -10
10 100 1000
c ".
-360
::: -720 o ;[
-1 oaoL1 Modulation rate Icls)
Effectofrapid rates offrequencyand modulation on response ofCN unite. Rat.'A: linear (triangular) frequency modulatIOn between 10 and ,50kHz across,CF of unit '(29.3 kHz), at 20 dB above threshold. Note narrowing of fir.ing distributions at sw,:"p rates ofl2.8 and 25 cIs (rates in cIs indicated to left of modulation hIstograms). The progressIve shift of hiatogram peaks to the right with increasing modulation rate (which causes the right. hand peak at 5Q cIs to appear as the left one at 100 cIs results from the of B:.Mo.dulation of discharge ra,te in respons€' to sinusoidal frequelJ. ..... (dotte? lme) and amplitude modulation of tone at CF (solid line) and broad-band nOIse (dashed as a function of the rate of modulatjon. ;Respo:r;lse modulatlon expresS:6d In terms of ratIO of opseryeo. moduJat,ion 0:( response relative to 10% , which in the modulation equals the depth .of ,stimulus modulation. (100% response modulation is by + 20 ,dB.) Measurements obtained from the sinusoids which best the modulatIOn Frequency modulation: ± 45 Hz at CF of 1.5 ,Hz. C: J:'baseof dIsCharge modulatIOn relatIve
to that of stimulus modulation. (From M"PoER, 1969c, 1972a)
Effect of Noise on Responses to Click and Tone Stimuli 67
lation frequency. No such reSponses were found 3. GLATTKE claimed to have found two classes of eN units: one class where the modulation of activity became negligible with modulation rates in exc .. ss of about 200 Hz; another where the response and stimulus modulations corresponded to rates in excess of 500-800 Hz. It appears, however, from the published data, that the latter class of units are of the "chopper" type where the regular interspike repetition period of 3-4 msec can be confused for "following" of the modulation by the unit. With the latter qualificatiOli, however, GLATTKE'S results are consistent with those of M0LLER (1972a).
Ii. Effect of Noise on Responses to Click and Tone Stimuli The presentation of ,,1de band noise reduces the responses of eN units to click
and tone stimuli (GALAMBOS, 1944; MeJILER, 1969b; MARSH et 01.,1972). To what extent this effect differs from that found at the level of the cochlear nerve (Sec. tion ILEA) is not known, in the absence of quantitative comparisons. Certainly, the desynchronization by noise stimuli of unit activity in response to low frequency tones (MABSH et al., 1972) is not unexpected. On the other hand, the results of GREENwoon and GOLDBERG (1970) where progressive inhibition was found in certain units with widening bands of noise, suggest that the inhibitory response regions characteristic of many CN units must contribute to the reduction in re-sponse found under conditions of broadband noise stimulation.
GOLDBERG and GREENWOOD (1966) and GREENWOOD and GOLDBERG (1970) have made a careful study of the responses of CN units to combinations of tones and narrow (ca. 0.1 kHz) bands of noise centred (a) at the CF and (b) off the CF of the units. In the former case, where the two stimuli. were excitatory the inten-sities of the stimuli (rather than the responses) appeared to sum. Thus, the discharge rate and certain statistics of the discharge to the stimulus combination were deter· mined, by the more intense of the two stimuli. The addition or subtraction of the. less intense stimulus had little effect (see Section VI. C.2). In the second case, where the narrow noise band was displaced from the CF and centred over an inhibitory sideband, the response to the tone at the CF was 7P.duced (Fig. 41). The degree of reduction increased with increase in intensity of the noise band, although the relationship was not always monotonic, (Fig. 41 B). In addition, the response pattern (i.e. statistics) could shift'from one corresponding to response to the tone alone, to that corresponding to the inhibiting noise signal alone.
It appears that in many respects, the behaviour of the CN neurones described by GREENWOOD and GOLDBERG (1970) to"combinations of tone and noise bands, resembles that of the cochlear nerve to two-tone combinations (as discussed in II.E.lc). In particular, the response discharge rate, and the pattern of response were generally dominated by the more effective component of the two stimuli, whether the latter produced a lesser (or in the case of the CN an response than of tone alone (as in Fig. 41A, a-d; 41B, a-c), or whether it produced a greater response (Fig.41Ac; 4lBa). In some cases, however, the situation was less straightforward, in that a narrow band of l10ise in an inhibitory side band could augme';\t or suppress the response to a tone at the CF depending upon the level of
• IDcidentally, this result appears to conflict with that of BOERGER and GRUBER (1970) obtainod in the coChlear nerve and discussed in Section ItE.1.b.
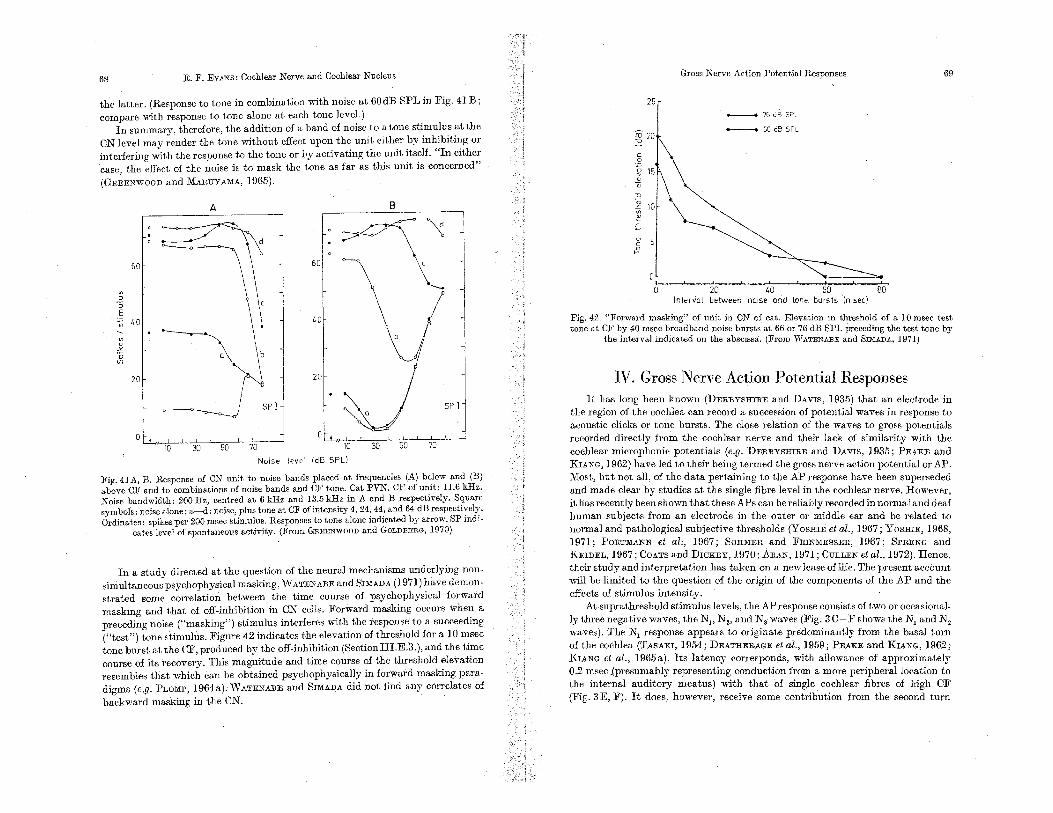
68 E. F. EVANS: Cochlear Nerve and Cochlear Nucleus
the latter. (Response to tone in combination with noise at 60dB SPL in Fig. 41 B; compare with response to tone alone at each tone level.)
In summary, therefore, the addition of a band of noise to a tone Stimulus at the ON level may render the tone without effect upon the unit either by inhibiting or interfering with the response to the tone or by activating the unit itself. "In either case, the effect of the noise is to mask the tone as far as this unit is concerned" (GREENwOOD and MAJHjYAMA, 1965).
B
60 60
:; E
.0 .0
oX .5. '"
20 20
SF]
10 30 50 70 Noise level IdB SPLi
Fig. 41A, B. Response of CN unit to noise bands placed at frequencies (A) below and (B) above CF and to combinations of noise bands and CF tone. Cat PVN. CF of unit: 11.6 kHz. Noise bandwidtb: 200 Hz, centred at 6 kHz and 13.5 kHz in A and B respectively. Square symbols: noise alone; a-d: plus tOne at OF of intensity"4, 24, 44, and 64 dB respectively. Ordinates: spikes per200 msec stimulus. Responses to tone alone indiCated by arrow. SP indio
cates level of spontaneOus activity. (From GREENWOOD and GOLDBERG, 1970)
In a study directed at the question of the neural mechanisms underlying non· simultaneous psychophysical masking, WATENABE and SIMADA (1971) have demon· strated some correlation between the time course of psychophysical forward masking and that of off·inhibition in CN· cells. Forward masking occurs when a preceding noise ("masking") stimulus interferes with the response to a succeeding ("test") tone stimulus. Figure 42 indicates the elevation of threshold for a 10 msec tone burst at the OF, produced by the off·inhibition (Section III.E.3.), and the time course of its recovery, This magnitude and time course of the threshold elevation resembles that which can be obtained psychophysically in forward masking pa,ra· digms (e.g. PLOMP, 1964a);WATENABE and SIMADA did not find any correlates of backward masking in the CN. '
25
Gross Nerve Action Potential Responses
, 20
70dBSPl
66dBSPl
Interval between noise and tone. bursts '(msec)
69
80
Fig. 42. "Forward masking" of unit in eN cat. Elevation in thresholq of a 10 msec test tone at CF by 40 msec broadband noise bursts at 66 or 76 dB SPL preceding the test tone by
. the interval indicated on the abseisaa. (From WATENABE and SmADA, 1971)
IV. Gross Nerve Action Potential Responses It has long been known (DERBYSmim and DAVIS, 1935) that an electrode in
the region of the cochlea, can record a succession of potential waves in response to acoustic clicks or tone bursts. The close relation of the waves to gross potentials recorded directly from the cochlllar nerve and their lack of similarity with the cochlear microphonic potentials (e.g. DERRYSHIRE and DAVIS, 1935; PEAKE and KIANG, 1962) have led to their being termed the gross nerve action potential or AP. Most, but not, all, of the data pertaining to the AP response have been superseded and made clear by studies at the single fibre level in the cochlear nerve. However, ithas recently been shown that these APs can be reliably recorded in normal and deaf human subjects from an electrode in the outer or middle ear and be related to normal and pathological subjective thresholds (Y OSmE et al., 1967; Y OsEm, 1968, 1971; PORTMANN et al;, 1967; SOHMER and FEINMESSER, 1967; SPRENG and KEIDEL, 1967; COATS and DICKEY, 1970; ARAN, 1971; CULLEN et al., 1972). Hence, their study and interpretation has taken on a new lease of life. The present account will be limited to the question of the origin of the components of the AP and the effects of stimulus intensity.
At suprathreshold stimulus levels, the AP response consists of two or occasional· Iy three negative waves, the N" N., and N, waves (Fig. 3C-F shows the N, and N. waves). The N, response appears to originate predominantly from the basal turn of the cochlea (TASAJU, 1954; DEATHERAGE et al., 1959; PEAKE and KIANG, 1962; KIANG et al., HJ65a). Its latency corresponds, with allowance of approximately 0.2 msec .(presumably representing conduction from a more peripheral location to the internal auditory meatus) with that of single cochlear fibres of high OF (Fig. 3E, F). It does, however, receive some contribution from the second turn

70 E. F. EVANS: Cochlear Nerve arid Cochlear Nucleus
of the cochlea in the guinea pig at least (TEAset al., 1962). There is less un· for the origin of the later AP waves. '1'he N. wave has been considered
to arise in part from the cochlear nucleus (KlANG et 01., 1962a) or from re-petitive activity in the cochlear nerve (TASAlIT, 1-954; TEAS et 01., 1962). Against the former suggestion is the demonstration that the N. component can still be recorded after section of the cochlear nerve (DAIGNEAULT et al., 1968). Against the second suggestion (repetitive activity in cochlear nerve), PST histograms of the activity of cochlear fibres of high CF do not show an appropriate second peak (Fig. 3E, F; KlANG et al., 1965a). In fact, there is positive evidence that the later waves originate in the upper turns of the cochlea (PUGH et 01., 1973).
To broad-band signals such as clicks, the cochlea acts as a delay line. Hence, the AP recorded by a gross electrode must represent the spatially weighted sum over time of the progressive activation of endocochlear or modiolar aII-or-none synaptic or nerve potentials which may be diphasic in nature (TEAs et al., 1962). Inasmuch "'" the thresholds of t,hese individual component potentials are a function of frequency (e.g., Fig. 8) and therefore delay along the cochlea (Fig. 21), and the time of initiation is dependent to a greater or lesser extent upon the level and phase (Fig. 6) of the stimulus, the form and latency of the AP will depend in a complex manner upon the level and phase of a broadband stimulus and also to a certain extent on the frequency response of the trans-ducer used.
Some of these features are illustrated in Fig. 43. Almost all investigations of the relation between the amplitude of the N, response (measured as peak-to-peak amplitude of first negative and positive waves or as baseline to N, pealr) and the intensity of click stimuli in cat (DERBYSHIRE and DAVIS, 1935; ROSENllLlTH, 1"954; KlANG et 01., 1962a; PEAKE and KlANG, 1962; RADIONOVA, 1963; WIEDERHOLD and KlANG, 1970), gninea pig (TEAs et al., 1962; TAull and Rilll, 1969; NIEDER
. and NIEDER, 1970; SPOOR and EGGERMONT, 1971) and normal man (YosIDE et al., 1967, 1971; EllEllLING and SOLOMON, 1971) have found the function to have an inflexion or evena dip at about 50-60 dJ3 above the threshold for visual detection of the AP, in conjunction with a discontinuity in the latency functio";, as in Fig. 43; This finding has ahnost invariably been interpreted ill terms of the participation of two populations of receptor elements or neural units, a small low .threshold set responsible for the low threshold segment of Fig. 43 '(continuous curve) and a larger mgh threshold set responsible for the remainder (ROSENllLITH, 1954 ; DAVIS et "t., 1958; KEIDEL, 1965, 1970; RADIONOVA, 1963, YOSHlE, 196!l; AllAN; 1971). With the demonstration that in the cat the number of cochlear fibres innervating the inner hair cells exceeds those for the outer hair cells by a factor as much as 20: 1 (SPOENDLIN, 1966, 1970,1971, 1972), it has appeared more reasonable to relate the low and high threShold populations with the two populations of coelllear fibres innervating the outer and inner hair cells respectively than to the receptors them-selves, where the numerical relations are reversed (SPOENDLIN;.1971). Attempts to produce differentiBJ damage to the outer hair cells by exposure to noise or ototoxic agents in aniinals (e.g. DAVIS et al., 1958; KErDEL, 1965) also support this notion. Against this interpretation, it must be einphasised(a) that two populations of cochlear fibres distingnishable by their thresholds have not been found in the
:,-':'j .. ,
.
Gross Nerve Action Potential.Responses 71
normal cochlear nerve (see Section n.D.1); (b) that the AP is a compound poten-tial and its amplitude a complex sum of potentials differing in time, space, and possibly polarity. That a drastic change is introduced in the intensity and latency function by merely a change in phase of the click (Fig. 43 interrupted line) illus-trates the latter point, and consequently many workers are reluctant to press an anatomical interpretation (e.g. AllAN and DELAUNAY, 1969; YOSHlE, It is also possible that the inflexion present in almost all AP intensity functions is
> ..s n. « "0
<CO ID
:5 a. E 8 Z "0 ID
"0
f «
1.0
Q5
0
r' .
Relative click level
Fig. 43. Amplitude and latency of gross .AP response (recorded by concentric electrodes in the cochlear nerve) as a of relative cHck intensity. Cat. Latency corrected for acoustic delay. curves: clicks; ir,lterrupted lines: condensation clicks. Measurements of
amplitude and latency made as indicated in inset. (From PEAKE ""dKuNG, 1962)
related to the sudden change in bandwidth of cochlear fibre FTCs about 50 dB above .their minimum threshold (Fig, 9), and that the loss of the low threshold segment in .cochlear pathology is related to the uniformly high threshold, broadly tuned, FTCsobtained in such preparations (KlANG et al., 1970; EVANS, 1972b). Clearly more correlative studies are required between single fibre and gross AP recordings.
Most recently it has been claimed. that potentials reflecting activity in the cochlear."!1ucleus and higher auditory centres as well as the cochlear nerve can be recorded from the region of- the pinna in man and animals (LEV and SOHMER,
1972).

72 E. F. EVANS: Cochlear Nerve and Cochlear Nucleus
V. Effects of Activity in Efferent Pathways As the anatomy and functional properties of the recurrent, efferent, auditory
system are fully discussed in Chapters 8 and II of VoJ. V /1 of the Handhook, only a brief account of the direct effects on the cochlear nerye and nucleus will he giyen here.
A. Cochlear Nerve The efferent fibres which project to the cochlea originate in the superior
oliyary nucleus (SON) of the same and contralateral sides, forming the uncrossed and crossed olivocochlear bundles (OCB) (R.ASMUSSEN, 1960, 1964). The effects of electrical stimulation of the OCB on the cochlear nerve were first noted by GALAMBOS (1956) ·with gross ne.rYc AP recordings. Subsequent studies of the AP response (DESMEDT and MONACO, 1962; and PEAKE, 1966; DEWSON, 1967; NIEDER and NIEDER, 1970; GALLEY et al., 1971) and of single cochlear fibres (]Ex, 1962; WIEDERHOLD and KIANG, 1970; WIEDERHOLD, 1970; TEAS etal., 1972) have established a consensus of opinion in regard to the effect of artificial stimulation of the efferent system at this level, while paradoxically its action in the behaving animal remains obscure (GALAMBOS, 1960; IRVINE et al., 1972). Because of its accessibility, the crossed OCB has been the component studied most thoroughly.
Electrical stimulation of the crossed OCB results in an inhibition (neyer an increase) in the activity of most, but not all cochlear fihres. Individual fibres show considerable differences in sensitivity. It takes 40-110 msec for the maximum effect to occur, while fibres take 100-400 msec to recover after the termination of electrical stimulation, fibres with higher CF having a longer latency of effect yet taking a shorter time to recover. The inhibition involves activity evoked by acoustic stimuli, but there is some uncertainty whether the spontaneous activity can be so affected. In a careful study on this point, '¥IEDERBOLll and KIANG (1970) found definite maintained reductions in the spontaneous activity of a small pro-portion of their fibres (e.g., Fig. 44A), but these were restricted to the lowest threshold fibres, and the question remains whether, in spite of preca,TItions, these fibres were being subjected to low level background acoustic stimulation such as may arise from the respiration aDd circulation. The time course of the inhibition and recovery is illustrated in Fig. 44A.
The magnitude of the suppression by stimulation of OCB depends on many factors, ilicluding the parameters of acoustic and electrical stimulation HOLD and KIANG, 1970). In a systematic study, where the latter parameters were optimized, WIEDERHOLD (1970) examined the effects of prior electrical stimulation of the crossed OCB on the responses of cochlear fibres to tones. In nearly all cases, the effects could be summarised as a greater or lesser degree of shift of a fibre's discharge ra,te versus intenSity function to higher sound levels (Fig. 44B). In other words, the suppression was maximal (and nearly constant) over an inter-mediate range of tone intensities, and :minimal at subthreshold and supra·satura-tion intensities. The ma,gnitude of the shift is maximal when the fibre is being stimulated at its CF. Thus, OCB stimulation reduces the sharpness of the F.rC (Fig. 45A), by a factor of 7-31 % expressed in terms of Q'OdB. In addition, the
Coch1ear Nerve 73
magnitude oHhe shift differs from fibre to fibre over a range of i -25 dB, maximum values being obtained for fibres in the intermediate range of CFs (Fig. 45B). Similar results were obtained in the guinea pig by TEAS ot al. (1972). These findings are consistent with those from studies of the gross AP response to acoustic transients, where the degree of suppression observed differs from animal to
c .D
-" .0.
A
: .. ,.: .... : .... : .... : 200:·· .. : .... .... :, ... :
Vl 200:
100 .... : .... : . . .
o 10 20sec
ru "2 200
B
/ /
/ I
I I
I i I I I
I . /
l /
/ /
I-I flu
:"'-..-_¥' Span!.
20 Relative tone burst level (dB)
-- ...... ---«
60
j;"'ig. 44.A, B, Effect of crossed OCB stimulation on spontaneous and tone evoked activjty of cochlear fibres, Cat. A: PST histograms of effect of electrical stimulation of the crossed OCB (during bar) on spontaneous activity (above) and on activity evoked by a, continuous tone at the fibre's CF (11.58 kHz), 10 dB above threshold (below). Ordinate scale (spikes per bin) and number of presentations represented by the two histograms arranged so that equal bar heights represent equal discharge rates. (From 'VIEDERHOLD and KIANG, 1970.) B: Mean discharge rate (spikes/sec) evoked by 40 maec tone bursts at the CF of a. cochlear fibre at the relative stimulus levels indicated, without (continuous line) and immediately preceded by electrical stimulation of the crossed OCB (interrupted line). Spont. indicates spontaneous discharge rate. Upper arrow indicates onc determina,tion for estimate of mean shift of the rate· intensity
function, Llu used in Fig. 45B. (From V\TIEDERHOLD, 1970)
animal over a range of 13-23 dB, is minimal at high click levels, and is maximal for high frequency acoustic transients (WIEDERHOLll and PEAKE, 1966). The dependence of the magnitude of the inhibition upon the CF of the fibres may correlate with the finding that the density of the efferent inuervation of the outer hair cells is ID,;,ximal in the basal turn of the cochlea and decreases towards the apex and in the extreme basal end (I8Jm and BALOGH, 1968). This point will be further discussed in relation to the question of the cochlear inuerva,tion in general in Section VI.E.

74 E. F. EVANS: Cochlear Nerve and Cochlear Nucleus
Whereas histocl;temical findings suggest strongly that the efferent endings are cholinergic, pharmacological evidence is incomplete (for reviews see WmTFIELD; 1967; KLTh"'XE a:",; G. _', 1974).
The functional role of the cochlear efferent system IS surprisingly unclear, in spit· , +hc abovo datn. No effects of section of the crossed OeB have been obsei'-
B •• • 20
10 . 1· J " .0 00
o , v • + •• .
,. .1 :J 0
Tone frequency (kHz)
Fig. 45A, B.·Effectof crossed OCB stimulation on cochlear' fibres as a function of stimulus frequency (A) and fibre CF (B). Cat .. A: FTCs (where tone threshold level i. expressed in terms ofmpes displacement) of single cochlear fibre with (a) and without (b) electrical stimulation of crosaed OCB. (From KiANG.I al., 1970.) B:. »lot of mean abift of rate intensity function, ;1,£ (see Fig.44B) for 14fcochlear fibres agamst their CF.Different symbols represent'different,
. animals. (Frem WIEDERHOLD, '1970) '"
Cochlear Nerve 75
ved on absolute behayioural threshold (DEWS ON, 1968; IGARASm et al., 1972). Of considerable interest has been the question whether efferent activity can increase .he detection of acoustic signals in the presence of background noise. Such an effect was inferred by DEWS ON (1967) and apparently demonstrated by NIEDER and NIEDER (1970) from the effect of electrical stimulation of the OCB on the gross AP
A
.! I II I I! II r II r! II1111I1 t I11111 111111; 1 i' II; 1111 II I 1 sec
u 1.0 B "' ID
.>: '" '" ID ... '§ 20 ... ... ID ... '" ..... " ..... '& .....
'" 0 ... 0 15 30 60 90
Tone level (dB)
Fig. 46A, B. Response of oochJear efferent fibres to tones. Cat. A: Response to tone at 66 dB above threabold. Note regular discharge and absence of adaptation. Tone commences at tim •
marker. B: Rate: intensity function for the fibre shown in A. (From FEX, 1962)
responses to clicks in background noise. Behavioural evidence, however, is conflic· ting (compare DEWSON, 1968, and Coms and PICKLES, 1972; with Trum:OTIS and ELLIOTT, 1970; and I,G.ARA.sHI et al., 1972). In fact, apart from the fin· ding of CAPPS and AllES (1968) that the frequency discrimination of squirrel mono keys deteriorated Biter crossed OCB section (contrary to what would be expected from the effect of the OCB on cochlear tuning, Fig. 45A), investigations loolring for systematic effects of the OCB at the cochlear level xelated to attention, con· ditioning etc. in behaving animals (with their middle ear muscles cut) have pro· ved negative (GALAMBOS, 1960; IRVINE et al., 1972).
FEX (1962, 1965) has recorded the activity of the crossed and. uncrossed efferent fibres themselves in the vestibulo·cochlear anastomosis in unanaesthetized decerebrate cats with the ipsilateral ear destroyed. Most of the fibres were silent in the absence of acoustic stimulation to the contralateral ear, but· when acti'vated by tones gaYe a low, regular, discharge with little adaptation; after a latency of 5-40 msec (Fig. 46A). The FTCsof the crossed fibres resembled those of VeN cells, whei'easthose of most of the uncrossed fibres had both excitatory and inhi· bitory response bands (FEx, 1965). Interestingly, the discharge rate versus tone

76 E. F. EVANS: Cochlear Nerve and Cochlear Nucleus
intensity'functions, for some of these units at least, have dynamic ranges in excess of 60 dB (Fig. 46B). In other experiments, FEX (1963) found that the crossed efferents were best activated from the ipsilateral ear.
B. Cochlear Nucleus At least four efferent pathways to the CN have been described (e.g. RASMUS·
SEN, 1960). The first takes origin from the OCB. The second enters the DCN via the dorsal acoustic stria and takes part origin from the ventral nucleus of the con· tralaterallaterallemniscus. The third enters via the intermediate stria, originates in the S segment of the ipsilateral SON, and terminates chiefly in the VCN. The fourth takes origin in the ipsila,teral inferior colliculus and dorsal nucleus of the lateral lemniscus and enters the DCN via the trapezoid body. Investigations of the actions of these pathways, with the exception of the last, have been made by elec-trical stimulation of the nuclei of origin.
DESMEDT (1960) was the first to describe an inhihitory efferent effect on gross potentials recorded in the CN of the unanaesthetized decerebrate cat after electrical stimulation 'near the ventral nucleus of the lateral lemniscus. Recording from single units in the anaesthetized cat, COlllIS and WHITFIELD (1968) found that electrical stimulation of the ventral nucleus of the contralateral lateral lemniscus evoked inhibition of spontaneous and tone evoked activity in the DCN. Stimu-lation of the dorsal nucleus of the contralateral lemniscus, on the other hand, generally evoked inhibition in the DCN and excitation in the VCN.
COlllIS and WHITFIELD (1968) and COlllIS (1970) have studied the effects of electrical stimulation of the SON on the responses of cells in the ipsilateral CN. They used direct-current stimulation to minimise the effects on afferent and efferent fibres of passage. Stimulation of the medial portion of the S segment pro-duced an increase in spontaneous and tone evoked activity in A VN cells with, in some cases, a reduction in threshold of up to 15 dB. The minimum latency of the effects was 25-50 msec. There is a considerable body of evidence suggesting that this pathway is cholinergic (RASMUSSEN, 1964; COlllIS and WmTFIELD, 1966, 1968; COlllIS and DAVIES, 1969). Stimulation of the lateral portion of the S:segment, in contrast, evoked inhibition in cells of the DCN and in some cells of the VCN (C01l!ITS, 1970).
STARR and WERNICK (1968) also found excitatory and inhibitory effects on single units of the CN, but resulting from stimulation of the crossed OCB in decerebrate cats. Both the spontaneous and tone evoked activity were affected. Inhibitory effects were the most commonly encountered, and the effects on the spontaneous activity persisted after destruction of the ipsilateral cochlea. Never-theless, the question remains how far the effects on tone evoked activity were mediated via the cochlea.
Inhibition of cells in the CN can be obtained by acoustic stimulation of the con-tralateral car (PFALZ, 1962; DUNKER, GRUREL, and PFALZ, 1964; KLINKE et al., 1969; MAST, 1970b). The effect is not mediated by the crossed OCB, but dis-appears when lesions are made in the trapezoid body (GRUREL et al., 1964). PFALZ and his co·workers demonstrated the inhibition on the spontaneous activity after destruction of the ipsilateral cochlea, a finding that suggeststhat it was the DCN
Cochlear Filtering 77
that was being recorded from (see Section III.B.3), in keeping with the findings of MAST (1970b). The effect can be obtained with contralateral tones within 40 dB of the animals' behavioural threshold, where interaural cross-talk can be excluded (BOERGER et al., 1968), thus enabling a study of contralateral inhibition with both cochleas intact (Kr.rnKE et al., 1969). While the effect on the responses to ipsilateral acoustic stimulation was smaJl at these levels, it was frequency dependent: fre· quencies immediately on either side of the unit's CF were most effective in depres-sing the response to ipsilateral tones at the CF. Again, the latency of inhibition was relatively long: from 30-50 msec (KLINKE et al., 1969).
It is not at all clear what the functional relevance of the efferent pathways actually is. In spite of encouraging early reports, later studies of the grossly record. ed CN activity in behaving animals under conditions of directed attention and con-ditioning have not found consistent effects attributable to a descending control system (see WHITFIELD, 1967 for review), with the exception of the series of ex-periments by PmDINGTON (e.g. 1971) in the fish.
VI. Discussion The large body of data which has been collected at this peripheral level of the
auditory system, and particularly those quantitative studies conducted under con· trolled conditions, have given rise to considerable efforte to relate them to cochlear mechanisms on the one hand, and psy.chophysics, including disorders of hearing, on the other. This section will be limited to these topics, and to a brief account of their relevance to the problem of coding of frequency .. nd intensity information.
A. In Relation to Cochlear Mechanisms In the wake of the quantitative studies, summarised in earlier sections, partic.
ularly those of the cochlear nerve, a number of "black box" models of the inner ear mechanisms have been developed (e.g. SIEBERT, 1965, 1968, 1970; WEISS, 1966; GEISLER, 1968; DE BOER, 1969; DUIFHUIs, 1970, 1972; models restricted to cochlear mechanics are dealt with in Chapter Mathematical Models in Vol. V /3 of this Handbook). While it is evident that many of the components of these models cannot be identified with presently available physiological and anatomical data nor presented with the same degree of confidence, nevertheless the models continue to serve useful explanatory and heuristic purposes. One of the earliest and probably the most comprehensive of these models, that of WEISS (1966) will Serve as a useful point of departure (Fig. 47).
1. Cochlear Filtering The first compartment of the model accounts for the mechanical properties of
the outer, middle and inner ears. In Weiss's model, these were considered to be linear over a large intensity range (80 dB), and the frequency response characteristics of the outer and middle ears were neglected. For the purpose of accounting for the dependence of threshold on frequency represented by the audiogram, it is, clear now that the effect of the outer and middle ear response can be quite significant

78 E. F. EVANS: Cochlear Nerve and Cochlear Nucleus
(PRICE, IV71; DALLos, IV71; JOHNSTONE and SELLICK, IV72). There is, however, still uncertainty on whether the audiogram can be entirely accounted for in this manner, or whether inner ear mechanisms are also to be implicated, as WEISS assumed (MA:r.""LEY, 1970b, 1971; EVANS, 1972b; EVANS and WlLSON, 1973).
01.1) MECHANICAL
SYSTEM TRANSDUCER
z{t,x)
MODEL NEURON
Fig. 47. Compartmental outline of model of WEISS (1966) relating the discharge of cochlear nerve fibres to acoustic stimuli. p (t): pressure at ear; 1/(t, :r): displacement of cochlear partition; z(t, :r): output of transducer; I(t,:r): sequence of discharges; r(t,:r) threshold potential; g(I):
linear t: time; x: distance along cochlear partition
The major component of the first compartment is the band-pass £1tering characteristic existing at any point along the cochlear partition: The nature of this £Iter function, and its relation to the form of the neural FTCs continues to be the subject of much experiment and discussion. The similarity between the first successfully measured cochlear fibre FTC (TASAKI, 1954 in the guinea pig) and the so-called resonance curves of the cochlear partition (e.g. BEllsy, I V44) has prompt-ed the conclusion that the relatively broadly tuned characteristics of the baSilar membrane were handed on to the auditory nervous system relatively unchanged (e.g. BEllsy, 1969, 1970; WmTFIELD, 1967, 1968). However, the more recent FTC measurements in cat (KIANG et al., 1965a, 1967) indicated that its cochlear nerve frequency responses were substantially sharper than BEKESY's curves. It has now been shown (EVANS, 1970a, 1972b) that this is in fact true for the guinea pig, so that {lomparisons can be made, (Fig. 9B) between the neural and'mechanical tun, iug in the same,species, but more importantly at the same frequencies. For the latter purpose we nOW have measurements of the frequency response at the basal end of the guinea pig basilar membrane by JOHNSTONE, et al. (l970) using the Miissbauer technique and by,WlLSON and JOHNSTONE (1972) using a capacitive probe. Both mechanical and neural functions show an'increase in sharpness with frequency, but at all frequencies the two sets of data are substantially different. These differences can be examined quantitatively in Fig. 10 (£1led circles versus star symbols). The most conspicuous difference is in the slopes of the low frequency cut-off of the cochlear nerve FTCs, which are steeper than the analogous mechanical values by factors of between 2 and 12 for fibres with CF below 2 kHZ, and between 6 and 36 for those above 2 kHz. Above 2 kHz the neural high.frequency cut-offs are 1-7 times as steep as the mechanical. (Slopes here measured are of the cut-off segment between 5 and 25 dB above the tip of the curves). In terms of 10 dB band-width (Fig. 10C), the neural FTCs were narrower than the mechanical functions by a factor approaching an' order of magnitude at intermediate CFs (3-10 kHz).
Cochlear Filtering 79
Unfortunately, ,no actual measurements of the guinea pig basilar memhrane motion exist at these intermediate regions.
The question arises whether one is justified in making these comparisons between the neural frequency response functions determined at threshold and the mechanical functions determined a,t much higher sound levels (above, and in most cases well above, 70 dB SPL). This question has received added force from the recent Miissbauer measurements of RHODE (W71, 1973) in the squirrel monkey. While his published slope values for the basilar membrane frequency response of a region subserving frequencies of 6- 8 kHz are in substantial agreement with the guinea pig data (large open star in Fig. lOA-C), RHODE found substantial non-linearities in the response at frequencies near the peak of vibration. These were such that, if a constant low amplitude criterion (e.g. 0.003,.,.m, Fig. 7; RHODE, 1971) is used for constructing a frequency response function, then the frequency response function has cut-offs and bandwidth approaching those of cochlear fibres of wmparabJe CF. However, the fact that this derivation depends upon a level dependent non-linearity which was specifically not foUnd by BE:KJ1lsy, JOHNSTONE et al., and WlLSON and JOHNSTONE (the latter over SPLs from 40-120 dB at the peak) makes it difficult to interpret. More mechanical data are evidently required in this intermediate frequency region to resolve this discrepancy between the data of RHODE and the other investigations. In this connection, it is appropriate to note that the frequency response inferred from the differential cochlear microphonic study of the guinea pig by DALLOS (1973), is in close agreement with that of WlL· SON and JOHNSTONE in both relative amplitude and phase. The correspondence between the neural data of Figs. 9 and 10 make a substantial species difference seem unlikely. As far as the question of using threshold criteria for estimating nem al tuuing is concerned, there is no evidence that isorate contours constructed for cochlear fibres become less sharp as higher rate criteria are used (Fig. 13) at least oyer the 30-40 dB range available before saturation of the discharge rate is reached (above these levels, there is evidence of a decrease in sharpness of the c,ochlear £lu;>r: see later in this section). Furthermore, the slopes of the high fre-quency cut-offs of the neural FTCs become steeper at higher levels, whereas the measurements of RHODE, WlLSON and JOHNSTONE, and JOHNSTONE (personal communication) have in common an as yet unexplained plateau of the vibration amplitude at about 30-40 dB from the tip on the high frequency side.
HU;><LEY (1969) raised the question whether the discrepancy between neural and mechanical measurements could arise as a result of the surgical opening of the cochlea necessary to make the mechanical measurements thus disturbing a mechanical resonant system, However, EVANS (1970b) has shown that normally sharp FTCs, can be recorded from cochlear fibres emanating from the region of the guinea pig basilaI membrane exposed as in the experiments of JOHNSTONE et al. and WlLSON and JOHNSTONE.
To reconcile the sharp nem al tuning with the relatively broadly tuned prop. erties of the basilar membrane, WEISS inserted a second linear ,filter into his model, but in the neurOJ:le compartment. He used a £Iter which was essentially
but with a constant slope of decrease in sensitivity with Increasing fre-quency which effected some improvement in the slope of the low frequency cut-offs. It is clear, however, from the data of Fig. 10, that such a second filter needs

80 E. F. EvANS: Cochlear Nen'e and Cochlear Nucleus
to be band· pass in its characteristics. This notion of a second, more sharply tuned, filter succeeding a relatively broad basilar membrane filter has received support from a. number of sources. Firstly, a feature of the neural FTCs is the considerable va6a.tion which exists in the cut-off slope, and bandwidth values; from fibre to fibre even at similar CFs and in the same animal (EvANS, 1972a, b; EVANS and WILSON, 1973): This variation may amount to differences in bandwidth up to a ratio of 4: 1. SecondJy, in the guinea pig (EVANS, 1972a, b) fibres recorded under conditions of cochlear circulatory insufficiency have high threshold, broadly tuned characte6sticsresemblingthoseofthe basilar membrane (small open circles in Fig.l0): In addition, such ,fibres are occasionally found apparently adjacent to and sharing a common CF (above 12kHz) with fibres of normal threshold and tuning. These findings led us to propose the existence of a second filter "p6vate" to each cochlear fibre, whose normally sharply tuned properties wele thereby physiologically vulnerable and the differences between which could account for the la,ck of homo-geneity observed in the tuning properties of cochlear fibres. It is difficult to recon-cile such properties with any filte6ng properties of the basilar membrane, which would be expected to the evenly distriliuted. Direc.t evidence for such a physio-logically vulnerable second filter is in fact provided by the demonstration that the sharply tuned segment of the FTC can be elimInated and restored within a few minutes by the action of hypoxia and certain agents (cyauide, Frusemide) on the cochlea without sUbstantial effects on the cochlear microphonic (EVANS, 1974b, c, d; EVANS and KLINKE, 1974; vd. p. 18). The time scale of these effects is much shorter, and their magnitude much larger than those that have been observ. ed in lIfossbauer measurements of tlJe squirrel monkey basilar membrane vibration "fter death by RHODE (1973), where all normal cochlear potentials would have been eliminated (e.g. BUTLER et al., 1962). The third line of support for the notion of a second sharply tuned filter comes from studies of two phenomena which are related to cochlear non-linearities, i.e. the combination tone 2 f, - f. and two-tone suppres. sion. Psychophysica],(GOLDSTEIN, 1967, 1970; SMOORENRlJ'RG, 1972b) and neuro-physiological (GOLDSTEIN and KIANG, 1968) investigations of the 2/, - 1. cubic difference tone (CDT) indicate that the "essential" non-linearity be preceded by a frequency selective process (which accounts for the dependence of the level of the CDT on the frequency separation of the primary tones) and also followed by a frequency selective process (to account for the frequency analysis of tlJe CDT to separate it from the primaries). Two possible ways by which this double filtering proCess may be accomplished have been proposed by the above authors. In the first, the coupling hypothesis, the nonlinear process is tightly coupled to a sharply tuned distributed mechauical frequency analyser (the basilar membrane), so that the CDT generated at the region of overlap of the primaries is fed back to the basilar membrane and analysed at the place appropriate to its frequency. In the second (two-filter) hypothesis, the non-linearity follows a broadly tuned basilar
filter, and the CDT it generates is not coupled back to the basilar membrane but is analysed by a separate, more sharply tuned filter. The ingeuious study by SMOORENBURG (1972b)of a subject with a sharply-defined hearing defect (likely to be of hair cell origin) excludes a third possibility, perhaps implicated in the results of RHODE (1971),;n which the non-linearity resides in a sharply tuned basilar membrane. The two filter hypothesis is in fac.t favoured by the demonstra.
Cochlear Filtering 81
tion that no 21, - t. component of the magnitude predicted by the coupling hypo. thesis is present in the basilar membrane vibration pattern, according to the differ-ential cochlear microphonic data of DALLOS (1969) and the direct measurements of basilar membrane vibration by WILSON and JOHNSTONE (1972, 1973), using a capacitance probe teclmique. Lastly, PFEIFFER (1970) has demonstrated that such a two filter model 'can also account, qualitatively at least, for the characteristics of the two tone suppression encountered in the cochlear nerve (Section II.E.1.a).
In spite of the presence of these cochlear non-linearities, there is now a good deal of evidence that, for a wide variety of stimuli, the sharply tuned cochlear filtering process(es) act as if they were linear, at least over a 30-60 dB range above threshold. This holds for wideband noise assessed by two different methods (Section II.E.2), for click stimuli (Section I1I.F.3), and for comb-filtered noise (multicomponent spectra: Section I1.E.3), and in each case the effective band-width of the filtering approximates to that of the pure tone FTC. As will be noted later (Fig. 48; Section VI.C.l) the magnitude of the effective bandwidth of the cochlear filter corresponds to the analogous psychophysical measure, the critical
-band. GOLDSTEIN et al. (1971) have made an interesting comparison of cochlear nerve response times estimated from click responses and pure tone data with those computed on the basis tlJat the cochlear filter responsible for the FTC was a minimum phaselinear filter. The tolerable degree of agreement led them to con-clude that tlJe cochlear nerve FTC, phase and click data were interr.elated in a manner similar to that whiclr would be predicted for a linear filter system. The important point tlJat they make is that the response time (which is approximately the delay to maximum response of the system) of any linear filter system cannot be less than that for the minimum phase filter. In the case of their own (cat) data it appears that the agreement was obtained ouly by neglecting the finite synaptic delay and neural' conduction time. The former could be about 0.5 msec, and the latter, from the latency of direct electrical stimulation of the cochlea (KIANG and MOXON., 1972) 0.5 msec also. Taken at face value, this then suggests that the response of the cochlear filter is faster than th .. t of a minimum phase network by approximately 1 msec, If tJIis is tlJe case, it is serious evidence against the sharply tuned second filter being linear. On the otlJer hand, the com-parison of GOLDSTEIN et al.· (1971) may be rendered inaccurate if, as appears to have been the case, the tone phase and click data from which the estimates of response time were derived, were obtained at high stimulus levels . .A$ Fig. 6 demonstrates, the 'response time indicated by the click PST becomes substantially shorter at higher levels. In other words, comparisons of response times computed. from the frequency threshold curves should be made with esti-mates derived from click and tone phase data within 20-30 dB of threshold.
The sharp filtering characteristics of cochlear fibres appear to remain relatively unchanged over at least an intensity range of 30-60 dB above threshold (see Section I1.D.l; I1.E.2; ill.F.3; see also EVANS and WILSON, 1973). At higher levels, however, there is some' indication that the cochlear filter becomes nonlinear, or less sharply tuned, or botlJ. The increasingly noulinear behaviour'with stimulus level of cochlear fibres in respect of two tone interactions has already been noted (Section I1;E.I.c). In addition, the investigation by GoRLICK and PFEIFFER (1969) of the extent of cochlear linearity (by an ingenious method involving the nulling of

82 E. F. EVANS: Cochlear Nerve and cOchlear Nucleus
inillvidual peaks of the cochlear nerve PST histogram in response to a click by a second click stimulus) has demonstrated the existence of an amplitude non· linearity increasing from zero to about 6 dB over the upper 20 dB of the 40 dB dynanlic range tested (probably representing levels of 40-60 dB above threshold). Furthermore, the fact that fewer than expected later peaks appear in the click PST histogram with increase in stimulus levels (e.g. 30-70 dB in Fig. 6, where the scale is constant) has been interpreted as an indication of a decrease in the system's "Q"at higher levels (PFEIFFER and Krn, 1972; compare response of WEISS' (1966) model). The progressive shift of the mode of the PST histogram to the left with increase in stimulus level (from ca. 8 msec at + 10 dB to ca. 3 msec at + 70 dB above "threshold" in Fig. 6), implying a decrease in the "response time" of the filter, would also appear to support this conclusion. An increase in damping of the cochlear filter with stimulus level has also been proposed by ANDERSON et al. (1971) as a possible explanation of the changes in phase of cochlear fibre discharge with level of low frequency tone stimulation (Section n.DA). All of these finillngs may; of course, be consistent with the basilar membrane vibration patterns observed by RHODE (1971; see discussion by PFEIFFER and Krn, 1973), but, as illscussed above, the interpretation of his data remains a difficult question.
Many mechanisms have been proposed to account for the sharpening of the basilar membrane frequency response discussed above. These range from mechani· cal processes (e.g. "beam" hypothesis of HUGGINS and LrCltLIDER, 1951; Ion. gitudinal shear model of TO:!.'NDORF, 1962, KHANNA et al .. 1968; fluid·hair cell coupling, STEELE, 1973), through innerVation pattern models \e.g. NIEDER, 1971), positive feedback models (GOLD, 1948); to lateral inhibition (e.g. BEKESY; 1960, 1970; FuRMAN and FmSHKOPF, 1964). none of these mpdels appears to account quantitatively for the extent of sharpening required and at the same time is consistent with the 'available physiological and anatomical data. Evidence against lateral inhibition as a mechanism in the cochlea has been pre· sented above (Section n.D.,n.E.l.a, n.E.3, nLF.3). GOLD'S model, involving a positive feedback mechanism, has some attractions in relation to the physiological. ly vulnerable second filter hypothesis and the mechanisms underl:¢ng tone· like tinnitus, in spite of it being based on estimates of cochlear "Q" which were incorrect by over. an order of magnitude and which were derived from incorrectly interpreted data (vd. HrnSEY and SCHUBERT, 1972). Another class of second filter type mechanism, as yet not explicitly treated, involves some form of active "resonance" of electrochenlical nature within the hair cells themselves. Such a mechanism, however, would appear to have too high a noise linlltation set by Brownian motion for a system loosely coupled to the basilar membrane or other structures, if the arguments of lliRms (1968) can be applied' to this situation.
Clearly, further experimental data on the properties of the basilar membrane and of the hypothetical frequency sharpening process ;tre required before further assessment of these and other models is appropriate.
2. Transducer Nonlinearity The second compartment of WEISS' model incorporated a non·linear no·
memory transducer. The non.linearity was invoked to aCcount for the greater
Generation of Coch1ear Nerve Discharges
number of peaks encountered in the cochlear nerve PST histogram in response to a click, compared with that computed from a model based on B:EK:ESY'S basilar membrane data. (In fact, data from recent measurements of basilar membrane motion (ROBLES et til., 1973; WILSON and JOHNSTONE, 1972) indicate that the (more basal) cochlear partition is less damped t,han was thought by BEKESY.) DE BOER (1969) first snggested that such a· nonlinearity could be dispensed with if the linear cochlear filter was made as sharp as that required to account for the FTC. The fuiite "response time" (see GOLDSTEIN et al., 1971; above) of such a filter could also account for the appearance of earlier peaks in the PST histogram on raising click levels above threshold, which were inexplicable on WEISS' modeJ..
Two types of cochlear non· linearity , both of which have received some atten· tion above, may well, however, reside in the transducer stage. The first is the so· called "essential" nonlinearity (ZWICKER, 1955; GOLDSTEIN, 1967, 1970) responsi. ble for generation of the 2 I, - I, combination tone (eDT). Psychophysical measure· ments of this CDT indicate that it is generated at stimulus levels close to threshold, and that its level is proportional to the level of the primaries (GOLDSTEIN, 1967; SMOORENBURG, 1972a; see Section II.E.lb). This nonlinearity is therefore not a level.dependent saturating type of non·linearity (such as that responsible for the difference tone, f. - f" heard only at much higher stimulus levels, GOLDSTEIN, 1967). It could also be responsible for the generation of the two· tone suppression phenomenon observed in the cochlear nerve, the effects of which are also observable close to threshold (Fig. 22; Sectionn.E.l.a).
The second type of non.linearity is that discussed in the section above, reo sponsible for the deviation of certain cochlear nerve properties from linear be· haviour at stimulus levels higher than 40-60 dB above threshold (e.g. Sec· tion n.E.I.c).
3. Generation of Cochlear ,Nerve Discharges In the third compartment of WEISS' model, the transducer output was added
to internally generated low.pass filtered noise to produce a noisy membrane potential which, whenever it exceeded a threshold, triggered a neuronal spike. Immediately after each spike, the threshold was reset to some higher value (by the component R in Fig. 47) from which it decayed to a resting value. These features were incorporated to account respectively for the spontaneous illscharge and probabilistic supra.threshold behaviour, and the refractory period exhibited by cochlear fibres.
A threshold trigger mechanism was also incorporated in the models of GEISLER (1968) and DE BOER (1969) which modified the overall model of Wmss to account for cochlear nerve behaviour in response to low frequency tones and broadband noise. A problem with all these threshold trigger type models is that they fail to describe adequately .the responses cf cochlear fibres to high level click and low frequency tone stimulation (DE BOER, 1969; GEISLER, 1968; DUIFHUIs, 1972). In particular, at high stimulus amplitudes, the effects of the internal noise would be expected to become less significant, and the temporal "jitter" observed in the PST histogrl!Jl!s of activity evoked by clicks (e.g., Fig. 6) and tones (e.g., Fig. 18) should show a tendency to disappear, which is manifestly not the case. Similarly the phase of discharge sh?uld correspond increasingly with the hypothetical zero crossing at

84 E. F. EVANs: Cochlear Nerve and Cochlear Nucleus
higher levels, which again does not occur 'with noise (Fig. 25) or with tones at the CF of a cochlear libre (Fig. 18).
For these reasons, SIEBERT (e.g., 1965, 1970) and DUIFHUIs (e.g., 1972) have instead utilised in their models a stochastic spike generator where the probability of discharge at any instant is a continuous function of the unidirectional amplitude of the transducer output (i.e.: there is no threshold trigger level). The .properties of adaptation and saturation of discharge can either be incorporated in the mathe. matical relation connecting the discharge probability to the transducer output waveform (SIEBERT), or,as in the case of refractoriness, as a multiplicative feedback from the spike generator output to the input to the Poisson probabilistic generator (DUIFHUIs, 1972).
An outcome of both classes of model is the effective rectification of the stimulat· ing waveform, which is demonstrated most clearly in response to click, tone, and noise stimulation in Figs. 6,1613, 17, 18,24,25, all of which show a discharge pattern more clearly correlated with the stimulus wa.veform (stochastic model) than a threshold crossing (threshold trigger) model.
DUIFHUIS.' (1972) model incorporates a linear filter with a finite "response time" (consistent with the cochlear nerve FTC properties) to precede the Poisson process, and accounts satisfactorily for the statistics of cochlear fibre spontaneous and tone evoked discharges (e.g. Fig. 2), for interspike interval and period histo· grams of the response to low frequency tones (e.g. Figs. 19 and 18 respectively), and for PST histograms to click stimuli (including the shift of the centre of gravity to the left with level introduced in the.model by a reduction of filter "Q" at higher stimulus levels).
The incorporation of a linear filter with finite "response time" in DUIFHUIs' model (as in GOLDSTEIN et al., 1971) eliminates the need for some form of feedback control, as in the model of LYNN and SAYERS (1970), to account for the apparent "suppression" of the early peaks of the click evoked PST histogram .
.All of the models referred to above may have to be revised in the light of very recent findings which run counter to the generally accepted conclusion that the spike generator discharged only in response to "upward" movements ,?f the basilar membrane, i.e. towards .the scala vestibuli, (e.g. in response to the predominant component of a rarefaction click, KuNG et al., 1965a). Thus, under low frequency tone (KuNG and MOXON, 1972) or (DE BOER, 1969) stimulation, different cochlear fibres exhibit differing phases of discharge inspite of their having a similar CF. More strikingly still, KONIsm and NIELSEN (1973) claim to have found a majority of guinea pig cochlear fibres which were excited by static "downwards" displacement of the basilar membrane (i.e.: toward the scala tympimi), a minority whose .spontaneous· discharge was inhibited by the same displacement, and a substantial proportion of fibres which were excited during dynamic changes of membrane position. It is uulikely that these differences can be accounted for by different hair cells having different "polarities" to movement of their hairs, in view of their basal bodies being oriented in the same direction (see FLOOK, 1971). Perhaps the differences may arise from different modes of bending of the hair cells, as suggested by the recent findings of DALLOS et ril. (1972), who infer that the outer hair cells (mainly responsible for generating the cochlear microphonic) are sensitive to displacement, while the inner hair cells are sensitive to the velocity of
In Relation to Cochlear Innervation 85
endolymphatic flow (consistent with the anatomical evidence which suggests that, the inner hair cells, unlike the outer hair cells, are not attached to the tectorial membrane, e.g. LIM, 1972). At least, all of these findings underline our almost complete ignorance of the processes lying between the displacement of the basilar membrane and the generation of nerve impulses in the cochlear nerve (see also FEX, volume VII).
B. In Relation to Cochlear Innervation The question remains open as to what part the complex innervation patterns of
the cochlea might take in the mechanisms discussed in the last section. There is good evidence that the probabilistic generator responsible for the "jitter" of discharge to low frequency tones (vd. Section II.DA) and which is sensitive to non. excitatory outputs of the transducer, thus mediating static (vd. above) and dy. namic (vd. Section II.C) depression of spontaneous activity, is located peripheral to the generation of action potentials, and, therefore, presumably in the hair cell. synapse area. Similarly, the process underlying the saturation of discharge rate is not likely to be in the nerve fibres, in view of KuNG and MOXON'S (1972) obser. vation that direct electrical stimulation of the cochlea (and therefore presumably of the cochlear fibre initial segment) could evoke higher rates of discharge. than could be evoked by acoustic stimulation. In keeping with this, the passage of direct current through the cochlear partition augments the "spontaneous" and "evoked" activity without affecting the maximal (saturation) discharge rate .(KoNIsm et ril., 1970). Perhaps the most economical hypotheses are to locate the transducer process inthe hair cell (as in the generally accepted hypothesis of DAVIS, 1965, for eM), and the probabilistic generator in a chemical transmission process in the synaptic junction. Refractory processes could be located in the nerve itself. Unfortunately, chemical transmission 'has been con£rmed only in ·the fish sacculus, in an important series of experiments by ISHII. et al. (1971) and by FURUKAWA e/ al. (1972).
One problem which has attracted considerable attention is the role played in cochlear nerve responses by the outer spiral fibres innervating the outer hair cells (ORC). The ORC have been held responsible for the low thresholds of cochlear fibres in contrast to the presumed higher thresholds of the inner hair cells (mC), inferred from the assumed relative mechanical disadvantage of the latter. Row. ever, the detailed electron microscopic studies of SPOENnLlN (1966, 1968, 1970, 1971, 1972) in the cat indicate that no more than 5 % of the the fibres leaving the cochlear partition originate in the ORC. In other words, the great majority of fibres record" ed by microelectrodes in the cochlear nerve must innervate the me. Yet it is theSe fibres which have uniformly low thresholds approximating to behavioural thresh. old (Fig. 8). Apart from the very recent description by PFEIFFER and KIM (1972) of "anomalous" PST histograms to click stimuli in 7 % of their cat cochlear fibre population (where the number of peaks increased dramatically up to 34 with increase in level), there is no real evidence for the separation of the cochlear nerve into two fibre populations, particularly on the basis of threshold and· tuning prop. erties (see discussion of cochlear nerve homogeneity in Section II.D). ·This is in spite of assertions to the contrary from observations on threshold tnning and rate.

86 E. F. EVANS: Cochlear Nerve and Coch1ear Nucleus
intensity properties of cochlear fibres (see detailed discussion in Section II.D.l,2) and from studies of the gross cochlear AP (see d·etailed discussion in Section IV).
On the other hand, there is bome ev:idence suggesting that the cochlear fibres innervating the IRC may receive interaction from outer spiral fibres or actually be dependent upon the latter for their normal function. Firstly, KIANG et al. (1970), recording from the cochlear nerve of cats poisoned with an ototoxic antibiotic; were unable to obtain normal threshold responses in regions ()f extensive ORC loss from fibres innervating IRC which were (to light microscopy at least) normal in appearance. Secondiy , as has been pointed out in Section V.A, maximal crossed OCB inhibition of cochlear fibres occurs in fibres whose CFs correspond with the region of maximal density of efferent innervation of the OHC. In contrast, the density of efferent innervation of the IRC afferents appears to be more evenly distributed (ISHll and BALOGH, 1968). Consequently, it has been concluded (WIEDERHOLD, 1970; TEAS et ai., 1972) that the effectiveness of crossed OCB stimulation corresponds more closely with the pattern of efferent innervation of the ORC than the IRC, (although it must be admitted that the dat .. on the efferent distribution to the IHC afferents are far from complete). In fact, whereas the activ:ity of nearly all cat cochlear fibres can be suppressed by crossed OCB stimu· lation (FEx, 1962; WIEDERHOLD and KIANG, 1970), it has been reported th .. t in the rat the whole crossed OCB innervation goes to the ORC (IURATO, 1964). Recent anatomic .. 1 studieo of the cat cochlea (SPOEI-."DLIN, 1970), however, suggest that at least part of the mc efferent innerv .. tion comes from the crossed OCB.
If the fibres innervating the mc do depend upon the integrity of the ORC for their normal function, this could relate the finding of occasional high threshold high frequency cochlear fibres in otherwise normal cochleas (Section II.D.l.; EVANS, 1972b), to the presence of sporadic ORC loss in normal guinea pigs (WER. SALL, personal communication).
In the absence of signs of synaptic contact or branching (contra NIEDER and NIEDER, 1970) between outer spiral and inner radial fibres, the above considerations lead to the speculation that interaction between one oftheformer and 20 of the latter takes place in each habenular opening, where they become intimately apposed (SMITH and DEMPSEY, 1957; SPOENDLIN, 1970; ARTHUR et al., 197"1; LYNN and SAYERS, 1970). Considerations of the length and diameter of the outer spiral fibres appear to rule out electrotonic conduction (contra LYNN and SAYERS, 1970), and lead to the suggestion that action potentials propagated along them could produce sufficient local current to generate action potentials at the inner segment region of the inner radial fibres. On this basis, and considering for a moment that the ORC are sharply tuned,whereasthe IRC mirror the basilar membrane motion, the low threshold sharply tuned properties of cochlear fibres would be accounted for by ORC activ:ity,. whereas the higher threshold, more broadly tuned, and non-linear neural properties would depend on IRC activity. Under conditions where ORC function was impaired, broadly tuned, high threshold FTCs would result (as in Section II.D.l and from exposure to intense noise and .ototoxic agents). Further. more, the fact that each outer spiral fibre innervates ORC in a higher freqnency· region than that of the inner radial fibres with which it comes into contact could account for the asymmetry of the upper section of the normal FTC and for the relatively greater effectiveness of low frequency compared with high frequency
Critical Band and Other Measures of Frequency Selectivity 87
tones at high levels (see Section II.E.l.c). Similarly, it could account for the shift of the OF towards lower frequencies which accompanies the loss of the sharply tnned low threshold segment of the FTC during the action on the cochlea of hypoxia (EVANS, 1974 b, c, d) and certain ototoxic agents (EVANS and KLINKE, 1974; EVANS, 1974c,d)
Uufortunately, this speculation is, not supported by the close correspondence between OM and basilar membrane filtering properties (Section VI.A) if as DALLaS (1973) suggests, the ORC are almost entirely responsible for the CM generation; and by the fact that the period of the click evoked PST histogram does not show signs of increasing with stimulus level (e.g. Fig. 6).
An alternative possibility is interaction, at the mc level, of local currents generated by the ORC. These are not likely to be in phase with the IRC currents (DALLaS et aZ., 1972). If sufficient phase differences could exist between these IRC and ORC "currents", the otherwise curions abrupt reduction in cochlear nerve spike discharge (see Section II.D.2) and in cochlear microphonic (KA.RLAN et al., 1972) at high stimulus levels could be accounted for in terms of cancellation in the region of overlap of the lower threshold ORC and high threshold IRC "currents".
The participation, in cochlear nerve excitation, of two different excitatory pro. cesses (KlANG and PEAKE, 1960) or of the local efferent innervation (NIEDER and NIEDER, 1970) has also been suggested. Clearly the need'is for more data, before the roles of the mc, ORC, their innervations, and that of other structures such as the giant fibres linking 10 or so IRC (SPOENDLIN, 1971, 1972), can be established.
c. In Relation to Psychophysical and Behavioural Phenomena 1. Critical Band and Opher Measures of Frequency Selectivity
Figure 48 plots a number of psychophysical and behavioral measures of fre· quency selectiv:ity in comparison with the effective bandwidths of cat cochlear fibres (EVANS and WILSON, 1973). "Effective bandwidth" is approximately the half. power bandwidth of the cochlear fibre filter function expressed by the FTC (and defined and measured exactly as in the legend of Fig. 26). It should be empha. sised that by frequency selectiv:ity we do not mean frequency discrimination -the ability to distinguish a change or difference in frequency. What is meant is the ability of the ear to select or separate information arriv:ing at one frequency from that at another. This is expressed in the "critical band", which at any frequency is about 30 times wider than the difference limen for frequency discrimination (ZWICKER, 1970). The critical band expresses the frequency band: within which simultaneously sounded tones cannot be separated (PLOMP, 1964b; MOCLELLAND and BRANDT, 1969); within which power summation occurs for threshold measure· .ments in the presence (GREENWOOD, 1961) and absence (GASSLER, 1954) of mask· ing noise; within which loudness is determined by the summed power of the com· ponents (ZWIOXER et al., 1957); within which tones are effective. in masking a narrow band of noise centred between them (ZWIOXER, 1954); within which the effects of the phase relations between components of modulated tones can be detected (ZWIOXER, 1952); and within which "roughness" arising from a complex of tones can be detected (TERHARDT, 1968, 1970). The critical band. can thus be

88 E. F. EVANS: Cochlear Nerve and Cochlear Nucleus
understood by analogy witb tbe bandwidtb of a linear filter (GREENwoOD, 1961; ZWICKER, 1971). Tbat tbis measure (tbe critical band) determined in man corre-sponds tolerably wen over a frequency range with the ana!ogous measure individual cat cochlear fibres ·(Fig. 48) leads to tbe concluslOn that tbe ear's critical band property deTives directly from the filtering properties of cochlear
10
N I -" .r: "0
c: a 05 .D
'" u
.2' W 0.2
o Critical ratio (cot) Critical ratio (man)
0.1 Critical bond (man]
Grating acuity (man)
0.05 0.1 10 20 0.5 0.2 50
Characteristic frequency I kHz)
Fig. 48. Comparison of effective bandwidths of cat cochlear fibres with human psy,chophysical and cat behavioural measures of frequency selectivity. Circle, triangle, and square symbols: effective bandwidths computed for 140 cochlear fibres from 5 cat.s, plotted against Dotted line: effective bandwidths computed for basilar membrane response curves of BEKESY (1944; open stars) and JOHNSTONE et al. (1970; solid star). Dashed line: critical band values for man (ZVi'1:CRER et ai., 1957). Solid line: critical ratio values for and 1950). Dotted and dashed line: resolving power expressed as effectlve bandwldths for acoustlC grating measurements (WILSON and EVANS, 1971). Enclosed stars: behavioural
of critical ratio in cat (\VATSON, 1963). (From EVANS and WILSON, 1913)
fibres and is therefore already determined at tbe cochlear level (EVANS and V\Tn,-SON, 1973). This conclusion is supported by tbe correspondence between direct measurements of tbe frequency resolving power of cat cochlear fibres (vd. Sec-tion ILE.3) and of human subjects for acoustic "gratings" i.e.: comb-filtered noise (Wn,SON and EVANS, 1971; EVANS and Wn,SON, 1973). These measurements determine the limit of tbe ability of single cat cochlear fibres and of human subjects (in psycbopbysical experiments) to resolve between peaks and valleys of the comb-
!
Masking 89
filtered noise spectrum at successively closer spacings (vd. Fig. 27 and text). The effective bandwidths derived from the psycllOphysical measurements are sbown as tbe dot-dash curve in Fig. 48, although tbere aTe indications tbat the values below 2 kHz may be too low (WILSON and SEELMAN, data to be published), and therefore may a.gree better witb the cat neural data.,
Tbe cocblear nerve effective represent a filter "0." (i.e.: CF/ effective of about 10 from 1-10 kHz (Fig. 48). Tbis figure agrees well with that, derived by DUIFHUIS (197J) from measurement,s of the peripbera.1 filter-ing cbaracteristics of the human ear.
A possible objection to comparison between cat neurophysiological and human critical band data arises from tbe one existing series of bebavioural measurements of an analogous function, the critical ratio (WATSON, 1963; enclosed stars, Fig, 48). In man, tbis function is approximately 2.5 times smaller than the critical band (continuous versus dasbed lines, Fig. 48; ZWICKER et al., 1957), hence the values of critical band for the cat migbt be expected to be well above the points represent-ing tbe measured cochlear nerve effective bandwidtb. However, SEATON and TRAHIOTIS (1973) have recently suggested that such bebavioural indications of poorer frequency resolving ability in animals may in fact not be the case, but may he related to the high criterion adopted in tbe training paradigms .
The correspondence proposed between the critical band measures and tbe effective bandwidtb of cochlear fibre FTCs would appear to account for all of the chara.cteristics of tbe critical band so far mentioned. In addition, it would account: for the findings wbich indicate tha.t the critical band 'does not require any signifi-cant amount of time to be established apart from the "response time" of the cocblear filter (ZWICKER and FASTL, 1972) because the cochlear filter character-istics hold for click stimuli also (Section IILF.3); for tbe increase in tbe critical band with stimulus level (corresponding to the inferred decrease in "0." of the FTCs at;levels 40 dB and above minimum thresbold, vd. Section YLA.l); and for tbe frequency asymmetry of masking (e_g. SMALL, 1959; SCHARF, 1971).
2.1I1asking 'Vhile the arguments of the previous section enable an understanding to be
made of tbe energy and frequency relations whicb exist between masker and maskee signals, the mechanisms responsible for tbe actual elevation of maskee thresbold are less clear. At least four mechanisms have been proposed to explain how peri-pheral auditory neurones are prevented from transmitting or processing information that would be adequately dealt with in the unmasked state. (That masking is not primarily a cocblear mecbanical effect is suggested by its absence in the cocblear micropbonic, e.g. DERBYSlITRE and DAVIS, 1935.) On tbe other band, it must be emphasised tbat explanations based on peripberal mechanisms may be inappro-priate or at best incomplete for high levels of masking, in view of tbe phenomenon of binaural unmasking (first extensively described by HmSH, .1948), where a monaural tone signal, masked completely by a noise signal in the same ear, can be rendered audible by tbe presentation of a. correlated noise signal to tbe other ear. This reduction in masked thresbold can amount to 10-20 dB under certain con-ditions of interaural pbase of tone and masking noise signals.
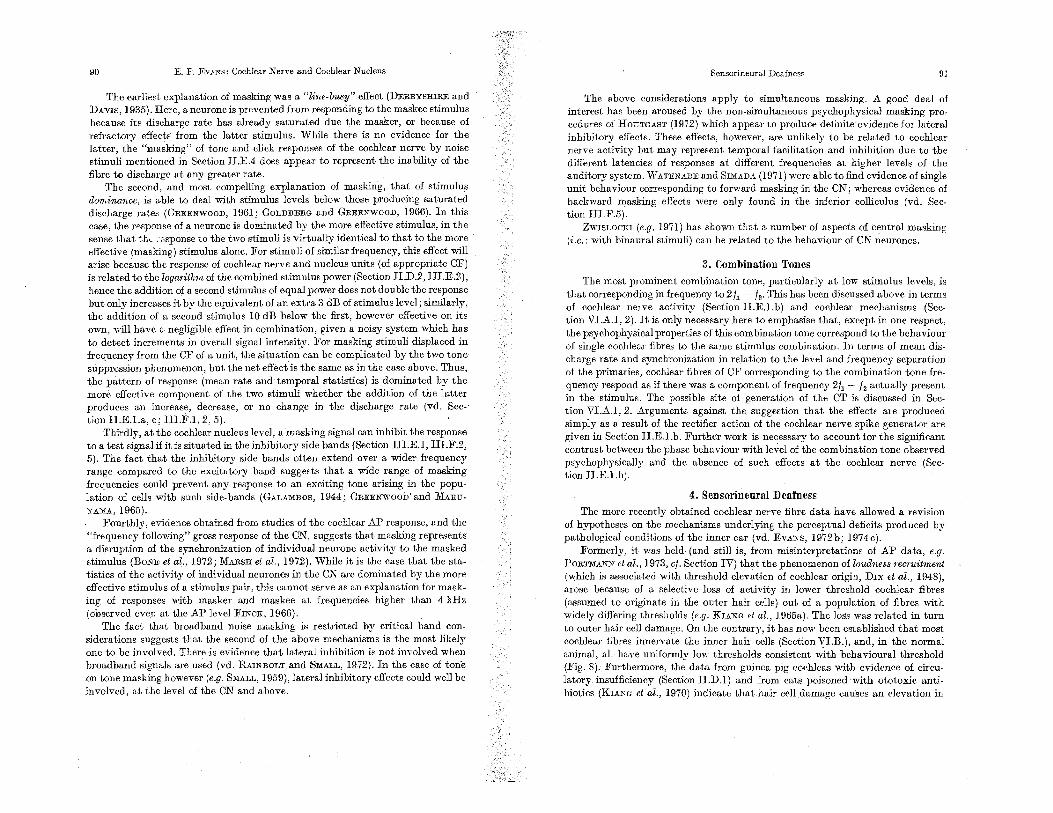
90 E. F. EVANS: Cochlear Nerve and Cochlear Nucleus
The earliest explanation of masking was a "line-busy" effect (DERBYSHIRE and DAVIS, 1935). Here, a neurone is prevented from responding to the maskee stimulus because its discharge rate has already saturated due the masker, or because of refractory effects from the latter stimulus. While there is no evidence for the latter, the "masking" of tone and click responses of the cochlear nerve by noise stimuli mentioned in Section ILEA does appear to represent the inability of the £bre to discharge at any greater rate.
The second, and most compelling explanation of masking, that of stimulus dominance. is able to deal with stimulus levels beiow those produeing saturated discharge (GREEl-'WOOD, 1961; GOLDBERG and GREENWOOD, 1966). In this case, the response of a neurone is dominated by the more effective stimulus, in the sense that thL _ Jsponse to the two stimuli is virtually identical to that to the more effective (masking) stimulus alone. For stimuli of similar frequency, this effect will arise because the response of cochlear nerve and nucleus units (of appropriate CF) is related to the logarithm of the combined stimulus power (Section II.D.2, III.E.2), hence the a.ddition of a second stimulus of equal power does not double the response but only increases it by the equivalent of an extra, 3 dB of stimulus level; similarly, the addition of a second stimulus 10 dB below the fust, however effective on its own, will have a negligible effect in combination, given a noisy system which has to detect increments in overall signal intensity. For masking stimuli displaced in frequency from t.he CF of a unit, the situation call be complicated by the two tone slippression phenomenon, but the net effect is the same as in the case above. Thus, the pattern of response (mean rate and temporal statistics) is domina,ted by the more effective component of the two stimuli whether the addition of the latter produces an increase, decrease, or no change in the discharge rate (vd. Sec-tion H.E.l.a, c; III.F.l, 2, 5).
Thirdlv at the cochlear nucleus level, a masking signal can inhibit the response to a test if it is situated in the inhibitory side bands (Section III.E.I, IILF.2, 5). The fact that the inhibitory side bands often extend over a wider frequency range compared to the excitatory band suggests that a wide range of masking frequencies could prevent any response to an exciting tone arising in the popu-lation of cells with such side· bands (GALAMBOS, 1944; GREENWOOD' and l\Lmu-YAMA, 1965).
Fourthly, evidence obtained from studies of the cochlear AP response, and the "frequency following" gross response of the CN, suggests that masking represents a disruption of the synchronization of individual neurone activity to the masked stimulus (BONE et 01., 1972; l\LillSR et 01., 1972). While it is the case that the sta-tistics of the activity of individual neurones in the CN are dominated by the more effective stimulus of a stimulus pair, this cannot serve as an explanation for mask-ing of responses masker and maskee at frequencies higher than 4 kHz (observed even at the AP level FINCK, 1966).
The fact that broadband noise masking is restricted by critical band con-siderations suggests that the second of the above mechanisms is the most likely one to be involved. There is evidence that lateral inhibition is not involved when broadband signals are used (vd. RAINBOLT and SMALL, 1972). In the case of ton'e on tone masking however (e.g. SMALL, 1959), lateral inhibitory effects could well be involved, at the level of the CN and above.
Sensorineural Deafness 91
The above considerations apply to simultaneous masking. A good deal of interest has been aroused by the non-simultaneous psychophysical masking pro· cedures of HOUTGAST (1972) which appeal' to produce definite evidence for lateral inhibitory effects. These effects, however, are unlikely to be related to cochlear nerve activity but may represent temporal facilitation and inhibition due to the different latencies of responses at different frequencies at higher levels of the auditory system. 'VATENABE and SL'IIADA (1971) were able to find evidence of single unit behaviour corresponding to forward masking in the CN; whereas evidence of backward masking effects were only found in the inferior colliculus (vd. Sec· tion IIJ.F.5).
ZWISLOCKl (e.g. 1971) has shaWl] that a number of aspects of central masking (i.e.: with binaural stimuli) can be related to the behaviour of CN neurones.
3. Combination Tones The most prominent combination tone, particularly at low stimulus levels, is
that corresponding in frequency to 2 fl - f,. This has been discussed above in terms of cochlear nerve activity (Section II.E.l.b) and cochlear mechanisms (Sec. tion VLA.l, 2). It is only necessary here to emphasise that, except in one respect, the psychophysical properties of this combination tone correspond to the behaviour of single cochlear £bres to the same stimulus combination. In terms of mean dis· charge rate and synchronization in relation to the level and frequency separation of the primaries, cochlear £bres of CF corresponding to the combination tone fre· quency respond as if there was a componellt of frequency 2f, - f2 actua,Jly present in tbe stimulus. The possible site of generation of the CT is discussed in Sec-tion VLA.l, 2. Arguments against the suggestion that the effects are produced simply as a result of the rectifier action of the cochlear nerve spike generator are given in Section II.E.l.b. Further work is necessary to a.ccount for the significant contrast between the phase behaviour level of the combination tone observed psychophysically and the absence of such effects at the cochlear nerve (Sec-tion II.E.l.b).
4. Sensorineural Deafness The more recently obtained cochlear nerve £bre data have allowed a revision
of hypotheses on the mechanisms underlying the perceptual de£cits produced by pathological conditions of the inner ear (vd. EVANS, 1972b; 1974c).
Formerly, it was held (and still is, from misinterpretations of AP data, e.g. PORTMANN et al., 1973, cf. Section IV) that the phenomenon of loudness recruitment (which is associated with threshold elevation of cochlear origin, Drx et al., 1948), arose because of a selective loss of activity in lower threshold cochlear fibres (assumed to originate ill the outer hair cells) out of a population of £bres with widely differing tluesholds (e.g. KIANG et 01., 1965a). The loss was related in turn to outer hair cell damage. On the contrary, it has now been established that most cochlear fibres innervate the inner hair cells (Section VLB.), and, in the normal animal, all have uniformly low thresholds consistent with behavioural threshold (Fig. 8). Furthermore, the data from guinea pig cochleas with evidence of circu-latory illsuf£ciency (Section II.D.l) and from cats poisoned ototoxic anti-biotics (KIANG et 01., 1970) indicate that hair cell damage causes an elevation in

92 E. F. EVANS: Cochlear Nerye and Cochlear Nucleus
the threshold of the 8ame fibres, and in addition, a su bstantial broadening of their FTCs. It is as if there was a selective loss of the more sharply tuned, lower threshold segment of the FTC to leave the high threshold "cide-band segment (ef. Fig. 9)_ Under conditions where the FTCs of a fibre population are abnormally broad, a correspondingly greater proportion of fibres mil be recruited for a given increase in suprathreshold tone level tban when the fibres are normally sharply tuned. If the sensation of loudness is related (among other factors) to the proportion of fibres active, then loudness should grow a,t a greater rate under conditions where the fibres have abnormally broad frequency response properties than undeI normal conditions (EVANS, 1972b). There is in fact evidence of abnormally broad critical bands in patients mth cochlear deafness (e-9. DE BOER, 1959; SCHARF and HELL-MAN, 1966). If, as appears to be the case from Fig. 10 of KIANG et al. (1970), the properties of the cochlear fibres innervating apparently norma,] inner han' cells are affected by loss of outer hair cells, the additional assumption of some form of interaction bf'.t;',-v"'en inner and outer hair cells a-p.-J .i innervations is requil'ed l!""'B -SeDi.,JOl:C VI.By),
It is possible to speculate further that the impaired speech perceptwn which patients ,,':ith cochlear deafness possess even after correction for the elevated thresholds may reflect the inability of tbeir abnormally broadly tuned cochlear fihres to resolve (separate) the formant frequencies of the speech signal (EVANS and WILSON, 1973).
D. In Relation to the Coding of Acoustic Stimulus Parameters 1. Frequ en cy
Ahundant quantitative data are now available on the peripheral auditory nervous system to indicate that it carries information which could be analysed by either "place" or "periodicityH mechanisms for the cod:ing of stimulus frequency. In order to discover the relative role of such putative codes, it is of course necessary to determine whether the information they carry can be utilized at higher levels of the auditory system (e.g. see WmTFIELD, 1970). On the other hand; it can be instructive to examine some of the possible obstacles to the acceptance of presently formulated "place" and "periodicity" coding theories set by the properties of the auditory periphery_
Naively, it may he throught implicit in the discussion above that if cochlear fibre FTCs can acc-ount quantitatively for frequency selectivity (critical band) they cannot, as filters, account for our acuity of frequency discrimination, which is some 30 times finer. The problem appears to be analogous to that between grat-ing and vernier acuity in vision. However, slopes of the FTCs, and particularly the high frequency slopes are sufficiently steep tbat at least the low frequency border of the activity in a tonotopic anay of cochlear fibres would be very sharp. Further-more, this border should become sharper at higher tone levels (as the high fre-quency slopes become steeper: see Fig. 9) -and could therefore account for the observed improvement nl the difference limen. In fact, SIEBERT (1968, 1970) has estimated that an "ideal observer", having access to this sort of information from an array of fibres ,,':itb the threshold, FTC, and rate-intensity properties measured
;C;;";;; .
Frequency 93
for cat cochlear nerve fibres, would have a difference limen for frequency approxi-mating to that. observed psychophysically. ZWIcKER (1970) has similarly ob-tained a correspondence between a difference limen estimated from the shape of the cochlear "excitation function" (inferred from psychophysical masking meas-urements) and that ohserved psychophysically.
Perhaps the greatest problem facing an exclusive place theory is the limited dynamic range implicit in the cochlear nerve and nucleus data. Not only is the increase in :inean discharge rate of a single neurone limited to an intensity range of less than 50 dB (Section ILD_2, III.E.2), but the distribution of thresholds of different neurones at anyone CF in an animal is less than 20 dB (Section II.D.l, III.E.l). While this is not necessarily a problem for pure tone discrimination (where the low frequency border of an active fibre array will remain sha,rp, and the high frequency border could still convey intensity information, as in the scheme of ALLANsON and WmTFIELD, 1956), it is not clear how the frequency components of complex waveforms such as speech could be separated. At average speech levels, the energy in a critical band,,':idth is 50-60 dB above threshold for fre-quencies between 0.5-2 kHz. This means that most fibres mll be saturated, and differences of energy between formants could not be signalled, nor presumably the formants themselves coded in separable groups of fibres (KIANG and MOXON, 1972). This problem of course rests on the contrast hetween human perceptnal per-formance and that of anaesthetized cat cochlear fibres, where the activity of middle ear muscles and efferent nervous system are inoperative. However, the results described in Section iT suggest that any effects of the latter wonld be to broaden rather than to sharpen the frequency selectivity of the cochlear fihres. The studies of SIMMONS and LINEHAN (1968) and of HUPERT et al. (1963) of cochlear fibres in awake cats do not provide any further clues.
It is clear from the data described in Section II.DA that the phase-locking properties of cochlear fibres are not limited in this way. Phase-locking to tonal stimuli can be observed for 10 dB or so below the mean rate "threshold" and this is retained at levels in excess of 90 dB SPL (Fig. 18). On the other hand, SIEBERT (1968, 1970) has shown than "an ideal listener" who utilizes all the tnne clues transmitted in his cochlear nerve (inferred from the eat's nerve) would have a difference limen two orders of magnitude smaller than that actnally observed. But. as the relationship of the limen ,to many stimulus parameters would also be sub-stantially different a complicated type of inefficiency would have to be involved. There are however, a numher of more serious problems for an exclusi ve periodicit.y theory. Firstly, the ability of cochlear nerve and nucleus discharges to retain periodic information concerning tones appears to he lost above 4-5 kHz. Further-more, while the degree of neural phase locking improves mth decrease in frequency (see Fig. 19), there is no such improvement in the difference limen; on the contrary dFjF increases with frequency reduction below about 0.5 kHz (but this could be expected on considerations of the high frequency slopes of FTCs). Secondly, from the data of HOSE and colleagues (vd. Section II.E.I.c), it does not look as if periodicity information in the discharge patterns will disappear for combinations of tones in frequency hy less than the critical band; whereas the ability of the ear to "hear out" (PLOMP, 1964b) or match in pitch (McCLELLAND and BRANDT, 1969) the individual frequency components is lost. Thirdly, as HOSE et al.

94 E. F. EVANs: Cochlear Nerve and Cochlear Nucleus
(1969) point out, the time structure of cochlear fibre discharges does not correlate well the perception of combination tones. In particular, apart from the fundamental of a harmonically related pair of tones, their data predicted the pres· ence of combination tones of frequencies above the primaries, but none below. 'l'his conJlicts the psychophysical finding that the 211 - I. tone (see Sec. tion VI.C.3) is the most prominent combination tone heard (GOLDSTEIN, 1967). Furthermore, GOLDSTEIN and KlANG (1968) demonstrated that responses to the 2/1 - I. component were present in the 'appropriate place in the cochlear fibre spectrum at frequencies well above that at which phase locking becomes insignifi. cant (Section II.E.l.b). Fourthly, BRUGGE et al. (1969), GOLDSTEIN (1970, p. 191), and SMa ORENBURG (1972b) have pointed out that there is a discrepancy between (a) the marked sensitivity of cochlear fibre temporal discharge patterns to the phase of interaction of the tone components of a combination, and (b) the lack of corresponding phase sensitivity of the ear. Fifthly, the transmission of periodic information in .the discharge patterns of fibres, irrespective of their CF, makes it difficult to understand why a patient with a sharply defined tonal gap and focal cQchlear lesion should have evidence of a diplacusis related to stimulus level (SMa ORENBURG, 1972b). Lastly, one classical argument for periodicity coding theory - residue pitch - has been called into question by the psychophysical investigations of HOUTSMA and GOLDSTEIN (1972), GOLDSTEIN (1972), and also by the data of GRUBER and BOERGER (1970; but see the reservations on these data in Section :n.E.l.b). In contrast, an attractive theory of pitch perception is emerging which accounts for these and other data by proposing a peripheral spectral fre· quency analysis and a central pitch extraction mechanism (e.g. DE BOER, 1956; WILSON, 1970, 1974; WHITFIELD, 1970; WIGHTMAN, 1972).
2. Intensity The problem of the limited dynamic. range demonstrated in the present data
from cochlear nerve and nucleus neurones has been detailed in (1) above. For stimulus levels above tbose which saturate the neurones with corresponding CFs, it appears that we must conclude. that the intensity information is· carried by neurones of higher and lower frequencies, i.e.: on the outskirts of the active array as well as by the width of the array (ALLANsoN and WHITFIELD, 1956), although the perception of multi component stimuli such as speech cannot be explained in this way (see above section).
3. Sound Complexes The great majority of data on cochlear nerve and nucleus have been obtained
with pure tones, clicks, and noise as stimuli. Experiments with· more complex stimuli suggest that in contrast to the situation at higher levels of the auditory system (vd. EVANS, 1968), the responses of neurones in the periphery to more com· plex and behaviourally meaningful sounds are relatively simply predicted in the spectral and temporal terms described above. Thus, no evidence of specific or even substantial sensitivity to the rate of change of frequency and amplitude of sounds has been obtained in cochlear nerve (data of WATENABE, 1972) or cochlear nucleus (see Section III.FA). What evidence there is appears to be predominantly in the
Sound Complexes 95
dorsal cochlear nucleus, where much more complex excitatory.inhibitory inter· actions abound compared with the ventral division (Section III.B.2, 3, IILFA). This Jatter dichotomy has led to the proposal that in the diversity of the CN we may have the earliest evidence of a "division of labour" within the auditory system into neural mechanisIDs responsible for complementary information pro-cessing tasks. Thus, in Fig. 49, the division of the cochlear nucleus and its ascend· ing projections is crudely represented into functionally separable dorsal and ventral systems. The conjecture has been made elsewhere (Ev ANB, 1971 ; EVANs and NELSON, 1973 b) that this subdivision may be analogous to that apparently present in the visual system: namely into (at least) two systems responsible for place and form information processing respectively (HELD et al., 1967, 1968). In the case of Fig. 49, the ventral pathway would be ideally suited, by its preservation of tempo· ral information, for the transmission of information pertaining to sound locali· zation, while the dorsal pathway with its more complex responses may represent the first stages in the neural processing of acoustic patterns (EVANS, 1971, 1974a).
DORSAL PATHWAY
VENTRAL PATHWAY
Fig. 49. Dorsal and .ventral ascending acoustic pathways. Transverse section of brainBtem at level of cochlear nuclei (after PAPEZ, 1929). en: cochlear neJ"Ve; DCN, AVN, PVN: dorsal, ante.roventral and postero-ventra.1 divisions of cochlear nucleus. dac: acoustic stria. SON: superior olivary complex (includes nuclei of trapezoid body). TB: Trapezoid body. LL: lateral lemniscus. IC: inferior colliculus. This diagram represents a gross simplification of the output fibre pathways of the cochlear nuclei, aftet POLJAK (1926); LORENTEDE No (1933 b), WARR (1966, 1967) and JUNGERT (1968). The dorsal pathway represents the classical dorsal acoustic of Mona'kow. The ventral pathway represents the intermediate acoustic stria of HELD and the trapezoid body. The SON is not subdivided into the trapezoid nuclei and medial, lateral, peri. and pre:olivary nuclei of the superior olive proper. (From EVANS and NELSON,
1973b)
96 E. F. EVANS: Cochlear Nerve and Cochlear 'Nucleus
Acknowledgements I am mdebted to Dr. J. P. WILSON for extensive discussion of many of the
topics dealt With herem and for his helpful comments and those of Dr. R. K:r.n."KE on the manuscript. I also Wish to thank Mr. J. S. COBllETT, for photographic assistance, and Miss R O. HENll,Y and Mrs. J. E. CLARKE for their patient typing of the manuscript.
References .ALLANSON, J. T., WBlTFIELD,I. C.: The cochlear nucleus and its relation to theories of hearing.
3rd London Symposium on Information Theory, pp. 269-284. London: Ilutterworth 1956. ANDERSON,D.J.,. ROSE,J.E., HmD,J.E., BRUGGE,J.F.: Temporal position of discharges in
single auditory nerve fibres within the cycle of a sine-wave stimulus: frequency and inten-sity effects. J. acoust. Soc. Amer. 49,1131-1139 (1971).
bAN, J .M.: The electrocochleogram; recent results in children and in some pathological cases Arch. Ohr·, Nas.· u. Kehlk.·Heilk. 198, 128-141 (1971).
ARAN,J.M., DELAUNAY,J.: Neural responses of end orgao of the guinea pig. VlIIth nerve action potentials evoked by click and tone pips (filtered clicks) of different frequencies. Rev. Laryng. (Ilordeaux) 90, 598-614 (1969).
.A:RTHUR,R.M., PFElFFER;,R.R:; SUGA,N.: Properties of "two-tone inhibition" in primary , 'auditory neurones. J. Physio!. (Lond.) 212, 593-609 (1971). BA.RLCiw,H.B., .The mechanism of directionally sensitive units in rabbits'
,retina. J. Physiol. (Lond.) 178, 477-504 (1965). IlASSETT,I.G., EASTMo}l'D,E.J.: Echolocation: measurement of pitch versus distance for
sounds refieCted from a fiat surfac.. J. a,caust. Soc. Amer. 36, 911-916 (1964). IlEXESY, G. VON: 'Ober die mechaoische Frequenzanalyse 'in der Schnecke verschiedener Tiere.
Akust. Z. 9, 3-il (19M). . IlExESY,G.VON: Experiments in hearing. New York: McGraw·HiJlI960. IltxESY,G. VON: Resonance in the cochlea? Sound 3, 86-91 (1969). IlEXESY,G.VON: Travelling waves as frequency aoalysers in the cochlea. Nature (Lond.) 225;
1207-1209 (1970). BOERGER,G., GRUBER,J.: In: Frequency Analysis and Periodicity Detection in Hearing,
pp. 147-149. Leiden: Sijthoff 1970. ' BOERGER,G., GRUEER,J., KLt:NxE,R.: Interaurales Vbersprechen bei der K.atze. Natuxwissen-
schaften 1i5, 234 (1968). . IlOGnANsin,D.F., GAuMllOS: In: Neural Mechanisms of Auditory and Vestibular syatems,
pp.143-'-148.Springfield, Ill.: Thomas 1960. :BONE,R.:C., CRqWl':-EY.,D., VIIIth nerve window action potentials
masked by high frequency noise in rats aod guinea pigs: a comparative study. Laryngoscope (St.Louis) 82,1499-:-1513(1972).
IlR'[!'GGE,J.,F., ANDERSON,D.J;, Hnm,J.E:; ROSE,J.E:: Time structure of discharges in single auditory fibre.s the squiITel monkey in response to complex periodic sounds. J. Neurophysiot 32,386-"-407 (1969).
HONRUBIA.,V., FER;NA:h"'D.EZ,C.: Cochlear function under metabolic impairment. Ann. Oto!.' (St. Louis) 71, 648-656 (1962).
CAJAL,S.R.y.: Histologie du systeme nerveux; VoL 1. Madrid:lnstitilto Ramon Y CajaI1909. C,u,Il'BELr.;F. W., COOPER; G. F.; ENROTH.CuGELL, C.: The spatial selectivity of the visual cells
of the cat. J. Physio!. (Lond.) 208, 22:1-235 (1969). CAPl's;M.J., AnEs,H. W.: AuditOry frequency discrimination after transection of olivocochlear
bundle jn squirrel monkeys. Eip. Neurol,21, 147-158 (1968). COATS, A. C., J. R.: Non-surgical recording of auditory nerve action potentials
and cochlear microphonics. Ann. Oto!. (St. Louis) 79, 844-852 (1970). COHEN,E.:s., IluWER;J.R., MOREST,D.K.: Projections of the cochlea to the dorsal cochlear
nucleus in the cat. Exp. Neurol. 31i, 470-479 (1972).
References 97
COMIS, S.D.: Centrifugal inhibitory processes affecting neurones in the cat cochlear nucleus. J. Physiol. (Lond.) 210, 751-760 (1970).
Coms,S.D., DAVIES,W.E.: Acetylcholine as a transmitter in the cat auditory system. J. Neurochem. 16, 423-429 (1969).
Coms,S.D., PICKLES,V.O.: Centrifugal pathways and the detection of signals in noise. J. Physio!. (Lond.) 226, 58P (1972).
COMIS,S.D., WliiTFIELD I. C.: The efi'ect of acetylcholine on neurones of the cochlear nucleus. J. Physio!. (Lond.) 183, 22-23P (1966).
COMIS,8.D., WlIITFIELD I.C.: Influence of centrifugal pathways on unit activity in cochlear nucleus. J. Neurophysio!. 31, 62-68 (1968). .
CULLEN,J.K.,JR., ELus,M.S., EERLIN,C.I., LorrsTEAu,R.J.: Human acoustic nerve action potential recordings from the tympanic membrane without anaesthesia. Acta Oto-]aryng . (Stockh.) 74, 15_22 (1972).
DAIGNEAULT,E.A., BROWN,R.D., PRUETT,J.: Cochlear round window recorded responses to acetylcholine and click stimulation following decentralization. Acta Otc.laryng. (Stockh.) 66. 10-16 (1968).
D.ALLOs,P.: Combination tone 2/]- 111 in microphonic potentials. J. acoust. Soc. Amer. 46, 1437-1444 (1969). '
DALLOS,P.: Comments ·on "correspondence between cochlear microphonic seDsitivity and behavioural threshold in the cat". J. acoust. Soc. Amer. 60, 1554 (1971).
DALLOs,P.: Cochlear potentials and mechanics. In: Ilasic Mechanisms in Hearing, pp. 335-372. New York: Academic Press 1973. .
DALLos, P., IlILLONE,M. C., DURRANT,J.D., WANG, C· Y., RAYNOR,S.: Cochlear inner and outer hair cells: functional differences. Science 177, 356-358 (1972)
DAVIS,H.: A model for transducer action in the cochlea. Cold Spr. Harb. Symp. quant.Iliol. 30, 181-189 (1965).
DAVlS,H., ROSENBLUT,B., FERNANDEZ,C., KJ::fln:rn.A,R., Modifications of cochlear potentials produced by streptomycin poisoning and by venous obstruction. Laryngoscope (St. Louis) 68, 596-627 (1958).
DEATHERAGE,:B.H., ELnREDGE,D.H., DAVIS,H.: La.tency of action potential in the cochlea of the guinea pig. J. acoust. Soc. Amer. 31, 479-486 (1959).
DE IlOER,E.: On the "residue" in heaxing (Thesis). Netherlands: Excelsior 1956. DE 1l0ER, E.: Measurement of critical band·width· in cases of pereeption deafuess. Proc. 3rd
Interuat. Congr. on Acoustics Stuttgart 1, pp. 100-102 . .Amsterdam: Elsevier 1959. DE IlOER,E.: Reverse correlation. I. A heuristic introduction tc the technique of triggered
correlation with applications to the analysis of compound systems. ',Proc. kon. neder!. ,Akad. Wet. 71, 472-486 (1968). '
DE IlOEB,E.: Reverse cOrrelation. II. Initiation of nerve impulses in the inner ear. Proc. kon. Neder!. Akad. Wet. 72, 129-151 (1969).
:PE BOER,E.: Synchrony between acoustic·stimuli and fibre .. Iri:·Frequency Analysis and Periodicity Detection in Hearing,pp. 204-c-212. Leiden: Sijthoff1970.
DE lloER,E.;nE JONGH,H.R.: Computer simulation of cochlear filtering. Proc. 7th Internat. Congr. on Acoustics, pp. 393-396. Iludapest: Akademiai Kiado 1971.
DE IlOER,E., JONGXEES,L.Il.W.: On cochlear sharpening and cross.correlation methods. Acta Oto·laryng. (Stockh.) 65, 97-104 (1968).
DEIloEB,E., KUYPER,P.: Triggered correlation. IEEE TranR. Iliomed. Eng. 16, 169-179 (1968).
DE BOER,E., SMOORENBURG,G.F., KUYPER,P.: Proposed explanation of synchrony of audi-tory·nerve impulses to combination tones. J. acoust. Soc. Amer. 46, 1579-1581 (1969).
DE JONGH,H.R.: Abput coding in the VIIlth nerve. In: Hearing Theory 1972, pp. 70-77. Eindhoven: !PO 1972.
DERBYSElRE,A.J., DAVIS,H.: The action potentials of the auditory nerve. Amer. J. Physio!. 118, 476-504 (1935).
DESMEDT,J.E.: Neurophysiological mechanisms controlling acoustic inpui.In: Neural Mech· anisms of Auditory and Vestibular Systems, pp. 152-164. ,Springfield, Ill.: Thomas 1960.

98 E. F. EVANS: Cochlear Nerve and Cochlear Nucleus
DESMEDT,J.E., MONACO,P.: The pharmacology of a centrifugal inhibitory pathway in the eat's acoustic system. In: Pharmacological Analysis of Central nervous action. Proe. 1st Internat. Pharmacal. Meeting. LondoD: Pergamon 1962.
DEwsON,J.H. III.: Efferent oIivocochlear bundle: some relationships to noise masking and to stimulus attenuation. J. NeurophysioL 30, 817-832 (1967).
DEWSON,J.H. III: Efferent olivocochlear bundle: sorue relationships to stimulus discrimina-tion in noise. J: NeurophysioL 31, 122-130 (1968).
Drx,M.R., HALLPIKE,C.S., HOOD,J.D.: Observations upon the loudness recruitment pheno. menan with especial reference to the differentjal diagnosis of disorders of the internal ear and VIn nerve. Proc. roy. Soc. Med. 41, 516-526 (1948).
DUIFHUIs,H.: A tentative firing model for the auditory receptor. 1.P.O.·A.P.R. 6, 18-24 (1970).
DUIFHUIS, H.: Audibility of high harmonics in a periodic pulse. II. Time effect. J. acoust. Soc. Amer. 1155-1162 (1971).
DUIFHUIS,H.: Perceptual Analysis of Sound (Thesis). Eindhoven: 1972. Dm""KER,E.G., GRUBEL,G., PF.ALZ,n..: Beeinilussung von spontanaktiven, deafi'erentierten
Einzelneuronen des Nucleus cochlearis der Katze durch Tomeizung der Gegenseite. PfI:ligers Arch. geB. Physiol. 278, 610-623 (1964).
ELEERLING,C., SALOMON,G.: Electrical potentials from the inner ear in man, in response to transient sounds generated in a closed acoustic system. Rev. Laryng. Suppl. pp. 691-706 (1971).
ENGEBRETsoN,A.J\.I., ELDREDGE,D.H.: Model for the nonlinear characteristics of cochlear potentials. J. acoust. Soc .. Amer. 44, 548-554 (1968).
ENGER,P.S.: Single unit activity in the peripheral auditory system of a teleost fish. Acta physiol. scand. 59, Suppl. 210 (1963).
ERULKA.R,S.D., BUTLER,R.A., GERSTEIN,G.L.: Excitation and inhibition in cochlear nucleus. II. Frequency modulated tones. J. Neurophysiol. 31, 537-548 (1968).
EVANs,E.F.: Upper and lower levels of the auditory system: a· contrast of structure and func· tion.In: Neural Networks, pp. 24-33. Berlin-Heidelberg·New York: Springer 1968.
EVANs,E.F.: Narrow "tuning" of cochlear nerve fibre responses in thc guinea pig. J. Physiol. (Lond.) 206, 14-15P (1970a). .
EVANs,E.F.: Narrow tuning of the responses of cochlear nerve fibres emanating from the eAposed basilar membrane. J. Physiol. (Lond.) 208, 75P-76P (1970b).
EVANs,E.F.: Central mechanisms relevant to the neural analysis of simple and complex sounds. In: Pattern Recognition in Biological a.nd Technical Systems, pp. 328-343. Berlin· Heidelberg-New York: Springer 1971.
EVANS,E.F.: Does frequency sharpening occur in the coch1ea? In: Hearing Theol'y.]972, pp. 27-34. Eindhoven: IPO 1972a. •
EVANs;E.F.: The frequency response and other properties of single fibres in the guinea.pig cochlear nerve. J. Physiol. (Lond.) 226, 263-287 (1972b).
EVANS,E.F.: Neural processes for the detection of acoustic patterns and for sound locaHzation. In: The Neurosciences: Third Study Program, pp. 131-145. Boston: M.LT. Press 1974a.
EVANS,E.F.: The effects of hypoxia on the tuning of single cochlear nerve fibres. J. Physiol. (Lond.) 238, 65-67P (1974 b).
Ev.ANs, E. F.: Normal and a.bnormal functioning of the cochlear nerve. In: Sound Reception in Mammals. Syrup. Zoo. Soc. Lond. In Press. London: Academic Press. 1974c.
EVANS, E.F.: Auditory Frequency -selectivity and the cochlear nerve. In: Facts and Models in Hearing, pp. 118-129. Berlin·Heidelherg-New York: Springer. 1974d.
EVANS, E.F., KLTh"KE, R.: Reversible effects of cyanide and Furosemide on the tuning of single cochlear fibres. J. Physiol. (Lond.) 242, 129-131 P (1974).
EVANS,E.F., NELSON,P.G.: Behaviour of neurones in cochlear nucleus under steady and modulated tonal stimulation. Fed. Proc. 25, 463 (1966a).
EVANs,E.F., NELSON,P.G.: Responses of neurones in cat cochlear nucleus to modulated tona1 stimuli. J. acoust. Soc. Amer. 40, 1275-1276 (1966b).
EVANS,E.F., NELSON,P.G.: An intranuclear pathway to the dorsal division of the cochleaJ" nucleus of the cat. J. Physiol. (Lond.) 76P-78P (1968).
-:;:.-1
}::\i4
References 99
EVANS,E.F., NELSON,P. G.: The responses of single neurones in the cochlear nucleus of the cat as a function of their location and the anaesthetic state. EJ1.'}l. Brain Res. 17, 402-427 (1973a).
EVANs.E.F., NELSON,P.G.: On the relationship between the dorsal and ventral cochlear nucleus. Exp. Brain R<os. 1/,428-442 (1973b).
EVANS,E.F., Vi7HITFT.ELD,I.C.: Classification of unit responses in the auditory cortex of the unanaesthetised and unrestrained ca.t. J. Physiol. (Lond.) 171, 476-493 (1964).
EVANs,E.F., \VlLSON,J.P.: Frequency sharpening of the cochlea: the effective bandwidth of cochlear nerve fibres. Prec. 7 th Internat. DongI'. on Acoustics, Vol. 3, pp. 453-456. :Budapest: Akademiai Kiado 197],
EVANs,E.F., '\VILsoN,J.P.: Frequency selectivity of the cochlea. In: Basic Mechanisms in Hearing, pp. 519-551. New York: Academic Press 1973.
EVANS,E.F., ROSENBERG,J., '\VILSON,J.P.: The effective bandwidth of cochlear nerve fibres. J. Physiol. (Lond.) 20/, G2P-63P (1970).
EVANS,E.F., ROSENBERG,J., '\VILsoN,J.P.: The frequency resolving power of the cochlea. J. Physiol. (Lond.) 216, 58P-59P (1971).
FERNALD,R.: A neuron mode] with spatia1Jy distributed synaptic input. Biophys. J. 11, 323-340 (1971).
FEX,J.: Auditory activity in centrifugal and centripetal cochlear fibres in cat. Acta physio!. scand. Suppl. ]89, 1-68 (1962).
FEX, J.: Crossed cochlear efi'erents activated by sound through both ears. Acta physio1. scand. Suppl. 213, 41 (1963).
FEX, J.: Auditory activity in uncrossed centrifugal cochlear fibres in ca.t. Aeta physiol. seand. 64, 43-57 (1965).
FINcK,A.: Physiological correlate of tonal masking. J. acoust. Soc. Amer. 39, 1056-1062 (1966).
FLANAGAN,J.L.: models for basilar·membrane displacement. J. acoust. Soc. Amer,. 34, 1370-1376 (1962).
FLOCK,A.: Sensory transduction in hair cells. In: Handbook of Sensory Physiology, Vo1. 1. Principles of Receptor PJ)ysiology, Cha.p. 14. Berlin-Heidelberg.New York: Springer 1971.
FRIsHKOI'F,L.S.: Excitation and inhibition of primary auditory neurones in the little brawn hat. J. acoust. Soc. Amer. 36, 1016A (1964).
FIUSHKOPF,L.S., GOLDSTEIN,M.B.: Responses to acoustic stimuli from single units in the eighth nerve of the bullfrog. J. acoust. Soc. AIDer. 35, 1219-1228 (1963).
Cll..PRANICA,R.R., GOLDSTEIN,M.H.,JR.: Neural coding in the bullfrog's auditory system: a teleological approach. Proc. IEEE 56, 969-980 (1968).
FURMAN,G.G., FRISRKOPF,L.S.: Model of neural inhibition in the mammalian cochlea. J. acoust. Soc. Amer. 36, 2194-2201 (1964).
ISHlI,Y.: Neurophysiological studies on hearing in goldfish. J. Neurophysiol. 30, 1377-1403 (1967).
FURUKAWA, T., ISHII, Y., MATSUURA,S.: Synaptic delay and time course of synaptic potentials at the junction between hair cells and eighth nerve fibres in the goldfish. Jap. J'. Physiol. 22, 617-636 (1972).
GALAMBOS, R.: Inhibition of activity in single auditory nerve fibres by acoustic stimulation. J. Neurophysiol. 7,287-303 (1944).
GALAMBOS,R.: Suppression of auditory nerve activity by stimulation of efferent fibers to cochlea. J. Neurophysiol. 19, 424-437 (1956).
GALAMBOS,R.: Studies of the auditory system with implanted electrodes. In: Neural Mecha-nisms of the Auditory and VestibulaI' Systems, pp. 137-151. Springfield, Ill.: Thomas 1960.
GALAMBos,R., DAVIS, H.: Responses of single auditory nerve fibres to acoustic stimulation. J. Neurophysiol. 6, 39-57 (1943).
GALMBOS,R., DAVIS,H.: Action potentials from single auditory nerve fibres? Science lOS, 513 (1948).
GALLEY,N., K.uNXE,R., PAUSE,M., STORCH,W.·H.: The effect of flaxedil (gallamine trie· thiodide) on the efferent endings in the cochlea. Pflugers Arch. 330, 1-4 (1971).

100 E. F. EYANS: Cochlear Nerve and Cochlear Nucleus
GASSLER, G .: Uber die Horschwelle fur Schal1ereignisse mit verschieden breitem spektrum. Acustica 4, 408 (1954). .
GmsLER,C.D.: A mode1 of the peripheral auditory system respondmg to low frequency tones. Biophys. J. 8, 1-15 (1968). ....
GERSTEIN,G.L., KIANG,N.Y.S.: An a,pproach to the quantItatIve analYSIS of logical data from single neurons. Biophys. J. 1, 15-28 (1960).
GERSTEIN. G.L .. FlTTLER, B.A., ERULKAll., S. D .: Excitation and inhibition in cochlear nucleus. T. stimulation. J. Neurophysiol. 31, 526-536 (1958). . .
GLATTKE, T.J.: Unit responses of the cat cochlear nudeus to amplitudewmodulated stImulI. J. acoust. Soc. Amer. 45, 419-425 (1969). . ..
GOBLleR, T.J.,JR., PFEIFFER,R.R.: Time-domain measurements of cochlear non·lmeantles using combina.tion click stimuH. J. a.coust. Soc. AIDer. 46, 924-938 (1969).
GOLD, T.: Hearing. II. The physical basis of the action of the cochlea. Proc. roy. Soc. B 135, 492-498 (1948).
GOLDBERG,J.M., GREE}.'WOOD,D.D.: Response of the neurons of the dorsal postoventra,l cochlear nuclei of the cat to acoustic stimuli of long duration. J. NeurophyslO1. 29, 72-93 0000· "
GOLDSTEIN J.L.: Auditory non-linearity. J. acoust. Soc. Amer. 41, 676-689 (196/). GOLDSTEIN: J .L.: In: Frequency Analysis and ,£eriodicity Detection in Hearing, pp. 230-245.
Leiden: Sijthoff 1970. . ' . GOLDSTEIN,J.L.: Evidence from aural combination tones and mUSICal Dotes claSSICal
temporal periodicity theory. In: Hearing Theory, 1972, pp. 186-208. Emdhoven: IPO 1972. . .
GOLDSTETN,J.L., KIANG,N.Y.S.: Neural correlates of the aural combmatlOn tone 2/1 - /-;., Proc. IEEE 1>6, 981-992 (1968).
GOLDSTEIN.J.L., BAER,T., KIANG,N.Y.S.: A theoretical treatment of latency, group:delay and tun'ing characteristics for auditory-nerve responses to clicks and tones. In: PhYSlO]Ogy of the Auditory System, pp. 133-141. Baltimore, Md.: National Educational Consultants 1971. .
GRAY,P.R.: Conditional probability analyses of the spike activity of single neurons. BlOphys. J. 7, 759-777 (1967). .
GREE:h'WOOD, D. D.: Auditory masking and the criti ca] band. J. acoust. Soc. Arner. 33, 484-502 (1961).
GREEl\'WOOD,D.D., GOLDBERG,J.JVL: Response. of in the cochlear nuclei :0 variations in noise bandwidth and to tone·nOlse combmatlOns. J. aconst. Soc. Amer. 4" 1022-1040 (1970).
GREEN'YOOD,D.D., l\iARU'YAMA,N.: Excita,tory and inhibitory response areas of a.uditory neurons in the cochlear nucleus. J. Neurophysiol. 28, 863-892 (1965). ,
GRUBEL,G., DUNKER,D., REHREN,D.V.: Zur Funktionsweise des efferenten auditorischen Systems. 1. Mitteilung. Pilugers ATch. ges. PhysioL 281, 109 (1964).
GUINAN, J. J. jr., PEAKE, \V. T.: Middle ear characterIstICs of anaesthetIzed cats. J. acoust. Soc. Amer. 41, 1237-1261 (1967). ..
HALL,J.L.: Comment on "Proposed explanation of synchrony of audltory.nerve lmpulses to combination tones". J. aconst. Soc. Amer. bO, 1555-1556 (1971).
HARRIS, G. G.: Brownian motion and the threshold of hearing. Int. Audiol. 7, 111-120 (1968). HARRISON,J.M., IRVING, R.: The anterior ventral cochlear nucleus. J. compo Neurol 124,
15-42 (1965). . . . HARRIsoN,J.M., IRVING,H.: The organization of the posterlOr ventral cochlear nucleus m the
Tat. J. compo NeuroL 126, 391-402 (1966). HARRISON,tT.M., \VARR,B.: A study of the cochlear nuclei and ascending pathways of the
medulla. J. compo Neurol. 119, 341-380 (1962). HAwRINs,J.E.jr., STEVENS,S.S.: The masking of pure tones and of speech by white noise.
J. acoust. Soc. Amer. 22,6-13 (1950). HEFFNER,R.., HEFFNER,H., MASTERTON,B.: Behavioural measurements of absolute a,nd
frequency difference thresholds in guinea pig. J. acoust. Soc. Amer. 49,1888-1895 (1971). HELD,R., SCHNEIDER,G.E., TREVARTREN,C.B.: Locating and"" identifying: two
modes of visual processing. Psychol. Forsch. 31, 44-62; 299-348 (196//68).
References 10J
HIESEY, R. ViT., SCElmERT, E. D.: Cochlea,r resonance and phase.reversal signals. J. acoust. Soc. Amer. 51, 518-519 (1972).
HIND,J. E.: Physiologica.] correlates of auditory stimuluspel'iodicity. Audiol. 11,42-57 (1972). HIND,J.E., ANDERsoN,D.J., BRUGGE,J.F., ROSE,.J.E.: Coding of information pertaining to
paired low·frequency tones in single auditory nerve fibres of the squirrel monkey. J. Neuro. physiol. 30, 794-816 (1967).
HIND,J.E., RosE,J.E., BRUGGE,J.F:, ANDERSON,D.J.: Two·tone masking effects in squirrel monkey auditory nerve fibres. In: Frequency Analysis and Periodicity Detection in Hear-ing, pp. 193-200. Leiden: Sijthoff 1970.
Hmsn,I .• T.: The influence of interaura,} phase on interaural summation and inhibition. J. acoust. Soc. Amm·. 20, 536-544 (1948).
HOUTGAST, T.: Psychophysical evldence for latera] inhibition in hearing. J. a,coust. Soc. ArneI'. 51,1885-1894 (1972).
HOUTSMA,A. J. M., GOLDSTEIN, J. L.: The centra! origin of the pitch of complex tones: evidence from musical intervaJ recognWon. <-T. acoust. Soc. Amer. 51, 520-529 (1972).
HUGGINs,vV.H., LlcRLmER,J.C.R.: Place mechanisms of auditory frequency analysis. J. acoust. Soc. Amer. 23, 290-299 (1951).
HUXLEY,A.F.: Is resonance possible in the cochlea after all 1 Nature (Lond.) 221, 935-940 (1969).
IGATIASRI,M., ALFORD,B.R., NAKAI,Y., GORDON,'VV.P.: Behavjoural auditory function after transection of crossed olivo· cochlear bundle in the cat. I. Pure-tone threshold and per-ceptual signal.to.noise ratio. Acta Oto.laryng. (Stockh.) 73,455-466 (1972).
lRVINE,D.R.F., -VVEBSTER, \iV.R.: Studies of peripheral gating in the auditory system of ca.ts. Electroenceph. cJin. Neurophysiol. 32, 545-556 (1972).
ISIDI,D .. ,· BALOGH,K.,JR.: Distribution of efferent nerve endings in the organ of Corti. Acta Oto-laryng. (Stockh.) 66, 282-288 (1968).
ISHII, Y., :MATSUURA, S., FURUKAWA, T.: An input-output rela,tion at the synapse between hair cells and eighth nerve fibres in goldfish. Jap. J. Physiol. 21, 91-98 (1971).
IunATo,S.: Fibre efferente dirette e crociate al1e celJuJe 8custiche deIl'organo del Corti-Monit. Zool. ital. Suppl. 72, 62-63 (1964). .
JOBNSTol\'""E,J.R., JOHNSTONE,B.M.: Unit responses from the lizard auditory nerve. Exp. Neurol. 24, 528-537 (1969). .
JOHNSTONE,B.l\i., SELLICR,P.l\i.: The peripheral auditory apparatus. Qua,rt Rev. Biophys. 5, 1-58 (1972).
JORNSTONE,B.M., TAYLOR,K.J., B01:'LE,A.J.: Mechanics of the guinea pig cochlea. J. aCOllst. Soc. Arner. 41, 504-509 (1970).
JUNGERT, S.: Auditory pathways in the brainstem. AneurophysiologicaJ study. Acta oto-]aryng. (Stockh.) Suppl. 138, 5--67 (1958).
KARLAN, M. S., TONNDORF, J., K1:r.A.NNA, S. M:.: Dual origin of the cochlear microphonics: inner and outer hair cells. Ann. Otol. (St. Louis) 81, 696-704 (1972).
KATSURI, Y., SUMI, T., UCHIYAMA,H., VVATENA13E, T.: Electric responses of auditory neurOTIes in cat to sound stimulation. J. Neuropbysiol. 2.1, 569-588 (1958).
KATSURI,Y., VlTATENABE,T., SUGA,N.: Interaction of auditory neurons in response to t\,,,, Bound stimuli in cat. J. Neurophysiol. 22, 603-623 (1959).
KATSUKl, Y., KAl'-'NO, Y., SUGA,N.: Primary a,uditory nem'ons of the monkey. Jap. J. Physio]. 11,678-683 (1961).
KATSUKI, Y., SUGA,N., KANNO, Y.: Neural mechanisms of the peripheral and central auditory system in monkeys. J. acoust. Soc. Amer. 34, 1396-1410 (1962).
KEIDEL,W.D.: Physiologic des Innenrohres. In: Hals.Nasen-Ohren-Hcilkundc, Vol. III/I, pp. 236-310 (1965).
KEIDEL, 'V.D.: 'Biophysics, mechanics and electrophysiology of the cochlea. In: Frequency Analysis and Periodicity Detection jn Hearing, pp. 60-79. Leiden: Sijthoff 1970.
K.JuNNA,S.M., SEARS,R.E., TONNDORF,J.: Some properties of longitudinal shear waves: a study of computer stimulation. J. acoust. Soc. Amer. 43, 1077-1084 (1968).
KlANG,N. Y.-s: Stimulus coding in the auditory nerve and cochlear nucleus. Acta Oto-larYJlg. (Stockh.) 59, 186-200 (1965).

J02 E. F. EVANs: Cochlear Nerve and Cochlear Nucleus
A survey of recent developments in the study of auditory physiology. Ann. Otol. (St. Louis) 77, 656-676 (J968).
KUNG,N. Y .. s, MOXON, E. C.: Physiological coDsideraMons in artificial stimulation of the inner ear. Ann. Otol. (St. Louis) 81, 7J4-730 (J972).
KiANG,N. Y.-s., PEAKE, W. T.: Components of electrical responses recorded from the cochlea. Ann. Otol. (St. Louis) 69, 448-458 (J960).
Kl.ANG,N. Y.-s., GOLDSTEIN,M.H.,JR., PEAKE, W. T.: Temporal coding of neUI'al responses to acoustic stimuli. IRE Trans. lnf. Theory 8, JJ3-JJ9 (J962a). ..
KIANG,N. Y.-s., WATENA:BE,T., TnoMAS,E.C., CLARK,L.F.: Stimulus coding in the cat's auditory nerve. Ann. Otol. (St. Louis) 71, 1009-1026 (J962b).
:K1.ANG,N.Y.-s., TEOMAS,E.C., CLARX,L.F.: Discharge patterns of single fibres in the cat's auditory nerve. Cambridge, Mass.: M.I.T. Press J965a.
KuNG,N.Y.-s., PFEIFFER,R.R., WARR,W.B., BACKUS,A.S.N.: Stimulus coding in the cochlear nucleus. Ann. Otol. (St. Louis) 74, 463-485 (J965 b).
KIANG,N. Y.-s" SACHS,M.B., PEAKE, W. T.: Shapes of tuning curves for single.auditory nerve fibres. J. acoust. Soc. Amer. 42, J34J-J342 (J967).
KIANG,N.Y.RS" BAER,T., MARR,E.M., DEMONT,D.: Discharge rates of single auditory nerve fibres as functions of tone level. J. acoust. Soc. Amer. 46, J06 (1969).
KliNG,N. Y MOXON, E. C., LEVINE,R.A.: Auditory·nerve activity in cats with normal and a,bnormal cochleas. In: Sensorineural Hearing Loss, pp. 24J-268. London: Churchill J970.
KiANG,N.Y .. s., MOREST,D.K., GUINAN,J.J.,JR., KANE,E.C.: Stimulus cod-ing at caudal levels of the cat's a?ditory system. I. Response characteristics of single units. In: Basic Mechanisms in Hearing, pp. 455-475. New York: Academic Press J973.
liLnmE,R., GALLEY,N.: The efferent innervation of the vestibular and auditory receptors. Physiol. Rev. M, 3JO-357 (J974).
KLTh"'XE, R., BOERGER, G., GBUEER,J.: Studies of the functional significance of efferent vatiol?- in the auditory efferent neuronal activity as influenced contralateral1:y applied sound. Pflugers Arch. 806, J65-J75 (J969).
KOERBER,K.L., PFEIFFER,R.R., WAltR,W.B., XuNG,N.Y.-s.: Spontaneous spike discharges from single linits in the cochlear nucleus after destructjon of the cochlea. Exp. Neurol. 16, Jl9-J30 (J966).
KONIsm,M.: Time resolution by single auditory neurones in birds. Nature (Lond.) 222, 566-567 (1969a).
KO!<.'l:SID, M.: Comparative neUrophysiological studies of hearing and vocalizations in songbirds. Z. vergl. Physiol. 66, 257-272 (J970).
KONISm,M.: Hearing, analysis and vocalizations in songbirds. Science 166, JJ78-JJ8J (J969b).
KONIsm, T., NIELSEN, D. W.: The temporal relationship between motion of the' basilar mem-brane and initiation of nerve impulses in the auditory nerve £bres. J. acoust. Soc. Amer. 63, 325 (J973).
KONISID, T., TEAS, D. C., WERNICK, J. S.: Effects of electrical current applied to cochlear partition on' discharges in individual auditory nerve fibres. I. Prolonged direct current polarization. J. accust. Soc. Amer. 47, J5J9-J526 (J970).
LEVINE,R.A.: Phase locking in response of single neuron in cat cochlear nucleus to frequency tonal stimuli. J. Neurophysiol. 34, 467-483 (J971).
LEV,A., SOKMER,H.: Sources of averaged neUIal responses recorded in C:Lnimal and human snbjects during cochlear audiometry (electrocochleogram). Arch. Ohr.·, Nas.·, Kehlk.-Heilk. 201, 79-90 (J972).
LICKLIDER,J.C.R.: "Periodicity" pitch and" "phase" pitch. J. acoust. Soc. Amer. 26, 945 (J9M).
LIFF,H.: Rasponses from single auditory units in the eighth nerve of the leopard frog. J. aooust; Soc. Amer. 45, 5J2--4J3 (J969).
LIFF,H.J., GOLDSTEIN,M.H.,JR.: Peripheral inhibition in auditory fibres in the frog. J. acoust. Soc. Amer. 47, J538-J547 (J970).
Lrn,D.J.: Fine morphology of the tectorial membrane. Arch. Otolaryng. 96, J99-2J5 (1972). LORENTE DE N6,R.:.Anatomy of eighth nerve. The central projection of the nerve ending of
the internal ear. Laryngoscope 43, J-38 (J933a).
;:::";,\
;;:..··1 "--;:"1
l+
References J03
LORENTE nE N 6, R.: Anatomy of the eighth nerve: Ill. General plan of structure of primary cochlear nucleus. Laryngoscope 48,.327-350 (J933b).
LYNN,P.A., SAYERS,B.McA.: Cochlear innervation, signal processing, and their relation to auditory time,intensity effects .. J. a·coust. Soc. Amer. 47, 525-533 (J970).
l\iAlI."LEY,G.A.: Frequency sensitivity of auditory neurons in the caiman "cochlear nucleus. Z. vergl. Physiol. 66, 25J-256 (J970a).
MANLEY,G.A.: Comparative studies of auditory physiology in reptiles. Z. vergl. Physiol. 67, 363-387 (J970b).
MANLEY,G.A.: Some aspects of the evolution of hearing in vertebra.tes. Nature 280, 506-509 (J97J).
MARSH,J. T., WORDEN,F.G.: Sound evoked frequency-following responses in the centrOl auditory pathway. Laryngoscope 78, JJ49-JJ63 (J968).
MARsn,J. T., WORDEN,F.G., SMrrH,J.C.: Auditory 'response: neural or artifact! Science 169, J222-J223 (J970). .
MARSH, J. T., SMITH; J. C.,WoRnEN, F. G.: Receptor and neural responses in auditory masking of low frequency tones. EEG and elin. Netirophysiol. 82, 63-74 (J972).
MAST, T. E.: Study of single units ofthe cochlear nucleus of the chinchilla. J. aeoust. Soc. Amer. 48, 505-5J2 (J970a).
MAST,T.E.: :Binaural interaction and contralateral inhibition in dorsa] cochlear nucleus of chinchilla. J. Neuropbysiol. 33, 108-Jl5 (J970b).
MciCLELLll'D,K.D., BRANnT,J.F.: Pitch of frequency modulated sinusoids. J. acoust. Soc. Amer. 45, 1489-J498 (J969)., .
MrLLER,J.P., WATSON;C.S., COVELL,W.P.: Deafening effects vfnoise on the cat. Acts Oto· Jaryng. (Stockh.) Suppl. 176, J-91 (J963).
MeLLER, A. R.: Unit responses in the cochlear nucleus of the rat to pure tones. Acts lihysiol. scand. 75, 530-54J (J969a).
Mm..i,ER,A.J.'\.: Unit responses in the cat cochlear nucleus to repetitive transient sounds. Acts physiol. scand. 75, 542'--55J (J969b).
JlWLLER,A.R.: Unit responses in the cochlear nueleus of the rat to sweep tones. Acta physiot scand. 76, 503-5J2 (J969c).
M0LLER,A.R.: Unit responses in the cochlear nucleus of the rat to noise and tones .. Acts physiol. scand. 78, 289-298 (J970a).
M0LLER, A. R.: Studies. of the damped <lscillatory response of the auditory frequency analyser. Acts physiol. scand. 78, 299-3J4 (J970b). .
MI3LLER,A.R.: Unit responses in the rat cochlear nucleus to tones of rapidly v!'rying frequency and amplitude. Acts physiol. scand. 81, .540-556 (1971).
M0LLER,A.R;: Coding of amplitude and frequency modulated sounds in the cochlear nucleus of the rat. Acta physiol. scand. 186, 223-238 (J972a).. .
M0LLER,A.R.: Coding of sounds in lower levels of the auditory system. Quart. Rev. Biophys. 53, 59-J55 (J972 b).
MOLNAR, C. E., PFEIFFER, R.R. : Interpretation of spontaneous spike discharge patterns in the cochlear nucleus. Prec. IEEE 66, 993-1004 (J968).
MOLNAlt, C. E., .LOEFFEL, R. G., PFEIFFER, R. R.: Distortion CQmpensating condenser earphone driver for physiological studies. J. acoust. Soc. Amer. 43, JJ77-Jl78 (J968).
MOUSHEGlAN,G., RurERT,A., GAL.AMBos,R.: Microelectrode study of ventral cochlear nucleus ofthe cat. J. Nenrophysiol. 25, 5J5-529 (J962).
MOUSBEGIA.N,G., RUl'ERT,R.L., STlLLMAN,R.D., WElSs,I.P.: Inhibition in the auditory nerve. J. acoust. Soc. Amer. 00, 1558-1560(L), (J971).
MoxvN,E.C.: Auditory.nerve responses to electric stimuli. M.I.T. Q.P.R. 90, 270-275 (J968). NELSON,P.G., EvANs,E.F.: Relationship between dorsal and ventral cochlear nuclei. In:
Physiology of the Auditory System, pp. J69--J74. Baltimore: National Educational Consultants Inc. J971.
NlEDER,.P.: Addressed exponential delay line theory of cochlear organization. Nature 280, 255-257 (J97J).
NIEDER,P.;NIEDER,L: Antimaskingeffect of crossed olivocochlear hundle stimulation with loud clicks in guinea pig. Exp. Neurol. 28, J 79'-188 (J970).

104 E. F. EVANS: Cochlear Nerve and Cochlear Nucleus
NOMOTO,M., SUGA,N., KATSUKI,Y.: Discharge pattern and inhibition of primary auditory nerve fibres in the monkey. J. Neurophysiol. 27, 768-787 (1964).
OSEN, K. K.; Cytoarchitecture of the cochlear nuclei in the cat. J. compo Neural. 136, 453--483 (1969).
OSEK,K.K.: Course and termination or the primary afferents)n the cochlear nuclei of the Arch. ita!. Biol. 108, 21-51 (1970).
PAPEz,J.W.: OomparativeNeurology (1929). Reprinted. New York: Hafner Publ. 00.1967. PEAKE, "T. T., KIANG,N. Y.-s.: Cochlear responses to condensation and rarefaction clicks.
Biophys. J. 2, 23-34 (1962) .. PFALZ, R. K. J.: CentrifugaJ inhibition of afferent secondary neurons in the cochlear nuc1eus by
sound. J. acoust. Soc. Amer. 34, 1472-1477 (1962). PFEIFFER,R.R.: Anteroventral cochlear nucleus: waveforms of extracellularly recorded spike
potentials. Science 154, 667-668 (1966a). PFEIFFER, R.R,. : Classification of response patterns of spike discharges for units in the cochlear
nucleus: tone-burst stimulation. Exp. Brain Res. 1, 22·0-235 (1966b). PFEIFFER, R.. R.: A model for two-tone inhibition of single cochlear nerve fibres. J. acoust. Soc.
Amer. 48, J373-1378 (J970). PFEIFFER,R.H., KIANG,N. Y.-s.: Spike discharge patterns of spontaneously and continuously
stimulated activity in the cochlear nucleus of anaesthetized cats. Biophys. J. 5, 301-316 (1965).
PFEIFFER,R., Mi,D.O.: Response patterns of single cochlear nerve fibres to click stimuli: descriptions for cat. J. acoust. Soc. Amer .• 2, 1669-1677 (1972).
PFEIFFER,R.R., Kr:M,D. 0.: Considera.tions of nonlinear response properties of single cochlear nerve fibers. In: Basic Mechanisms in Hearing, pp. 555-587, New York: Academic Press. 1973.
PFEIFFER,R.R., MOLNAR,C.E.: Cochlear nerve fibre discharge patterns: rela,tionship to the cochlear microphonic. Science 167, 1614-J616 (1970).
PIDDINGTON,R. "\T.: control of auditory input in the goldfish. II. Evidence of action in the free.swimming animal. J. expo Biol. 55, 585-610 (1971).
PLOMP,R.: Raj,e of decay of auditory sensation. J. acoust. Soc. Amer. 36, 277-282 (1964a). PLoMP,R.: The ear as a frequency analyser. J. acoust. Soc. Amer. 36, 1628-1636 (1964b). POLJAR,S.: The connections of the acomtic nerve. J. Anat. 60, 465-469 (1926). POBTMAJ>."'"N,M., LE BERT,G., ARAN,J.-M.: Potentials cochJeaires obtR,nus chez l'homme en
dehors de toute intervention chirurgicale. Rev. Laryng.· Bordeaux 88, 157-164 (1967). PORTMAJ..'"N,M., ANAN,J.-M., LAGOURGUE,P.: Testing for "recruitment" by electrocochleo·
graphy: preliminary results. AIlII. Otol St. Louis. 82, 36-43 (1973). POWELL, T.P.S., OOW.AN, W.M.: An experimental study of the projection of the cochlea. J.
Anat. (Lond.) 96, 269-284 (1962). POWELL, T. P. S., ERTILRAR, S. D.: Transneuronal cell degeneration in the auditory relay nuclei
of the cat. J. Anat. (Land.) 96, 249-268 (1962). PRICE,G.R.: Correspondence between cochlear microphonic sensitivity and behavioural
tlrreshold in the cat. J. acoust. Soc. Amer. 49, 1899-1901 (1971). PUGH,J.E.,JR., ANDERSON,D.J., BURGJO,P.A., HORWlTZ,M.R.: The origin of N£ of the'
cochlear whole-nerve action potential: J. acoust. Soc. Amer. 03, 325 (1973). RADIONOYA, E.A.:. Measuring the intensity of a brief sound signal at the first neuron level of
the auditory system. Soviet Physics·Acoustics 8, 350-355 (1963). RADIONOYA,E.A.: Reactions of neurons in cochlear nucleus to acoustic signals of varying
duration. J. Higher Nervous Activity USSR 1., 739 (1965). RADIONOVA, E .A.: 'I'wo .types of neurons in the cat's cochlea)'" nuclei and their role in audition.
In: Sensory Processes at the neuronal and behavioural levels, pp. 135-155. New York: Academic Press 1971.
RADIONOYA,E.A., POKOY,A.V.: Electrophysiological examination of neurons in cochlear nucleus of the cat. FASEB Trans. Suppl. 25, T231-235 (1965).
R.AINBOLT,H., SMALL,A.M.:_Mach bands in auditory masking: an attempted replication. J. acoust. Soc. Amer. 51, 567-574 (1972).
RASMusSEN,G.L.: Selective silver impregnation of synaptic endings. In: New Research TecJmiques of Neuroanatomy, pp. 27-39. Springfield, Ill.: Thomas 1957.
References 105
RASMussEN,G.L.: Efferent fibres of the coohlear nerve and cochlear nucleus. In: Neural Mechanisms of j,he Auditory and Vestibular Systems, pp. 105-U5. Springfield, Ill.: Thomas 1960.
RASMUSSEK,G.L.: Anatomic relationships of the ascending and descending auditory systems. In: Neurological Aspects of Auditory and Vestibular Disorders, pp. 5-19. Springfield, Ill.: Thomas 1964.
RASMUSSEN,G.L.: Efferent} connections of the cochlear nucleus. In: Sensorineural Hearing Processes and Disorders, pp. 61-75. Boston, Mass: Little, Bro,,"Tl & Co. ]967.
RATLIFF, F.: :Mach Bands, p. 41. San Francisco: ]965. RHoDE,'V.S.: Observations of the vibration of the basilar membrane in squirrel monkeys
using the Mossbauer technique. J. acoust. Soc. Amer. 49, 1218-1231 (1971). HHODE, \V .: An investigation of cochleaT mechanics using the Mossbauer effect. In: Basic
Mechanisms in Hearing, pp. 49-63. New York: Academic Press 1973. ROBLES, L., REODE, • S., GEISLER, C. D.: Measuremen'ts of the transient response of the hasHar
membrane using the Mossbauer technique. J. acoust. Soc. Amer. 53, 292 (lg73). HODIECK,R.V\7., GERSTEIN,G.L.: Some quantitative methods for the study
of spontaneous activity of single neurons. Biophys. J. 2,351-368 (1962) .. HOSE, J. E.; Organiza,tion of frequency sensitive neurons in the cochlear nucleus complex of
thc cat. In: Neural Mechanisms of tbe Auditory and Vestibular Systems, pp. ll6-136. Springfield, Ill.: Thomas 1960.
RosE,J.E.: Discharges of single fibres in the mammalion auditory nerve. In: Frequency Analysis and Periodicity Detection in Hearing, pp. 176-188. Leiden: 8ijthoff 1970.
ROSE,J.E., GALAMBOS,R.., HUGHES,J .R.: Microelectrode studies of the cochlear nuclei of the cat. Johns Hopkins Hosp. Bull. 104, 2ll-251 (1959).
RosE,J.E.} BRUGGE,J.F., ANDERSON,D.J., HIND,J.E.: Phase·locked response to low quency tones in single auditory nerve fibres of the squirrel monkey. J. Neurophysiol. 30, 769-793 (1967).
RosE,J.E., 13RUGGE,J.F., ANDERSON,D.J., HIND,J.E.: Patterns of activity in single auditory nerve fibres of the squirrel monkey. In: Hearing in Vertebrates, pp. 144-157. London: Ohurchill 1968.
RosE,J.E., BRUGGE,J.F., AND:ERSON,D.J., RIND,J.F.: Some possible neural correlates of comhination tones. J. Neurophysiol. 32, 402-423 (1969).
ROSE,J.E., lliND,J.E., ANDERSON,D.J., BRUGGE,J.F.: Some effects of stimulus intensity on response of a,uditory nerve fibres in the squirrel monkey. J. Neurophysiol. 34, 685-699 (1971).
ROSENBLITH, W.A.: Electrical responses from the auditory nervous system. Ann. Otolaryng. (St. Louis) 63, 839-860 (1954).
RUPERT,A. L., M.OUSHEGlAN, G.: Neuronal responses of kangaroo :rat ventral cochlear nucleus to low frequency tones. Exp. Neural. 26, 84-102 (1970).
RUPERT,A., M0U.SHEGIAN, G., GALAMBOS,R.: Unit responses to sOHnd from auditory nerve of the cat. J. Neurophysiol. 26, 449-465 (1963).
SACHS,M.B.: Stimulus-response relation for audit.ory nerve £bres: stimuli. J. acoust. Soc. Amer. 45, 1025-1036 (1969).
SAcHs,M.B., KIANG,N. inhibition in auditory nerve fibres. J. a,const. Soc. Amer. 43, ]]20-U28 (1968).
SANDO,I.: The anatomical interrelationships of the cochlear nerve fibres. Acta Oto.laryng. (Stockh.) 59, 417-436 (1965).
SOHARF,B.: Fundamentals of auditory masking. AudioI. 10, 30-40 097Jj. SCRARF,B., HELLMAN,R,.P.: Model ofloudness summation applied to impaired'ears. J. acoust.
Soc. Amer. 40, 71-78 (1966). SEATON, ,\\7.R., TRARIOTIS, C.: Comparison of direct and indirect measures of critical bands of
monaural chinchilla .. J. aeoust. Soc. Amer. as, 376 (1973). SIEBERT, \V Some implications of the stochastic behaviour of primary auditory neurones.
KybernetJk 2, 206-215 (1965). SIEBERT, 'V.1\:[.: Stimulus transformations in the perjpheral auditory system. In: R,ecognizing
Patterns, pp. 104-133. Cambridge: M.I.T. Press 1968.

106 E. F. EVANS; Cochlear Nerve and CochJear Nucleus
SIEBERT,W.M.: Frequency discrimination in the auditory system: place or periodicity mechanisms 1 Proc. IEEE 58, 723-730 (1970).
STh:lMONS,F.B., LINERAN,J.A.: Observations on a single auditory nerve fibre over a six week period. J. Neurophysiol. 31, 799-805 (1968).
SMALL,A.M.,JR.: Pure tone masking. J. acoust. Soc. Amer. 31, 1619-1625 (1959). SMITH,C.A., DEMPSEY,E.\V.: Electron microscopy of the organ of Corti. Amer. J. Anat. 100,
337 (1957). SMITR,R.L., ZWISLOCKI,J.J.: Responses of some neuroncs of the cochlear nucleus to tone
intensity increments. J. acoust. Soc. Amer. 50, 1520-1525 (1971). SMOOREh"'"EURG,G.F.: AudibjJjty region of combination tones. J. acoust. Soc. Amer. 52, 603-614
(1972a). SMOOREN13URG,G.F.: Combination tones and their origin. J. acoust. Soc. ArneI'. 52, 615-632
(1972b). SORMER,H., FEINMESSER,M.: Cochlear potentials recorded from the external ear in man. Ann.
Otolaryng. (St. Louis) 76,427 (1967). SrOENDLIN,H.: The organization of the cochlear receptor. In: Forlsch. Hals·, Ohren·
heilk. 13, 1-227 (1966). SPOENDLIN, H.: Ultrastructure and peripheral innervation pattern of the receptor in relation
to the first coding of the acoustic message. In: Hearing Mechanisms in Vertebrates, pp. 89-119. London: Churchill 1968.
SPOENDLlN,H.: Structural basis of peripheral frequency analysis. In: Frequency Analysis and Periodicity Detection in Hearing, pp. 2-36. Leiden: Sijthoff 1970.
SPOENDLIN,H.: Degeneration beha,viour of cochlea,r nerve. Arch. OhI'.·, Nas .. , Kehlk.·Heilk. 200,275-291 (1971).
SPOENDLlN,H.: Innervation densities of the cochlea. Acta Otolaryng. (Stockh.) 73, 235-248 (1972).
SpooR,A., EGGERMoNT,J.J.: Action potentials of the cochlea. Masking, adaptation and recruitment. Audio!. 10, 340-352 (1971).
SPRENG,M., KEIDEL, W.D.: Separierung von Cerebroaudiogramm (CAG), Neuroaudiogramm (NAG) und Otoaudiogramm (OAG) in der objektiven Audiometric. Arch. Ohr.-, Nas.-, Keh!.-Heilk. 189, 225 (1967). .
STARR,A.: Suppression of single unit activity in cochlea,r nucleus of the cat following sound stimulation. J. NeurophysioJ. 28, 850--862 (1965).
STARR, A., BRITT,R.: IntracelJularrecordings from cat cochlear nucleus during tone stimulation. J. Neurophysio!. 3B, 137-147 (1970).
STABR,A., HELLERSTEIN,D.: Distribution of frequency following responses in cat cochlear nucleus to sinusoidal acoustic signals. Brain Res. 33, 367-378 (1971).
STARR,A., \VERNICK,J.S.: Olivocochlea,r bundle stimulation: effects on spontaneous and tone evoked activities of single units in cat cochlear nucleus. J. Neurophysiol. 31, 549-564 (1968).
STEELE,C.R.: A possibility for sub-tectorial membrane fluid motion. In: Basic Mechanisms in Hearing, pp. 69-90. New Yark: Academic Press 1973.
SToPP,P.E., vVmTFIELD,I.C.: Unit responses from the brainstem nuclei in the pigeon. J: Physio!. (Lond.) 158, 165-177 (1961).
STOTLER, W .A.: The projection of the cochlear nerve on the acoustic relay nuclei of the medulla. Anat. Rec. lOB, 561 (1949).
STO'l'LER, V\7 .A.: An experimental study of the cells and connections of the superior olivary complex of the cat. J. compo Neuro!. 98, 101-432 (1953).
SUGA,N.: Single unit activity in cochlear nudeus and inferior colliculu8 of echo.iocating bats. J. PhysioJ. (Lond.) 172,449-474 (1963).
SUGA,N.; Analysis offrequency.modulated sounds by auditory neurones of echo·]oca,ting bats. J. Physio!. (Lond.) 179, 26-53 (1965a).
SUGA,N.: Functional properties of auditory neurones in the cortex of echolocating bats. J. PhysioJ. 181,671-700 (1965b).
TASARI, I.: Nerve impulses in individual auditory nerve fibres of pig. J. Neurophysiol. 17,97-122 (1954).
TASAKI,I.: Hearing. Ann. Rev. Physio!. 19, 417-438 (1957).
References 107
RAAB,D.H.: Fluctuations of N} ampHtude in to click·intensity dis-crimination. J. acoust. Soc. Amer. 46, 969-978 (1969).
TEAS, D. C., ELDREDGE, D. H., DAVIS, H.: Cochlear responses to a,coustic transients: an pretation of whole·nerve action potentials. J. acoust. Soc. Amer. 34, 1438-1459 (1962).
TEAS, D . C., KONISID, T., NIELSEN, D. W. : Electrophysiological studies on the spatial distribu-tiOD of the crossed olivo cochleaI' bundle along the guinea pig cochlea. J. acoust. Soc. Amer. 51,1256-1264 (1972).
TERRARDT,E.: Dber akustische Rauhigkeit und Schwarumngsstarke. Acustica 20, 215-224 (1968).
TERHABDT, E.: Frequency anaJysis and periodicity detect jon in the sensations of roughness and periodicity pitch. In: Frequency Analysis and Periodicity Detection in Hearing. Leiden: Sijthoff 1970.
TONNDORF,J.: Time/frequency along the partition of cochlear models: a modified place concept. J. acoust. Soc. Amer. 34, 1337-1350 (1962).
TRAIDOTIS, C., ELLIOTT,D.N.: Beha.vioural investigation of some possible effects of sectioning the crossed olivo· cochlear bundle. J. acoust. Soc. Amer. 47, 592--596 (1970).
VIERNSTElli,L.J., GnossMAN,R.G.: Neural discharge patterns in the transmission of sensory information. Symp. on Inform. Th. 4,252-269 (1961).
Vi7ALSH,B.T., Mn..LER,J.B., GACEK,R.R., KIANG,N.Y .. s.: Spontaneous nctivity in the eight cranial nerve of the cat. Int. J. Neurosci. 3, 221-236 (1972).
ViTARR,'V.B.: Fiber degeneration fonowing lesions in the auterjor ventral coch1ear nucleus of the cat. Exptl. Neuro!' 14, 453-474 (1966).
W.ARR,V\.l.B.: Fiber degeneration following lesions in the poste-ro-ventral cochlear nucleus in the cat. Anat. Rec. 15i, 338 (1962).
Vi! ATEN.ABE, T.; FWldamental study of the neural mechanism in cats subserving the feature extraction process of complex sounds. Jap. J. Physio]. 22, (HI72).
\VATENABE,T., OHGUSHI,K.: FM sensitive auditory neuraD. Prcc. Jap. Acad. 44, 968-973 (1968).
V\.1 ATENABE, T., SIMADA, Z.: Auditory temporal masking: an eJectrophysiological study of single neurons in the cat cochlear nucleus and inferior colliculus. Jap. J. Physio}' 21, 537..:......550 (1971).
WATSON,C.S.: Masking of tones by noise for the cat. J. acoust. Soc. Amer. 35, 167-172 (1963). WEISS, T.F.: A model of the auditory system. Kybernetik 3, 153-175 (1966). "WIGHTMAN,F.l.J.: Pitch ·as auditory pattern recognition. In: Hearing Theory 1972, pp.
161-171. Eindhoven: IPO 1972. WmTFIELD,I'C,: The Auditory Pathway. London: Arnold 1967. \VHITFlELD, 1. C.: The functional organization of the auditory -pathways. J. Sound Vib. 8,
108-117 (1968). \NHITFlELD,LC.: Central nervous processing in relation to spatio.temporal discrimination of
auditory patterns. In: Analysis and Periodicity Detection in Hearing, pp. 136-147. Leiden: Sijthoff 1970.
WIEDEREOLD,M. L.: Variations in the effects of electric stimulation of the crossed oHvocochlear bundle on cat single auditory·nerve fibre responses to tone bursts. J. acoust. Soc. Amer. 48, 966-977 (1970).
WIEDERIIOLD,M.L., KIANG,N. Y .·S.: Effects of electric stimulation of the crossed olivocochlear bundle on single auditory.nerve fibres in the cat. J. acoust. Soc. Amer. 48, 950-965 (1970).
PEAKE, \N. T.; Efferent inhibition of auditory·nerveresponses: dependence on acoustic-stimulus parameters. J. acoust. Soc. Amer. 40, 1427-1430 (1966).
WIENER,F.M., PFEIFFER,R.R, .• BAcKus,A.S.N.: On the sound pressure transformation by the head and auditory meatus of the cat. Acta oto·laryng. (Stockh.) 61, 255-269 (1965).
\VlLSON, J. P. : Psychoacoustics of obstacle detection using ambient or self.generated noise. In : Les Systemes Sonars Animaux, pp. 89-114, 1967.
WILsoN,J.P.: An auditory In: Frequency Analysis and Periodicity Det.ection in Hearing, pp. 303-315. Leiden: Sijthoff 1970.
Vi7ILSON, J. P .: Psychoacoustical and neurophysiological aspects of auditory pattern recogni. tion. In: The Neurosciences Third Study Program, pp. 147-153. Boston: M.l.T. Press 1974.

108 E. F. EVANS: Cochlear Nerve and Cochlear Nucleus
WILSON,J.P., EVANS,E.F.: Grating acuity of the ear: Psychophysical and neurophysiological nieasures of freqmmcy resolving power. Proc. 7th Internat. Congr. on Acoustics, Vol. 3, pp. 397-400. Budapest: Akademiai Kiado 1971.
\VILsoN,J.P., JOHNSTONE,J.R.: Capacitive probe measures of basilar membrane vibra.tioI1. In: Hearing Theory, pp. 172-181. Eindhoven: IPO 1972.
'VITILSON, J. P., JOHNSTONE, J. R.: Ba.silar membrane correlates of the combination tone 2/]-f 2'
. Nature 241, 206-207 (1973). YOSIDE,N.: Auditory nerve action potential responses to clicks in man. Laryngoscope 78,
198-215 (1968). YosmE,N.: Clinical cochlear response audion;t,etry by means of an average response computer:
non.surgical technique and clinical use. Rev. Laryng. Supp!., 646-670 (1971). YaBBIE, No, OHASHI, To, SUZTIXI, T.: N on.surgical recording of a.uditory nerve action potentiaJs
in man. Laryngoscepe n, 76 (1967). ZWlCXER, E.: Die Grenzen der Hiirbarkeit der Amplitudenmodulation und der Frequenz.
modulation eines Tones. Acustica 2, 125 (1952). ZWICKER,E.: Die Verdeckung von Schmalbandgerauschen durch SinustOne. Aeustica 4, 4]5
(1954). ZWICKER, E.: Der ungewiihnJiche Amplitudengang der nichtlinearen Verzerrungen des Ohres.
Acustica ., 67-74 (1955). ZWICKER, E.: Masking and physiological excitation as consequences of the ear's frequency
anaJysis. In: Frequency Analysis and Periodicity Detection in Hearing, pp. 376-394. Leiden: Sijthoff 1970.
ZWICKER,E.: Introduction to on "critica.] bands". Froe. 7th Internat. Congo on Acoustics, Vo!' I, pp. 189-192. Budapest: Akademiai Kiado 1971.
ZWICKER,E., FASTL,R.: On the development of th" critical band. J. aceust. Soc. Amer. 62, 699-702 (1972).
ZWICKER, E., FLOTTORJ>,G., STEVENS,S.S.: Critical bandwidth in loudness summation. J. acoust. Soc. Amer. 29, 548-557 (1957).
ZWISLOCKI,J.J.: Central maskil1g and neural activity in the cochlear nucleus. Audiol. 10, 48-59 (1971).
Chapter 2
Physiological Studies of Auditory Nuclei of the Pons*
J. M. GOLDBERG, Chicago, Illinois (USA)
With 20 Figures
Contents I. Introduction . . . . . . . . .
II. Functional Organization .......... . A. Morphology of the Pontine Auditory Nuclei . B. Evoked-Potential Studies .
1. Anatomical Pathways . . . . . . 2. Medial Superior Olive . . . . . . 3. Evidence of Binaural Interactions .
C. Single·Unit Studies. . . . . . . 1. Medial Superior Olive. . . . . . . 2. Lateral Superior Olive . . . . . . 3; Nucleus of theTrapezoid Body . . . . . . . 4. Other Nuclei of the Superior Olivary Complex. 5. Nuclei of the Lateral Lemnjscus .
III. Discharge Propsrties of the Neurons. A. Monaural Response Areas. . B. Binaural Response .Areas .. C. Monaural Intensity Functions D. Binaural Intensity Functions E. Response to Clicks . • . . .
IV. Mechanisms of Sound Localization. A. Response to High.Frequency Tones. B. Response to Low-Frequency Tones. C. Response to Transients .
Refel13nces . . . . . . . . . . . . . . .
I. Introduction
J09 110 llO III III ll2 ll3 113 113 JJ6
°1l7 120 120 122 122 125 127 130 131 133 133 134 139 141
The superior olivary complex and the nuclei of the lateral lemniscus are a group of more or less distinct nuclei,located in the pons and lying in close associa-tion ·with the major tracts interconnecting the cochlear nuclei with the inferior colliculus. The tracts, the acoustic striae and the lateral lemniscus, provide afferent
• Preparation of this chapter supported by Grant NS·05237, National Institutes of Health, and by a Sloan Foundation Grant.