halftime hydration and snacking practices in collegiate
TRANSCRIPT

Georgia State University Georgia State University
ScholarWorks @ Georgia State University ScholarWorks @ Georgia State University
Nutrition Theses Department of Nutrition
12-2010
Halftime Hydration and Snacking Practices in Collegiate and Halftime Hydration and Snacking Practices in Collegiate and
Professional Basketball and Football Players Professional Basketball and Football Players
Desiree L. Nathanson Georgia State University
Follow this and additional works at: https://scholarworks.gsu.edu/nutrition_theses
Part of the Nutrition Commons
Recommended Citation Recommended Citation Nathanson, Desiree L., "Halftime Hydration and Snacking Practices in Collegiate and Professional Basketball and Football Players." Thesis, Georgia State University, 2010. https://scholarworks.gsu.edu/nutrition_theses/8
This Thesis is brought to you for free and open access by the Department of Nutrition at ScholarWorks @ Georgia State University. It has been accepted for inclusion in Nutrition Theses by an authorized administrator of ScholarWorks @ Georgia State University. For more information, please contact [email protected].

HALFTIME HYDRATION AND SNACKING PRACTICES IN COLLEGIATE ANDPROFESSIONAL BASKETBALL AND FOOTBALL PLAYERS
By
DESIREE L. NATHANSON
A Thesis Presented in Partial Fulfillment ofRequirements for the Degree
MASTER OF SCIENCE
ATLANTA, GEORGIA
2010

ACCEPTANCE
This thesis, HALFTIME HYDRATION AND SNACKING PRACTICES IN COLLEGIATEAND PROFESSIONAL BASKETBALL AND FOOTBALL PLAYERS, by Desiree L.Nathanson, was prepared under the direction of the Master 's Thesis Advisory Committee. It isaccepted by the committee members in partial fulfillment of the requirements for the degreeMaster of Science in the College of Health and Human Sciences, Georgia State University.
The Master's Thesis Advisory Committee, as representatives of the faculty, certify that thisthesis has met all standards of excellence and scholarship as determined by the faculty.
: Dan Benardot, Ph.D, R.D., L.D., FACSMCommittee Chair
Walter R. Thompson, Ph.D, FACSM, FAACVPRCommittee Member
Date
Vijay Ganji, Ph.D, R.D.Committee Member

ACKNOWLEDGEMENTS
I would like to thank the following persons:
• Dr. Dan Benardot for his time, patience, and guidance during the course of this thesis.
• Dr. Vijay Ganji and Dr. Walt Thompson for their time as members of my committee.
• Scott Barthlama, Jason Benguche, Jim Boylan, Michael Cash, Deanna Copeland, Darren
Hertz, Kate Howard , DJ Johnson, Destiney Lewis, Matt McCall , Kacie Moreland, Robert
Murphy, Jennifer Pardue, Brian Reeves, Matt Siverling, Tom Smith, John Summers,
Kristen Thompson, and John Zubal for helping me to collect the data that has been
analyzed in this thesis:
• Yolanda Miller for her administrative assistance.
• DJ Johnson for contributing the topic of this thesis .
11

AUTHOR'S STATEMENT
In presenting this thesis as a partial fulfillment of the requirements for the advanced degree fromGeorgia State University , I agree that the library of Georgia State University shall make itavailable for inspection and circulation in accordance with its regulations governing materials ofthis type. I agree that permission to quote, to copy from, or to publish this thesis may be grantedby the professor under whose direction it was written, by the College ofHealth and HumanSciences director of graduate studies and research, or by me. Such quoting, copying, orpublishing must be solely for scholarly purposes and will not involve potential financial gain. Itis understood that any copying from or publication of this thesis which involves potentialfinancial gain will not be allowed without my written permission.
Signature ofAuthor

NOTICE TO BORROWERS
All theses deposited in the Georgia State University library must be used in accordance with thestipulations prescribed by the author in the preceding statement. The author ofthis thesis is:
Desiree L. Nathanson2430 Cheshire Bridge Rd. NE #305
Atlanta, GA 30324
The director of this thesis is:
Dan Benardot, Ph.D, R.D. , L.D., FACSMDivision ofNutrition
College of Health and Human SciencesGeorgia State University
Atlanta , Georgia 30303-3083
Users of this thesis who are not regularly enrolled as students at Georgia State University arerequired to attest acceptance of the preceding stipulation by signing below. Libraries borrowingthis thesis for the use of their patrons are required to see that each user records here theinformation requested.
NAME OF USER ADDRESS DATE TYPE OF USE(EXAMINATION
ONLY OR COPYING)

VITA
Desiree L. Nathanson
EDUCATION:2002
2010
Bachelor of Science in Public RelationsUniversity of Florida
Master ofScience with concentration in NutritionGeorgia State University
PROFESSIONAL EXPERIENCE:July 2008 - Present Dance/Fitness Instructor
Dance 101, Atlanta, GA
Jan. 2008 - Dec. 2009 Graduate AssistantDivision of Nutrition, Georgia State University, Atlanta, GA
PROFESSIONAL SOCIETIES AND ORGANIZAnONS:2008-Present American Dietetic Association
2008-Preserit Georgia Dietetic Association
20lO-Present National Exercise & SP0l1S Trainers Association
2007-2010 Nutrition Student Network

ABSTRACT
Background: Sustaining a hydration state and energy status during competition is important forathletes, yet there is no current evidence in the literature that halftime hydration and snackingpractices of basketball and football players have been assessed. Under ideal circumstances,proper hydration and food consumption practices should be followed by basketball and footballplayers before , during and after practices and competitions because both sports involve a fast rateof energy utilization with a concomitant increase in sweat production.Objectives: This study aimed to improve our understanding of the halftime hydration andsnacking practices used by basketball and football players at the collegiate and professionallevels .Methods: A total of 122 subjects filled out a halftime habits survey. The survey was completelyanonymous to protect the identity of the athletes participating in the study. Athletic trainers andcoaches of basketball and football teams , athlete agents, other athletic team employees, andplayers were contacted and provided with copies of a questionnaire to distribute to athletes . Datawere analyzed using PASW Statistics 18. Data for height and weight were analyzed usingdescriptive statistics and all remaining data were analyzed using crosstabs and included a ChiSquare Test.Results: Of the beverages consumed by the 122 athletes surveyed, there was a statisticallysignificant difference between sports in the consumption of Gatorade (n=89 , p=.045), Powerade(n=41 , p<.OOI), Powerade Zero (n=l , p=.020), and water (n=96, p=.049). There was astatistically significant difference between sports in the consumption of energy bars (n=62,p<.OOI) and fresh fruit (n=41, p=.033). There was a statistically significant difference betweensports in the purchase of snacks for halftime (p=.004) and the frequency of halftime snackinghabits (p<.OOI). There is a statistically significant difference between sports in the halftimerecommendations of teams for both hydration (p<.OOI) and snacking (p<.OOI). There is astatistically significant difference between sports in the availability of snacks at halftime(p<.OO 1) and the preferability of snacks available at halftime (p<.OO1). There is a statisticallysignificant difference between sports in temperature's influence on what athletes drink athalftime (p<.OOI) and humidity's influence on what athletes drink at halftime (p<.OOI). There isa statistically significant difference among sportsin the influence of pre-game drinking practiceson halftime hydration habits (p=.046) and the influence of first half drinking practices on .halftime hydration habits (p=.035) . There is a statistically significant difference among sports inthe extent of weight lost during a game (p<.OOI).Conclusions: The results of this study show that athletes have the time and resources to drinkand snack at the halftime break to replenish glycogen stores and rehydrate for the second half ofgames. Athletes, whether by recommendation or by habit, consume a variety of beverages andsnacks during the halftime break of games. It is still uncertain as to whether or not thesehydration and snacking habits actually replenish glycogen stores and rehydrate the athletes forthe second half of games. Future studies should be done to determine whether the hydration andsnacking habits are maintaining hydration and sustaining blood glucose for better performance.
TABLE OF CONTENTSPage
List of Tables .ivAbbreviations vii
ChapterI. INTRODUCTION 1
II. REVIEW OF THE LITERATURE. 3Recommendations for Halftime Hydration and Snacking 3Hydration Specific to Sport 7Assessing Hydration Status in Athletes 9Hydration Issues During Competition and Practice : 13Energy Issues 19Summary '. .20
III. METI-IODOLOGY 22
IV. RESULTS 25Make Up of Subjects 25Time Available For Consumption ofBeverages and/or Snacks .27Beverages Consumed by Athletes at Halftime 28Snacks Consumed by Athletes at halftime '" 32Halftime Hydration .34Halftime Snacking 36Team Recs For Halftime Hydration and/or Snacking 38Availability and Preferability of Beverages/Snacks at Halftime .40Environmental Influences .42Cramps and Injuries 47Pre-game First Half Hydration and Snacking Practices 51Athlete Weight Loss During Games ~ 58Summary : 58
V. DISCUSSION AND CONCLUSIONS 60Discussion ; 60Conclusions 63
References 66Appendix
A. Survey 71
III

Table1.
2.
3.
4.
5.
6.
7.
8.
9.
10.
11.
12.
13.
14.
IS.
16.
17.
18.
19.
20.
21.
LIST OF TABLES
Race breakdown of football, men's basketball and women's basketballplayersHeight and weight of football, men's basketball and women's basketballplayersSetting of competition between football, men's basketball and women'sbasketball playersYears played in college by football, men's basketball and women's basketballplayersYears redshirted in college by football, men's basketball and women's basketballplayersYears played at professional level among football, men's basketball and women'sbasketball playersMinutes available at halftime for beverages and snacks among football , men'sbasketball and women's basketball playersComparison ofXS consumption between football, men's basketball and women'sbasketball playersComparison ofFRS consumption between football, men's basketball and women'sbasketball playersComparison of fruit juice consumption between football , men 's basketball andwomen's basketball players .Comparison of Gatorade consumption between football , men 's basketball andwomen's basketball playersComparison of Gatorlode consumption between football , men's basketball andwomen's basketball playersComparison of Hydrate consumption between football, men 's basketball andwomen's basketball playersComparison of Powerade consumption between football, men's basketball andwomen's basketball playersComparison of Powerade Zero consumption between football, men 's basketballand women's basketball playersComparison of Vitarnin Water consumption between football , men's basketballand women's basketball playersComparison of water consumption between football, men's basketball andwomen's basketball playersComparison of other beverage consumption between football, men 's basketballand women's basketball playersComparison of canned fruit consumption between football , men's basketball andwomen's basketball playersComparison of crackers, pretzels, or saltine consumption between football , men'sbasketball and women's basketball playersComparison ofenergy bar consumption between football, men's basketball andwomen's basketball players
IV
Page71
72
73
74
75
76
77
78
79
80
81
82
83
84
85
86
87
88
89
90
91

22. Comparison of energy gel consumption between football , men's basketball 92and women's basketball players
23. Comparison of fresh fruit consumption between football , men's basketball 93and women's basketball players
24. Comparison of peanut butter consumption between football, men's basketball and 94women 's basketball players
25. Comparison of salt free pretzel consumption between football, men's basketball 95and women's basketball players
26. Comparison of other snack consumption between football, men's basketball and 96women's basketball players
27. Comparison ofdrink purchase by athlete or team between football, men's 97basketball and women's basketball players
28. Comparison of frequency of halftime hydration habits between football, men's 98basketball and women's basketball players
29. Comparison of influences that determine halftime hydration habits between 99football, men's basketball and women's basketball players
30. Comparison of snack purchase by athlete or team between football, men's 100basketball and women's basketball players
31. Comparison of frequency of halftime snacking habits between football, men's 101basketball and women 's basketball players
32 . Comparison of influences that determine halftime snacking habits between 102football , men's basketball and women's basketball players
33. Team halftime hydration recommendations among football, men 's basketball and 103women's basketball players
34. Team halftime snacking recommendations among football, men's basketball and 104women 's basketball players
35. Beverage availability at halftime among football , men's basketball and women's 105basketball players
36. Beverage preferability of available beverages at halftime among football, men's 106basketball and women's basketball players
37. Snack availability at halftime among football , men 's basketball and women's 107basketball players
38. Snack preferability of available snacks at halftime among football, men's 108basketball and women's basketball players
39. Temperature influence on what athletes drink at halftime among football, men's 109basketball and women's basketball players
40. Temperature influence on what athletes eat at halftime among football, men's 110basketball and women's basketball players
41. Humidity influence on what athletes drink at halftime among football, men's 111basketball and women's basketball players
42. Humidity influence on what athletes eat at halftime among football, men 's 112basketball and women's basketball players
43. Altitude influence on what athletes drink at halftime among football, men's 113basketball and women's basketball players
v

44. Altitude influence on what athletes eat at halftime among football, men's 114basketball and women's basketball players
45. Frequency that athletes are prone to cramping among football, men's basketball 115and women's basketball players
46. Influence of cramping on what athletes drink at halftime among football, men's 116.basketball and women's basketball players
47. Influence of cramping on what athletes eat at halftime among football, men's 117basketball and women's basketball players
48. Frequency that athletes are prone to injuries among football, men's basketball and 118women's basketball players
49. Influence of injuries on what athletes drink at halftime among football, men's 119basketball and women's basketball players
50. Influence of injuries on what athletes eat at halftime among football, men's 120basketball and women's basketball players
51. Timing of pre-game meal consumption among football, men's basketball and 121women's basketball players
52. Consumption of fluids between the pre-game warm up and kick off/tipoff among 122football, men's basketball-and women's basketball players
53. Consumption of fluids during the first halfof the game among football, men's 123basketball and women's basketball players
54. Influence ofpre-game drinking practices on halftime hydration among football, 124men's basketball and women's basketball players
55. Influence of first half drinking practices on halftime hydration among football , 125men's basketball and women's basketball players
56. Consumption of food between the pre-game war up and kick off/tipoff among 126football , men's basketball and women 's basketball players
S1. Comparison of food during the first half of the game among football , men's 127basketball and women's basketball players
58. Influence of pre-game eating practices on halftime hydration among football , 128men's basketball and women's basketball players
59. Influence of first half eating practices on halftime eating habits among football, 129men's basketball and women's basketball players
60. Extent of in-game weight loss among football, men's basketball and women's 130basketball players
VI

NCAA
NBA
NFL
GSSI
ACSM
ADA
DC
NATA
TBW
AVP
ALD
HEX
ABBREVIATIONS
National Collegiate Athletic Association
National Basketball Association .
National Football League
Gatorade Sports Science Institute
American College of Sports Medicine
American Dietetic Association
Dietitians of Canada
National Athletic Trainers' Association
. total body water
arginine vasopresin
aldosterone
exertional heat exhaustion
Vll

CHAPTER ONE
INTRODUCTION
Iris important for athletes, including coaches, strength and conditioning trainers, athletic
trainers and dietitians, to understand the negative performance and health effects of poorly
hydrated and poorly 'energized' (i.e., deficient in energy) athletes (Volpe, et a1. 2009).
Sustaining a hydration state and energy status during competition is important, yet there is no
current evidence in the literature that halftime hydration and snacking practices of basketball and
football players have been assessed. This study aimed to improve our understanding of the
practices used by these athletes at the collegiate and professional levels. Ultimately, this
information will provide the basis for recommendations that target the weaknesses of current
practices.
Under ideal circumstances, proper hydration and food consumption practices should be
followedby basketball and football players before , during and after practices and competitions
because both sports involve a fast rate of energy utilization with a concomitant increase in sweat
production. These team sports require athletes to switch intermittently between maximal-effort
and low-intensity exercise, which could potentially cause large losses of body water (Volpe , et
a1. 2009). Fatigue occurring during prolonged exercise in cool or temperate conditions is
associated with depletion of carbohydrate in the liver and muscles (Below, et a1. 1995). In
addition, both sports have scheduled halftime breaks that represent an important opportunity for
replenishment of both energy and fluids. Taking optimum advantage of this replenishment
opportunity should sustain or improve athletic performance, reduce muscle soreness, lower risk
of hydration-related heat illness, and reduce sports-related injury risks that may be related to low
blood sugar disorientation.
1

This study assessed the halftime hydration and snacking habits utilized by collegiate and
professional basketball and football players, and has the following hypotheses:
Hypothesis 1: Athlete's halftime hydration practices do not contribute to sustaining a desirable .
hydration state.
Null Hypothesis 1: Athlete's halftime hydration practices theoretically sustain a desirable
hydration state.
Hypothesis 2: Athletes do not follow halftime snacking practices that theoretically improve
athletic performance during the second half.
Null Hypothesis 2: Athletes do follow halftime snacking practices that theoretically
improve athletic performance during the second half.
2

CHAPTER TWO
REVIEW OF LITERATURE
A failure to take advantage of the half-time period to hydrate and snack could predispose
athletes to heat-related illnesses , decreased performance, increased risk of injury and, possibly,
death (Coris, et at 2004). All of these factors warrant a careful evaluation of halftime
replenishment practices to provide a basis for recommendations that could improve athlete
awareness of strategies for reducing health risks and enhancing performance. It is important for
athletes to meet energy and macronutrient needs, especially carbohydrate and protein, during
times of high physical activity to maintain body weight, replenish glycogen stores, and provide
adequate protein to build and repair tissue (Joint Position, 2009) .
Recommendations for Halftime Hydration and Snacking
Athletes from the National Collegiate Athletic Association (NCAA), National Basketball
Association (NBA), and the National Football League (NFL) were surveyed for this study. The
NCAA is a voluntary organization through which the nation's colleges and universities .govern
their athletics programs (http://www.ncaa.org/). There are currently 1,055 schools in the NCAA
that are considered to have an active membership. Of those schools, 633 have football teams,
1,041 have men 's basketball teams, and 1,063 have women's basketball teams. There are
currently 30 teams in the NBA (http://www.nba.com) and 32 teams in the NFL
(http ://www.nfl .com) .
National Collegiate Athletic Association
3

The NCAA has published recommendations for hydrating and snacking before, during
and after exercise (NCAA 2006-2007 Sports Medicine Handbook), but provides no specific
recommendations or strategies for halftime replenishment during basketball and football games.
Fluid replacement should be readily available for athletes to avoid dehydration and other heat- .
related illnesses. The NCAA recommends water as a cost effective, quickly absorbed and well
tolerated fluid for prehydration and rehydration. Sports drinks with appropriate carbohydrates
and sodium are recommended for prolonged continuous activity of greater than 45 minutes,
extremely intense activity with risk of heat injury, and extremely hot and humid conditions.
During exercise, the NCAA recommends that student-athletes consume 4-8 ounces of beverage
every 15 minutes, alternating between water and sports drinks. The NCAA also recommends
that student-athletes consume 30-60 grams of carbohydrates per hour, 5-10 ounces of sports
drink every 15-20 minutes, or 2 carbohydrate gels (typically composed of glucose polymers) per
hour.
Gatorade Sports Science Institute
The Gatorade Sports Science Institute (GSSI) offers recommendations on the amount and
timing of fluid and carbohydrate during exercise to prevent dehydration and compromised
athletic performance (Bums, et a1. 2001). The GSSI recommends 3 mllkg of body weight (7-10
ounces) every 15 minutes during exercise for better physical and mental performance during an
athletic contest. A concentrated 18% carbohydrate drink (GatorLode, 5 mIl kg body weight or
about 12 ounces for a 150-lb player) during a 20-minute "half-time" break is also recommended
to speed up the replacement of muscle glycogen. Athletes should consume 30-60 grams of
carbohydrate per hour in the form of glucose, sucrose, or starch. Individualization of beverages
4

and drinking schedules are stressed. This can be achieved by the consumption of sports drinks or
food. The primary purpose of carbohydrate ingestion during strenuous exercise lasting longer
than one hour is to maintain a sufficient concentration of blood glucose and to sustain a high rate
of energy production from blood glucose and glycogen stored in muscles (Coggan, et al. 1991;
Coyle 1994; Coyle, et al. 1986).
Gatorade and the NFL provide recommendations for the prevention of dehydration and
other heat-related illnesses through their campaign "Beat the Heat" (Gatorade Heat Safety
Package 2009). However, this campaign is geared towards educating parents and coaches of
young football players on heat-related illnesses and the importance of hydrating. "Beat the
Heat" guidelines recommend frequently scheduled and enforced drink breaks and consumption
of sufficient beverage volume to match sweat losses that occur during workouts and
competitions. Flavored, cold, lightly salted sports beverages should be offered to encourage
voluntary fluid replacement by players. Recommendations given in the "Beat the Heat" simply
state "lightly salted" and do not specify exact amount of salt. Players should have unrestricted
access to appropriate fluids during activity. "Beat the Heat" states that sports drinks may provide
some benefit over water because they also contain carbohydrates and electrolytes, but reference
no studies to support this statement.
Other than the "Beat the Heat" campaign, the NFL offers no recommendations for proper
hydration as an athlete in the NFL. The NBA provides no guidelines for sustaining the optimal
hydration and energy levels of its athletes.
Positions of Professional Health Practitioner Organizations
5

According to the positions of the American College of Sports Medicine (ACSM), the
American Dietetic Association (ADA), and the Dietitians of Canada (DC) athletes should
hydrate before, during and after exercise (Joint Position , 2000; Joint Position, 2009; Position
Statement, 2007), but no specific recommendations for strategies for halftime replenishment
during basketball and football games are given. Individuals may begin exercising in a
dehydrated state if intervals between exercise (practices and games) are inadequate for full
rehydration. Basketball and football teams will often hold twice daily training during the week,
causing athletes to carry a fluid deficit from the first practice into the second practice. The
ACSM states that the goal of drinking during exercise is to prevent a state of excess dehydration
(>2% body weight loss from water deficit) and excessive changes in the balance of electrolytes
to prevent negative effects on performance.-Dehydration >2% body weight degrades aerobic
exercise and cogniti ve/mental performance in temperate-warm-hot environments (Casa, et al.
2005; Cheuvrant, et al. 2003; Cheuvrant & Sawka 2005; Panel on DRI, 2005). Greater levels of
dehydration will further degrade aerobic exercise performance (Cheuvrant & Sawka 2005; Panel
on DRI , 2005). The magnitude of performance decrement is related to the environmental
temperature, exercise task, and probably the subject's unique biological characteristics (physical
fitness, acclimatization state, tolerance to dehydration) (Panel on DRI, 2005). Cognitive/mental
- performance, which is-important where concentration, skilled tasks and tactical issues are
involved, is also degraded by dehydration (Cheuvrant & Sawka 2005; Hancock & Vasmatzidis
2003 ; RodahI2003).
Dehydration can compromise athletic performance and increase the risk of exertional
heat injury (Position Statement, 2000). Dehydration of 3% body weight is common in sports and
6

can be elicited in just an hour of exercise or even more rapidly if the athlete enters the exercise
session dehydrated. Dehydration can affect all physiologic systems in the human body.
National Athletic Trainers' Association
The National Athletic Trainers' Association (NATA) recommends that sufficient fluids
be consumed to offset the rate of water loss via sweating or progressive dehydration will occur
(NATA Position Statement, 2000) . A proper hydration protocol is specific to the unique features
ofeach sport. If opportunities to rehydrate during an event are frequent, such as baseball ,
football, and track and field, the athlete can ingest smaller volumes of fluid based on their
sweating rate and environmental conditions. If rehydration must occur at specific times during
an event, such as soccer and long distance running, then the athlete must ingest fluids to
maximize hydration within the sport's confines and rules. Fluid replacement should be close to
sweat and urine losses and maintain hydration at less than 2% weight reduction; this requires
.200-300mL every 10 to 20 minutes. If carbohydrates are included in a fluid, the concentration
should be 4%-8%, a concentration any higher than that will slow the rate of fluid absorption
(NATA Position Statement, 2000; Sawka & Coyle, 1999).
Hydration Specific to Sport
A variety of factors influence sweat losses in physically active individuals , including the
duration and intensity of exercise, the environmental conditions and the type of
clothing/equipment worn (Ray, et al., 1998). These factors are sometimes specific to the sport
including an air conditioned indoor stadium versus an outdoor stadium or the type of uniform
7

wom. There is considerable variability in exposure to the factors that contribute to sweat rates
between participants of different sports.
Individual characteristics, such as body weight (Barr & Costill, 1989; Ray, et aI., 1998),
genetic predisposition, heat acclimatization state (Ray, et al., 1998; Seto, 2005) and metabolic
efficiency (economy at undertaking a specific exercise task) will influence sweat rates for a
particular activity (Ray, et aI., 1998). As a result of factors relating to individuals and the
individual sports, there is a large range in sweat rates and total sweat losses of individuals
between and within activities. For example, sweat rates vary between players in a soccer match
according to the position and playing style of the player, as well as the total time spent on the
field (Ray, et aI., 1998; Tsintzas & Williams, 1998). American football players have greater
daily sweat losses than cross country runners who are training in the same environment for the
same duration (Godek, et aI., 2005; Ray, et al., 1998). Football players have a larger body mass,
and wear protective clothing, whereas cross country runners have a smaller body mass and
lighter clothing. Some sports, such as tennis, may allow for frequent drinking opportunities
whereas other sports, such as soccer may not (Maughan & Shirreffs, 2008).
A study conducted by Osterberg et aI. 2009 found that half the NBA players (n=29) that
participated in the study began the game in a hypohydrated state, as indicated by urine specific
gravity, with pregame urine specific gravity levels greater than 1.020. The NATA recommends
that athletes begin activity with a USG at or below 1.020 to ensure adequate hydration (Position
Statement, 2000; Osterberg, et al., 2009). Furthermore, sweat losses in these players during
games were substantial (greater than 2 L in approximately 20 minutes of playing time).
8

The development of an individualized hydration strategy is essential to protect health and
preserve performance of athletes as no single recommendation works for everyone (Maughan &
Shirreffs , 2008).
Assessing Hydration Status in Athletes
Early signs and symptoms ofdehydration include thirst and general discomfort (Position
Statement,2000). Hydration status can be assessed by measuring body weight before and after
exercise sessions, monitoring urine color, urine specific gravity or urine volume, or a
combination of these factors (Armstrong, et al., 1998; Armstrong, et aI., 1994; Position
Statement, 2000).
When sweat losses produce a body water deficit, the reduced volume of body fluids
contains a greater than normal concentration of dissolved substances such as sodium and
potassium; this is known as hypertonic hypovolemia (Cheuvrant & Sawka, 2005).
Young, healthy men undergoing daily exercise and heat stress maintain a stable body mass
when measured first thing in the morning as long as they make a conscious effort to replace
'sweat lost during exercise (Cheuvrant, et al., 2004; Cheuvrant & Sawka, 2005). Voluntary
intakes of food and fluid compensate for sweat losses incurred with regular exercise, resulting in
a stable daily body mass (Cheuvrant& Sawka, 2005 ; Leiper, et al., 2001). Body mass is often
used to assess the rapid changes of athlete hydration in both laboratory and field environments
(Cheuvrant & Sawka, 2005). Body mass is commonly used to assess dehydration that occurs
over a period of 1-4 hours , with or without exercise (Armstrong, 2005; Kavouras, 2002). When
body mass is used to represent water loss, the following three factors should be considered:
9

1. In clinical and athletic settings , a baseline body mass is required but not often available
(Armstrong, 2005; Kavouras, 2002).
2. Body mass fluctuates daily (0.51 ± 0.20 kg). Therefore, three consecutive
measurements provide an accurate assessment ofdaily body mass variability in active men
who replace 100% of sweat lost during exercise (Armstrong, 2005; Cheuvrant, et al.,
2004).
3. Ifbody mass measurements are performed over several weeks or months, this technique
cannot be interpreted because the gain or loss of adipose tissue is unknown unless precise
whole-body scans are available to interpret changes in fat mass (Armstrong, 2005).
When an individual sweats , plasma volume and extracellular water decrease because they
provide the fluid for sweat, and plasma osmolality increases because sweat is hypotonic relative
to plasma (Cheuvrant & Sawka, 2005). In other words, sweat removes relatively more water
from body fluids than solutes like sodium and chloride, and these osmotically active solutes
build up in the blood plasma.
The combination of total body water (TBW) and plasma osmolality provides the "gold
standard" for hydration assessment (Cheuvrant & Sawka, 2005). TBW entails measuring the
dilution of trace amounts ofan isotope; a known volume of concentration of isotope is taken into
the body, and a new concentration of the isotope is later determined in a sample of body fluid
after the tracer has become distributed equally throughout the body fluids. The unkown volume
(TB W) is then calculated, knowing that a low concentration of isotope in the sample means that
the body fluid volume must be relatively large and vice versa (Cheuvrant & Sawka , 2005).
Plasma osmolality is controlled around a euhydration set point of - 285 mOsro/kg (Osterberg, et
al. , 2009). If exercise sweat losses are not replaced, then body water volume is reduced
10

(Cheuvrant & Sawka, 2005). Plasma volume and extracellular water decrease because they
provide the fluid for sweat, and plasma osmolality increases because sweat is hypotonic relative
.to plasma. Sweat removes relatively more water from body fluids than solutes like sodium and
chloride, and these osmotically active solutes build up in the blood plasma. The increase in
plasma osmotic pressure is proportional to the decrease in TBW (Osterberg, et al., 2009). It
should be noted that plasma volume decreases proportionally with the level of dehydration, but
this magnitude ofchange is markedly less in heat-acclimatized athletes (Cheuvrant & Sawka,
2005; Sawka & Coyle, 1999)
Normal body water turnover in a sedentary adult is from 1 to 3 L'day, the range
accountableprimarily to differences in insensible water loss, or the evaporation of moisture from
the skin (Cheuvrant & Sawka, 2005; Sawka, et al., 2005). Large variations of fluid intake are
controlled by the kidneys, which can produce more or less urine, depending on changes in body
fluid volumes (Cheuvrant & Sawka, 2005). Urine is a solution of water and various other
substances, and the concentration of those substances increases with a reduction in urine volume,
which is associated with dehydration. It appears that changes in plasma osmolality that stimulate
endocrine regulation of the reabsorption of renal water and electrolytes are delayed at the kidney
when acute changes in body water occur (Cheuvrant & Sawka, 2005; Position Statement, 2007).
It is also likely that drink composition influences this response (Cheuvrant & Sawka, 2005). If
renal function is normal , urine is concentrated and scant when the body is dehydrated and
conserving water, or is dilute and plentiful when a temporary excess of body water exists
(Armstrong, 2005).
Thirst can be used to assess hydration status when instrumentation or technical expertise is
unavailable (Armstrong, 2005). The sensation of thirst can indicate the threshold of
11

hypohydration (total body water losses equal to 1% or 2% of body mass) (Armstrong, 2005;
Greenleaf & Morimoto, 1996; Hubbard, et a!., 1990). Thirst can be measured using a scale
ranging from 1 (not at all thirsty) to 9 (very very thirsty); the scale was developed by Young et
aI. (Armstrong, 2005; Young, et aI., 1987). Between a score of3 (a little thirsty) and 5
(moderately thirsty), it can be assumed that an individual is mildly dehydrated (Armstrong, 2005 ;
Young, et a!., 1987). Factors that can alter the perception of thirst include fluid palatability, time
allowed for fluid consumption, gastric distention, older age, gender and heat acclimation status
. (Armstrong, 2005; Greenleaf & Morimoto, 2006 ; Hubbard, et aI., 1990; Ormerod, et al., 2003;
Osterberg, et al., 2009).
The fluid regulatory hormones arginine-vasopresin (AVP) and aldosterone (ALD)
generally respond predictably to changes in body fluid volume and osmolality, but the hormones
are easily altered by exercise and heat acclimation and require more expensive and complicated
analysis techniques (Francesconi, et al., 1983; Montain, et aI. 1997). Montain, et al. 1997
concluded that: 1) ALD and AVP increase in a graded manner with hypohydration, and this
effect persists during exercise-heat stress; 2) ALD and AVP increases elicited by exercise are
greater during high intensity than low intensity exercise; 3) Hypohydration and exercise intensity
have additive effects on ALD: and 4) AVP responses are closely coupled to osmolality (Coris, et
aI., 2004; Montain, et al., 1997).
Armstrong (Armstrong, 2005) states that urine specific gravity, urine color, and body mass
best meet the requirements of safety, accuracy and low cost. The National Athletic Trainers'
Association position statement (Position Statement, 2000) recommends that three techniques be
used to assess the hydration status of athletes: body weight change, urine specific gravity and
urine color.
12

Hydration Issues During Competition and Practice
All physiologic systems in the human body are influenced by dehydration (Position
Statement,2000). The intent of drinking during exercise is to avert a body fluid deficit in excess
of2% body weight (Joint Position, 2009). A weight loss of greater than 3% during physical
activity is associated with dehydration, decreased muscular strength and endurance, decreased
plasma blood volume, compromised cardiac output, impaired thermoregulation, decreased
kidney blood flow and filtration, decreased liver glycogen stores and a loss of electrolytes (Howe
& Bowden, 2007). Thirst is not usually a good indicator of hydration status because it is
typically not apparent until a person has incurred a water deficit of approximately 2% weight
loss and when an athlete becomes thirsty it is often too late to prevent dehydration (Sawka &
Montain,2000). Therefore, preventative measures that include water and sports drink
consumption should be followed when exercising. Sports drinks containing sodium (0.1-0.2
g/cup) and potassium (0.2-0.5 g/cup) as well as carbohydrate, are recommended for athletes
(Joint Position, 2009 ; Ray, et al., 1998). It is important for the individuals exercising to be aware
of proper hydration techniques to avoid any heat-related illnesses that result from hypohydration
(Sawka, et aI., 1996).
Hyponatremia
Hyponatremia, a serum sodium concentration of less than 130 mmol/L, can occur from
inappropriate, excessi ve fluid intake before, during, or after exercise (Howe & Bowden, 2007) or
a failure to adequately replace salt-containing fluids (Joint Position, 2009). Athletes who suffer
from hyponatremia typically consume more fluid (water) than they lose in sweat and gain weight
13

over the course of an event (Hew-Butler, et aI., 2005; Howe & Bowden, 2007;. Shireffs &
Maughan, 1998). Hyponatremia most often occurs in athletes performing prolonged exercise
lasting longer than four hours and who drink over-aggressively (Montain, et aI., 2006). Most
cases develop during participation in endurance events lasting eight hours or more.
Risk factors for hyponatremia include female gender, low body weight, and high
availability of fluids (Howe & Bowden, 2007). The risk for developing hyponatremia also
depends on both the magnitude of sodium dilution and the rate at which the water/electrolyte
imbalance occurs (Androgue & Madias , 2000; Montain, et aI., 2006). Severe hyponatremia
(serum sodium <120 mmol /L) can precipitate seizures, coma and death (Howe & Bowden,
2007).
Sports drinks , instead of water or electrolyte-free drinks , can be consumed to slow down
the development of hyponatremia (Montain, et al., 2006). The consumption of electrolyte
containing drinks or food should be considered as part ofa preventative strategy, especially in
athletes who secrete salty sweat. The consumption of electrolytes should only be used as part of
the preventative process as it will slow the development.ofhyponatremia but not prevent it if
fluid intake is greater than the sweating rate. Treatment of hyponatremia begins with oral
sodium solutions if mild and progresses to intravenous hypertonic saline for severe cases (Howe
& Bowden, 2007) .
Generally, thirst is not perceived until a person has incurred a water deficit of - 2% body
weight loss (Sawka, et aI., 1996). Although genuine thirst develops only after dehydration is
present and is alleviated before euhydration is achieved, thirst is a useful symptom that draws
14

attention to the need for more structured drinking before, during, or after exercise (Cheuvrant &
Sawka; 2005). However, ' thirst' is an ineffective means of discerning hydration state during
physical activity (Sawka, et a1., 1996). As a result, athletes relying on thirst may not realize that
they are becoming dehydrated. It is important, therefore, for an asymptomatic hydration strategy
to start prior to a practice or game competition, with easily accessible sports drinks available to
athletes during exertion to avoid thirst (Howe & Bowden, 2007). Consumption of fluids in
adequate amounts is critical for normal cellular function, and thermal regulation in athletes
(Jones , et aI., 2008).
Athletes need to practice fluid intake during activity just as they would practice a sport
specific skill (Coris, et al., 2004). Athletes should be encouraged to develop customized fluid
replacement programs to ensure that they are consuming fluid to prevent excessive dehydration
without risking hyponatremia (Montain, et al., 2006).
Beverages containing carbohydrates and electrolytes
The general consensus is that it is better to drink water than to drink nothing during
prolonged exercise in a warm environment, but beverages with carbohydrate and electrolytes
might promote better performance (Maughan & Shirreffs, 2008). The ingestion of a beverage
containing carbohydrates and electrolytes may also help to offset body fluid losses from
sweating during exercise in an attempt to attenuate the cardiovascular stress and hyperthermia
associated with exercise-induced dehydration (Vrijens & Rehrer, 1999).
The type, intensity and duration of exercise as well environmental conditions will alter an
individual's needs for fluids and electrolytes (Joint Position, 2009). Consumption of beverages
containing electrolytes and carbohydrates can help sustain fluid and electrolyte balance and
15

endurance exercise performance (Joint Position, 2009; Ray, et aI., 1998). Fluids that contain
the electrolytes sodium and potassium help replace sweat electrolyte losses (Joint Position,
2009). Fluids that contain sodium stimulate thirst and fluid retention; body water restoration
may be accelerated when subjects consume beverages containing higher sodium concentrations
(Ray, et al., 1998; Rodahl, 2003). Increased sodium intake may be warranted during the first
three to five days of heat exposure, since the increased thermal strain and associated increased
sweat rate increase the sodium lost in sweat (NATA Position Statement, 2000). Salt loss does
not have a direct impact on physical performance, but adequate replacement of sodium chloride
during physical activity can help encourage responses that promote hydration including
voluntary fluid intake (Murray, 2007; Passe, 2001), protection of plasma volume (Below, et al.,
1995; Murray, 2007) , and reduction of urine production (Murray, 2007; Vrijens & Rehrer , 1999).
Beverages containing a 6-8% carbohydrate are recommended for events lasting longer than one
hour (Joint Position, 2009; Ray, et al., 1998) and can provide energy (Joint Position, 2009).
Heat and Humidity
The risk for dehydration and heat injury increases dramatically in hot, humid
environments (Joint Position, 2009; Ray, et al., 1998). Heat cannot be dissipated by radiation
when the ambient temperature exceeds body temperature. The potential to dissipate heat by
evaporation of sweat is substantially reduced when the relative humidity is high (Joint Position,
2009). Evaporation of sweat from the skin's surface assists the body in regulating core
temperature (NATA Postion Statement, 2000) . The sweat rate generally increases after 10-14
days of heat exposure, which in tum requires a greater fluid intake for a similar bout of exercise.
16

Exercise-Induced Dehydration
Exercise-induced dehydration develops because of fluid losses that exceed fluid intake
(Joint Position, 2009). It is possible that some athletes may begin training or competing in a
state of dehydration because the interval between training sessions is inadequate for full
. rehydration.
Heat-Related Illness
A failure to have strategies for sustaining the hydration state is likely to increase the
prevalence of heat-related illnesses (Howe & Bowden, 2007). For avoidance of heat-related
illness morbidity and mortality, early recognition and prompt intervention are important. There
is every reason to believe that heat-related illness risk can be lowered with proper fluid
replacement before, during and after exertion.
Sawka and Montain (Sawka & Montain, 2000) have found that sweat output commonly
exceeds water intake during exercise in the heat, which can result in hypohydration and a loss of
electrolytes that result in electrolyte imbalances. Dehydration usually occurs during exercise
because of the unavailability of fluids or a disparity between thirst and water requirements,
. causing hypohydration over a prolonged period of exercise. Hypohydration lowers heat
dissipation, resulting in an increase in heat storage, and reduces a person's ability to tolerate heat
strain. Daily water losses can be substantial. It is, therefore, important to emphasize that both
fluid and electrolyte balance are critical for the function of all organs and general health.
Jones et al, (Jones, et aI., 2008) examined the effects of exercise-induced dehydration in a
hot, humid environment on anaerobic muscular power using a test-retest (euhydrated and
dehydrated) design. Seven subjects performed upper and lower body Wingate anaerobic tests
17

before and after a 1.5-hour recovery from a heat stress trial of treadmill exercise in a hot, humid
environment until a 3.1 ± 0.3% body mass loss was achieved. The findings of this study suggest
that dehydration of2.9%body mass decreases the ability to generate upper and lower body
anaerobic power. The authors state that it is important for coaches and athletes to understand that
sports performance (including basketball and football performance) requiring anaerobic strength
and power can be compromised by poor hydration, which may also contribute to an increased
risk of injury.
Recent deaths of collegiate and professional athletes, including those that occurred in
NCAA-affiliated teams and the NFL, have resulted in more focus on heat-related illnesses.
Howe and Boden (Howe & Bowden, 2007) have reviewed the heat stroke literature and have
concluded that it is preventable in all cases. One risk factor listed for heat stroke is dehydration,
which can be prevented with the proper education of coaches, trainers and athletes in
preventative hydration.
Coris et al. (Coris, et aI., 2007) reported that heat illness is the third leading cause of
death in athletics, following hypertrophic cardiomyopathy and congenital coronary anomalies
(Maron , et aI., 1996), and, whether mild or severe, an athlete's return to activity must progress
cautiously with the gradual implementation of re-acclimatization to exercise. Hydration status
must be monitored for return to play and to prevent subsequent exertional heat exhaustion. Heat
illness symptoms should be recognizable by the athletic training staff to prevent serious damage
to the athlete. Educational tools should be used to make athletes aware of how to monitor their
own hydration status as well as the implementation of recorded weigh-ins and urine samples
overseen by the medical staff.
18

Armstrong and Lopez (Armstrong & Lopez, 2007) found scientifically-backed guidance
on the subject of return to activity following exertional heat exhaustion (HEX). HEX is the most
common form of heat illness experienced by athletes. Dehydration that occurs from water
and/or sodium deficiency and a high ambient temperature represents a high risk for HEX It is
possible for anyone, including athletes, to experience HEX during a period of prolonged
exercise-heat stress if significant dehydration occurs. The authors state that "often, a patient
displays chronic unwillingness, disregard or ignorance of the basic principles ofrehydration and
nutri tion." Educating athletes in this area could help in preventing HEX from occurring.
Energy Issues
Optimum athletic performance is promoted by adequate energy intake. The amount of
ATP present in the skeletal muscles is not sufficient to provide a continuous supply of energy
(Joint Postion, 2009) . Carbohydrate intake during exercise can delay the onset of fatigue and
improve performance of prolonged exercise (Carter, et aI., 2003; Coggan & Coyle , 1987;
Jeukendrup, 2007). This is achieved by maintaining or raising plasma glucose concentrations
and sustaining high rates ofcarbohydrate oxidation. Providing exogenous carbohydrates during
exercise helps maintain blood glucose levels and improves performance (Joint Position, 2009).
The consumption of a high-carbohydrate diet (>60% of energy) during the training period, may
result in improved muscle glycogen concentrations and/or significant improvements in athletic
performance. In long-duration exercise, a greater contribution of exogenous carbohydrate will
spare liver glycogen, prevent a drop in blood glucose concentration, and help maintain the high
rate of carbohydrate oxidation necessary to sustain exercise intensity (Jeukendrup, 2007).
19

For long duration events, the consumption of 0.7 g carbohydrate/kg of body weight an
hour (approximately 30-60 g/hour) has been shown to extend endurance performance (Joint
Position, 2000; Joint Position, 2009). This amount has also been shown to maintain blood
glucose levels and sustain exercise performance (Joint Position, 2009; Ray, et aI., 1998). This is
consistent with Jeukendrup (Jeukendrup, 2007) as up to 50 grams of carbohydrate ingestion per
hour is suggested for team sports. Carbohydrate intake should begin soon after the onset of
activity; consuming a specified amount of carbohydrate as a bolus after two hours of exercise is
not as effective as consuming the same amount at 15- to 20 minute intervals throughout the two
hours of activity (Joint Position, 2000; Joint Position, 2009). With increasing exercise intensity,
the active muscle mass becomes progressively more dependant on carbohydrate as a source of
energy (Jeukendrup, 2007). The amount of carbohydrate an athlete should ingest during exercise
should be developed on an individual basis, largely by trial and error to accommodate the
individual athlete's needs.
Inadequate energy intake relative to energy expenditure compromises performance. With
limited energy intake , fat and lean tissue will be used for fuel by the body (Joint Position, 2009).
Oxidation of carbohydrate, fat, and protein leads to a loss of body mass independent of total
body water (Montain, et aI., 2006). Loss of lean tissue mass results in the loss of strength and
endurance, as well as compromised immune, endocrine and musculoskeletal function (Joint
Position, 2009).
Summary
It is important for athletes, coaches, dietitians, and trainers to be well educated on proper
hydration, the prevention of dehydration and the treatment of heat-related illnesses. Athletes,
20

including basketball and football players, are at risk for dehydration every time they participate
in a practice or game. Heat illness can manifest itself in multiple forms, ranging from mild
disease to life-threatening heat stroke. More emphasis should be placed on proper hydration and
snacking during practices and competitions to reduce athlete risk. It is difficult for coaches and
trainers to monitor the hydration status of every athlete during practices and games, which makes
it necessary for each athlete to understand proper hydration techniques . Greater focus on
preventative dehydration education for athletes could ensure better performance and prevent
injury and, in some cases, mortality. Basic guidelines shouldbe developed to help athletes
achieve an ideal state of hydration at the beginning of exercise, and to sustain an ideal state of
hydration during exercise. Proper hydration and snacking practices may also be beneficial to the
maintenance of optimal energy levels during exercise. There are no current guidelines on how to
best use the half-time period in basketball and football to help athletes optimize a state of
hydration and normal blood glucose . It is the aim of this study to learn more about current half
time eating and hydration behaviors to assess what types ofbeverages and snacks are being
consumed at halftime .. Ultimately, this information can be used to develop strategies for
optimally using the half time period to enhance/sustain performance and reduce illness/injury
risks .
21

CHAPTER THREE
METHODS
The protocol for this study was approved by the Institutional Review Board (IRB) at
Georgia State University. Following IRB-approval, surveys were distributed over a one year
period. Athletic trainers and coaches of basketball and football teams, athlete agents, other
athletic team employees, and players were contacted and provided with copies of a questionnaire
to distribute to volunteer subjects (athletes). Contact was made by email and phone. Some
surveys were sent by FedEx to volunteer subjects and returned to researchers once completed. If
contacts had available technology, surveys were sent via email and either filled out by assistants
on the computer and emailed back or filled out by the players and scanned onto a computer and
emailed back via attachment. In some instances, surveys were given to acquaintances of
athletes, filled out by the athletes, and returned to the researcher through the acquaintance.
Volunteer subjects were asked to complete the questionnaire that inquires about their personal
halftime hydration and snacking practices. The questionnaire is four pages in length (see
appendix) and was provided with a stamped pre-addressed envelope for return to the
investigators. Subjects were specifically requested to not include personal identifying
information on the questionnaire so they can remain anonymous. In some cases, athletic coaches
were contacted and confirmed that they could get their players to complete the survey but the
researchers did not hear back from them once the surveys had been sent.
It was important for this to be totally anonymous, as some subjects are highly paid
professional athletes who might not have wished to provide information on personal
eating/drinking behaviors that can be attributable to them . In addition, the researchers of this
study believe that the responses to the questions were more likely to be honest/accurate if the
22

subjects understood that they will remain anonymous. Athletes are not identified anywhere in
the research but in some instances the researcher was aware ofwho filled out surveys. This was
not reflected anywhere in the data. Some questions (i.e. , height, weight) were not filled out by
athletes and when the researcher was aware of what team the athlete was on, the height and
weight was obtained by roster. The identities of these athletes are not reflected in the data.
Female basketball players were difficult to obtain for the survey so some athletes who
had been contacted by a third.party (outside of the researcher) returned the completed survey to
the researcher. The identities of these athletes are not reflected in the data.
The questionnaire is benign in that there are no questions that would suggest behavioral
change or place the volunteer subject at risk, making the completion ofa signed and returned
.human consent form unnecessary. Athletes were provided with an approved human consent
form for them to keep, but only for them to understand the nature of the study and the nature of
their involvement. Most often, the consent form was returned, unsigned, with the completed
surveys.
As completed surveys were received by the researcher, data were entered into PASW
Statistics 18. Surveys were numbered according to the order entered into PASW Statistics 18 to
allow for correction of entry errors. Some questions were entered as '0' to represent no answer if
inore than one choice was picked or the question was left blank: One survey was left out as the
participant's survey listed age 34 and years played in college only, there was no way to find out
if this person was still in college or filled the survey out looking back at college years played.
Once all 122 surveys were received, all data were analyzed in PASW Statistics 18. Race
by sport was analyzed by using crosstabs. Data for height (inches and meters) and weight
(pounds and kilograms) were analyzed using descriptive statistics (mean, standard deviation,
23

range, and frequencies). Data for setting of competition (indoors, outdoors, or both) were
analyzed using crosstabs. Data for years played in college were analyzed using crosstabs. Data
for years redshirted in college were analyzed using crosstabs. Data for years played at the
professional level were analyzed using crosstabs. Data for minutes available at halftime for
consumption of beverages and snacks were analyzed using crosstabs. All remaining data were
analyzed using crosstabs and each set of data included a Chi Square Test. Completed surveys
will be kept for future research in the area of halftime hydration and snacking of collegiate and
professional athletes.
24

CHAPTER FOUR
RESULTS
It was hypothesized that athletes ' halftime hydration practices do not contribute to
sustaining a desirable hydration state and that athletes do not follow halftime snacking practices
that theoretically improve athletic performance during the second half. Results showed what
beverages and snacks athletes consumed at halftime but do not show if beverages consumed
sustain a desirable hydration state nor if snacks consumed improve athletic performance in the
second half
Make up ofsub;ects
The subjects in this study were collegiate and professional male American football
players n=58 (47.5%), collegiate and professional male basketball players n=50 (41%) and
collegiate women's basketball players n=14 (11.5%). No professional women's basketball
players completed the survey.
Of the 122 subjects, 5 (4.1 %) were biracial, 85 (69.7%) were African-American/Black, 2
(1.6 %) were Hispanic, 27 (22.1 %) were Caucasian and 3 (2.5%) were "other" . Bi-racial, when
specified, was listed as black/African-American and white (n=3) or black/African-American and
American Indian/Alaska Native (n=I).Other, when specified, was listed as Australian (n=I),and
African-Cameroon (n--I). The third other did not specify race. Of 58 football players, 3 (5.2%)
were bi-racial, 42 (72.4%) were black/African-America, 1 (1.7%) was Hispanic, 11 (19 .0%)
were Caucasian, and 1 (1.7%) was "other" . Bi-racial, when specified by football players, was
listed as black/African-American and white (n=l) or black/African-American and American
Indian/Alaska Native (n=I). No specification was listed by the football player who marked his
race as "other". Of 50 men's basketball players, 2 (4.0%) were bi-racial, 33 (66.0%) were
25

black/African-American, 1 (2.0%) was Hispanic, 12 (24.0%) were Caucasian, and 2 (4.0%) were
"other". Bi-racial, when specified by men's basketball players, was listed as black/African
'American and white (n=2). "Other", when specified by men's basketball players, was listed as
Australian (n=l) or African-Cameroon (n- l ). Of 14 women's basketball players, 10 (71.4%)
were black/African-American and 4 (28.6%) were Caucasian. Options given for race on the
survey were American Indian and Alaska Native, Asian, Biracial, Black or African American,
Hispanic, Native Hawaiian and Other Pacific Islander, White, and Other. See appendix table 1.
The mean height of the 122 subjects was 74.77 inches, SD = 4.38 in (189.78 em, SO =
11.11 ern) , the maximum height was 84.00 in (213.36 em) and the minimum height was 63.00 in
(160.02 em). The mean weight was 220.33 lbs, SO = 45.77lbs (l00.05 kg, SD = 20.86 kg) , the
maximum weight was 330 .00 lbs (150.00 kg) , and the minimum weight was 130.00 lb (59 .09
kg). See appendix table 2.
Out of 58 football players, 42 (72.4%) played outdoors and 16 (27.6%) played both
outdoors and indoors. Out of 50 men's basketball players, 47 (94.0%) played indoors and 3
(2.5%) played both outdoors and indoors. Out of 14 women's basketball players, 12 (9.8%)
played indoors and 2 (1.6%) played both outdoors and indoors. See appendix table 3.
Out of 58 collegiate and professional football players, one (1.7%) played no years in
college, 13 (22.4%) played one year in college, 15 (25.9%) played two years in college, 14
(24.1 %) played three years in college, and 15 (25.9%) played 4 years incollege. Out of 50
collegiate and professional men's basketball players, two (4.0%) played no years in college, 15
(30.0%) played one year in college, 10 (20.0%) played two years in college, 13 (26.0%) played
three years in college, and 10 (20.0%) played four years in college. Out of 14 collegiate
women's basketball players , 1 (7.1%) played no years in college, two (14.3%) played one year in
26

college, four (28.6%) played two years in college, three (21.4%) played three years in college,
three (21.4%) played four years in college, and one (7.1 %) played five years in college. See
appendix table 4.
Out of 58 collegiate and professional football players, 21 (36.2%) did not red shirt in
college, 35 (60.3%) red shirted one year in college, and two (3.4%) red shirted two years in
college. Out of 50 collegiate and professional men's basketball players, 33 (66.0%) did not red
shirt in college, 11 (22.0%) red shirted one year in college, and six (12.0%) red shirted two years
in college. Out of 14 collegiate women's basketball players, 11 (78 .6%) did not red shirt in
college and three (21.4%) red shirted one year in college. See appendix table 5.
Out of 58 collegiate and professional football players, 51 (87.9%) played no years as
professionals, four (6.9%) played one to three years as professionals and three (5.2%) played
four to eight years as professionals. Out of 50 collegiate and professional men 's basketball
players, 34 (68.0%) played no years as professionals, seven (14 .0%) played one to three years as
professionals, seven (14.0%) played four to eight years as professionals, one (2.0%) played 9-12
years as professionals, and one (2.0%) played 13-15 years as professionals. Out of 14 collegiate
basketball players, none had played as professionals. See appendix table 6.
Time available to players at halftime for consumption ofbeverages and/or snacks
Out of 58 collegiate and professional football players, two (3.4%) had 0-5 minutes
available, 19 (32.8%) had 6- 10 minutes available, 20 (34.5%) had 11-15 minutes available, and
17 (29.3%) had 16-20 minutes available. Out of 50 collegiate and professional men 's basketball
players, (16.0%) had 0-5 minutes available, 25 (50.0%) had 6-10 minutes available, 15 (30 .0%)
had 11-15 minutes available, and two (4.0%) had 16-20 minutes available. Out of 14 collegiate
27

women's basketball players, one (7.1%) had no minutes available, three (21.4%) had 0-5 minutes
available, four (28.6%) had 6-10 minutes available, four (28.6%) had 11-15 minutes available,
and two (14.3%) had 16-20 minutes available. See appendix table 7.
Beverages consumed by athletes at halftime
Of the beverages consumed by the 122 athletes surveyed, there was a statistically
significant difference between sports in the consumption of Gatorade, Powerade, Powerade Zero,
and water. Water (n=96) was consumed by most of the athletes followed by Gatorade (n=89),
Powerade (n=41), and Powerade Zero (n=I).
There is no statistically significant difference between sports in the consumption ofXS.
Out of 58 collegiate and professional football players, none of them consumed XS during the
halftime break. Out of 50 collegiate and professional men's basketball players, 3 (6.0%)
consumed 1-2 cups ofXS during the halftime break. Out of 14 collegiate women's basketball
players, none consumed XS during the halftime break. See appendix table 8.
There is no statistically significant difference between sports in the consumption of FRS
Energy Drink. Out of 58 collegiate and professional football players, none of them consumed
FRS Energy Drink during the halftime break. Out of 50 collegiate and professional men's
basketball players, 1 (2.0%) consumed 1-2 cups of FRS Energy Drink during the halftime break.
Out of 14 collegiate women's basketball players, none consumed FRS Energy Drink during the
halftime break . See appendix table 9.
There is no statistically significant difference between sports in the consumption of fruit
JUIce. Out of 58 collegiate and professional football players, 1 (1.7%) consumed Y2 cup of fruit
28

juice during halftime and 1 (1.7%) consumed 1-2 cups during the halftime break. Out of 50
collegiate and professional men's basketball players, 2 (4.0%) consumed Y2 cup during the
halftime break and 2 (4.0%) consumed 1-2 cups during the halftime break. Out of 14 collegiate
. women's basketball players, 1 consumed 3-4 cups of fruit juice during the halftime break. See
appendix table 10.
There is a statistically significant difference between sports in the consumption of
Gatorade (p=.045). Out of 58 collegiate and professional football players, 3 (5.2%) consumed 1;2
cup of Gatorade during halftime, 31 (53.4%) consumed 1-2 cups of Gatorade during the halftime
break, and 9 (15.5%) consumed 3-4 cups of Gatorade during the halftime break. Out of 50
collegiate and professional men's basketball players, 1 (2.0%) consumed 'l2 cup of Gatorade
during the halftime break, 26 (52 .0%) consumed 1-2 cups of Gatorade during the halftime break ,
7 (14.0%) consumed 3-4 cups of Gatorade during the halftime break and 5 (10.0%) consumed >4
cups of Gatorade during the halftime break. Out of 14 collegiate women's basketball players, 2
(14.3%) consumed Y2 cup of Gatorade during the halftime break, 4 (28.6%) consumedl-2 cups of
Gatorade during the halftime break and 1 consumed 3-4 cups of Gatorade during the halftime
break. See appendix table II.
There is no statistically significant difference between sports in the consumption of
Gatorlode. Out of 58 collegiate and professional football players, 3 (5.2%) consumed 1-2 cups
of Gatorlode during the halftime break. Out of 50 collegiate and professional men's basketball
players, 2 (4.0%) consumed 3-4 cups of Gatorlode during the halftime break. Out of 14
collegiate women's basketball players none consumed Gatorlode during the halftime break. See
appendix table 12.
29

There is no statistically significant difference between sports in the consumption of
Hydrate. Out of 58 collegiate and professional football players, 2 (3.4%) consumed 1-2 cups of
Hydrate during the halftime break, 1 (1.7%) consumed 3-4 cups of Hydrate during the halftime
break, and 1 (1.7%) consumed >4 cups of Hydrate during the halftime break. Out of 50
collegiate and professional men's basketball players, 3 (6.0%)) consumed 1-2 cups of Hydrate
during the halftime break. Out of 14 collegiate women's basketball players none consumed
Hydrate during the halftime break. See appendix table 13.
There is a statistically significant difference between sports in the consumption of
Powerade (p<.OOl). Out of 58 collegiate and professional football players, 1 (1.7%) consumed
Y2 cup of Powerade during the halftime break and 15 (25.9%) consumed 1-2 cups of Powerade
during the halftime break. Out of 50 collegiate and professional men's basketball players, 2
(4.0%) consumed Y2 cup of Powerade during the halftime break and 16 (32.0%) consumed 1-2
cups of Powerade during the halftime break. Out of 14 collegiate women's basketball players, 1
(7.1 %) consumed Y2 cup of Powerade during the halftime break, 2 (14.3%) consumed 1-2 cups of
Poweradeduring the halftime break and 4 (28.6%) consumed 3-4 cups of Powerade during the
halftime break. See appendix table 14.
There is a statistically significant difference between sports in the consumption of
Powerade Zero (p=.020). Out of 58 collegiate and professional football players, none consumed
Powerade Zero during the halftime break. Out of 50 collegiate and professional men's
basketball players, none consumed Powerade Zero during the halftime break. Out of 14
collegiate women's basketball players, 1 (7.1 %) consumed 1-2 cups of Powerade Zero during the
halftime break. See appendix table 15.
30

There is no statistically significant difference between sports in the consumption of
Vitamin Water. Out of 58 collegiate and professional football players 1 (1.7%) consumed 1-2
cups of Vitamin Water during the halftime break. Out of 50 collegiate and professional men's
basketball players 1 (2.0%) consumed 1-2 cups of Vitamin Water during the halftime break and
1 (2.0%) consumed 3-4 cups of Gatorade during the halftime break. Out of 14 collegiate
women's basketball players, none consumed Vitamin Water during the halftime break. See
appendix table 16.
There is a statistically significant difference between sports in the consumption of water .
(p=.049). Out of 58 collegiate and professional football players, 5 (8.6%) consumed 'h cup of
water during the halftime break, 28 (48.3%) consumed 1-2 cups of water during the halftime
break, 8 (13.8%) consumed 3-4 cups of water during the halftime break and 1 (1.7%) consumed
>4 cups of water during the halftime break. Out of 50 collegiate and professional men's
basketball players, 3 (6.0%) consumed 'h cup of water during the halftime break, 27 (54.0%)
consumed 1-2 cups of water during the halftime break, 7 (14.0%) consumed 3-4 cups of water
during the halftime break, and 5 (10.0%) consumed >4 cups of water during the halftime break.
Out of 14 collegiate women's basketball players, 4 (28.6%) consumed 'h cup of water during the
halftime break, 4 (28.6%) consumed 1-2 cups of water during the halftime break, and 4 (28.6%)
consumed 3-4 cups of water during the halftime break. See appendix table 17.
There is no statistically significant difference between sports in the consumption of other
beverages. Out of 58 collegiate and professional football players , 2 (3.4%) consumed 'h cup of
other beverage during the halftime break and 3 (5.2%) consumed 1-2 cups of other beverage
during the halftime break. Out of 50 collegiate and professional men's basketball players 1
(2.0%) consumed >4 cups of other beverage during the halftime break. Out of 14 collegiate
31

women's basketball players none consumed other beverage during the halftime break. See
appendix table 18.
Snacks consumed by athletes at halftime
Of the snacks consumed by the 122 athletes surveyed, there was a statistically significant
difference between sports in the consumption of energy bars and fresh fruit. Energy bars (n=6~)
were consumed by most of the athletes followed by fresh fruit (n==41).
There is no statistically significant difference between sports in the consumption of
canned fruit. Out of 58 collegiate and professional football players, 1 (1.7%) consumed 'h can of
canned fruit during the halftime break and 1 (1.7%) consumed 1 can of canned fruit during the
halftime break. Out of 50 collegiate and professional men 's basketball players 2 (4.0%)
consumed 1 can of canned fruit during the halftime break, 1 (2.0%) consumed 1 can of canned
fruit during the halftime break and 1 (2.0%) consumed > 1.5 cans of canned fruit during the
halftime break. Out of 14 collegiate women's basketball players 1 (7.1%) consumed 'h can of
canned fruit during the halftime break. See appendix table 19.
There is no statistically significant difference between SPOltS in the consumption of
crackers, pretzels, or saltines. Out of 58 collegiate and professional football players, 2 (3.4%)
consumed .'h cup of crackers, pretzels, or saltines during the halftime break. Out of 50 collegiate
and professional men's basketball players 6 (12.0%) consumed 1/2 cup of crackers, pretzels, or
saltines during the halftime break. Out of 14 collegiate women's basketball players 1 (7.1%)
consumed 'h cup of crackers, pretzels, or saltines during the halftime break. See appendix table
20.
32

There is a statistically significant difference between sports in the consumption of energy
bars (p<.OOl). Out of 58 collegiate and professional football players, 15 (25.9%) consumed Y2 of
an energy bar during the halftime break, 26 (44.8%) consumed I energy bar during the halftime
break, 3 (5.2%) consumed 1 Y:z energy bars during the halftime break and 1 (1.7%) consumed>1
Y:z energy bars during the halftime break. Out of 50 collegiate and professional men's basketball
players, 5 (10.0%) consumed Y:z of an energy bar during the halftime break, 9 (18.0%) consumed
1 energy bar during the halftime break, and 1 (2.0%) consumed 1 Y:z energy bars during the
halftime break. Out of 14 collegiate women's basketball players 1 (7.1%) consumed Y:z of an
energy bar during the halftime break and 1 (17.2%) consumed 1 energy bar during thehalftime
break. See appendix table 21.
There is no statistically significant difference between sports in the consumption of
energy gel. Out of 58 collegiate and professional football players, 1 (1.7%) consumed 1 pack of
energy gel during the halftime break. Out of 50 collegiate and professional men 's basketball
players, 1(2.0%) consumed 12 pack of energy gel during the halftime break. Out of 14 collegiate
women's basketball players, none consumed energy gel during the halftime break. See appendix
table 22.
There is a statistically significant difference between sports in the consumption of fresh
fruit (p=.033). Out of 58 collegiate and professional football players, 7 (12.1%) consumed Y:z of
a fruit during the halftime break, 12 (20.7%) consumed 1 fruit during the halftime break, 4
(6.9%) consumed 1 Y:z fruits during the halftime break and 2 (3.4%) consumed > 1 Y:z fruits during
the halftime break. Out of 50 collegiate and professional men's basketball players, 11 (22.0%)
consumed Y:z ofa fruit during the halftime break, 1 (2.0%) consumed 1 fruit during the halftime
break , 2 (4.0%) consumed 1 Y:z fruits during the halftime break, and 1 (2.0%) consumed >1 12
33

fruits during the halftime break . Out of 14 collegiate women's basketball players 1 (7.1%)
consumed I fruit during the halftime break. See appendix table 23.
There is no statistically significant difference between sports in the consumption of
peanut butter. Out of 58 collegiate and professional football players , I (1.7%) consumed I
tablespoon (Tbsp) of peanut butter during the halftime break. Out of 50 collegiate and
professional men's basketball players, 5 (10.0%) consumed Y2 Tbsp of peanut butter during the
halftime break. Out of 14 collegiate women's basketball players, none consumed peanut butter
during the halftime break. See appendix table 24.
There is no statistically significant difference between sports in the consumption of
peanut butter. Out of 58 collegiate and professional football players, none consumed salt free
pretzels during the halftime break. Out of 50 collegiate and professional men's basketball
players, 1 (2.0%) consumed Y2 cup of salt free pretzels during the halftime break. Out of 14
collegiate women's basketball players, none consumed salt free pretzels during the halftime
break. See appendix table 25.
There is no statistically significant difference between sports in the consumption of other
snacks. Out of 58 collegiate and professional football players, I (1.7%) consumed I '12 of
another snack during the halftime break. Out of 50 collegiate and professional men's basketball
players, I (2.0%) consumed> 1 '12 other snacks, specified as Snickers, during the halftime break.
Out of 14 collegiate women's basketball players, 1 (7.1%) consumed 1 other snack during the
halftime break. See appendix table 26.
Halftim e hydration
34

I
.There is no statistically significant difference between sports in the purchase of drinks for
halftime, the frequency ofhalftime hydration, and the influences that determine halftime
hydration habits.
There is no statistically significant difference between sports in the purchase of drinks by
the athlete or the team. Out of 58 collegiate and professional football players, 1 (1.7%)
.purchased his own drink for consumption at halftime and 55 (94.8%) consumed drinks at
halftime that were purchased for them by their team. Out 50 collegiate and professional men's
basketball players, 2 (4.0%) purchased their own drinks for consumption at halftime and 44
(88.0%) consumed drinks at halftime that were purchased for them by their team. Out of 14
collegiate women's basketball players, 13 (92.9%) consumed drinks at halftime that were
purchased for them by their team. See appendix table 27·.
There is no statistically significant difference between sports in the frequency ofhalftime
hydration habits. Out of 58 collegiate and professional football players, 2 (3.4%) sometimes
never hydrated the same way at every halftime, 20 (34.5%) sometimes hydrated the same way at
every halftime, 20 (34.5%) sometimes always hydrated the same way at every halftime, and 16
(27.6%) always hydrated the same way at every halftime. Out of 50 collegiate and professional
men 's basketball players, 3 (6.0%) sometimes never hydrated the same way at every halftime, 19
(38.0%) sometimes hydrated the same way at every halftime, 12 (24.0%) sometimes always
hydrated the same way at every halftime and 15 (30.0%) always hydrated the same way at every
halftime. Out of 14 collegiate women's basketball players, 1 (7.1%) never hydrated the same
way at every halftime, 2 (14.3%) sometimes never hydrated the same way at every halftime, 3
(21.4%) sometimes hydrated the same way at every halftime, 5 (35.7%) sometimes always
35

hydrated the same way at every halftime, and 3 (21.4%) always hydrated the same way at every
halftime. See appendix table 28.
There is no statistically significant difference between sports in the influences that
determine halftime hydration. Choices given were availability of beverages, difficulty of the
game, team requirement, temperature and amount of time played. Out of 58 collegiate and
professional football players , 4 (6.9%) said that availability of beverages influenced how they
hydrated at halftime, 7 (12.1%) said that the difficulty of the game influenced how they hydrated
at halftime, 16 (27.6%) said that temperature influenced how they hydrated at halftime, and 17
(29.3%) said that the amount of time they played during the game influenced how they hydrated
at halftime. Out of 50 collegiate and professional men 's basketball players, 8 (16.0%) said that
availability of beverages influenced how they hydrated at halftime, 7 (14.0%) said that the
difficulty of the game influenced how they hydrated at halftime, 2 (4.0%) said that hydrating at
halftime was a team requirement, 2 (4.0%) said that temperature influenced how they hydrated at
halftime, and 18 (36.0%) said that the amount of time they played during the game influenced
how they hydrated at halftime. Out of 14 collegiate women's basketball players , 1 (7.1%) said
that the difficulty of the game influenced how they hydrated at halftime, 3 (21.4%) said that
temperature influenced how they hydrated at halftime, and 6 (42.9%) said that the amount of
time they played during the game influenced how they hydrated at halftime. See appendix table
29.
Halftim e snacking
36

Of the halftime snacking habits listed on the survey, there was a statistically significant
difference between sports in the purchase of snacks for halftime and the frequency of halftime
snacking habits.
There is a statistically significant difference between sports in the purchase of snacks by
the athlete or the team (p=.004). Out of 58 collegiate and professional football players, 2 (3.4%)
purchased their own snacks for consumption at halftime and 51 (87.9%) consumed snacks at
halftime that were purchased for them by their team. Out of 50 collegiate and professional
men's basketball players, 4 (8.0%) purchased their own snacks for consumption at halftime and
36 (72.0%) consumed snacks at halftime that were purchased for them by their team. Out of 14
collegiate women's basketball players, 1 (7.1%) purchased her own snacks for consumption at
halftime and 6 (42.9%) consumed snacks at halftime that were purchased for them by their team.
See appendix table 30.
There is a statistically significant difference between sports in the frequency of halftime
snacking habits (p<.OOI). Out of 58 collegiate and professional football players, 4 (6.9% never
snacked the same way at every halftime, 7 (12.1 %) sometimes never snacked the same way at
every halftime, 24 (41.4%) sometimes snacked the same way at every halftime, 11 (19.0%)
sometimes always snacked the same way at every halftime, and 11 (19.0%} always snacked the
same way at every halftime. Out of 50 collegiate and professional men's basketball players, 13
(26.0%) never snacked the same way at every halftime,lO (20.0%) sometimes never snacked the
same way at every halftime, 21 (42.0%) sometimes snacked the same way at every halftime, 1
(2.0%) sometimes always snacked the same way at every halftime, and 3 (6.0%) always snacked
the same way at every halftime. Out of 14 collegiate women's basketball players , 2 (14.3%)
never snacked the same way at every halftime, 3 (21.4%) sometimes never snacked the same
37

way at every halftime, 1 (7.1%) sometimes snacked the same way at every halftime, 1 (7.1%)
sometimes always snacked the same way at every halftime, and 2 (14.3%) always snacked the
same way at every halftime. See appendix table 31.
There is no statistically significant difference between sports in the influences that
determine halftime snacking. Choices given were availability of beverages, difficulty of the
.game, team requirement, temperature and amount oftime played. Out of 58 collegiate and
professional football players, 9 (15.5%) said that availability of snacks influenced how they
snacked at halftime, 11 (19.0%) said that the difficulty of the game influenced how they snacked
at halftime, 1 (1.7%) said that team requirements influenced how they snacked at halftime, 4
(6.9%) said that temperature influenced how they snacked at halftime, and 4 (37.9%) said that
the amount of time they played during the game influenced how they snacked at halftime. Out of
50 collegiate and professional men's basketball players, 14 (28.0%) said that availability of
snacks influenced how they snacked at halftime , 1 (2.0%) said that the difficulty of the game
influenced how they snacked at halftime, 1 (2.0%) said that snacking at halftime was a team
.. requirement, 1 (2.0%) said that temperature influenced how they snacked at halftime, and 17
(34.0%) said that the amount oftime they played during the game influenced how they snacked
at halftime. Out of 14 collegiate women's basketball players, 6 (42.9%) said that the availability
of snacks influenced how they snacked at halftime and 1 (7.1 %) said that the difficulty of the
game influenced how they snacked at halftime. See appendix table 32.
Team recommendations (or halftime hydration and/or snacking
There is a statistically significant difference between sports in the halftime
recommendations of teams for both hydration and snacking.
38

There is a statistically significant difference between sports in the halftime hydration
recommendations of teams (p<.OOl). Out of 58 collegiate and professional football players,
three (5.2%) were on teams that sometimes always recommended hydrating at halftime and 54
(93.1 %) were on teams that always recommended hydrating at halftime. Out of 50 collegiate
and professional men's basketball players, two (4.0%) were on teams that never recommended
hydrating during halftime, four (8.0%) were on teams that sometimes never recommended
hydrating at halftime, four (8.0%) were on teams that sometimes recommended hydrating at
halftime, 14 (28.0%) were on teams that sometimes always recommended hydrating at halftime,
and 26 (52.0%) were on teams that always recommended hydrating at halftime. Out of 14
collegiate women's basketball players three (21.4%) were on teams that sometimes
recommended hydrating at halftime, six (42.9%) were on teams that sometimes always
recommended hydrating at halftime, and five (35.7%) were on teams that always recommended
hydrating at halftime. See appendix table 33.
There is a statistically significant difference between sports in the halftime snacking
recommendations of teams (p<.OOI). Out of 58 collegiate and professional football players, one
(1.7%) were on teams that sometimes.never recommended snacking at halftime, 13 (22.4%) were
on teams that sometimes recommended snacking at halftime, 10 (17.2%) were on teams that
sometimes always recommended snacking at halftime, and 3 (56.9%) were on teams that always
recommended snacking at halftime. Out of 50 collegiate and professional men's basketball
players, 13 (26.0%) were on teams that never recommended snacking during halftime, nine
(18.0%) were on teams that sometimes never recommended snacking at halftime, 16 (32.0%)
were on teams that sometimes recommended snacking at halftime , six (12.0%) were on teams
that sometimes always recommended snacking at halftime, and six (12.0%) were on teams that
39

always recommended snacking at halftime. Out of 14collegiate women's basketball players,
seven (50.0%) were on teams that never recommended snacking at halftime, one (7.1%) was on a
team that sometimes never recommended snacking at halftime, three (21.4%) were on teams that
sometimes recommended snacking at halftime, and two (14 .3%) were on teams that sometimes
always recommended snacking at halftime.. See appendix table 34.
Availability and preferability ofbeverages and snacks at halftime
There is a statistically significant difference between sports in the availability of snacks at
halftime and the preferability of snacks available at halftime and no statistically significant
difference between sports in the availability of beverages at halftime and the preferability of
beverages available at halftime.
There is no statistically significant difference between sports in the availability of
beverages at halftime. Out of 58 collegiate and professional football players, one (1.7%) was on
a team that sometimes always made beverages available at halftime and 56 (96.6%) were on
teams that always made beverages available at halftime. Out of 50 collegiate and professional
men's basketball players, one (2.0%) was on a team that sometimes never made beverages
available at halftime, three (6.0%) were on teams that sometimes made beverages available at
halftime, four (8.0%) were on teams that sometimes always made beverages available at
halftime, and 42 (84.0%) were on teams that always made beverages available at halftime. Out
of 14 collegiate women's basketball players, one (7.1 %) were on teams that sometimes made
beverages available at halftime, two (14.3%) were on teams that sometimes always made
beverages available at halftime, and 11 (78 .6%) were on teams that always made beverages
available at halftime. See appendix table 35.
40

There is no statistically significant difference between sports in the beverage preferability
of available beverages at halftime. Out of 58 collegiate and professional football players, one
(1.7%) never preferred the beverages provided by their teams at halftime, six (10.3%) sometimes
preferred the beverages provided by their teams at halftime, nine (15.5%) sometimes always
preferred the beverages provided by their teams at halftime, and 41 (70.7%) always preferred the
beverages provided by their teams at halftime. Out of 50 collegiate and professional men's
basketball players, one (2.0%) sometimes never preferred the beverages provided by his team at
halftime, seven (14.0%) sometimes preferred the beverages provided by their teams at halftime ,
14 (28.0%) sometimes always preferred the beverages provided by their teams at halftime, and
26 (52.0%) always preferred the beverages provided by their teams at halftime. Out of 14
collegiate women's basketball players , four (28.6%) sometimes preferred the beverages provided
by their teams at halftime , two (14.3%) sometimes always preferred the beverages provided by
their teams at halftime, and eight (57.1%) always preferred the beverages provided by their
. teams at halftime. See appendix table 36.
There is a statistically significant difference between sports in the availability of snacks at
halftime (p<.OO 1). Out of 58 collegiate and professional football players, two (3.4%) were on a .
team that sometimes made snacks.available at halftime, five (8.6%) were on a team that
sometimes always made snacks available at halftime, and 49 (84.5%) were on teams that always
made snacks available at halftime. Out of 50 collegiate and professional men's basketball
players, five (10.0%) were on a team that never made snacks available at halftime , four (8.0%)
sometimes never made snacks available at halftime, 14 (28.0%) were on teams that sometimes
made snacks available at halftime, six (12.0%) were on teams that sometimes always made
snacks available at halftime, and 20 (40.0%) were on teams that always made snacks available at
41

halftime. Out of 14 collegiate women's basketball players, eight (57.1%) were on teams that
never made snacks available at halftime , three (21.4%) were on teams that sometimes made
snacks available at halftime, one (7.1%) was on a team that sometimes always made snacks
available at halftime, and two (14.3%) were on teams that always made snacks available at
halftime. See appendix table 37.
There is a statistically significant difference between sports in the snack preferability of
available snacks at halftime (p<.OOI). Out of 58 collegiate and professional football players , 11
(19.0 %) sometimes preferred the snacks provided by their teams at halftime, 18 (31.0%)
sometimes always preferred the snacks provided by their teams at halftime , and 28 (48.3%)
always preferred the snacks provided by their teams at halftime. Out of 50 collegiate and
professional men 's basketball players, six (12.0%) never preferred the snacks provided by their
teams at halftime, four (8.0%) sometimes never preferred the snacks provided by their teams at
halftime, 17 (34.0%) sometimes preferred the snacks provided by their teams at halftime, 11
(22.0 %) sometimes always preferred the snacks provided by their teams at halftime, and 11
(22.0 %) always preferred the snacks provided by their teams at halftime. Out of 14 collegiate
women's basketball players, four (28.6%) never preferred the snacks provided by their teams at
halftime, five (35.7%) sometimes preferred the snacks provided by their teams at halftime, one
(7.1%) sometimes always preferred the snacks provided by her team at halftime, and one (7.1%)
always preferred the snacks provided by her team at halftime. See appendix table 38.
Environmental influences on athletes ' halftime hydration and snacking habits
There is a statistically significant difference between sports in temperature's influence on
what athletes drink at halftime and humidity's influence on what athletes drink at halftime.
42

There is no statistically significant difference between sports in altitude's influence on what
athletes drink at halftime and no statistically significant difference between sports in
temperature's, humidity's and altitude's influence on what athletes eat at halftime.
There is a statistically significant difference between sports in temperature's influence on
what athletes drink at halftime (p<.OOI). Out of 58 collegiate and professional football players,
11 (19.0%) said that temperature sometimes influenced what they drank at halftime, 11 (19.0%)
said that temperature sometimes always influenced what they drank at halftime, and 35 (60.3%)
said that temperature always influenced what they drank at halftime. Out of 50 collegiate and
professional basketball players, four (8.0%) said that temperature never influenced what they
drank at halftime, eight (16.0%) said that temperature sometimes never influenced what they
drank at halftime, 19(38.0%) said that temperature sometimes influenced what they drank at
halftime, 14 (28.0%) said that temperature sometimes always influenced what they drank at
halftime, and five (10.0%) said that temperature always influenced what they drank at halftime.
Out of 14 collegiate women's basketball players, one (7.1%) said that temperature never
influenced what they drank at halftime, eight (16.0%) said that temperature sometimes never
influenced what they drank at -halftime, 19 (38.0%) said that temperature sometimes influenced
what they drank at halftime, 14 (28.0%) said that temperature sometimes always influenced what
they drank at halftime, and five (l0.0%) said that temperature always influenced what they drank
at halftime. See appendix table 39.
There is no statistically significant difference between sports in temperature's influence
on what athletes eat at halftime. Out of 58 collegiate and professional football players, six
(10.3%) said that temperature never influenced what they ate at halftime, 10 (17.2%) said that
temperature sometimes never influenced what they ate at halftime, 17 (29.3%) said that
43

temperature sometimes influenced what they ate at halftime, 11 (19.0%) said that temperature
sometimes always influenced what they ate at halftime, and 13 (22.4%) said that temperature
always influenced what they ate at halftime. Out of 50 collegiate and professional basketball
players, II (22.0%) said that temperature never influenced what they ate at halftime, 12 (24.0%)
said that temperature sometimes never influenced what they ate at halftime, 17 (34.0%) said that
temperature sometimes influenced what they ate at halftime, 4 (8.0%) said that temperature
sometimes always influenced what they ate at halftime, and five (10.0%) said that temperature
always influenced what they ate at halftime. Out of 14 collegiate women's basketball players,
five (35.7%) said that temperature never influenced what they ate at halftime, two (14:3%) said
that temperature sometimes never influenced what they ate at halftime, four (28.6%) said that
temperature sometimes influenced what they ate at halftime, 1 (7.1%) said that temperature
sometimes always influenced what they ate at halftime, and one (7.1%) said that temperature
always influenced what they ate at halftime. See appendix table 40.
There is a statistically significant difference between sports in humidity's influence on
what athletes drink at halftime (p<.OOI). Out of 58 collegiate and professional football players,
one (1.7%) said that humidity sometimes never influenced what he drank at halftime, eight
(13.8%) said that humidity sometimes influenced what they drank at halftime, 11 (19.0%) said
that humidity sometimes always influenced what they drank at halftime, and 37 (63.8%) said that
humidity always influenced what they drank at halftime. Out of 50 collegiate and professional
basketball players, eight (16.0%) said that humidity never influenced what they drank at
halftime, four (8.0%) said that humidity sometimes never influenced what they drank at halftime,
18 (36.0%) said that humidity sometimes influenced what they drank at halftime, 13 (26.0%)
said that humidity sometimes always influenced what they drank at halftime, and seven (14.0%)
44

said that humidity always influenced what they drank at halftime. Out of 14 collegiate women 's
basketball players , one (7.1%) said that humidity never influenced what they drank at halftime,
three (21.4%) said that humidity sometimes influenced what they drank at halftime, six (42.9%)
said that humidity sometimes always influenced what they drank at halftime , and four (28.6%)
said that humidity always influenced what they drank at halftime. See appendix table 41.
There is no statistically significant difference between sports in humidity's influence on
what athletes eat at halftime . Out of 58 collegiate and professional football players, six (10.3%)
said that humidity never influenced what they ate at halftime, 10 (17.2%) said that humidity
sometimes never influenced what they ate at halftime, 18 (31.0%) said that humidity sometimes
influenced what they ate at halftime, nine (15.5%) said that humidity sometimes always
influenced what they ate at halftime, and 14 (24.1%) said that humidity always influenced what
they ate at halftime . Out of 50 collegiate and professional basketball players, 12 (24.0%) said
that humidity never influenced what they ate at halftime, 12 (24.0%) said that humidity
sometimes never influenced what they ate at halftime, 16 (32.0%) said that humidity sometimes
influenced what they ate at halftime, 7 (14.0%) said that humidity sometimes always influenced
what they ate at halftime, and two (4.0%) said that humidity always influenced what they ate at
halftime. Out of 14 collegiate women's basketball players, four (28.6%) said that humidity
never influenced what they ate at halftime, three (21.4%) said that humidity sometimes never
influenced what they ate at halftime, five (35.7%) said that humidity sometimes influenced what
they ate at halftime, and one (7.1%) said that humidity always influenced what they ate at
halftime. See appendix table 42.
There is no statistically significant difference between sports in altitude 's influence on
what athletes drink at halftime. Out of 58 collegiate and professional football players, 13
45

(22.4%) said that altitude never influenced what they drank at halftime, 10 (17.2%) said that ·
altitude sometimes never influenced what they drank at halftime, 10 (17.2%) said that altitude
sometimes influenced what they drank at halftime, 17 (29.3%) said that altitude sometimes
always influenced what they drank at halftime, and six (10.3%) said that altitude always
influenced what they drank at halftime. Out of 50 collegiate and professional basketball players,
13 (26.0%) said that altitude never influenced what they drank at halftime, seven (14.0%) said
that altitude sometimes never influenced what they drank at halftime, 11 (2.0%) said that altitude
sometimes influenced what they drank at halftime, 16 (32.0%) said that altitude sometimes
always influenced what they drank at halftime, and three (6.0%) said that altitude always
influenced what they drank at halftime. Out of 14 collegiate women's basketball players, three
(21.4%) said that altitude never influenced what they drank at halftime, three (21.4%) said that
altitude sometimes never influenced what they drank at halftime, two (14.3%) said that altitude
sometimes influenced what they drank at halftime, three (21.4%) said that altitude sometimes
always influenced what they drank at halftime , and three (21.4%) said that altitude always
influenced what they drank at halftime. See appendix table 43.
There is no statistically significant difference between sports in altitude's influence on
what athletes eat at halftime . Out of 58 collegiate and professional football players, 15 (25.9%)
said that altitude never influenced what they ate at halftime, 13 (22.4%) said that altitude
sometimes never influenced what they ate at halftime, 14 (24.1%) said that altitude sometimes
influenced what they ate at halftime, eight (13.8%) said that altitude sometimes always
influenced what they ate at halftime, and six (10.3%) said that altitude always influenced what
they ate at halftime. Out of 50 collegiate and professional basketball players , 18 (36.0%) said
that altitude never influenced what they ate at halftime, 10 (20,0%) said that altitude sometimes
46

never influenced what they ate at halftime, 14 (28.0%) said that altitude sometimes influenced .
what they ate at halftime, 7 (14.0%) said that altitude sometimes always influenced what they ate
at halftime, and one (2.0%) said that altitude always influenced what they ate at halftime. Out of
14 collegiate women's basketball players, five (35.7%) said that altitude never influenced what
they ate at halftime, four (28.6%) said that altitude sometimes never influenced what they ate at
halftime, two (14.3%) said that altitude sometimes influenced what they ate at halftime, one
(7.1%) said that altitude sometimes always influenced what they ate at halftime, and one (7.1%)
said that altitude always influenced what they ate at halftime. See appendix table 44.
Cramps and injuries
There is no statistically significant difference among sports in the frequency that athletes
are prone to cramping, the influence of cramping on what athletes drink at halftime, and the
influence of cramping on what athletes eat at halftime. There is no statistically significant
difference among sports in the frequency that athletes are prone to injuries, the influence of
injuries on what athletes drink at halftime, and the influence of injuries on what athletes eat at
halftime
There is no statistically significant difference among sports in the frequency that athletes
are prone to cramping. Out 58 collegiate and professional basketball players, nine (15.5%) were
never prone to cramping, 28 (48.3%) were sometimes never prone to cramping, 11 (19.0%) were
sometimes prone to cramping, two (3.4%) were sometimes always prone to cramping, and seven
(12.1%) were always prone to cramping. Out of 50 collegiate and professional men's basketball
players, 12 (24.0%) were never prone to cramping, 16 (32.0%) were sometimes never prone to
cramping, 13 (26.0%) were sometimes prone to cramping, five (10.0%) were sometimes always
47

prone to cramping, and four (8.0%) were always prone to cramping. Out of 14 collegiate
women's basketball players , three (21.4%) were never prone to cramping, four (28.6%) were
sometimes never prone to cramping, four (28.6%) were sometimes prone to cramping, two
(14.3%) were sometime always prone to cramping, and one (7.1%) were always prone to
cramping. See appendix table 45.
There is no statistically significant difference between sports in the influence ofcramping
on what athletes drink at halftime. Out of 58 collegiate and professional football players, five
(8.6%) said that cramping never influenced what they drank: at halftime, six (10.3%) said that
cramping sometimes never influenced what they drank at halftime, 11 (19.0%) said that
cramping sometimes influenced what they drank at halftime, nine (15.5%) said that cramping
sometimes always influenced what they drank: at halftime, and 26 (44.8%) said that cramping
always influenced what they drank: at halftime. Out of 50 collegiate and professional basketball
players, nine (18.0%) said that cramping never influenced what they drank at halftime, five
(10 .0%) said that cramping sometimes never influenced what they drank at halftime, nine
(18.0%) said that cramping sometimes influenced what they drank at halftime, 12 (24.0%) said
that cramping sometimes always influenced what they drank at halftime, and 15 (30.0%) said
that cramping always influenced what they drank at halftime. Out of 14 collegiate women's
basketball players, two (14.3%) said that cramping never influenced what they drank at halftime,
three (21.4%) said that cramping sometimes never influenced what they drank at halftime, three
(21.4 %) said that cramping sometimes influenced what they drank at halftime, three (21.4%) said
that cramping sometimes always influenced what they drank at halftime, and two (14.3%) said
that cramping always influenced what they drank at halftime. See appendix table 46.
48

There is no statistically significant difference between sports in the influence of cramping
on what athletes eat at halftime. Out of 58 collegiate and professional foothalI players, 12
(20.7%) said that cramping never influenced what they ate at halftime , 13 (22.4%) said that
cramping sometimes never influenced what they ate at halftime , 11 (19.0%) said that cramping
sometimes influenced what they ate at halftime, 10 (17.2%) said that cramping sometimes
always influenced what they ate at halftime , and 11 (19.0%) said that cramping always
influenced what they ate at halftime. Out of 50 collegiate and professional basketball players, 15
(30.0%) said that cramping never influenced what they ate at halftime , seven (14.0%) said that
cramping sometimes never influenced what they ate at halftime, 10 (20.0%) said that cramping
sometimes influenced what they ate at halftime, 11 (22.0%) said that crampingsometimes
always influenced what they ate at halftime, and six (12.0%) said that cramping always
influenced what they ate at halftime. Out of 14 collegiate women's basketball players, five
(35.7%) said that cramping never influenced what they ate at halftime , two (14.3%) said that
cramping sometimes never influenced what they ate at halftime, four (28.6%) said that cramping
sometimes influenced what they ate at halftime, and one (7.1%) said that cramping sometimes
always influenced what they ate at halftime. See appendix table 47.
There is no statistically significant difference among sports in the frequency that athletes
are prone to injuries. Out 58 collegiate and professional basketball players, 10 (17.2%) were
never prone to injuries, 25 (43.1%) were sometimes never prone to injuries , 16 (27.6%) were
sometimes prone to injuries, four (6.9%) were sometimes always prone to injuries, and two
(3.4%) were always prone to injuries. Out of 50 collegiate and professional men's basketball
players, five (10.0%) were never prone to injuries, 28 (56.0%) were sometimes never prone to
injuries, 15 (30.0%) were sometimes prone to injuries, one (2.0%) were sometimes always probe
49

to injuries, and one (2.0%) were always prone to injuries. Out of 14 collegiate women's
basketball players, three (21.4%) were sometimes never prone to injuries, seven (50.0%) were
sometimes prone to injuries, two (14.3%) were sometimes always prone to injuries, and one
(7.1%) was always prone to injuries. See appendix table 48.
There is no statistically significant differencebetween sports in the influence of injuries
on what athletes drink at halftime. Out of 58 collegiate and professional football players, 20
(34.5%) said that injuries never influenced what they drank at halftime, 15 (25.9%) said that
injuries sometimes never influenced what they drank at halftime, 14 (24.1%) said that injuries
sometimes influenced what they drank at halftime , four (6.9%) said that injuries sometimes
always influenced what they drank at halftime , and four (6.9%) said that injuries always
influenced what they drank at halftime. Out of 50 collegiate and professional basketball players,
20 (40.0%) said that injuries never influenced what they drank at halftime, 14 (28.0%) said that
injuries sometimes never influenced what they drank at halftime, 10 (20.0%) said that injuries
sometimes influenced what they drank at halftime, three (6.0%) said that injuries sometimes
always influenced what they drank at halftime, and three (6.0%) said that injuries always
influenced what they drank at halftime. Out of 14 collegiate women's basketball players, five
(35.7%) said that injuries never influenced what they drank at halftime, five (35.7%) said that
injuries sometimes never influenced what they drank at halftime, one (7.1%) said that injuries
sometimes influenced what they drank at halftime, and one (7.1%) said that injuries sometimes
always influenced what they drank at halftime . See appendix table 49.
There is no statistically significant difference between sports in the influence of injuries
on what athletes eat at halftime. Out of 58 collegiate and professional football players, 21
(36.2%) said that injuries never influenced what they ate at halftime, 18 (31.0%) said that
50

injuries sometimes never influenced what they ate at halftime, II (19.0%) said that injuries
sometimes influenced what they ate at halftime, five (8.6%) said that injuries sometimes always
influenced what they ate at halftime, and two (3.4%) said that injuries always influenced what
they ate at halftime. Out of 50 collegiate and professional basketball players, 2 (44.0%) said that
injuries never influenced what they ate at halftime, 14 (28.0%) said that injuries sometimes never
influenced what they ate at halftime, seven (14.0%) said that injuries sometimes influenced what
they ate at halftime, four (8.0%) said that injuries sometimes always influenced what they ate at
halftime, and two (4.0%) said that injuries always influenced what they ate at halftime. Out of
14 collegiate women's basketball players, six (42.9%) said that injuries never influenced what
they ate at halftime, four (28.6%) said that injuries sometimes never influenced what they ate at
halftime, and two (14.3%) said that injuries sometimes influenced what they ate at halftime. See
appendix table 50.
Pre-game and first halfhvdration and snacking practices ofathletes
There is a statistically significant difference among sports in the influence of pre-game
drinking practices on halftime hydration habits and the influence of first half drinking practices
on halftime hydration habits.
There is no statistically significant difference among sports in the timing of pre-game
meal consumption. Out of 58 collegiate and professional football players, five (8.6%) consumed
their pre-game meal 1-2 hours before kick-off, 35 (60.3%) consumed their pre-game meal 2.5
4.0 hours before kick-off, and 16 (27.6%) consumed their pre-game meal 4.5-6.0 hours before
kick-off. Out of 50 collegiate and professional men's basketball players, five (10.0%) consumed
their pre-game meal 1-2 hours before tipoff, 35 (70.0%) consumed their pre-game meal 2.5-4.0
51

hours before tipoff, and eight (16.0%) consumed their pre-game meal 4.5-6.0 hours before tipoff.
Out of 14 collegiate women's basketball players, II (78.6%) consumed their pre-game meal 2.5
4.0 hours before tipoff and two (14.3%) consumed their pre-game meal 4.5-6.0 hours before
tipoff. See appendix table 51.
There is no statistically significant difference among sports in the consumption of fluids
between pre-game warm up and kick off/tipoff. Out of 58 collegiate and professional football
players, three (5.2%) sometimes never consumed fluids between pre-game warm up and kick off,
five (8.6%) sometimes consumed fluids between pre-game warm up and kick off, 13 (22.4%)
sometimes always consumed fluids between pre-game warm up and kick off, and 35 (60.3%)
always consumed fluids between pre-game warm up and kick off. Out of 50 collegiate and
professional men's basketball players, two (4.0%) never consumed fluids between pre-game
warm up and tipoff, six (12.0%) sometimes never consumed fluids between pre-game warm up
and tipoff, seven (14.0%) sometimes consumed fluids between pre-game warm up and tipoff, 10
(20.0%) sometimes always consumed fluids between pre-game warm up and tipoff, and 25
(50.0%) always consumed fluids between pre-game warm up and tipoff. Out of 14 collegiate
women's basketball players, one (7.1%) never consumed fluids between pre-game warm up and
tipoff, two (14.3%) sometimes never consumed fluids between pre-game warm up and tipoff,
four (28.6%) sometimes consumed fluids between pre-game warm up and tipoff, and seven
(50.0%) always consumed fluids between pre-game warm up and tipoff. See appendix table 52.
There is no statistically significant difference among sports in the consumption of fluids
during the first half of the game. Out of 58 collegiate and professional football players, two
(3.4%) sometimes never consumed fluids during the first half of the game, three (5.2%)
sometimes consumed fluids during the first half of the game, 13 (22.4%) sometimes always
52

consumed fluids during the first half of the game, 18 (31.0%) sometimes always consumed fluids
during the first half of the game, and 34 (58.6%) always consumed fluids during the first half of
the game. Out of 50 collegiate and professional men's basketball players, five (10.0%)
sometimes never consumed fluids during the first half of the game, nine (18.0%) sometimes
consumed fluids during the first half of the game, 11 (22.0%) sometimes always consumed fluids
during the first half of the game, and 25 (50.0%) always consumed fluids during the first half of
the game. Out of 14 collegiate women's basketball players, one (7.1%) sometimes never
consumed fluids during the first half of the game, five (35.7%) sometimes consumed fluids
during the first half of the game, one (7.1%) sometimes always consumed fluids during the first
half of the game, and seven (50.0%) always consumed fluids during the first half of the game.
See appendix table 53.
There is a statistically significant difference among sports in the influence of pre-game
drinking practices on halftime hydration habits (p=.046). Out of 58 collegiate and professional
football players, seven (12.1%) said that pre-game drinking practices never influenced how they
hydrated at halftime, three (5.2%) said that pre-game drinking practices sometimes never
influenced how they hydrated at halftime, 17 (29.3%) said that pre-game drinking practices
sometimes influenced how they hydrated at halftime, 14 (24.1%) said that pre-game drinking
practices sometimes always influenced how they hydrated at halftime, and 16 (27.6%) said that
pre-game drinking practices always influenced how they hydrated at halftime. Out of 50
collegiate and professional men's basketball players, six (12.0%) said that pre-game drinking
practices never influenced how they hydrated at halftime, five (10.0%) said that pre-game
drinking practices sometimes never influenced how they hydrated at halftime, 17 (34.0%) said
that pre-game drinking practices sometimes influenced how they hydrated at halftime, eight
53

(16.0%) said that pre-game drinking practices sometimes always influenced how they hydrated
at halftime, and 13 (26.0%) said that pre-game drinking practices always influenced how they
hydrated at halftime. Out of 14 collegiate women's basketball players, four (28.6%) said that
pre-game drinking practices sometimes never influenced how they hydrated at halftime, six
(42.9%) said that pre-game drinking practices sometimes influenced how they hydrated at
halftime, one (7.1%) said that pre-game drinking practices sometimes always influenced how
they hydrated at halftime, and one (7.1%) said that pre-game drinking practices always
influenced how they hydrated at halftime. See appendix table 54.
There is a statistically significant difference among sports in the influence of first half
drinking practices on halftime hydration habits (p=.035). Out of 58 collegiate and professional
football players, four (6.9%) said that first half drinking practices never influenced how they
hydrated at halftime, three (5.2%) said that first half drinking practices sometimes never
influenced how they hydrated at halftime, 19 (32.8%) said that first half drinking practices
sometimes influenced how they hydrated at halftime, 14 (24.1%) said that first half drinking
practices sometimes always influenced how they hydrated at halftime, and 15 (25.9%) said that
first half drinking practices always influenced how they hydrated at halftime. Out of 50
collegiate and professional men's basketball players, four (8.0%) said that first half drinking
practices never influenced how they hydrated at halftime, five (l 0.0%) said that first half
drinking practices sometimes never influenced how they hydrated at halftime, 15 (30.0%) said
that first half drinking practices sometimes influenced how they hydrated at halftime, 10 (20.0%)
said that first half drinking practices sometimes always influenced how they hydrated at halftime,
and 16 (32.0%) said that first half drinking practices always influenced how they hydrated at
halftime. Out of 14 collegiate women's basketball players, three (21.4%) said that first half
54
drinking practices sometimes never influenced how they hydrated at halftime, six (42.9%) said
that first half drinking practices sometimes influenced how they hydrated at halftime, one (7.1%)
said that first half drinking practices sometimes always influenced how they hydrated at halftime,
and one (7.1%) said that first half drinking practices always influenced how they hydrated at
halftime. See appendix table 55.
There is no statistically significant difference among sports in the consumption of food
between pre-game warm up and kick off/tipoff. Out of 58 collegiate and professional football
players, 25 (43.1%) never consumed food between pre-game warm up and kick off, 11 (19.0%)
sometimes never consumed food between pre-game warm up and kick off, 10 (17.2%)
sometimes consumed food between pre-game warm up and kick off, 8 (13.8%) sometimes
always consumed food between pre-game warm up and kick off, and 3 (5.2%) always consumed
food between pre-game warm up and kick off. Out of 50 collegiate and professional men's
basketball players, 15 (30.0%) never consumed food between pre-game warm up and tipoff, 13
(26.0%) sometimes never consumed food between pre-game warm up and tipoff, 12 (24.0%)
sometimes consumed food between pre-game warm up and tipoff, 6 (12.0%) sometimes always
consumed food between pre-game warmup and tipoff, and 4 (8.0%) always consumed food
between pre-game warm up and tipoff. Out of 14 collegiate women's basketball players, five
(35.7%) never consumed food between pre-game warm up and tipoff, four (28.6%) sometimes
never consumed food between pre-game warm up and tipoff, three (21.4%) sometimes consumed
food between pre-game warm up and tipoff, and two (14.3%) always consumed food between
pre-game warm up and tipoff. See appendix table 56.
There is no statistically significant difference among sports in the consumption of food
during the first half of the game. Out of 58 collegiate and professional football players, 32
55

(55.2%) never consumed food during the first half of the game, seven (12.1%) sometimes never
consumed food during the first half of the game, nine (l5.5)sometimes consumed food during
the first half of the game, seven (12.1%) sometimes always consumed food during the first half
of the game, and two (3.4%) always consumed food during the first half of the game. Out of 50
collegiate and professional men's basketball players, 30 (60.0%) never consumed food during
the first half of the game, 12 (24.0%) sometimes never consumed food during the first halfof the
game, seven (14.0%) sometimes consumed food during the first half of the game, and one (2.0%)
always consumed food during the first half of the game. Out of 14 collegiate women's
basketball players, eleven (78.6%) never consumed food during the first half of the game, one
(7.1%) sometimes never consumed food during the first half of the game, and two (14.3%)
sometimes consumed food during the first half of the game. See appendix table 57.
There is no statistically significant difference among sports in the influence of pre-game
eating practices on halftime eating habits. Out of 58 collegiate and professional football players,
19 (32.8%) said that pre-game eating practices never influenced how they ate at halftime, seven
(12.1 %) said that pre-game eating practices sometimes never influenced how they ate at
halftime, 17 (29.3%) said that pre-game eating practices sometimes influenced how they ate at
halftime, 4 (6.9%) said that pre-game eating practices sometimes always influenced how they ate
at halftime, and 10 (17.2%) said that pre-game eating practices always influenced how they ate at
halftime. Out of 50 collegiate and professional men's basketball players, 17 (34.0%) said that
pre-game eating practices never influenced how they ate at halftime, 12 (24.0%) said that pre
game eating practices sometimes never influenced how they ate at halftime, 13 (26.0%) said that
pre-game eating practices sometimes influenced how they ate at halftime, four (8.0%) said that
pre-game eating practices sometimes always influenced how they ate at halftime, and four
56

(8.0%) said that pre-game eating practices always influenced how they ate at halftime. Out of 14
collegiate women's basketball players, seven (50.0%) said that pre-game eating practices never
influenced how they ate at halftime, two (14.3%) said that pre-game eating practices sometimes
never influenced how they ate at halftime, four (28.6%) said that pre-game eating practices
sometimes influenced how they ate at halftime, and one (7.1%) said that pre-game eating
practices sometimes always influenced how they ate at halftime. See appendix table 58.
There is no statistically significant difference among sports in the influence of first half
eating practices on halftime eating habits. Out of 58 collegiate and professional football players,
24 (41.4%) said that first half eating practices never influenced how they ate at halftime, eight
(13.8%) said that first half eating practices sometimes never influenced how they ate at halftime,
16 (27.6%) said that first half eating practices sometimes influenced how they ate at halftime, 3
(5.2%) said that first half eating practices sometimes always influenced how they ate at halftime,
and 5 (8.6%) said that first half eating practices always influenced how they ate at halftime. Out
of 50 collegiate and professional men's basketball players, 26 (52.0%) said that first half eating
practices never influenced how they ate at halftime, 13 (26.0%) said that first half eating
practices sometimes never influenced how they ate at halftime, seven (14.0%) said that first half
eating practices sometimes influenced how they ate at halftime, two (4.0%) said that first half
eating practices sometimes always influenced how they ate at halftime, and two (4.0%) said that
first half eating practices always influenced how they ate at halftime. Out of 14 collegiate
women's basketball players, six (42.9%) said that first half eating practices never influenced how
they ate at halftime, two (14.3%) said that first half eating practices sometimes never influenced
how they ate at halftime, and five (35.7%) said that first half eating practices sometimes
influenced how they ate at halftime. See appendix table 59.
57

Athlete weight loss during games
There is a statistically significant difference arnong sports in the extent of weight lost
during a game (p<.OOI). Out of 58 collegiate and professional football players, three (5.2%)
never lost weight during garnes, six (10.3%) sometimes never lost weight during games, 15
(25.9%) sometimes lost weight during games, 16 (27.6%) sometimes always lost weight during
garnes, and 16 (27.6%) always lost weight during garnes. Out of 50 collegiate and professional
men's basketball players, six (12.0%) never lost weight during games, 10 (20.0%) sometimes
never lost weight during garnes, 21 (42.0%) sometimes lost weight during games, nine (18.0%)
sometimes always lost weight during garnes, and four (8.0%) always lost weight during garnes.
Out of 14 collegiate women's basketball players, four (28.6%) never lost weight during garnes,
six (42.0%) sometimes never lost weight during games, and three (21.4%) sometimes lost weight
during games. See appendix table 60.
The maximum weight lost during a game was 15 pounds (men's basketball player) and
the most weight gained during a game was five pounds (women's basketball player). The
average weight lost during games arnong football, men's basketball, and women's basketball
players was 2.54 pounds (SD= 2.879).
Summary
In summary, professional organizations recommend the consumption of a 6-8%
carbohydrate solution (i.e., Gatorade) during activity (Burns & Clarkson, 2001; Coggan &
Coyle, 1991; Kavouras, 2002; Maron, et al., 1996; Osterberg, et al., 2009). It appears that a
majority of athletes, whether by tearn recommendation, team provision or individual preference,
58

are consuming the recommended beverages (Gatorade, n=99). Water is also consumed by a
majority of the athletes who participated in this study. Snacking is less common among athletes,
unless in the form of an energy bar. It appears that athletes are taking advantage of the halftime
break but it is impossible to see, from this study, if they are using techniques that will aid in
enhanced performance during the second half of the game. Pre-game hydration status should
also be taken into consideration, but was not evaluated in this study.
59

CHAPTER FIVE
DISCUSSION AND CONCLUSIONS
Discussion
The results of this study show that athletes have the time and resources to drink and snack
at the halftime break to replenish glycogen stores and rehydrate for the second half of games.
Athletes, whether by recommendation or by habit, consume a variety of beverages and snacks
during the halftime break of games. It is still uncertain as to whether or not these hydration and
snacking habits actually replenish glycogen stores and rehydrate the athletes for the second half
of games.
The GSSI recommends consumption of a 6% carbohydrate solution every hour during
exercise (Burns & Clarkson, 2001). The ACSM recommends consuming a :S8% carbohydrate
solution during exercise (Joint Position, 2000; Joint Position, 2009). The NCAA's general
recommendations are that an athlete should consume a 6-8% CHO solution to avoid dehydration
(NCAA 2006-2007 Sports Medicine Handbook). Gatorade, a 6% carbohydrate solution, was
consumed by 89 (72.95%) of the 122 athletes that were surveyed. Powerade, an 8%
carbohydrate solution, was consumed by 41 (33.61%) of the athletes that completed the survey
for this study.
The consumption of an 18% carbohydrate solution was recommended specifically by the
GSSI for carbohydrate replenishment during the halftime break (Burns & Clarkson, 2001).
Gatorlode, an 18% carbohydrate solution, was consumed by 5 (4.10%) of the 122 athletes
surveyed. Other beverages consumed during halftime by the 122 athletes surveyed are as
follows: XS was consumed by 3 (2.46%), FRS was consumed by I «1.00%), fruit juice was
consumed by 7 (5.74%), Hydrate was consumed by 7 (5.74%), Powerade Zero was consumed by
60

1 «1.00%), Vitamin Water was consumed by 3 (2.46%), and other beverages were consumed by
6 (4.92%).
The NCAA recommends water as a cost-effective hydration beverage (NCAA 2006
2007 Sports Medicine Handbook). Out of the 122 athletes surveyed, 96 (78.69%) consumed
water during the halftime break.
The ACSM recommends consumption of gels, energy bars and other foods (other foods
not specified) to meet carbohydrate needs during exercise (Joint Position, 2000; Joint Position,
2009). Energy gels were consumed during halftime by 2 (1.64%) of the 122 athletes surveyed.
Energy bars were consumed during halftime by 62 (50.82%) of the 122 athletes surveyed. Other
foods consumed during halftime by the 122 athletes surveyed as follows: canned fruit n=7
(5.74%), crackers, pretzels, saltines n=9 (7.38%), fresh fruit n=41 (33.61%), peanut butter n=6
(4.92%), salt free pretzels n=l «1 %), and other (listed as Snickers bar when specified) n=3
(2.46%).
The NCAA and "Beat the Heat" suggest that fluids be readily available for athletes
during practice and games (Gatorade Heat Safety Package 2009). 112 (91.8%) of the 122
athletes surveyed were on teams that provided beverages at halftime and 3 (2.5%) ofthe 122
athletes provided their own beverages for consumption at halftime. 12 (9.8%) of the 122 athletes
surveyed listed the availability of beverages as the strongest influence on their hydration habits at
halftime. 115 (94.26%) of the athletes were on teams that sometimes, sometimes always, or
always recommended hydrating at halftime. 120 (98.36%) ofthe athletes were on teams that
sometimes, sometimes always, or always made beverages available at halftime and 117 (95.90%)
said they were sometimes, sometimes always, or always beverages that they prefer.
61

The ACSM, the ADA, and the DC recommend hydrating before, during, and after
exercise (Joint Position, 2000; Joint Position, 2009). Adequate food and fluid should be
consumed before, during, and after exercise to help maintain blood glucose concentration during
exercise, maximize exercise performance, and improve recovery time (Burke, et aI., 2006; Joint
Position, 2009). Energy and macronutrient needs must be met for athletes to maintain body
weight, replenish glycogen stores, and provide adequate protein for building and repairing tissue
(Joint Position, 2000). Pre-game meal consumption of the 122 athletes surveyed is as follows:
10 (8.20%) consumed their pre-game meal 1-2 hours before kick off/tipoff, 81 (66.39%)
consumed their pre-game meal 2.5-4.0 hours before kick off/tipoff and 26 (21.31%) consumed
their pre-game meal 4.5-6.0 hours before kick off/tipoff. Out of the 122 athletes surveyed, 106
(86.89%) sometimes, sometimes always, or sometimes consumed fluids between pre-game warm
up and kick off/tipoff and 48 (39.34%) sometimes, sometimes always, or always consumed food
between the pre-game warm up and kick off/tipoff. Out of the 122 athletes surveyed, 113
(92.62%) consumed fluids during the first half of the game and 28 (22.95%) sometimes,
sometimes always, or always consumed food during the first half of the game. Out of the 122
athletes surveyed, 120 (98.36%) of the athletes were on teams that sometimes, sometimes
always, or always made beverages available at halftime and 117 (95.90%) said they were
sometimes, sometimes always, or always beverages that they prefer. Out of the 122 athletes
surveyed, 102 (83.61 %) were on teams that sometimes, sometimes always, or always made
snacks available at halftime and 103 (84.43%) said they were sometimes, sometimes always, or
always snacks that they prefer.
62

Conclusions
In most cases, athletes follow the recommendations of the ACSM, ADA, DC, GSSI,
NATA and NCAA. Most of the athletes are given recommendations to hydrate (n=115) and
snack (n=89), showing that coaches ancllor trainers are aware of the need to hydrate and snack.
However, this study was not able to demonstrate whether or not they are beginning
competition in a hydrated state, which would make halftime a period in which to sustain
hydration. If athletes begin competition in a dehydrated state then it would be difficult to
become hydrated at halftime. There was also no way determine whether athletes snack to return
liver carbohydrate stores to a level that can sustain blood glucose better during the second half.
There was also no way to determine if athletes understand why they need to be hydrating and/or
snacking at halftime.
Of the beverages consumed, water was consumed by most (n=96) of the athletes
surveyed. The drink consumed most often following water, was Gatorade (n=89). Gatorade was
the only sports beverage that had a research institute. There is no way to determine from this
study if athletes are consuming this beverage because they know how Gatorade' s formulation
works, their trainers recommend Gatorade, or sponsorship dictates that they drink Gatorade.
Athletes were surveyed from 14 different teams; eleven of those teams are sponsored by
Gatorade, two teams (at one university) are sponsored by Powerade, and one team's sponsor was
not found. Powerade followed Gatorade in drink consumption (n=41). Of the snacks consumed,
energy bars were consumed by most (n=62) of the athletes surveyed. The snack consumed most
often following energy bars, was fresh fruit (n=3 I).
Research shows that it might be more beneficial for athletes to consume sports drinks
(i.e., Gatorade or Powerade) rather than water during the halftime break. The ingestion of a
63

beverage containing carbohydrates and electrolytes may help to offset body fluid losses from
sweating during exercise in an attempt to attenuate the cardiovascular stress and hyperthermia
associated with exercise-induced dehydration (Vrijens & Rehrer, 1999). Since water is
consumed by most of the athletes surveyed, it is possible that the benefits, shown by research
(Below, et aI., 1995; Joint Position, 2009; Maughan & Shirreffs, 2008; Murray, 2007; NATA
Position Statement, 2007; Popowski, et al., 2001; Ray, et al., 1998; Rodahl, 2003; Vrijens &
Rehrer, 1999) of sports drinks over water are not generally known by athletes and those working
closely with them. Cost and palatability may also be factors in beverage choice for athletes at
halftime. It is difficult to determine from this study what influences the choice of beverage at
halftime as some of the athletes checked multiple answers for that question and those answers
were recorded as .00 (n=31). Time playing was checked most as the influence that determines
halftime hydration (n=41), followed by temperature (n=21). More influences could have been
included on the survey (i.e., cramping, fatigue, knowledge of dehydration, palatability, thirst) to
make the question more inclusive. Of the 122 athletes surveyed, 112 said that the team provided
beverages at halftime. This appears to be the most influential factor on what beverages are
consumed at halftime.
Snacking at halftime is another way for athletes to consume carbohydrates during
competition. It is difficult to determine from this study what influences the choice of snack at
halftime as some of the athletes checked multiple answers for that question and those answers
were recorded as .00 (n=34). Time playing was checked most as the influence that determines
halftime snacking (n=39), followed by availability (n=29). More influences could have been
included on the survey (i.e., cramping, fatigue, hunger, knowledge of blood glucose levels during
exercise, palatability) to make the question more inclusive. Of the 122 athletes surveyed, 93 said
64

that the team provided snacks at halftime. This appears to be the most influential factor on what
snacks are consumed at halftime.
In conclusion we found that athletes are drinking beverages with compositions
recommended by the ACSM, ADA, DC, GSSI, NATA and NCAA and they are consuming
snacks that could help to replenish liver glycogen stores. However further research will be
needed to determine if athletes are actually being rehydrated at halftime and replenishing liver
glycogen stores at halftime.
Future studies should be done to determine whether the hydration and snacking habits are
maintaining hydration and sustaining blood glucose for better performance. Hydration status
prior to game time should be determined as well. If athletes are beginning the game in a
dehydrated state, it will be impossible to use the halftime break to become properly hydrated. If
a survey is given to collect information, it should be done as an interview to make sure that only
the best answer is chosen and that the questions are understood. The survey should be more
concise to ensure that more athletes will be willing to fill it out.
65

REFERENCES
Androgue HJ, Madias NE. Hyponatraemia. N Engl J Med. 2000;342:1581-9.
Armstrong LE. Hydration Assessment Techniques. Nutr Rev. 2005;63(6):S40-S54.
Armstrong LE, Herrera Soto JA, Hacker FT, Casa DJ, Kavouras SA, Maresh CM. Urinaryindices during dehydration, exercise, and rehydration. Int J Sports Nutr. 1998;8:345-355.
Armstrong LE and Lopez RM. Return to exercise training after heat exhaustion. J Sport Rehabi!.2007;16(3): 182-189.
Armstrong LE, Maresh CM, Castellani JW, et al. Urinary indices of hydration status. Int JSports Nutr. 1994;4:265-279.
Barr Sl, Costill DL. Water: can the endurance athlete get too much of a good thing. JAm DietAssoc. 1989;89:1629-1632,1635.
Below PR, Mora-Rodrigues R, Gonzalez-Alonso J, Coyle EF: Fluid and carbohydrate ingestionindependently improve performance during 1 h of intense exercise. Med Sci Sports Exerc.1995;27:200-210.
Burke LM, LoucksAB, Broad N. Energy and carbohydrate for training and recovery. J SportsSci. 2006; 24: 675-85.
Burns J, Clarkson P. (2001). Hydration and performance SSE roundtable #43: why don't athletesdrink enough during exercise, and what can be done about it? Sports Science Library, I2(l),Retrieved from http://gssiweb.org/Article_Detail.aspx?articleid=260&level=2&topic=2
Carter J, Jeukendrup AE, Mundel T, Jones DA. Carbohydrate supplementation improvesmoderate and high-intensity exercise in the heat, Eur J Physiol. 2003;446:211-219.
Casa DJ, Clarkson PM, Roberts, WOo American College of Sports Medicine roundtable onhydration and physical activity, consensus statements. Curr Sports Med Rep. 2005;4:115-127.
Cheuvrant SN, Carter R 1lI, Sawka MN. Fluid balance and endurance exercise performance.Curr Sports Med Rep. 2:202-208,2003.
Cheuvrant SN, Carter R 1lI, Montain SJ, Sawka MN. Daily body mass variability and stability inactive men undergoing exercise-heat stress. Int J Sport Nutr. Exerc. Metab. 2004;14:532-540.
Cheuvront SN & Sawka MN. Hydration assessment of athletes. Sports Science Exchange.2005; 18(97).
Coggan AR; Coyle EE. Carbohydrate ingestion during prolonged exercise: effects onmetabolism and performance. Exerc Sports Sci Rev. 1991;19: 1-40.
66

Coggan AR, Coyle EE. Reversal offatigue during prolonged exercise by carbohydrate infusionor ingestion. J Appl Physiol. 1987;63:2388-2395.
Coris EE, Ramirez AM, and Van Durme OJ. Heat illness in athletes: the dangerous combinationof heat, humidity and exercise. Sports Med. 2004; 34: 9-16.
Caris EE, Walz S, Konin J, and Pescasio M. Return to activity considerations in a footballplayer predisposed to exertional heat illness: a case study. J Sport Rehabi!. 2007; 16(3): 260270.
Coyle, EF. Hydration and performance SSE #50: Fluid and carbohydrate replacement duringexercise: How much and why? Sports Science Library. 1994;7(3). Retrieved from:http://gssiweb.org/Article_Detail.aspx?articleid=23&level=2&topic=2
Coyle, EE, Coggan AR, Hemmert MK, Ivy JL. Muscle glycogen utilization during prolongedstrenuous exercise when fed carbohydrate. J Appl Physiol. 1986;61:165-172.
Francesconi RP, Sakwa MN, PandolfKB. Hypohydration and heat acclimation: plasma renninand aldosterone during exercise. J Appl Physio!. 1983;55: 1760-1794.
Gatorade heat safety package. (2009, August). Retrieved fromhttp://www.nfl.com/static/content/catch alllnfl generic content/gatorade-safety.pdf
Godek SF, Bartolozzi AR, Godek JJ. Sweat rate and fluid turnover in American football playerscompared with runners in a hot and humid environment. Br J Sports Med. 39:205-211,2005.
Greenleaf JE, Morimoto T. Mechanisms controlling fluid ingestion: thirst and drinking. In:Buskirk ER, Puhl SM, eds. Body Fluid Balance: Exercise and Sport. Boca Raton, FL: CRCPress; 1996.
Hancock PA, Vasmatzidis 1. Effects of heat stress on cognitive performance: the current state ofknowledge. Int J Hyperthermia 19:355-372,2003.
Hew-Butler T, Almond C, Ayus JC, et.al. Consensus Statement of the l" International ExerciseAssociated Hyponatremia Consensus Development Conference, Cape Town, South Africa 2005.Clin J Sport Med. 2005;15:208-213.
Howe AS and Boden BP. Heat-related illness in athletes. Am J Sport Med. 2007; 35(8): 13841395.
Hubbard RW, Szlyk PC, Armstrong LE. Influence of thirst and fluid palatability on fluidingestion during exercise. In: Gisolfi CV, Lamb DR, eds. Perspectives in Exercise Sciences andSports Medicine. Fluid Homeostasis During Exercise. Indianapolis, IN: Benchmark Press;1990.
67

Jeukendrup A. Carbohydrate supplementation during exercise: Does it help? How much is toomuch? GSSI Sports Science Exchange. No. 106. 2007; 20(3): 1-6.
Joint Position Statement: Nutrition and athletic performance. American College of SportsMedicine, American Dietetic Association, and Dietitians of Canada. Can J Diet Prac Res. 2000;61(4): 176-191.
Joint Position Statement: Nutrition and athletic performance. American College of SportsMedicine, American Dietetic Association, and Dietitians of Canada. Med Sci Sports Exerc.2009; 41(3): 709-731.
Jones LC, Cleary MA, Lopez RM, Zuri RE, and Lopez R. Active dehydration impairs upper andlower body anaerobic muscular power. J Strength Cond Res. 2008; 22(2): 455-463.
Kavouras S. Assessing hydration status. Curr Opin Clin Nutr Metab Care. 2002;5:519-524.
Leiper J, Pitsiladis Y, Maughan RJ. Coparison of water turnover rates in men undertakingprolonged cycling exercise and sedentary men. Int J Sports Med. 2001;22:181-185.
Maron BJ, Shirani J, Poliac LC, Mathenge R, Roberts WC, Mueller FO. Sudden death in youngcompetitive athletes. Clinical, demographic, and pathological profiles. JAMA.1996;276(18):1472.
Maughan RJ, Shirreffs SM. Development of individual hydration strategies for athletes. Int JSport Nutr. 2008; 18: 457-472.
Montain SJ, Cheuvrant SN, Sawka MN. Exercise associated hyponatraemia: quantitativeanalysis to understand the aetiology. Brit J Sport Med. 2006;40:98-106.
Montain SJ, Laird JE, Latzka WA, Sawka MN. Aldosterone and vasopressin responses in theheat: hydration level and exercise intensity effects. Med Sci Sports Exerc. 1997;29:661-668.
Murray B. Hydration and physical performance. JAm Coil Nutr. 2007;26(5):542S-548S.
National Athletic Trainers' Association Position Statement: Fluid Replacement for Athletes. JAthl Training. 2000; 35(2): 212-224.
(2010). Retrieved from http://www.nba.com/
NCAA 2006-2007 Sports Medicine Handbook. Indianapolis, In: National Collegiate AthleticAssociation. www.ncaa.org. Accessed March 23, 2009.
(2010). Retrieved from http://v'!vlw.ncaa.org/
(2010). Retrieved from http://www.nfl.com/
68

Ormerod JK, Elliott TA, Scheett TP, VanHeest JL, Armstrong LE, Maresh CM. Drinkingbehavior and perception of thirst in untrained women during 6 weeks of heat acclimation andoutdoor training. Int J Sport Nutr Exerc Metab. 2003;13:15-28.
Osterberg KL, HOrswill CA, Baker LB. Pregame urine specific gravity and fluid intake byNational Baskteball Association players during competition. J Athl Training. 2009; 44(1): 5357.
Panel on Dietary Reference Intakes for Electrolytes and Water. Chapter 4, Water, In: DietaryReference Intakes (or Water. Potassiuml Sodium, Chloride, and Sulfate. Washington, D.C.:Institute of Medicine, National Academy Press, pp. 73-185,2005.
Passe DH: Physiological and psychological determinants of fluid intake. In Maughan RJ,Murray R (eds): "Sports Drinks: Basic Science and Practical Aspects," Boca Raton, Florida:eRC Press, pp 45-87,2001.
Popowski LA, Oppliger RA, Lambert GP, Johnson RF, Johnson AK, Gisolfi CV. Blood andurinary measures ofhydration during progressive acute dehydration. Med Sci Sports Exerc.2001;33:747-775
Position Statement: Exercise and Fluid Replacement. American College of Sports Medicine.Med Sci Sports Exerc. 2007; 39(2): 377-390.
Ray, ML, Bryan, MW, Ruden TM, Baier SM, Sharp RL, King, DS. Effect of sodium in arehydration beverage when consumed as a fluid or meal. J Appl Physiol. 85:1329-1336, 1998.
Rodahl, K. Occupational health conditions in extreme environments. Ann Occup Hyg. 47:241252,2003.
Sawka MN, Cheuvrant SN, Carter III, R. Human water needs. Nutrition Reviews.2005;63(6):S30-39.
Sawka MN, Coyle EF. Influence of body water and blood volume on thermoregulation andexercise performance in the heat. Exerc Sports Sci Rev. 1999;27:167-218.
Sawka MN and Montain SJ. Fluid and electrolyte supplementation for exercise heat stress. Am JClin Nutr. 2000; 72(2-Suppl): 564S-72S.
Sawka MN, Wenger CB, PandolfKB. Thermoregulatory responses to acute exercise-heat stressand heat acclimation. In: Handbook ofPhysiology, Section 4: Environmental Physiology, CMBlatteis and MJ Fregly. New York: Oxford University Press for the American PhysiologicalSociety, pp. 157-186,1996.
Seto CK. Environmental illness in athletes. Clin Sports Med 2005;24:695-718.
69

Shirreffs SM, Maughan RJ. Volume repletion after exercise-induced volume depletion inhumans: replacement of water and sodium losses. Am J Physiol. 274:F868-F875,1998.
Shirreffs SM, Ragon-Vargas LF, Chamorro M, Maughan RJ, Serratosa L, Zachwieja JJ. Thesweating response of elite professional soccer players to training in the heat. Int J Sports Med.26:90-95,2005.
Tsintzas K, Williams C. Human muscle glycogen metabolism during exercise: Effect ofcarbohydrate supplementation. Sports Med. 1998;1:7-23.
Volpe SL, Poule KA, Bland EG. Estimation of prepractice hydration status of NationalCollegiate Athletic Association division I athletes. J Athl Training. 2009;44(6):624-629.
Vrijens DM, Rehrer NJ. Sodium-free fluid ingestion decreases plasma sodium during exercise inthe heat. 1. Appl. Physiol. 1999;86:1847-1851.
Young AJ, Sawka MN, Epstein Y, Decristofano B, Pando1fKB. Cooling different body surfacesduring upper and lower body exercise. J Appl Physiol. 1987;63:1218-1223.
70

APPENDIX
Table 1: Race breakdown of football, men's basketball and women's basketball players
RaceAfrican
Bi-racial American Hispanic Caucasian Other TotalSport Football Count 3 42 1 11 1 58
% within 5.2% 72.4% 1.7% 19.0% 1.7% 100.0%Sport
% within 60.0% 49.4% 50.0% 40.7% 33.3% 47.5%Race%of Total 2.5% 34.4% .8% 9.0% .8% 47.5%
Men's Basketball Count 2 33 1 12 2 50% within 4.0% 66.0% 2.0% 24.0% 4.0% 100.0%Sport%within 40.0% 38.8% 50.0% 44.4% 66.7% 41.0%Race% of Total 1.6% 27.0% .8% 9.8% 1.6% 41.0%
Women's Basketball Count 0 10 0 4 0 14%within .0% 71.4% .0% 28.6% .0% 100.0%Sport% within .0% 11.8% .0% 14.8% .0% 11.5%Race% of Total .0% 8.2% .0% 3.3% .0% 11.5%
Total Count 5 85 2 27 3 122%within 4.1% 69.7% 1.6% 22.1% 2.5% 100.0%Sport% within 100.0% 100.0% 100.0% 100.0% 100.0% 100.0%Race% ofTotal 4.1% 69.7% 1.6% 22.1% 2.5% 100.0%
71

Table 2: Height and weight of football, men's basketball and women's basketball
players
N Minimum Maximum Mean Std. Deviation
Height (in) 122 6300 84.00 74.7664 4.37507
Height (em) 122 160.02 213.36 189.7817 11.10525
Weight (Ib) 121 130.00 330.00 220.3347 45.77442
Wei9ht (kg) 121 59.09 150.00 100.0465 20.86248
Valid N (Iistwise) 121
72

Table 3: Setting of competition between football, men's basketball and women'sbasketball players
Settino
Indoors Outdoors Both Total
Football Count 0 42 16 58
% within Sport .0% 72.4% 27.6% 100.0%
% within Setting .0% 100.0% 76.2% 47.5%
% ofTotal .0% 34.4% 13.1% 47.5%Men's Basketball Count 47 0 3 50
% within Sport 94.0% .0% 6.0% 100.0%% within Setting 79.7% .0% 14.3% 41.0%
% of Totai 38.5% .0% 2.5% 41.0%Women's Basketball Count 12 0 2 14
% within Sport 85.7% .0% 14.3% 100.0%% within Setting 20.3% .0% 9.5% 11.5%% of Total 9.8% .0% 1.6% 11.5%
Total Count 59 42 21 122% within Sport 48.4% 34.4% 17.2% 100.0%
% within Setting 100.0% 100.0% 100.0% 100.0%
% of Total 48.4% 34.4% 17.2% 100.0%
73

Table 4: Years played in college by football, men's basketball and women's basketball players
Years Pia' ed-Colle e
0 1 2 3 4 5 Total
Sport Football Count 1 13 15 14 15 0 58
% within Sport 1.7% 22.4% 25.9% 24.1% 25.9% .0% 100.0%
%within Years 25.0% 43.3% 51.7% 46.7% 53.6% .0% 47.5%Played-College% ofTotal .8% 10.7% 12.3% 11.5% 12.3% .0% 47.5%
Men's Counl 2 15 10 13 10 0 50Basketball % within Sport 4.0% 30.0% 20.0% 26.0% 20.0% .0% 100.0%
% within Years 50.0% 50.0% 34.5% 43.3% 35.7% .0% 41.0%Played-College
% ofTotal 1.6% 12.3% 8.2% 10.7% 8.2% .0% 41.0%
Women's Count 1 2 4 3 3 1 14Basketball % within Sport 7.1% 14.3% 28.6% 21.4% 21.4% 7.1% 100.0%
% within Years 25.0% 6.7% 13.8% 10.0% 10.7% 100.0% 11.5%Played-College%of Total .8% 1.6% 3.3% 2.5% 2.5% .8% 11.5%
Total Count 4 30 29 30 28 1 122
% within Sport 3.3% 24.6% 23.8% 24.6% 23.0% .8% 100.0%% within Years 100.0% 100.0% 100.0% 100.0% 100.0% 100.0% 100.0%Played-College% of Total 3.3% 24.6% 23.8% 24.6% 23.0% .8% 100.0%
74

Table 5: Years red shirted in college by football, men's basketball and women's basketball players
Years Redshirt-Colleqe
0 1 2 Total
Football Count 21 35 2 58% within Sport 36.2% 60.3% 3.4% 100.0%
% within Years Redshirt- 32.3% 71.4% 25.0% 47.5%College% of Total 17.2% 28.7% 1.6% 47.5%
Men's Basketball Count 33 11 6 50% within Sport 66.0% 22.0% 12.0% 100.0%
% withinYears Redshirt- 50.8% 22.4% 75.0% 41.0%College% of Total 27.0% 9.0% 4.9% 41.0%
Women's Basketball Count 11 3 0 14% within Sport 78.6% 21.4% .0% 100.0%% within Years Redshirt- 16.9% 6.1% .0% 11.5%College% of Total 9.0% 2.5% .0% 11.5%
Total Count 65 49 8 122% within Sport 53.3% 40.2% 6.6% 100.0%% within Years Redshirt- 100.0% 100.0% 100.0% 100.0%College% of Total 53.3% 40.2% 6.6% 100.0%
75
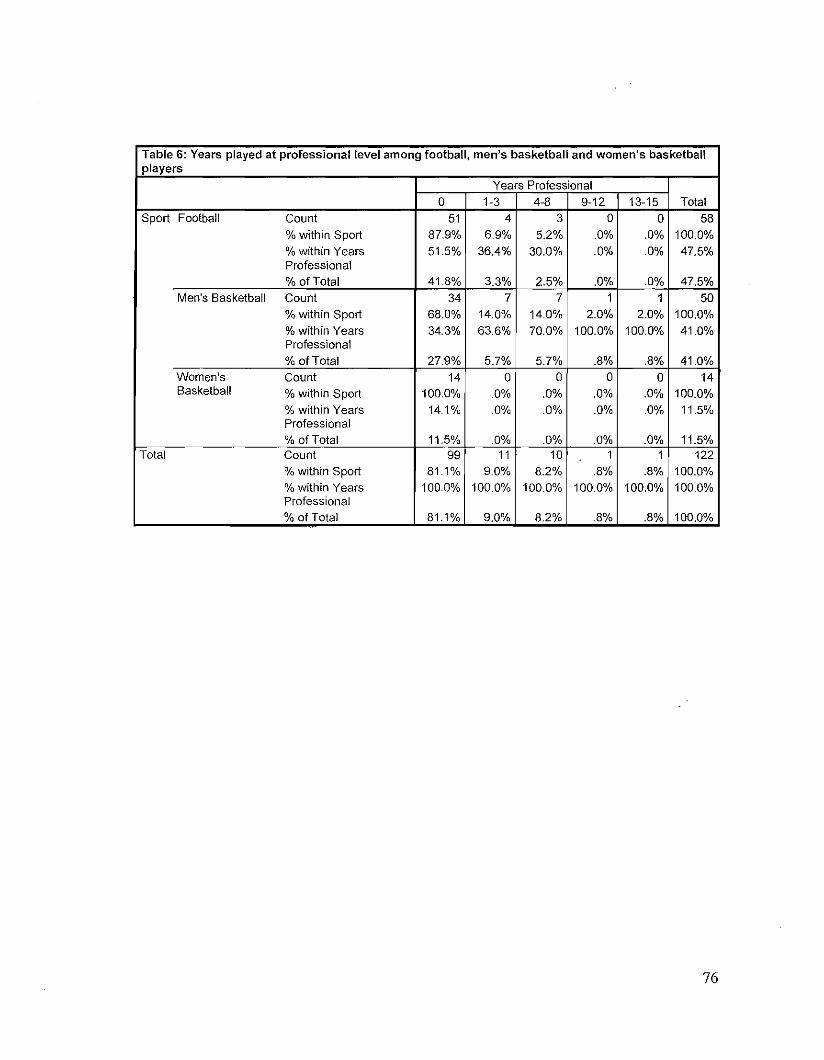
Table 6: Years played at professional level among football, men's basketball and women's basketballplayers
Years Professional0 1-3 4-8 9-12 13-15 Total
Sport Football Count 51 4 3 0 0 58%within Sport 87.9% 6.9% 5.2% .0% .0% 100.0%% within Years 51.5% 36.4% 30.0% .0% .0% 47.5%Professional% of Total 41.8% 3.3% 2.5% .0% .0% 47.5%
Men's Basketball Count 34 7 7 1 1 50%within Sport 68.0% 14.0% 14.0% 2.0% 2.0% 100.0%%within Years 34.3% 63.6% 70.0% 100.0% 100.0% 41.0%Professional% of Total 27.9% 5.7% 5.7% .8% .8% 41.0%
Women's Count 14 0 0 0 0 14Basketball % within Sport 100.0% .0% .0% .0% .0% 100.0%
%within Years 14.1% .0% .0% .0% .0% 11.5%Professional% of Total 11.5% .0% .0% .0% .0% 11.5%
Total Count 99 11 10 1 1 122% within Sport 81.1% 9.0% 8.2% .8% .8% 100.0%% within Years 100.0% 100.0% 100.0% 100.0% 100.0% 100.0%Professional
% of Total 81.1% 9.0% 8.2% .8% .8% 100.0%
76

Table 7: Minutes available at halftime for beverages and snacks among football, men's basketball, andwomen's basketball players
Minutes for Snack/BeY
0 0-5 6-10 11-15 16-20 Total
Sport Football Count 0 2 19 20 17 58
% within Sport .0% 3.4% 32.8% 34.5% 29.3% 100.0%
% within Minutesfor .0% 15.4% 39.6% 51.3% 81.0% 47.5%Snack/Bev
% ofTotal .0% 1.6% 15.6% 16.4% 13.9% 47.5%
Men's Basketball Count 0 8 25 15 2 50
% within Sport .0% 16.0% 50.0% 30.0% 4.0% 100.0%
% within Minutesfor .0% 61.5% 52.1% 38.5% 9.5% 41.0%Snack/Bev
% ofTotal .0% 6.6% 20.5% 12.3% 1.6% 41.0%
Women's Count 1 3 4 4 2 14Basketball % within Sport 7.1% 21.4% 28.6% 28.6% 14.3% 100.0%
%within Minutesfor 100.0% 23.1% 8.3% 10.3% 9.5% 11.5%Snack/Bev
% of Total .8% 2.5% 3.3% 3.3% 1.6% 11.5%Total Count 1 13 48 39 21 122
% within Sport .8% 10.7% 39.3% 32.0% 17.2% 100.0%
% within Minutesfor 100.0% 100.0% 100.0% 100.0% 100.0% 100.0%Snack/Bev
% afTotal .8% 10.7% 39.3% 32.0% 17.2% 100.0%
77

Table 8: Comparison of XS consumption between football, men's basketballand women's basketball
XS
0 1-2 Cups Total
FootballCount 58 0 58
% within Sport 100.0% .0% 100.0%
% within Excess 48.7% .0% 47.5%
% of Total 47.5% .0% 47.5%
Men's BasketballCount 47 3 50
% within Sport 94.0% 6.0% 100.0%
% within Excess 39.5% 100.0% 41.0%
% olTotal 38.5% 2.5% 41.0%
Women's BasketballCount 14 0 14
% within Sport 100.0% .0% 100.0%
% within Excess 11.8% .0% 11.5%
% of Total 11.5% .0% 11.5%
TotalCount 119 3 122
% within Sport 97.5% 2.5% 100.0%% within Excess 100.0% 100.0% 100.0%% of Total 97.5% 2.5% 100.0%
Pearson Chi Square: .109
78

Table 9: Comparison of FRS Energy Drink consumption between football, men'sbasketball and women's basketball
FRS Energy Drink0 1-2 Cups Total
Football Count 58 0 58% within Sport 100.0% .0% 100.0%% within FRS Energy Drink 47.9% .0% 47.5%% ofTotal 47.5% .0% 47.5%
Men's Basketball Count 49 1 50% within Sport 98.0% 2.0% 100.0%% within FRS Energy Drink 40.5% 100.0% 41.0%% ofTotal 40.2% .8% 41.0%
Women's Basketball Count 14 0 14% within Sport 100.0% .0% 100.0%% within FRS Energy Drink 11.6% .0% 11.5%% ofTotal 11.5% .0% 11.5%
Total Count 121 1 122% within Sport 99.2% .8% 100.0%% within FRS Energy Drink 100.0% 100.0% 100.0%% ofTotal 99.2% .8% 100.0%
Pearson Chi Square: .484
79

lTable 10: Comparison of fruit juice consumption between football, men's basketball and women'sbasketball
Fruit Juice
0 1/2 CuP 1-2 Cups 3-4 Cups TotalFootball Count 56 1 1 0 58
% within Sport 96.6% 1.7% 1.7% .0% 100.0%%within FruitJuice 48.7% 33.3% 33.3% .0% 475%
% ofTotal 45.9% .8% .8% .0% 47.5%Men's Basketball Count 46 2 2 0 50
% within Sport 92.0% 4.0% 4.0% .0% 100.0%
% within FruitJuice 40.0% 66.7% 66.7% .0% 41.0%% of Total 37.7% 1.6% 1.6% .0% 41.0%
Women's Basketball Count 13 0 0 1 14% within Sport 92.9% .0% .0% 7.1% 100.0%
%within FruitJuice 11.3% .0% .0% 100.0% 11.5%% of Total 10.7% .0% .0% .8% 11.5%
Total Count 115 3 3 1 122% within Sport 94.3% 2.5% 2.5% .8% 100.0%%within FruitJuice 100.0% 100.0% 100.0% 100.0% 100.0%% of Total 94.3% 2.5% 2.5% .8% 100.0%
Pearson Chi Square: .139
80

Table 11: Comparison of Gatorade consumption between football, men's basketball and women'sbasketball
Gatorade
0 1/2 Cup 1-2 Cups 3-4 Cups > 4 Cups Total
Sport Football Count 15 3 31 9 0 58% within Sport 25.9% 5.2% 53.4% 15.5% .0% 100.0%
% within Gatorade 45.5% 50.0% 50.8% 52.9% .0% 47.5%
% otTotal 12.3% 2.5% 25.4% 7.4% .0% 47.5%
Men's Basketball Count 11 1 26 7 5 50
% within Sport 22.0% 2.0% 52.0% 14.0% 10.0% 100.0%
% within Gatorade 33.3% 16.7% 42.6% 41.2% 100.0% 41.0%
% otTotal 9.0% .8% 21.3% 5.7% 4.1% 41.0%Women's Basketball Count 7 2 4 1 0 14
% within Sport 50.0% 14.3% 28.6% 7.1% .0% 100.0%
% within Gatorade 21.2% 33.3% 6.6% 5.9% .0% 11.5%
% of Total 5.7% 1.6% 3.3% .8% .0% 11.5%Total Count 33 6 61 17 5 122
%within Sport 27.0% 4.9% 50.0% 13.9% 4.1% 100.0%
% within Gatorade 100.0% 100.0% 100.0% 100.0% 100.0% 100.0%% of Total 27.0% 4.9% 50.0% 13.9% 4.1% 100.0%
Pearson Chi Square: .045
81

Table 12: Comparison of Gatorlode consumption between football, men's basketball andwomen's basketball
Gatorlode0 1-2 Cups 3-4 Cups Total
Football Count 55 3 0 58% within Sport 94.8% 5.2% .0% 100.0%%within Gatorload 47.0% 100.0% .0% 47.5%% of Total 45.1% 2.5% .0% 47.5%
Men's Basketball Count 48 0 2 50% within Sport 96.0% .0% 4.0% 100.0%% within Gatorload 41.0% .0% 100.0% 41.0%% of Total 39.3% .0% 1.6% 41.0%
Women's Basketball Count 14 0 0 14% within Sport 100.0% .0% .0% 100.0%% within Gatorload 12.0% .0% .0% 11.5%% of Total 11.5% .0% .0% 11.5%
Total Count 117 3 2 122% within Sport 95.9% 2.5% 1.6% 100.0%% within Gatorload 100.0% 100.0% 100.0% 100.0%%of Total 95.9% 2.5% 1.6% 100.0%
Pearson Chi Square: .183
82

Table 13: Comparison of Hydrate consumption between football, men's basketball and women'sbasketball
Hvdrate0 1-2 Cups 3-4 Cups > 4 Cups Total
Football Count 54 2 1 1 58%within Sport 93.1% 3.4% 1.7% 1.7% 100.0%% within Hydrate 47.0% 40.0% 100.0% 100.0% 47.5%% of Total 44.3% 1.6% .8% .8% 47.5%
Men's Basketball Count 47 3 0 0 50% within Sport 94.0% 6.0% .0% .0% 100.0%%within Hydrate 40.9% 60.0% .0% .0% 41.0%% of Total 38.5% 2.5% .0% .0% 41.0%
Women's Basketball Count 14 0 0 0 14% within Sport 100.0% .0% .0% .0% 100.0%% within Hydrate 12.2% .0% .0% .0% 11.5%% oITotal 11.5% .0% .0% .0% 11.5%
Total Count 115 5 1 1 122%within Sport 94.3% 4.1% .8% .8% 100.0%% within Hydrate 100.0% 100.0% 100.0% 100.0% 100.0%% oITotal 94.3% 4.1% .8% .8% 100.0%
Pearson Chi Square: .765
83
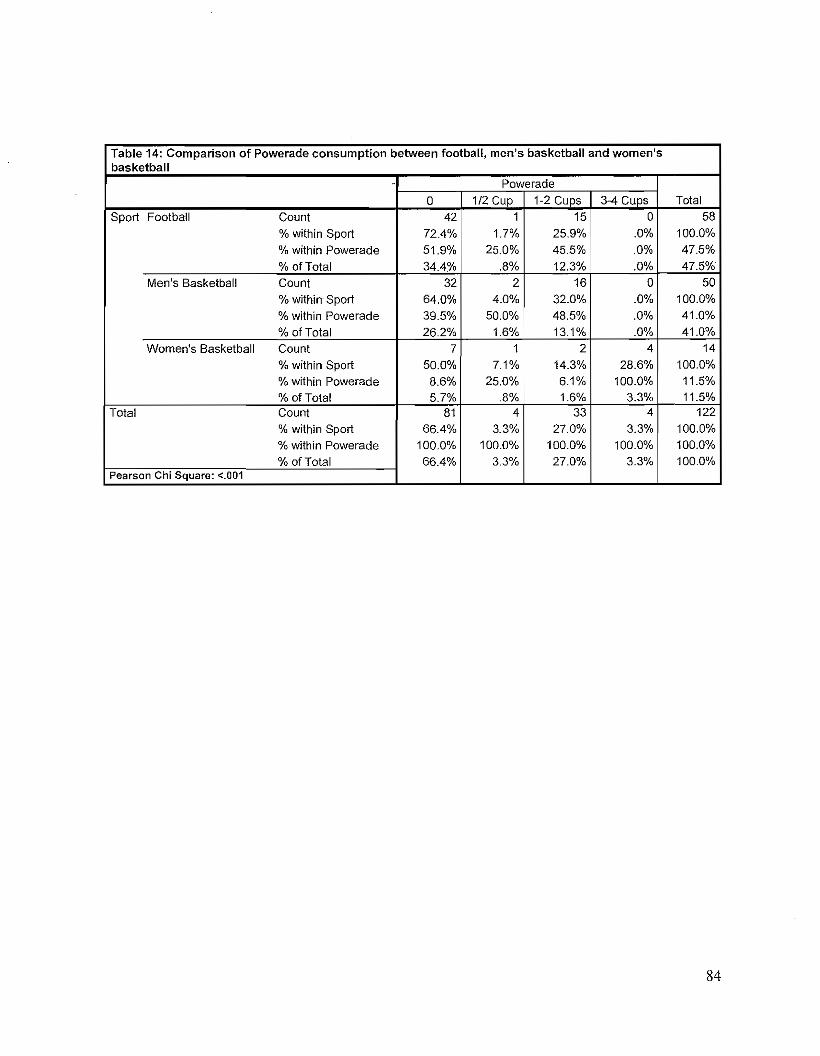
Table 14: Comparison of Powerade consumption between football, men's basketball and women'sbasketball
Powerade
0 1/2 Cup 1-2 Cups 3-4 Cups TotalSport Football Count 42 1 15 0 58
% within Sport 72.4% 1.7% 25.9% .0% 100.0%
% within Powerade 51.9% 25.0% 45.5% .0% 47.5%
% oITotal 34.4% .8% 12.3% .0% 47.5%Men's Basketball Count 32 2 16 0 50
% within Sport 64.0% 4.0% 32.0% .0% 100.0%%within Powerade 39.5% 50.0% 48.5% .0% 41.0%
% oITotal 26.2% 1.6% 13.1% .0% 41.0%Women's Basketball Count 7 1 2 4 14
% within Sport 50.0% 7.1% 14.3% 28.6% 100.0%% within Powerade 8.6% 25.0% 6.1% 100.0% 11.5%% oITotal 5.7% .8% 1.6% 3.3% 11.5%
Total Count 81 4 33 4 122
%within Sport 66.4% 3.3% 27.0% 3.3% 100.0%%within Powerade 100.0% 100.0% 100.0% 100.0% 100.0%% of Total 66.4% 3.3% 27.0% 3.3% 100.0%
Pearson Chi Square: <.001
84

•Table 15: Comparison of Powerade Zero consumption between football, men'sbasketball and women's basketball
Powerade Zero0 1-2 Cups Total
Football Count 58 0 58% within Sport 100.0% .0% 100.0%
% within PoweradeZero 47.9% .0% 47.5%% olTotal 47.5% .0% 47.5%
Men's Basketball Count 50 0 50% within Sport 100.0% .0% 100.0%% within PoweradeZero 41.3% .0% 41.0%% of Total 41.0% .0% 41.0%
Women's Basketball Count 13 1 14% within Sport 92.9% 7.1% 100.0%% within PoweradeZero 10.7% 100.0% 11.5%% of Total 10.7% .8% 11.5%
Total Count 121 1 122% within Sport 99.2% .8% 100.0%% within PoweradeZero 100.0% 100.0% 100.0%% of Total 99.2% .8% 100.0%
Pearson Chi Square: .020
85
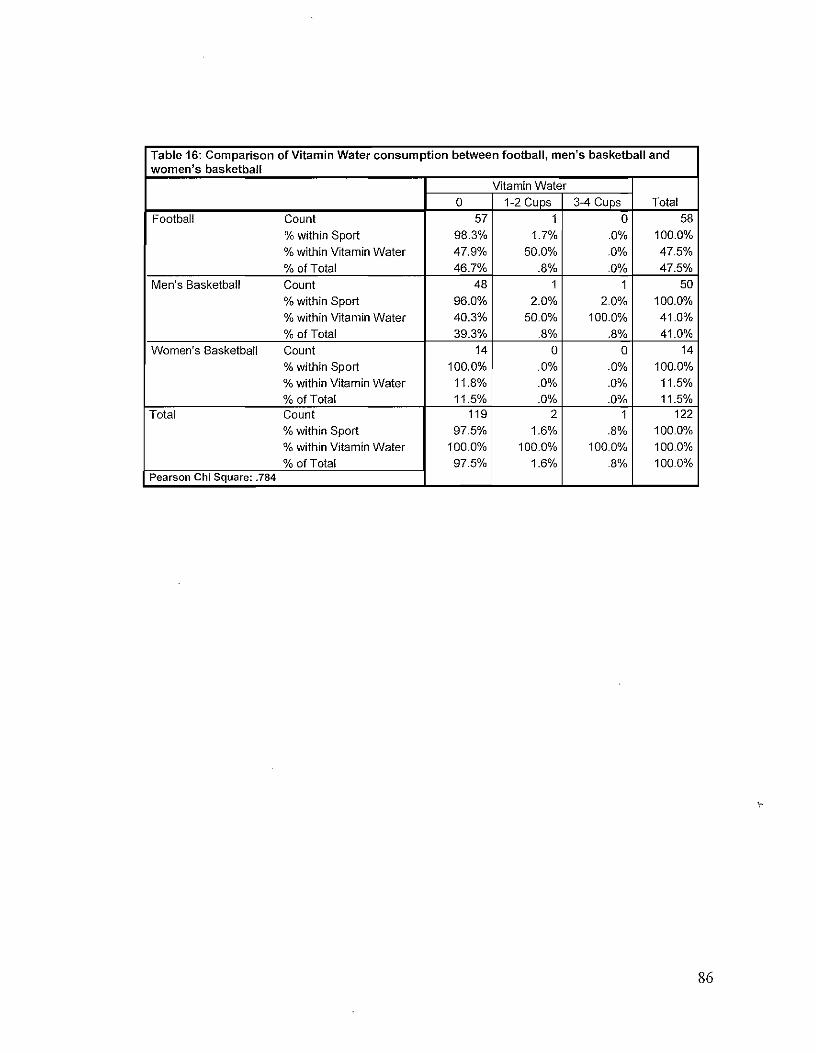
Table 16: Comparison of Vitamin Water consumption between football, men's basketball andwomen's basketball
Vitamin Water0 1-2 Cups 3-4 Cups Tolal
Football Counl 57 1 0 58% within Sport 98.3% 1.7% .0% 100.0%%within VitaminWater 47.9% 50.0% .0% 47.5%% of Total 46.7% .8% .0% 47.5%
Men's Basketball Count 48 1 1 50% within Sport 96.0% 2.0% 2.0% 100.0%% within VitaminWater 40.3% 50.0% 100.0% 41.0%% of Total 39.3% .8% .8% 41.0%
Women's Basketball Count 14 0 0 14% within Sport 100.0% .0% .0% 100.0%% within VitaminWater 11.8% .0% .0% 11.5%% of Totai 11.5% .0% .0% 11.5%
Total Count 119 2 1 122%within Sport 97.5% 1.6% .8% 100.0%% within VitaminWater 100.0% 100.0% 100.0% 100.0%% of Total 97.5% 1.6% .8% 100.0%
Pearson Chi Square: .784
86

Table 17: Comparison of water consumption between football, men's basketball and women's basketball
Water0 1/2 Cup 1-2 Cups 3-4 Cups > 4 Cups Total
Sport Football Count 16 5 28 8 1 58% within Sport 27.6% 8.6% 48.3% 13.8% 1.7% 100.0%% within Water 61.5% 41.7% 47.5% 42.1% 16.7% 47.5%% of Total 13.1% 4.1% 23.0% 6.6% .8% 47.5%
Men's Basketball Count 8 3 27 7 5 50% within Sport 16.0% 6.0% 54.0% 14.0% 10.0% 100.0%%within Water 30.8% 25.0% 45.8% 36.8% 83.3% 41.0%% ofTotal 6.6% 2.5% 22.1% 5.7% 4.1% 41.0%
Women's Basketball Count 2 4 4 4 0 14% within Sport 14.3% 28.6% 28.6% 28.6% .0% 100.0%%within Water 7.7% 33.3% 6.8% 21.1% .0% 11.5%% ofTotal 1.6% 3.3% 3.3% 3.3% .0% 11.5%
Total Count 26 12 59 19 6 122% within Sport 21.3% 9.8% 48.4% 15.6% 4.9% 100.0%% within Water 100.0% 100.0% 100.0% 100.0% 100.0% 100.0%% of Total 21.3% 9.8% 48.4% 15.6% 4.9% 100.0%
Pearson Chi Square: .049
87

Table 18: Comparison of other beverage consumption between football, men's basketball and women'sbasketball
Other Beveraae0 1/2 Cup 1-2 Cups > 4 Cups Total
Sport Football Count 53 2 3 0 58% within Sport 91.4% 3.4% 5.2% .0% 100.0%% within Other Beverage 45.7% 100.0% 100.0% .0% 47.5%% of Total 43.4% 1.6% 2.5% .0% 47.5%
Men's Basketball Count 49 0 0 1 50% within Sport 98.0% .0% .0% 2.0% 100.0%% within Other Beverage 42.2% .0% .0% 100.0% 41.0%% of Total 40.2% .0% .0% .8% 41.0%
Women's Basketball Count 14 0 0 0 14% within Sport 100.0% .0% .0% .0% 100.0%%within Other Beverage 12.1% .0% .0% .0% 11.5%% of Total 11.5% .0% .0% .0% 11.5%
Total Count 116 2 3 1 122% within Sport 95.1% 1.6% 2.5% .8% 100.0%% within Other Beverage 100.0% 100.0% 100.0% 100.0% 100.0%% of Total 95.1% 1.6% 2.5% .8% 100.0%
Pearson Chi Square: .310
88

Table 19: Comparison of canned fruit consumption between football, men's basketball and women'sbasketball
Canned Fruit0 1/2 Can 1 Can > 1.5 Can Total
Sport Football Count 56 1 1 0 58% within Sport 96.6% 1.7% 1.7% .0% 100.0%% within Canned Fruit 48.7% 25.0% 50.0% .0% 47.5%% of Total 45.9% .8% .8% .0% 47.5%
Men's Basketball Count 46 2 1 1 50% within Sport 92.0% 4.0% 2.0% 2.0% 100.0%% within Canned Fruit 40.0% 50.0% 50.0% 100.0% 41.0%% ofTotal 37.7% 1.6% .8% .8% 41.0%
Women's Basketball Count 13 1 0 0 14% within Sport 92.9% 7.1% .0% .0% 100.0%% within Canned Fruit 11.3% 25.0% .0% .0% 11.5%% of Total 10.7% .8% .0% .0% 11.5%
Total Count 115 4 2 1 122% within Sport 94.3% 3.3% 1.6% .8% 100.0%% within Canned Fruit 100.0% 100.0% 100.0% 100.0% 100.0%% of Totai 94.3% 3.3% 1.6% .8% 100.0%
Pearson Chi Square: .819
89

Table 20: Comparison of crackers, pretzels, or saltine consumption between football, men'sbasketball and women's basketball
Crackers, pretzels, saltines
0 1/2 Cup TotalFootball Count 56 2 58
% within Sport 96.6% 3.4% 100.0%% within Crackers, pretzels, 49.6% 22.2% 47.5%saltines% of Total 45.9% 1.6% 47.5%
Men's Basketball Count 44 6 50
% within Sport 88.0% 12.0% 100.0%% within Crackers, pretzels, 38.9% 66.7% 41.0%saltines
% of Total 36.1% 4.9% 41.0%Women's Basketball Count 13 1 14
% within Sport 92.9% 7.1% 100.0%% within Crackers, pretzels, 11.5% 11.1% 11.5%saltines
% of Total 10.7% .8% 11.5%Total Count 113 9 122
% within Sport 92.6% 7.4% 100.0%% within Crackers, pretzels, 100.0% 100.0% 100.0%saltines
% of Total 92.6% 7.4% 100.0%Pearson Chi Square: .237
90

Table 21: Comparison of energy bar consumption between football, men's basketball and women'sbasketball
Energy Bar
0 1/2 Bar 1 Bar 1.5 Bar > 1.5 Bars TotalSport Football Count 13 15 26 3 1 58
% within Sport 22.4% 25.9% 44.8% 5.2% 1.7% 100.0%
• % within Energy 21.7% 71.4% 72.2% 75.0% 100.0% 47.5%Bar% ofTotal 10.7% 12.3% 21.3% 2.5% .8% 47.5%
Men's Basketball Count 35 5 9 1 0 50% within Sport 70.0% 10.0% 18.0% 2.0% .0% 100.0%% within Energy 58.3% 23.8% 25.0% 25.0% .0% 41.0%Bar% of Total 28.7% 4.1% 7.4% .8% .0% 41.0%
Women's Basketball Count 12 1 1 0 0 14% within Sport 85.7% 7.1% 7.1% .0% .0% 100.0%% within Energy 20.0% 4.8% 2.8% .0% .0% 11.5%Bar% ofTotal 9.8% .8% .8% .0% .0% 11.5%
Total Count 60 21 36 4 1 122% within Sport 49.2% 17.2% 29.5% 3.3% .8% 100.0%% within Energy 100.0% 100.0% 100.0% 100.0% 100.0% 100.0%Bar% of Total 49.2% 17.2% 29.5% 3.3% .8% 100.0%
Pearson Chi Square: <.001
91

Table 22: Comparison of energy gel consumption between football, men's basketball andwomen's basketball
Enerqv qel
0 1/2 Pack 1 Pack TolalFootball Count 57 0 1 58
% within Sport 98.3% .0% 1.7% 100.0%% within Energy gel 47.5% .0% 100.0% 47.5%% of Total 46.7% .0% .8% 47.5%
Men's Basketball Counl 49 1 0 50% within Sport 98.0% 2.0% .0% 100.0%% within Energy gel 40.8% 100.0% .0% 41.0%% ofTotal 40.2% .8% .0% 410%
Women's Basketball Count 14 0 0 14% within Sport 100.0% .0% .0% 100.0%% within Energy gel 11.7% .0% .0% 11.5%% of Total 11.5% .0% .0% 11.5%
Total Count 120 1 1 122% within Sport 98.4% .8% .8% 100.0%% within Energy gel 100.0% 100.0% 100.0% 100.0%% of Total 98.4% .8% .8% 100.0%
Pearson Chi Square: .636
92

Table 23: Comparison of fresh fruit consumption between football, men's basketball and women'sbasketball
Fresh fruit
0 112 Fruit 1 Fruit 1.5 Fruits > 1.5 Fruits TotaiSport Football Count 33 7 12 4 2 58
% within Sport 56.9% 12.1% 20.7% 6.9% 3.4% 100.0%
% within Fresh 40.7% 38.9% 85.7% 66.7% 66.7% 47.5%fruit% ofTotal 27.0% 5.7% 9.8% 3.3% 1.6% 47.5%
Men's Basketball Count 35 11 1 2 1 50% within Sport 70.0% 22.0% 2.0% 4.0% 2.0% 100.0%%within Fresh 43.2% 61.1% 7.1% 33.3% 33.3% 41.0%fruit
% ofTotal 28.7% 9.0% .8% 1.6% .8% 41.0%Women's Basketball Count 13 0 1 0 0 14
% within Sport 92.9% .0% 7.1% .0% .0% 100.0%% within Fresh 16.0% .0% 7.1% .0% .0% 11.5%fruit% ofTotal 10.7% .0% .8% .0% .0% 11.5%
Total Count 81 18 14 6 3 122% within Sport 66.4% 14.8% 11.5% 4.9% 2.5% 100.0%% within Fresh 100.0% 100.0% 100.0% 100.0% 100.0% 100.0%fruit% of Total 66.4% 14.8% 11.5% 4.9% 2.5% 100.0%
Pearson Chi Square: .033
93

Table 24: Comparison of peanut butter consumption between football, men's basketball andwomen's basketball
Peanul butter0 1/2 Tbsp 1 Tbsp Total
Football Count 57 0 1 58
% within Sport 98.3% .0% 1.7% 100.0%
%within Peanutbutter 49.1% .0% 100.0% 47.5%% of Total 46.7% .0% .8% 47.5%
Men's Basketball Count 45 5 0 50% within Sport 90.0% 10.0% .0% 100.0%% within Peanut butter 38.8% 100.0% .0% 41.0%% of Total 36.9% 4.1% .0% 41.0%
Women's Basketball Count 14 0 0 14% within Sport 100.0% .0% .0% 100.0%%within Peanut butter 12.1% .0% .0% 11.5%% of Total 11.5% .0% .0% 11.5%
Total Count 116 5 1 122%within Sport 95.1% 4.1% .8% 100.0%% within Peanut butter 100.0% 100.0% 100.0% 100.0%% of Total 95.1% 4.1% .8% 100.0%
Pearson Chi Square: .074
94

Table 25: Comparison of salt free pretzel consumption between football, men'sbasketball and women's basketball
Salt free pretzels0 1/2 CuP Total
Football Count 58 0 58% within Sport 100.0% .0% 100.0%% within Salt free pretzels 47.9% .0% 47.5%% 01 Total 47.5% .0% 47.5%
Men's Basketball Count 49 1 50% within Sport 98.0% 2.0% 100.0%% within Salt Iree pretzels 40.5% 100.0% 41.0%% 01Total 40.2% .8% 41.0%
Women's Basketball Count 14 0 14% within Sport 100.0% .0% 100.0%% within Salt Iree pretzets 11.6% .0% 11.5%% 01 Total 11.5% .0% 11.5%
Total Count 121 1 122% within Sport 99.2% .8% 100.0%%within Salt free pretzels 100.0% 100.0% 100.0%%of Total 99.2% .8% 100.0%
Pearson Chi Square: .484
95

Table 26: Comparison of other snack consumption between football, men's basketball and women'sbasketball
Other snack0 1 1.5 >1.5 Total
Sport Football Count 57 0 1 0 58
% within Sport 98.3% .0% 1.7% .0% 100.0%
% within Other snack 47.9% .0% 100.0% .0% 47.5%
% of Total 46.7% .0% .8% .0% 47.5%Men's Basketball Count 49 0 0 1 50
% within Sport 98.0% .0% .0% 2.0% 100.0%
% within Other snack 41.2% .0% .0% 100.0% 41.0%
%of Total 40.2% .0% .0% .8% 41.0%Women's Basketball Count 13 1 0 0 14
% within Sport 92.9% 7.1% .0% .0% 100.0%% within Other snack 10.9% 100.0% .0% .0% 11.5%% of Total 10.7% .8% .0% .0% 11.5%
Total Count 119 1 1 1 122
%within Sport 97.5% .8% .8% .8% 100.0%
% within Other snack 100.0% 100.0% 100.0% 100.0% 100.0%% of Total 97.5% .8% .8% .8% 100.0%
Pearson Chi Square: .113
96

Table 27: Comparison of drink purchase by athlete or team between football, men's basketball andwomen's basketball
Purchased by YoufTeam
Purchased by Purchased by.00 athlete team Total
Sport Football Count 2 1 55 58% within Sport 3.4% 1.7% 94.8% 100.0%% within Purchased by 28.6% 33.3% 49.1% 47.5%You/Team% ofTotal 1.6% .8% 45.1% 47.5%
Men's Basketball Count 4 2 44 50%within Sport 8.0% 4.0% 88.0% 100.0%% within Purchased by 57.1% 66.7% 39.3% 41.0%YoufTeam% of Total 3.3% 1.6% 36.1% 41.0%
Women's Basketball Count 1 0 13 14% within Sport 7.1% .0% 92.9% 100.0%%within Purchased by 14.3% .0% 11.6% 11.5%You/Team% of Total .8% .0% 10.7% 11.5%
Total Count 7 3 112 122% within Sport 5.7% 2.5% 91.8% 100.0%% within Purchased by 100.0% 100.0% 100.0% 100.0%You/Team% ofTotal 5.7% 2.5% 91.8% 100.0%
Pearson Chi Square: .714
97

Table 28: Comparison of frequency of halftime hydration habits between football, men's basketball andwomen's basketball
Halftime HvdrationSometimes Sometimes
.00 Never never Sometimes alwavs Alwavs TotalSport Football Count 0 0 2 20 20 16 58
% within Sport .0% .0% 3.4% 34.5% 34.5% 27.6% 100.0%% within .0% .0% 28.6% 47.6% 54.1% 47.1% 47.5%HalftimeHydration% ofTotal .0% .0% 1.6% 16.4% 16.4% 13.1% 47.5%
Men's Count 1 0 3 19 12 15 50Basketball %within Sport 2.0% .0% 6.0% 38.0% 24.0% 30.0% 100.0%
%within 100.0% .0% 42.9% 45.2% 32.4% 44.1% 41.0%HalftimeHydration% ofTotal .8% .0% 2.5% 15.6% 9.8% 12.3% 41.0%
Women's Count 0 1 2 3 5 3 14Basketball % within Sport .0% 7.1% 14.3% 21.4% 35.7% 21.4% 100.0%
% within .0% 100.0% 28.6% 7.1% 13.5% 8.8% 11.5%HalftimeHydration% ofTotal .0% .8% 1.6% 2.5% 4.1% 2.5% 11.5%
Total Count 1 1 7 42 37 34 122% within Sport .8% .8% 5.7% 34.4% 30.3% 27.9% 100.0%% within 100.0% 100.0% 100.0% 100.0% 100.0% 100.0% 100.0%HalftimeHydration% of Total .8% .8% 5.7% 34.4% 30.3% 27.9% 100.0%
Pearson Chi Square: .184
98

Table 29: Comparison of influences that determine halftime hydration habits between football, men'sbasketball and women's basketball
Hydration InfluenceDifficulty
of Team Time.00 Availability Game Requirement Temperature Plavinc Total
Sport Football Count 14 4 7 0 16 17 58% within Sport 24.1% 6.9% 12.1% .0% 27.6% 29.3% 100.0%% within 45.2% 33.3% 46.7% .0% 76.2% 41.5% 47.5%HydrationInfluence% ofTotal 11.5% 3.3% 5.7% .0% 13.1% 13.9% 47.5%
Men's Count 13 8 7 2 2 18 50Basketball % within Sport 26.0% 16.0% 14.0% 4.0% 4.0% 36.0% 100.0%
%within 41.9% 66.7% 46.7% 100.0% 9.5% 43.9% 41.0%HydrationInfluence% ofTotal 10.7% 6.6% 5.7% 1.6% 1.6% 14.8% 41.0%
Women's Count 4 0 1 0 3 6 14Basketball % within Sport 28.6% .0% 7.1% .0% 21.4% 42.9% 100.0%
% within 12.9% .0% 6.7% .0% 14.3% 14.6% 11.5%HydrationInfluence% of Total 3.3% .0% .8% .0% 2.5% 4.9% 11.5%
Total Count 31 12 15 2 21 41 122% within Sport 25.4% 9.8% 12.3% 1.6% 17.2% 33.6% 100.0%% within 100.0% 100.0% 100.0% 100.0% 100.0% 100.0% 100.0%HydrationInfluence% ofTotal 25.4% 9.8% 12.3% 1.6% 17.2% 33.6% 100.0%
Pearson Chi Square: .078
99

Table 30: Comparison of snack purchase by athlete or team between football, men's basketball andwomen's basketball
Purchased by You/Team
Purchased by Purchased by.00 athlete team Total
Sport Football Count 5 2 51 58
% within Sport 8.6% 3.4% 87.9% 100.0%
% within Purchased by 22.7% 28.6% 54.8% 47.5%YoufTeam
% ofTolal 4.1% 1.6% 41.8% 47.5%Men's Basketball Count 10 4 36 50
%within Sport 20.0% 8.0% 72.0% 100.0%
% within Purchased by 45.5% 57.1% 38.7% 41.0%You/Team
% ofTotal 8.2% 3.3% 29.5% 41.0%Women's Basketball Count 7 1 6 14
% within Sport 50.0% 7.1% 42.9% 100.0%
% within Purchased by 31.8% 14.3% 6.5% 11.5%You/Team
% of Total 5.7% .8% 4.9% 11.5%Total Count 22 7 93 122
% within Sport 18.0% 5.7% 76.2% 100.0%% within Purchased by 100.0% 100.0% 100.0% 100.0%YoufTeam% of Totat 18.0% 5.7% 76.2% 100.0%
Pearson Chi Square: .004
100

Table 31: Comparison of frequency of halftime snacking habits between football, men's basketball andwomen's basketball
Halftime Snack
Sometimes Sometimes0 Never never Sometimes alwavs Alwavs Total
Sport Football Count 1 4 7 24 11 11 58
% within Sport 1.7% 6.9% 12.1% 41.4% 19.0% 19.0% 100.0%
% within 12.5% 21.1% 35.0% 52.2% 84.6% 68.8% 47.5%Halftime Snack% of Total .8% 3.3% 5.7% 19.7% 9.0% 9.0% 47.5%
Men's Count 2 13 10 21 1 3 50Basketball % within Sport 4.0% 26.0% 20.0% 42.0% 2.0% 6.0% 100.0%
% within 25.0% 68.4% 50.0% 45.7% 7.7% 18.8% 41.0%Halftime Snack% of Total 1.6% 10.7% 8.2% 17.2% .8% 2.5% 41.0%
Women's Count 5 2 3 1 1 2 14Basketball % within Sport 35.7% 14.3% 21.4% 7.1% 7.1% 14.3% 100.0%
% within 62.5% 10.5% 15.0% 2.2% 7.7% 12.5% 11.5%Halftime Snack% of Total 4.1% 1.6% 2.5% .8% .8% 1.6% 11.5%
Total Count 8 19 20 46 13 16 122% within Sport 6.6% 15.6% 16.4% 37.7% 10.7% 13.1% 100.0%
% within 100.0% 100.0% 100.0% 100.0% 100.0% 100.0% 100.0%Halftime Snack% of Total 6.6% 15.6% 16.4% 37.7% 10.7% 13.1% 100.0%
Pearson Chi Square: <.001
101

Table 32: Comparison of influences that determine halftime snacking habits between football, men'sbasketball and women's basketball
Snack InfluenceDifficulty
of Team Time0 Availabilitv Game Reauirement Temperature Plavina Total
Sport Football Count 11 9 11 1 4 22 58% within Sport 19.0% 15.5% 19.0% 1.7% 6.9% 37.9% 100.0%% within 32.4% 31.0% 84.6% 50.0% 80.0% 56.4% 47.5%SnackInfluence
% ofTotal 9.0% 7.4% 9.0% .8% 3.3% 18.0% 47.5%Men's Count 16 14 1 1 1 17 50Basketball % within Sport 32.0% 28.0% 2.0% 2.0% 2.0% 34.0% 100.0%
% within 47.1% 48.3% 7.7% 50.0% 20.0% 43.6% 41.0%SnackInfluence
% ofTotal 13.1% 11.5% .8% .8% .8% 13.9% 41.0%Women's Count 7 6 1 0 0 0 14Basketball % within Sport 50.0% 42.9% 7.1% .0% .0% .0% 100.0%
% within 20.6% 20.7% 7.7% .0% .0% .0% 11.5%SnackInfluence% of Total 5.7% 4.9% .8% .0% .0% .0% 11.5%
Total Count 34 29 13 2 5 39 122% within Sport 27.9% 23.8% 10.7% 1.6% 4.1% 32.0% 100.0%% within 100.0% 100.0% 100.0% 100.0% 100.0% 100.0% 100.0%SnackInfluence% of Total 27.9% 23.8% 10.7% 1.6% 4.1% 32.0% 100.0%
Pearson Chi Square: .008
102

Table 33: Team halftime hydration recommendations among football, men's basketball and women'sbasketball players
Team Recommend HydrationSometimes Sometimes
0 Never Never Sometimes Aiways Always TotalSport Football Count 1 0 0 0 3 54 58
% within Sport 1.7% .0% .0% .0% 5.2% 93.1% 100.0%% within Team 100.0% .0% .0% .0% 13.0% 63.5% 47.5%RecommendHydration% of Total .8% .0% .0% .0% 2.5% 44.3% 47.5%
Men's Count 0 2 4 4 14 26 50Basketball %within Sport .0% 4.0% 8.0% 8.0% 28.0% 52.0% 100.0%
%within Team .0% 100.0% 100.0% 57.1% 60.9% 30.6% 41.0%RecommendHydration
% ofTotal .0% 1.6% 3.3% 3.3% 11.5% 21.3% 41.0%Women's Count 0 0 0 3 6 5 14Basketball % within Sport .0% .0% .0% 21.4% 42.9% 35.7% 100.0%
% within Team .0% .0% .0% 42.9% 26.1% 5.9% 11.5%RecommendHydration0/0 of Total .0% .0% .0% 2.5% 4.9% 4.1% 11.5%
Total Count 1 2 4 7 23 85 122% within Sport .8% 1.6% 3.3% 5.7% 18.9% 69.7% 100.0%% within Team 100.0% 100.0% 100.0% 100.0% 100.0% 100.0% 100.0%RecommendHydration% of Total .8% 1.6% 3.3% 5.7% 18.9% 69.7% 100.0%
Pearson Chi Square: <.001
103

Table 34: Team halftime snacking recommendations among football, men's basketball and women'sbasketball players
Team Recommend SnackSometimes Sometimes
0 Never Never Sometimes Alwavs Alwavs TotalSport Football Count 1 0 1 13 10 33 58
% within Sport 1.7% .0% 1.7% 22.4% 17.2% 56.9% 100.0%% within Team 50.0% .0% 9.1% 40.6% 55.6% 84.6% 47.5%RecommendSnack .
% ofTotal .8% .0% .8% 10.7% 8.2% 27.0% 47.5%Men's Count 0 13 9 16 6 6 50Baskelball % within Sport .0% 26.0% 18.0% 32.0% 12.0% 12.0% 100.0%
% within Team .0% 65.0% 81.8% 50.0% 33.3% 15.4% 41.0%RecommendSnack% of Total .0% 10.7% 7.4% 13.1% 4.9% 4.9% 41.0%
Women's Count 1 7 1 3 2 0 14Basketball %within Sport 7.1% 50.0% 7.1% 21.4% 14.3% .0% 100.0%
% within Team 50.0% 35.0% 9.1% 9.4% 11.1% .0% 11.5%RecommendSnack% of Total .8% 5.7% .8% 2.5% 1.6% .0% 11.5%
Total Count 2 20 11 32 18 39 122% within Sport 1.6% 16.4% 9.0% 26.2% 14.8% 32.0% 100.0%% within Team 100.0% 100.0% 100.0% 100.0% 100.0% 100.0% 100.0%RecommendSnack% ofTotal 1.6% 16.4% 9.0% 26.2% 14.8% 32.0% 100.0%
Pearson Chi Square: <.001
104

Table 35: Beverage availability at halftime among football, men's basketball, and women's basketballplayers
Team Bev AvailSometimes Sometimes
0 Never Sometimes Alwavs Alwavs TotalSport Football Count 1 0 0 1 56 58
% within Sport 1.7% .0% .0% 1.7% 96.6% 100.0%% within Team Bev 100.0% .0% .0% 14.3% 51.4% 47.5%Avail% ofTotal .8% .0% .0% .8% 45.9% 47.5%
Men's Basketball Count 0 1 3 4 42 50% within Sport .0% 2.0% 6.0% 8.0% 84.0% 100.0%%within Team Bev .0% 100.0% 75.0% 57.1% 38.5% 41.0%Avail% ofTotal .0% .8% 2.5% 3.3% 34.4% 41.0%
Women's Count 0 0 1 2 11 14Basketball % within Sport .0% .0% 7.1% 14.3% 78.6% 100.0%
% within Team Bev .0% .0% 25.0% 28.6% 10.1% 11.5%Avail% ofTotal .0% .0% .8% 1.6% 9.0% 11.5%
Total Count 1 1 4 7 109 122% within Sport .8% .8% 3.3% 5.7% 89.3% 100.0%% within Team Bev 100.0% 100.0% 100.0% 100.0% 100.0% 100.0%Avail% ofTolal .8% .8% 3.3% 5.7% 89.3% 100.0%
Pearson Chi Square: .216
105

Table 36: Beverage preferability of available beverages at halftime among football, men's basketball andwomen's basketball plavers
Severa es Prefer?Sometimes Sometimes
0 Never Never Sometimes Always Always TotalSport Football Count 1 1 0 6 9 41 58
% within Sport 1.7% 1.7% .0% 10.3% 15.5% 70.7% 100.0%% within 33.3% 100.0% .0% 35.3% 36.0% 54.7% 47.5%BeveragesPrefer?%afTotal .8% .8% .0% 4.9% 7.4% 33.6% 47.5%
Men's Count 2 0 1 7 14 26 50Basketball % within Sport 4.0% .0% 2.0% 14.0% 28.0% 52.0% 100.0%
% within 66.7% .0% 100.0% 41.2% 56.0% 34.7% 41.0%BeveragesPrefer?% of Total 1.6% .0% .8% 5.7% 11.5% 21.3% 41.0%
Women's Count 0 0 0 4 2 8 14Basketball % within Sport .0% .0% .0% 28.6% 14.3% 57.1% 100.0%
% within .0% .0% .0% 23.5% 8.0% 10.7% 11.5%BeveragesPrefer?% afTotal .0% .0% .0% 3.3% 1.6% 6.6% 11.5%
Total Count 3 1 1 17 25 75 122% within Sport 2.5% .8% .8% 13.9% 20.5% 61.5% 100.0%% within 100.0% 100.0% 100.0% 100.0% 100.0% 100.0% 100.0%BeveragesPrefer?0/0 of Total 2.5% .8% .8% 13.9% 20.5% 61.5% 100.0%
Pearson Chi Square: .432
, 106

Table 37: Snack availability at halftime among football, men's basketball, and women's basketball players
Team Snack AvailSometimes Sometimes
0 Never Never Sometimes Always Always TotalSport Football Count 2 0 0 2 5 49 58
% within Sport 3.4% .0% .0% 3.4% 8.6% 84.5% 100.0%% within Team 66.7% .0% .0% 10.5% 41.7% 69.0% 47.5%Snack Avail% of Total 1.6% .0% .0% 1.6% 4.1% 40.2% 47.5%
Men's Count 1 5 4 14 6 20 50Basketball % within Sport 2.0% 10.0% 8.0% 28.0% 12.0% 40.0% 100.0%
% within Team 33.3% 38.5% 100.0% 73.7% 50.0% 28.2% 41.0%Snack Avail% of Total .8% 4.1% 3.3% 11.5% 4.9% 16.4% 41.0%
Women's Count 0 8 0 3 1 2 14Basketball % within Sport .0% 57.1% .0% 21.4% 7.1% 14.3% 100.0%
% within Team .0% 61.5% .0% 15.8% 8.3% 2.8% 11.5%Snack Avail% of Total .0% 6.6% .0% 2.5% .8% 1.6% 11.5%
Total Count 3 13 4 19 12 71 122% within Sport 2.5% 10.7% 3.3% 15.6% 9.8% 58.2% 100.0%% within Team 100.0% 100.0% 100.0% 100.0% 100.0% 100.0% 100.0%Snack Avail
% of Total 2.5% 10.7% 3.3% 15.6% 9.8% 58.2% 100.0%Pearson Chi Square: <.001
107
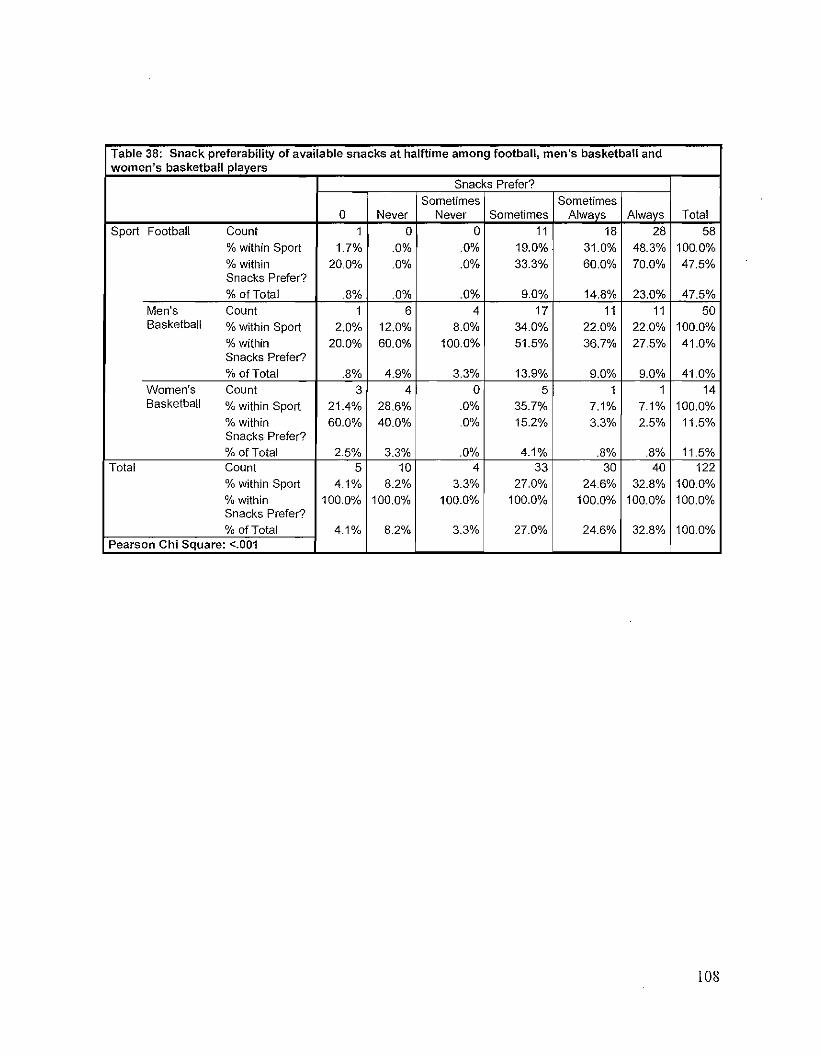
Table 38: Snack preferability of available snacks at halftime among football, men's basketball andwomen's basketball players
Snacks Prefer?Sometimes Sometimes
0 Never Never Sometimes Alwavs Alwavs Total
Sport Football Count 1 0 0 11 18 28 58% within Sport 1.7% .0% .0% 19.0% 31.0% 48.3% 100.0%% within 20.0% .0% .0% 33.3% 60.0% 70.0% 47.5%Snacks Prefer?% ofTotal .8% .0% .0% 9.0% 14.8% 23.0% 47.5%
Men's Count 1 6 4 17 11 11 50Basketball % within Sport 2.0% 12.0% 8.0% 34.0% 22.0% 22.0% 100.0%
% within 20.0% 60.0% 100.0% 51.5% 36.7% 27.5% 41.0%Snacks Prefer?% ofTotal .8% 4.9% 3.3% 13.9% 9.0% 9.0% 41.0%
Women's Count 3 4 0 5 1 1 14Basketball % within Sport 21.4% 28.6% .0% 35.7% 7.1% 7.1% 100.0%
% within 60.0% 40.0% .0% 15.2% 3.3% 2.5% 11.5%Snacks Prefer?% ofTotal 2.5% 3.3% .0% 4.1% .8% .8% 11.5%
Total Count 5 10 4 33 30 40 122% within Sport 4.1% 8.2% 3.3% 27.0% 24.6% 32.8% 100.0%% within 100.0% 100.0% 100.0% 100.0% 100.0% 100.0% 100.0%Snacks Prefer?% of Total 4.1% 8.2% 3.3% 27.0% 24.6% 32.8% 100.0%
Pearson Chi Square: <.001
108

Table 39: Temperature influence on what athletes drink at halftime among football, men's basketball, andwomen's basketball players
Temp Influence Drink?
Sometimes Sometimes0 Never Never Sometimes Always Always Total
Sport Football Count 1 0 0 11 11 35 58% within Sport 1.7% .0% .0% 19.0% 19.0% 60.3% 100.0%% within Temp 100.0% .0% .0% 35.5% 36.7% 79.5% 47.5%Influence Drink?
% oITotal .8% .0% .0% 9.0% 9.0% 28.7% 47.5%Men's Count 0 4 8 19 14 5 50Basketball % within Sport .0% 8.0% 16.0% 38.0% 28.0% 10.0% 100.0%
%within Temp .0% 80.0% 72.7% 61.3% 46.7% 11.4% 41.0%Influence Drink?% oITotal .0% 3.3% 6.6% 15.6% 11.5% 4.1% 41.0%
Women's Count 0 1 3 1 5 4 14Basketball % within Sport .0% 7.1% 21.4% 7.1% 35.7% 28.6% 100.0%
% within Temp .0% 20.0% 27.3% 3.2% 16.7% 9.1% 11.5%Influence Drink?% oITotal .0% .8% 2.5% .8% 4.1% 3.3% 11.5%
Total Count 1 5 11 31 30 44 122% within Sport .8% 4.1% 9.0% 25.4% 24.6% 36.1% 100.0%% within Temp 100.0% 100.0% 100.0% 100.0% 100.0% 100.0% 100.0%Influence Drink?% of Total .8% 4.1% 9.0% 25.4% 24.6% 36.1% 100.0%
Pearson Chi Square: <.001
109

Table 40: Temperature influence on what athletes eat at halftime among football, men's basketball, andwomen's basketball players
Temp Influence Eat?Sometimes Sometimes
0 Never Never Sometimes Alwavs Alwavs TotalSport Football Count 1 6 10 17 11 13 58
% within Sport 1.7% 10.3% 17.2% 29.3% 19.0% 22.4% 100.0%% within Temp 33.3% 27.3% 41.7% 44.7% 68.8% 68.4% 47.5%Influence Eat?% oITotal .8% 4.9% 8.2% 13.9% 9.0% 10.7% 47.5%
Men's Count 1 11 12 17 4 5 50Basketball % within Sport 2.0% 22.0% 24.0% 34.0% 8.0% 10.0% 100.0%
% within Temp 33.3% 50.0% 50.0% 44.7% 25.0% 26.3% 41.0%Influence Eat?% of Total .8% 9.0% 9.8% 13.9% 3.3% 4.1% 41.0%
Women's Count 1 5 2 4 1 1 14Basketball % within Sport 7.1% 35.7% 14.3% 28.6% 7.1% 7.1% 100.0%
% within Temp 33.3% 22.7% 8.3% 10.5% 6.3% 5.3% 11.5%Influence Eat?% of Total .8% 4.1% 1.6% 3.3% .8% .8% 11.5%
Total Count 3 22 24 38 16 19 122% within Sport 2.5% 18.0% 19.7% 31.1% 13.1% 15.6% 100.0%% within Temp 100.0% 100.0% 100.0% 100.0% 100.0% 100.0% 100.0%Influence Eat?% of Total 2.5% 18.0% 19.7% 31.1% 13.1% 15.6% 100.0%
Pearson Chi Square: .195
110

Table 41: Humidity influence on what athletes drink at halftime among football, men's basketball, andwomen's basketball players
Humid Influence Drink?Sometimes Sometimes
0 Never Never Sometimes Always Always Total
Sport Football Count 1 0 1 8 11 37 58
% within Sport 1.7% .0% 1.7% 13.8% 19.0% 63.8% 100.0%
%within Humid 100.0% .0% 20.0% 27.6% 36.7% 77.1% 47.5%Influence Drink?
% of Total .8% .0% .8% 6.6% 9.0% 30.3% 47.5%Men's Count 0 8 4 18 13 7 50Basketball % within Sport .0% 16.0% 8.0% 36.0% 26.0% 14.0% 100.0%
%within Humid .0% 88.9% 80.0% 62.1% 43.3% 14.6% 41.0%Influence Drink?
% oITotal .0% 6.6% 3.3% 14.8% 10.7% 5.7% 41.0%Women's Count 0 1 0 3 6 4 14Basketball % within Sport .0% 7.1% .0% 21.4% 42.9% 28.6% 100.0%
% within Humid .0% 11.1% .0% 10.3% 20.0% 8.3% 11.5%Influence Drink?% of Total .0% .8% .0% 2.5% 4.9% 3.3% 11.5%
Total Count 1 9 5 29 30 48 122
%within Sport .8% 7.4% 4.1% 23.8% 24.6% 39.3% 100.0%
%within Humid 100.0% 100.0% 100.0% 100.0% 100.0% 100.0% 100.0%Influence Drink?% of Total .8% 7.4% 4.1% 23.8% 24.6% 39.3% 100.0%
Pearson Chi Square: <.001
111

Table 42: Humidity influence on what athletes eat at halftime among football, men's basketball, andwomen's basketball players
Humid Influence Eat?
Sometimes Sometimes0 Never Never Sometimes Always Always Total
Sport Football Count 1 6 10 18 9 14 58
% within Sport 1.7% 10.3% 17.2% 31.0% 15.5% 24.1% 100.0%
% within Humid 33.3% 27.3% 40.0% 46.2% 56.3% 82.4% 47.5%Influence Eat?% oITotal .8% 4.9% 8.2% 14.8% 7.4% 11.5% 47.5%
Men's Count 1 12 12 16 7 2 50Basketball % within Sport 2.0% 24.0% 24.0% 32.0% 14.0% 4.0% 100.0%
% within Humid 33.3% 54.5% 48.0% 41.0% 43.8% 11.8% 41.0%Influence Eat?
% oITotal .8% 9.8% 9.8% 13.1% 5.7% 1.6% 41.0%Women's Count 1 4 3 5 0 1 14Basketball % within Sport 7.1% 28.6% 21.4% 35.7% .0% 7.1% 100.0%
% within Humid 33.3% 18.2% 12.0% 12.8% .0% 5.9% 11.5%Influence Eat?% of Total .8% 3.3% 2.5% 4.1% .0% .8% 11.5%
Total Count 3 22 25 39 16 17 122
% within Sport 2.5% 18.0% 20.5% 32.0% 13.1% 13.9% 100.0%% within Humid 100.0% 100.0% 100.0% 100.0% 100.0% 100.0% 100.0%Influence Eat?% oITotal 2.5% 18.0% 20.5% 32.0% 13.1% 13.9% 100.0%
Pearson Chi Square: .091
112

Table 43: Altitude influence on what athletes drink at halftime among football, men's basketball, andwomen's basketball players
Altitude Influence Drink?Sometimes Sometimes
0 Never Never Sometimes Alwavs Alwavs TotalSport Football Count 2 13 10 10 17 6 58
% within Sport 3.4% 22.4% 17.2% 17.2% 29.3% 10.3% 100.0%% within Altitude 100.0% 44.8% 50.0% 43.5% 47.2% 50.0% 47.5%Influence Drink?% of Total 1.6% 10.7% 8.2% 8.2% 13.9% 4.9% 47.5%
Men's Count 0 13 7 11 16 3 50Basketball % within Sport .0% 26.0% 14.0% 22.0% 32.0% 6.0% 100.0%
% within Altitude .0% 44.8% 35.0% 47.8% 44.4% 25.0% 41.0%Influence Drink?% ofTotal .0% 10.7% 5.7% 9.0% 13.1% 2.5% 41.0%
Women's Count 0 3 3 ·2 3 3 14Basketball % within Sport .0% 21.4% 21.4% 14.3% 21.4% 21.4% 100.0%
% within Altitude .0% 10.3% 15.0% 8.7% 8.3% 25.0% 11.5%Influence Drink?% of Total .0% 2.5% 2.5% 1.6% 2.5% 2.5% 11.5%
Total Count 2 29 20 23 36 12 122% within Sport 1.6% 23.8% 16.4% 18.9% 29.5% 9.8% 100.0%% within Altitude 100.0% 100.0% 100.0% 100.0% 100.0% 100.0% 100.0%Influence Drink?% of Total 1.6% 23.8% 16.4% 18.9% 29.5% 9.8% 100.0%
Pearson Chi Square: .781
113

Table 44: Altitude influence on what athletes eat at halftime among football, men's basketball, and women'sbasketball players
Altitude Influence Eat?
Sometimes Sometimes0 Never Never SometImes Always Always Total
Sport Football Count 2 15 13 14 8 6 58% within Sport 3.4% 25.9% 22.4% 24.1% 13.8% 10.3% 100.0%% within Altitude 66.7% 39.5% 48.1% 46.7% 50.0% 75.0% 47.5%Influence Eat?
% of Total 1.6% 12.3% 10.7% 11.5% 6.6% 4.9% 47.5%Men's Count 0 18 10 14 7 1 50Basketball % within Sport .0% 36.0% 20.0% 28.0% 14.0% 2.0% 100.0%
% within Allitude .0% 47.4% 37.0% 46.7% 43.8% 12.5% 41.0%Influence Eat?% of Total .0% 14.8% 8.2% 11.5% 5.7% .8% 41.0%
Women's Count 1 5 4 2 1 1 14Basketball % within Sport 7.1% 35.7% 28.6% 14.3% 7.1% 7.1% 100.0%
% within Altitude 33.3% 13.2% 14.8% 6.7% 6.3% 12.5% 11.5%Influence Eat?
% of Total .8% 4.1% 3.3% 1.6% .8% .8% 11.5%Total Count 3 38 27 30 16 8 122
% within Sport 2.5% 31.1% 22.1% 24.6% 13.1% 6.6% 100.0%% within Altitude 100.0% 100.0% 100.0% 100.0% 100.0% 100.0% 100.0%Influence Eat?% of Total 2.5% 31.1% 22.1% 24.6% 13.1% 6.6% 100.0%
Pearson Chi Square: .609
114

Table 45: Frequency that athletes are prone to cramping among football, men's basketball, and women'sbasketball players
Prone to Cramping?
Sometimes Sometimes0 Never Never Sometimes Always Always Total
Sport Football Count 1 9 28 11 2 7 58% within Sport 1.7% 15.5% 48.3% 19.0% 3.4% 12.1% 100.0%%within Prone 100.0% 37.5% 58.3% 39.3% 22.2% 58.3% 47.5%to Cramping?% of Total .8% 7.4% 23.0% 9.0% 1.6% 5.7% 47.5%
Men's Count 0 12 16 13 5 4 50Basketball %within Sport .0% 24.0% 32.0% 26.0% 10.0% 8.0% 100.0%
% within Prone .0% 50.0% 33.3% 46.4% 55.6% 33.3% 41.0%to Cramping?% of Total .0% 9.8% 13.1% 10.7% 4.1% 3.3% 41.0%
Women's Count 0 3 4 4 2 1 14Basketball % within Sport .0% 21.4% 28.6% 28.6% 14.3% 7.1% 100.0%
% within Prone .0% 12.5% 8.3% 14.3% 22.2% 8.3% 11.5%to Cramping?% oITotal .0% 2.5% 3.3% 3.3% 1.6% .8% 11.5%
Total Count 1 24 48 28 9 12 122% Within Sport .8% 19.7% 39.3% 23.0% 7.4% 9.8% 100.0%% within Prone 100.0% 100.0% 100.0% 100.0% 100.0% 100.0% 100.0%to Cramping?
% of Total .8% 19.7% 39.3% 23.0% 7.4% 9.8% 100.0%Pearson Chi Square: .596
115

Table 46: Influence of cramping on what athletes drink at halftime among football, men's basketball,women's basketball players
Cramps Affect Drink
Sometimes Sometimes0 Never Never Sometimes Alwavs Alwavs Total
Sport Football Count 1 5 6 11 9 26 58% within Sport 1.7% 8.6% 10.3% 19.0% 15.5% 44.8% 100.0%
% within 50.0% 31.3% 42.9% 47.8% 37.5% 60.5% 47.5%Cramps AffectDrink
% oITotai .8% 4.1% 4.9% 9.0% 7.4% 21.3% 47.5%
Men's Count 0 9 5 9 12 15 50Basketball % within Sport .0% 18.0% 10.0% 18.0% 24.0% 30.0% 100.0%
% within .0% 56.3% 35.7% 39.1% 50.0% 34.9% 41.0%Cramps AffectDrink% 01 Total .0% 7.4% 4.1% 7.4% 9.8% 12.3% 41.0%
Women's Count 1 2 3 3 3 2 14Basketball % within Sport 7.1% 14.3% 21.4% 21.4% 21.4% 14.3% 100.0%
% within 50.0% 12.5% 21.4% 13.0% 12.5% 4.7% 11.5%Cramps AffectDrink
% of Total .8% 1.6% 2.5% 2.5% 2.5% 1.6% 11.5%Total Count 2 16 14 23 24 43 122
% within Sport 1.6% 13.1% 11.5% 18.9% 19.7% 35.2% 100.0%% within 100.0% 100.0% 100.0% 100.0% 100.0% 100.0% 100.0%Cramps AffectDrink
% of Total 1.6% 13.1% 11.5% 18.9% 19.7% 35.2% 100.0%Pearson Chi Square: .333
116

Table 47: Influence of cramping on what athletes eat at halftime among football, men's basketball, women'sbasketball players
Cramps Affect Eat
Sometimes Sometimes0 Never Never Sometimes Always Alwavs Total
Sport Football Count 1 12 13 11 10 11 58% within Sport 1.7% 20.7% 22.4% 19.0% 17.2% 19.0% 100.0%% within 25.0% 37.5% 59.1% 44.0% 45.5% 64.7% 47.5%Cramps AffectEat% oITotal .8% 9.8% 10.7% 9.0% 8.2% 9.0% 47.5%
Men's Count 1 15 7 10 11 6 50Basketball % within Sport 2.0% 30.0% 14.0% 20.0% 22.0% 12.0% 100.0%
%within 25.0% 46.9% 31.8% 40.0% 50.0% 35.3% 41.0%Cramps AffectEat% oITotal .8% 12.3% 5.7% 8.2% 9.0% 4.9% 41.0%
Women's Count 2 5 2 4 1 0 14Basketball % within Sport 14.3% 35.7% 14.3% 28.6% 7.1% .0% 100.0%
% within 50.0% 15.6% 9.1% 16.0% 4.5% .0% 11.5%Cramps AffectEat% oITotal 1.6% 4.1% 1.6% 3.3% .8% .0% 11.5%
Total Count 4 32 22 25 22 17 122% within Sport 3.3% 26.2% 18.0% 20.5% 18.0% 13.9% 100.0%% within 100.0% 100.0% 100.0% 100.0% 100.0% 100.0% 100.0%Cramps AffectEat% oITotal 3.3% 26.2% 18.0% 20.5% 18.0% 13.9% 100.0%
Pearson Chi Square: .198
117

Table 48: Frequency that athletes are prone to injuries among football, men's basketball, and women'sbasketball players
Prone to Injury
Sometimes Sometimes0 Never Never Sometimes Always Always Total
Sport Football Count 1 10 25 16 4 2 58% within Sport 1.7% 17.2% 43.1% 27.6% 6.9% 3.4% 100.0%
% within Prone 50.0% 66.7% 44.6% 42.1% 57.1% 50.0% 47.5%to Injury% ofTotal .8% 8.2% 20.5% 13.1% 3.3% 1.6% 47.5%
Men's Count 0 5 28 15 1 1 50Basketball % within Sport .0% 10.0% 56.0% 30.0% 2.0% 2.0% 100.0%
%within Prone .0% 33.3% 50.0% 39.5% 14.3% 25.0% 41.0%to Injury% of Total .0% 4.1% 23.0% 12.3% .8% .8% 41.0%
Women's Count 1 0 3 7 2 1 14Basketball % within Sport 7.1% .0% 21.4% 50.0% 14.3% 7.1% 100.0%
% within Prone 50.0% .0% 5.4% 18.4% 28.6% 25.0% 11.5%to Injury% ofTotal .8% .0% 2.5% 5.7% 1.6% .8% 11.5%
Total Count 2 15 56 38 7 4 122% within Sport 1.6% 12.3% 45.9% 31.1% 5.7% 3.3% 100.0%% within Prone 100.0% 100.0% 100.0% 100.0% 100.0% 100.0% 100.0%to Injury% of Total 1.6% 12.3% 45.9% 31.1% 5.7% 3.3% 100.0%
Pearson Chi Square: .118
118

Table 49: Influence of injuries on what athletes drink at halftime among football, men's basketball, women'sbasketball players
lniurv Affect Drink
Sometimes Sometimes0 Never Never Sometimes Always Always Total
Sport Football Count 1 20 15 14 4 4 58
% within Sport 1.7% 34.5% 25.9% 24.1% 6.9% 6.9% 100.0%
% within Injury 33.3% 44.4% 44.1% 56.0% 50.0% 57.1% 47.5%Affect Drink
% of Total .8% 16.4% 12.3% 11.5% 3.3% 3.3% 47.5%
Men's Count 0 20 14 10 3 3 50Basketball % within Sport .0% 40.0% 28.0% 20.0% 6.0% 6.0% 100.0%
% within Injury .0% 44.4% 41.2% 40.0% 37.5% 42.9% 41.0%Affect Drink
% of Total .0% 16.4% 11.5% 8.2% 2.5% 2.5% 41.0%Women's Count 2 5 5 1 1 0 14Basketball % within Sport 14.3% 35.7% 35.7% 7.1% 7.1% .0% 100.0%
% within Injury 66.7% 11.1% 14.7% 4.0% 12.5% .0% 11.5%Affect Drink
% of Total 1.6% 4.1% 4.1% .8% .8% .0% 11.5%Total Count 3 45 34 25 8 7 122
% within Sport 2.5% 36.9% 27.9% 20.5% 6.6% 5.7% 100.0%
% within Injury 100.0% 100.0% 100.0% 100.0% 100.0% 100.0% 100.0%Affect Drink
% ofTotal 2.5% 36.9% 27.9% 20.5% 6.6% 5.7% 100.0%Pearson Chi Square: .251
119

Table 50: Influence of injuries on what athletes eat at halftime among football, men's basketball, women'sbasketball players
lniurv Affect Eat
Sometimes Sometimes0 Never Never Sometimes Always Always Total
Sport Football Count 1 21 18 11 5 2 58
% within Sport 1.7% 36.2% 31.0% 19.0% 8.6% 3.4% 100.0%
% within Injury 25.0% 42.9% 50.0% 55.0% 55.6% 50.0% 47.5%Affect Eat
% olTotal .8% 17.2% 14.8% 9.0% 4.1% 1.6% 47.5%
Men's Count 1 22 14 7 4 2 50Basketball % within Sport 2.0% 44.0% 28.0% 14.0% 8.0% 4.0% 100.0%
%within Injury 25.0% 44.9% 38.9% 35.0% 44.4% 50.0% 41.0%Affect Eat
% 01 Total .8% 18.0% 11.5% 5.7% 3.3% 1.6% 41.0%
Women's Count 2 6 4 2 0 0 14Basketball % within Sport 14.3% 42.9% 28.6% 14.3% .0% .0% 100.0%
% within Injury 50.0% 12.2% 11.1% 10.0% .0% .0% 11.5%Affect Eat
% of Total 1.6% 4.9% 3.3% 1.6% .0% .0% 11.5%Total Count 4 49 36 20 9 4 122
% within Sport 3.3% 40.2% 29.5% 16.4% 7.4% 3.3% 100.0%
% within Injury 100.0% 100.0% 100.0% 100.0% 100.0% 100.0% 100.0%Affect Eat
% of Total 3.3% 40.2% 29.5% 16.4% 7.4% 3.3% 100.0%Pearson Chi Square: .576
120

Table 51: Timing of pre-game meal consumption among football, men's basketball, and women'sbasketball players
Pre-Game Meal (hrs before)
0 1-2 hrs 2.5-4.0 hrs 4.5-6.0 hrs TotalSport Football Count 2 5 35 16 58
% within Sport 3.4% 8.6% 60.3% 27.6% 100.0%%within Pre-Game Meal 40.0% 50.0% 43.2% 61.5% 47.5%(hrs before)% ofTotal 1.6% 4.1% 28.7% 13.1% 47.5%
Men's Basketball Count 2 5 35 8 50% within Sport 4.0% 10.0% 70.0% 16.0% 100.0%% within Pre-Game Meal 40.0% 50.0% 43.2% 30.8% 41.0%(hrs before)% ofTotal 1.6% 4.1% 28.7% 6.6% 41.0%
Women's Basketball Counl 1 0 11 2 14% within Sport 7.1% .0% 78.6% 14.3% 100.0%% within Pre-Game Meal 20.0% .0% 13.6% 7.7% 11.5%(hrs before)% of Total .8% .0% 9.0% 1.6% 11.5%
Total Count 5 10 81 26 122% within Sport 4.1% 8.2% 66.4% 21.3% 100.0%% within Pre-Game Meal 100.0% 100.0% 100.0% 100.0% 100.0%(hrs before)% ofTotal 4.1% 8.2% 66.4% 21.3% 100.0%
Pearson Chi Square: .606
121

Table 52: Consumption of fluids between the pre-game warm up and kick off/tipoff among football, men'sbasketball, and women's basketball players
Fluid Before Game
Sometimes Sometimes0 Never Never Sometimes Alwavs Alwavs Total
Sport Football Count 2 0 3 5 13 35 58
% within Sport 3.4% .0% 5.2% 8.6% 22.4% 60.3% 100.0%
% within Fluid 100.0% .0% 27.3% 31.3% 56.5% 52.2% 47.5%Before Game% of Total 1.6% .0% 2.5% 4.1% 10.7% 28.7% 47.5%
Men's Count 0 2 6 7 10 25 50Basketball % within Sport .0% 4.0% 12.0% 14.0% 20.0% 50.0% 100.0%
% within Fluid .0% 66.7% 54.5% 43.8% 43.5% 37.3% 41.0%Before Game
% of Total .0% 1.6% 4.9% 5.7% 8.2% 20.5% 41.0%Women's Count 0 1 2 4 0 7 14Basketball % within Sport .0% 7.1% 14.3% 28.6% .0% 50.0% 100.0%
% within Fluid .0% 33.3% 18.2% 25.0% .0% 10.4% 11.5%Before Game
% of Total .0% .8% 1.6% 3.3% .0% 5.7% 11.5%Total Count 2 3 11 16 23 67 122
% within Sport 1.6% 2.5% 9.0% 13.1% 18.9% 54.9% 100.0%% within Fluid 100.0% 100.0% 100.0% 100.0% 100.0% 100.0% 100.0%Before Game
% of Total 1.6% 2.5% 9.0% 13.1% 18.9% 54,9% 100.0%Pearson Chi Square: .157
122

Table 53: Consumption of fluids during the first half of the game among football, men's basketball, andwomen's basketball players
Fluids 1st Half
Sometimes Sometimes0 Never Sometimes Always .Aiways Total
Sport Football Count 1 2 3 18 34 58% within Sport 1.7% 3.4% 5.2% 31.0% 58.6% 100.0%% wilhin Fluids 1st 100.0% 25.0% 17.6% 60.0% 51.5% 47.5%Half% of Total .8% 1.6% 2.5% 14.8% 27.9% 47.5%
Men's Basketball Count 0 5 9 11 25 50% within Sport .0% 10.0% 18.0% 22.0% 50.0% 100.0%% within Fluids 1st .0% 62.5% 52.9% 36.7% 37.9% 41.0%Half
% ofTotal .0% 4.1% 7.4% 9.0% 20.5% 41.0%Women's Count 0 1 5 1 7 14Basketball % within Sport .0% 7.1% 35.7% 7.1% 50.0% 100.0%
% within Fluids 1st .0% 12.5% 29.4% 3.3% 10.6% 11.5%Half% ofTotal .0% .8% 4.1% .8% 5.7% 11.5%
Total Count 1 8 17 30 66 122% within Sport .8% 6.6% 13.9% 24.6% 54.1% 100.0%% within Fluids 1st 100.0% 100.0% 100.0% 100.0% 100.0% 100.0%Half% of Total .8% 6.6% 13.9% 24.6% 54.1% 100.0%
Pearson Chi Square: .065
123

Table 54: Influence of pre-game drinking practices on halftime hydration among football, men's basketball,women's basketball players
Preqarne influence Halflime
Sometimes Sometimes0 Never Never Sometimes Always Always Total
Sport Football Count 1 7 3 17 14 16 58% within Sport 1.7% 12.1% 5.2% 29.3% 24.1% 27.6% 100.0%% within 25.0% 53.8% 25.0% 42.5% 60.9% 53.3% 47.5%PregameinfluenceHalftime
% of Total .8% 5.7% 2.5% 13.9% 11.5% 13.1% 47.5%Men's Count 1 6 5 17 8 13 50Basketball % within Sport 2.0% 12.0% 10.0% 34.0% 16.0% 26.0% 100.0%
% within 25.0% 46.2% 41.7% 42.5% 34.8% 43.3% 41.0%PregameinfluenceHalftime
% olTotal .8% 4.9% 4.1% 13.9% 6.6% 10.7% 41.0%Women's Count 2 0 4 6 1 1 14Basketball % within Sport 14.3% .0% 28.6% 42.9% 7.1% 7.1% 100.0%
% within 50.0% .0% 33.3% 15.0% 4.3% 3.3% 11.5%PregameinfluenceHalftime
% of Total 1.6% .0% 3.3% 4.9% .8% .8% 11.5%Total Count 4 13 12 40 23 30 122
% within Sport 3.3% 10.7% 9.8% 32.8% 18.9% 24.6% 100.0%% within 100.0% 100.0% 100.0% 100.0% 100.0% 100.0% 100.0%PregameinfluenceHalftime
% olTotal 3.3% 10.7% 9.8% 32.8% 18.9% 24.6% 100.0%Pearson Chi Square: .046
124

Table 55: Influence of first half drinking practices on halftime hydration among football, men's basketball,women's basketball players
Firsthalf influence HalftimeSometimes Sometimes
0 Never . Never Sometimes Always Always Total
Sport Football Counl 3 4 3 19 14 15 58%within Sport 5.2% 6.9% 5.2% 32.8% 24.1% 25.9% 100.0%%within 50.0% 50.0% 27.3% 47.5% 56.0% 46.9% 47.5%FirslhalfinfluenceHalftime% olTotal 2.5% 3.3% 2.5% 15.6% 11.5% 12.3% 47.5%
Men's Count 0 4 5 15 10 16 50Basketball % within Sport .0% 8.0% 10.0% 30.0% 20.0% 32.0% 100.0%
% within .0% 50.0% 45.5% 37.5% 40.0% 50.0% 41.0%FirsthalfinfluenceHalftime% olTotal .0% 3.3% 4.1% 12.3% 8.2% 13.1% 41.0%
Women's Count 3 0 3 6 1 1 14Basketball % within Sport 21.4% .0% 21.4% 42.9% 7.1% 7.1% 100.0%
% within 50.0% .0% 27.3% 15.0% 4.0% 3.1% 11.5%FirsthalfinfluenceHalftime.% olTotal 2.5% .0% 2.5% 4.9% .8% .8% 11.5%
Total Count 6 8 11 40 25 32 122% within Sport 4.9% 6.6% 9.0% 32.8% 20.5% 26.2% 100.0%% within 100.0% 100.0% 100.0% 100.0% 100.0% 100.0% 100.0%FirsthalfinfluenceHalftime% olTotal 4.9% 6.6% 9.0% 32.8% 20.5% 26.2% 100.0%
Pearson Chi Square: .035
125

Table 56: Consumption of food between the pre-game warm up and kick off/tipoff among football, men'sbasketball, and women's basketball players
Food before game
Sometimes Sometimes0 Never Never Sometimes Always Always Total
Sport Football Count 1 25 11 10 8 3 58
% within Sport 1.7% 43.1% 19.0% 17.2% 13.8% 5.2% 100.0%% within Food 100.0% 55.6% 39.3% 40.0% 57.1% 33.3% 47.5%before game% ofTotal .8% 20.5% 9.0% 8.2% 6.6% 2.5% 47.5%
Men's Count 0 15 13 12 6 4 50Basketball % within Sport .0% 30.0% 26.0% 24.0% 12.0% 8.0% 100.0%
% within Food .0% 33.3% 46.4% 48.0% 42.9% 44.4% 41.0%before game% ofTotal .0% 12.3% 10.7% 9.8% 4.9% 3.3% 41.0%
Women's Count 0 5 4 3 0 2 14Basketball % within Sport .0% 35.7% 28.6% 21.4% .0% 14.3% 100.0%
% within Food .0% 11.1% 14.3% 12.0% .0% 22.2% 11.5%before game
% of Total .0% 4.1% 3.3% 2.5% .0% 1.6% 11.5%Total Count 1 45 28 25 14 9 122
% within Sport .8% 36.9% 23.0% 205% 11.5% 7.4% 100.0%% within Food 100.0% 100.0% 100.0% 100.0% 100.0% 100.0% 100.0%before game
% of Total .8% 36.9% 23.0% 20.5% 11.5% 7.4% 100.0%Pearson Chi Square: .729
126

Table 57: Consumption of food during the first half of the game among football, men's basketball, andwomen's basketball players
Food 1st Half
Sometimes Sometimes0 Never Never Sometimes Always Always Total
Sport Football Count 1 32 7 9 7 2 58
% within Sport 1.7% 55.2% 12.1% 15.5% 12.1% 3.4% 100.0%
% within Food 100.0% 43.8% 35.0% 50.0% 100.0% 66.7% 47.5%1st Half
% of Total .8% 26.2% 5.7% 7.4% 5.7% 1.6% 47.5%
Men's Count 0 30 12 7 0 1 50Basketball % within Sport .0% 60.0% 24.0% 14.0% .0% 2.0% 100.0%
%within Food .0% 41.1% 60.0% 38.9% .0% 33.3% 41.0%1st Half
% of Total .0% 24.6% 9.8% 5.7% .0% .8% 41.0%Wbmen's Count 0 11 1 2 0 0 14Basketball % within Sport .0% 78.6% 7.1% 14.3% .0% .0% 100.0%
% within Food .0% 15.1% 5.0% 11.1% .0% .0% 11.5%1st Half% of Total .0% 9.0% .8% 1.6% .0% .0% 11.5%
Total Count 1 73 20 18 7 3 122
% within Sport .8% 59.8% 16.4% 14.8% 5.7% 2.5% 100.0%
% within Food 100.0% 100.0% 100.0% 100.0% 100.0% 100.0% 100.0%1st Half% of Total .8% 59.8% 16.4% 14.8% 5.7% 2.5% 100.0%
Pearson Chi Square: .188
127

Table 58: Influence of pre-game eating practices on halftime snacking among football, men's basketball,women's basketball players
Preqarne Influence HalftimeSometimes Sometimes
0 Never Never Sometimes Always Always TotalSport Football Count 1 19 7 17 4 10 58
% within Sport 1.7% 32.8% 12.1% 29.3% 6.9% 17.2% 100.0%%within 100.0% 44.2% 33.3% 50.0% 44.4% 71.4% 47.5%PregameInfluenceHalftime% of Total .8% 15.6% 5.7% 13.9% 3.3% 8.2% 47.5%
Men's Count 0 17 12 13 4 4 50Basketball % within Sport .0% 34.0% 24.0% 26.0% 8.0% 8.0% 100.0%
%within .0% 39.5% 57.1% 38.2% 44.4% 28.6% 41.0%PregameInfluenceHalftime% of Total .0% 13.9% 9.8% 10.7% 3.3% 3.3% 41.0%
Women's Count 0 7 2 4 1 0 14Basketball % within Sport .0% 50.0% 14.3% 28.6% 7.1% .0% 100.0%
% within .0% 16.3% 9.5% 11.8% 11.1% .0% 11.5%PregameInfluenceHalftime% ofTotal .0% 5.7% 1.6% 3.3% .8% .0% 11.5%
Total Count 1 43 21 34 9 14 122% within Sport .8% 35.2% 17.2% 27.9% 7.4% 11.5% 100.0%% within 100.0% 100.0% 100.0% 100.0% 100.0% 100.0% 100.0%PregameInfluenceHalftime% ofTotal .8% 35.2% 17.2% 27.9% 7.4% 11.5% 100.0%
Pearson Chi Square: .594
128

Table 59: Influence of first half eating practices on halftime eating habits among football, men's basketball,women's basketball players
Firsthalf influence Halftime
Sometimes Sometimes0 Never Never Sometimes Alwavs Alwavs Total
Sport Football Count 2 24 8 16 3 5 58
% within Sport 3.4% 41.4% 13.8% 27.6% 5.2% 8.6% 100.0%
% within 66.7% 42.9% 34.8% 57.1% 60.0% 71.4% 47.5%FirsthalfinfluenceHalftime% of Total 1.6% 19.7% 6.6% 13.1% 2.5% 4.1% 47.5%
Men's Count 0 26 13 7 2 2 50Basketball % within Sport .0% 52.0% 26.0% 14.0% 4.0% 4.0% 100.0%
% within .0% 46.4% 56.5% 25.0% 40.0% 28.6% 41.0%FirsthalfinfluenceHalftime
% of Total .0% 21.3% 10.7% 5.7% 1.6% 1.6% 41.0%Women's Count 1 6 2 5 0 0 14Basketball % within Sport 7.1% 42.9% 14.3% 35.7% .0% .0% 100.0%
% within 33.3% 10.7% 8.7% 17.9% .0% .0% 11.5%FirsthalfinfluenceHalftime% of Total .8% 4.9% 1.6% 4.1% .0% .0% 11.5%
Total Count 3 56 23 28 5 7 122% within Sport 2.5% 45.9% 18.9% 23.0% 4.1% 5.7% 100.0%% within 100.0% 100.0% 100.0% 100.0% 100.0% 100.0% 100.0%FirsthalfinfluenceHalftime% of Total 2.5% 45.9% 18.9% 23.0% 4.1% 5.7% 100.0%
Pearson Chi Square: .311
129

Table 60: Extent of in-game weight loss among football, men's basketball, and women's basketball players
Lose Weight During Game
Sometimes Sometimes0 Never Never Sometimes Alwavs Alwavs Total
Sport Football Count 2 3 6 15 16 16 58
% within Sport 3.4% 5.2% 10.3% 25.9% 27.6% 27.6% 100.0%
% within Lose 66.7% 23.1% 27.3% 38.5% 64.0% 80.0% 47.5%Weight DuringGame
% of Total 1.6% 2.5% 4.9% 12.3% 13.1% 13.1% 47.5%Men's Count 0 6 10 21 9 4 50Basketball % within Sport .0% 12.0% 20.0% 42.0% 18.0% 8.0% 100.0%
% within Lose .0% 46.2% 45.5% 53.8% 36.0% 20.0% 41.0%Weight DuringGame% of Total .0% 4.9% 8.2% 17.2% 7.4% 3.3% 41.0%
Women's Count 1 4 6 3 0 0 14Basketball % within Sport 7.1% 28.6% 42.9% 21.4% .0% .0% 100.0%
% within Lose 33.3% 30.8% 27.3% 7.7% .0% .0% 11.5%Weight DuringGame
% of Total .8% 3.3% 4.9% 2.5% .0% .0% 11.5%Total Count 3 13 22 39 25 20 122
% within Sport 2.5% 10.7% 18.0% 32.0% 20.5% 16.4% 100.0%% within Lose 100.0% 100.0% 100.0% 100.0% 100.0% 100.0% 100.0%Weight DuringGame
% of Total 2.5% 10.7% 18.0% 32.0% 20.5% 16.4% 100.0%Pearson Chi Square: <.001
130

I. Age: _ 2. Gender:
APPENDIX A
(A)Male (B)Female
3. Race:_(A)American Indian and Alaska Native_(B)Asian_(C)Biracial: please specitY,- __ (D)Black or African American_(E)Hispanic_(F)Native Hawaiian and Other Pacific Islander_(G)White_(H)Other: please specify _
4. Height: ft in 5. Current Weight: lb
6. What sport do you play? (A)Football (B)Men's Basketball (C)Women's Basketball
7. Do you play indoors, outdoors or both? (A)Indoors (B)Outdoors (C)Both
8. Please select primary position that you play:Football
(A)KickerlPunter(B)Offensive line/Defensive line'
_ (C)Tight end/Inside linebacker_ (D)Running back/Outside linebacker_ (E) Wide receiverlDefensive back
Basketball_(A)Point guard_(B)Shooting guard
_(C)Small forward_(D)Power forward_(E)Center
9. YEARS played in COLLEGE: I 2 3 4
10. YEARS REDSHIRTED in college: 0 I 2 3
II. YEARS played at PROFESSIONAL level: 1-3 4-8 9-12 13-15
12. MINUTES AVAILABLE for you to consnme a beverage or snack during0-5 6-10 II-IS 16-20
halftime:
13-23. What type ofbeverage(s) do you consume at halftime? Please check all that apply and amounts.[Check Closest Beveragets) and Circle Closest Amountsl Amounts...j Beverage A B C D
13. Excess 'h cup 1-2 cups 3-4 cups 5 cups or more14. FRS 'h cup 1-2 cups 3-4 cups 5 cups or more15. Fruit Juice 1;2 cup 1-2 cups 3-4 cups 5 cups or more16. Gatorade Y, CUD 1-2 CUDS 3-4 cups 5 CUDS or more17. Gatorload 'h cup 1-2 cups 3-4 cups S cups or more18. Hydrate liz cup 1-2 cups 3-4 cups 5 cups ormore19. Powerade liz CUD 1-2 CUDS 3-4 cups S CUDS or more20. Powerade Zero 'h cup 1-2 cups 3-4 cups 5 cups or more21. Vitamin Water 'h cup 1-2 cups 3-4 cups 5 CUDS or more22. Water 'h cup 1-2 cups 3-4 cups 5 cups or more23. Other (please list): 1;2 cup 1-2 cups 3-4 cups 5 cups or more
24-31. What type of snack(s) do you consume at halftime? Please check all that apply and listamount consumed.I [Check Closest Snack(s) and Circle Closest Amonnts
131

Amounts],j Snack A B C D
24. Canned Fruit (i.e. apple see, can oranges, etc) ~Can I Can 1 lh Cans 2 Cans or more25. Crackers, pretzels, saltines II, Cup 1 CuP I II, Cups 2 Cups or more26. Energy bar(i.e. GranolaBar, PowerBar, etc.) 12 Bar I Bar 1 liz Bars 2 Bars or more27. Energy gel liz Pack 1 Ilh 2 Packsor more
Pack Packs28. Fresh fruit(i.e. apple, banana, orange) Y:z Fruit 1 1 Y2 Fruit 2 Fruits or more
Fruit29. Peanut butter II, Tbsp 1 I II, Tbsp 2 Tbsp or more
Tbsp30. Salt free pretzels II, Cup 1 Cup I II, Cups 2 Cups or more31. Other (please list): II, I 1 1!z 2 or more
32. Are beverages that you COnsume during halftime:_(A)Purchased and brought to the game by you?_(B)Provided by the team?
Question (Please circle most common value) NeverSome
Alwaystimes
33. To what extent do you hydrate the same way at every halftime?I 2 3 4 5
34. Which of the following is the biggest influence on what determines how you hydrate at halftime?_(A)Availability of beverages_(B) Difficulty of game_(C)Team requirement_(D)Temperature_CE) Time playing
35. Are snacks that you consume during halftime:_(A)Purchased and brought to the game by you?_(B)Provided by the team?
Question (please circle most common value) NeverSome
Alwaystimes
36. To what extent do you snack the same way at every halftime?I 2 3 4 5
37. Which of the following is the biggest influence on what determines how you snack at halftime?_(A)Availability of snacks_(B) Difficulty of game_(C)Team requirement_CD)Temperature_(E) Time playing
Question (Please circle most common value) NeverSome
Alwaystimes
38. Does the team recommend that you hydrate during halftime?I 2 3 4 5
132

39. Does the team recommend that you snack during halftime?I 2 3 4 5
40. Does the team make beverages available to you at halftime?I 2 3 4 5
41. Are these the beverages you prefer?I 2 3 4 5
42. Does the team make snacks available to you at halftime?I 2 3 4 5
43. Are these the snacks you prefer?I 2 3 4 5
44. To what degree does environmental temperature influence whatI 2 3 4 5
you drink at halftime?
45. To what degree does environmental temperature influence whatI 2 3 4 5
you eat at halftime?46. To what degree does environmental humidity influence what you
I 2 3 4 5drink at halftime?
47. To what degree does environmental humidity influence what youI 2 3 4 5
eat at halftime?48. To what extent does altitude affect what you drink at halftime?
1 2 3 4 5
49. To what extent does altitude affect what you eat at halftime?I 2 3 4 5
50. Are you prone to cramping during games?I 2 3 4 5
?f the folldb udT h51-57. ow at extent o you e ieve your cramps are ue to any 0 t e 0 owmg.
(Please circle most common value) NeverSome
Alwaystimes
51. Dehydration I 2 3 4 5
52. FatigueI 2 3 4 5
53. Improper dietI 2 3 4 5
54. Low potassiumI 2 3 4 5
55. Low sodium I 2 3 4 5
56. Not warmed up enoughI 2 3 4 5
57. OtherI 2 3 4 5
Question (Please circle most common value) NeverSome Alwaytimes s
58. To what extent does cramping affect what you drink at halftime?I 2 3 4 5
59. To what extent does cramping affect what you eat at halftime?I 2 3 4 5
60. To what extent are you prone to injuries?I 2 3 4 5
133

61. To what extent do injuries affect what you drink at halftime?I 2 3 4 5
62. To what extent do injuries affect what you eat at halftime?I 2 3 4 5
63. How many hours before tipoff/kick off do you consume your pre game meal?
_(All hour-2 hours _(B) 2 Y, hours-4 hours _(C)4 y, hours-6 hours
64. Do you consume any fluids between the pre-game warm up andkick-off/tip off? I 2 3 4 5
65. Do you consume auy fluids during the first half of the game?I 2 3 4 5
66. Do your pregame drinking practices influence how you hydrate atI 2 3 4 5halftime?
67. Do your first half drinking practices influence how you hydrate atI 2 3 4 5halftime?
68. Do you consume any food between the pre-game warm up andkick-off/tip off? I 2 3 4 5
,69. Do you consume any food during the first half of the game?
I 2 3 4 5
70. Do your pregame eating practices influence how you eat atI 2 3 4 5halftime?
71. Do your first half eating practices influence how you eat atI 2 3 4 5halftime?
72. To what degree do you typically lose weight during a game?I 2 3 4 5
73. Do you lose weight, gain weight, or sustain weight over the course ofa typical game?
__A. Lose weight (If so, how many pounds do you lose?: Ib)
__B. Gain weight (If so, how many pounds do you gain?: Ib)
__c. Sustain weight
* * *Please return the completed questionnaire in the attached pre-stamped envelope. Thank you!
134