haiti: feasibility of waste-to-energy options at the … report provides further analysis of the...
TRANSCRIPT


NOTICE
This manuscript has been authored by employees of the Alliance for Sustainable Energy, LLC (“Alliance”) under Contract No. DE-AC36-08GO28308 with the U.S. Department of Energy (“DOE”).
The tables and figures in this report are limited to use in this report only and are not to be further disseminated or used without the permission of the sources cited.
This report was prepared as an account of work sponsored by an agency of the United States government. Neither the United States government nor any agency thereof, nor any of their employees, makes any warranty, express or implied, or assumes any legal liability or responsibility for the accuracy, completeness, or usefulness of any information, apparatus, product, or process disclosed, or represents that its use would not infringe privately owned rights. Reference herein to any specific commercial product, process, or service by trade name, trademark, manufacturer, or otherwise does not necessarily constitute or imply its endorsement, recommendation, or favoring by the United States government or any agency thereof. The views and opinions of authors expressed herein do not necessarily state or reflect those of the United States government or any agency thereof.
Back Cover Photos: (left to right): Photo by Dennis Schroeder, NREL 17613, photo from Iberdrola Renewables, Inc., NREL 16694, Photo by Robb Williamson, NREL 10891, Photo by Warren Gretz, NREL 08022, Photo by Judy Powers.
NREL prints on paper that contains recycled content.

i
LIST OF ACRONYMS AND ABBREVIATIONS AD anaerobic digestion CBA cost-benefit analysis CHP combined heat and power cm centimeter CMHD complex mix and hybrid digester CO2 carbon dioxide DINEPA Direction Nationale de l’Eau Potable et de l’Assainissement DOE U.S. Department of Energy EA environmental assessment EDH Electricité d’Haïti FFD fixed-film digester FML flexible membrane liner FY fiscal year GHG greenhouse gas GOH Government of Haiti HDPE high density polyethylene HFO heavy fuel oil HMMCL heated and mixed membrane-covered lagoon HRT hydraulic retention time IC internal combustion IDB Inter-American Development Bank IPP independent power producers kg kilogram km kilometer kV kilovolt kW kilowatt kWh kilowatt-hour LFG landfill gas LFGTE landfill gas-to-energy ls lump sum m meter m2 square meter m3 cubic meter MCL membrane-covered lagoon MSW municipal solid waste MW megawatt MWh megawatt-hour NGO non-government organization NREL National Renewable Energy Laboratory O&M operation and maintenance PFD plug-flow digester PPA power purchase agreement ppm parts per million RDF refuse-derived fuel sec second

ii
SMCRS Service Metropolitain de Collecte des Residus Solides SOIL Sustainable Organic Integrated Livelihoods SWANA Solid Waste Association of North America T&D transmission and distribution TS total solids UCD upright cylinder digester UNEP United Nations Environment Programme UNOPS United Nations Office for Project Services USAID U.S. Agency for International Development VOC volatile organic compounds VS volatile solids WSA waste sort analysis WTE waste-to-energy

iii
EXECUTIVE SUMMARY This report provides further analysis of the feasibility of a waste-to-energy (WTE) facility in the area near Port-au-Prince, Haiti. NREL’s previous analysis and reports identified anaerobic digestion (AD) as the optimal WTE technology at the facility. Building on the prior analyses, this report evaluates the conceptual financial and technical viability of implementing a combined waste management and electrical power production strategy by constructing a WTE facility at the existing Trutier waste site north of Port-au-Prince.
The project team evaluated two electricity-generation options for Trutier: (1) improving the site to modern landfill standards with a landfill gas capture system and electricity generation from the landfill gas and (2) constructing an AD facility at the Trutier waste site with electricity generation from the digester gas.
The estimated capital cost to construct a landfill gas-to-energy (LFGTE) facility would be $46.7 million, and the plant would produce an average of approximately 16,260 megawatt-hours (MWh) of electricity annually over the 20-year planning horizon. Estimated annual revenues from electricity sales would be roughly $3.3 million and the net annual operating costs (i.e., not including the annualized cost of constructing the facility) for an LFGTE facility would be roughly $3.4 million, assuming the electricity is sold at 20 cents/kilowatt-hour (kWh), which is at the low end of current electricity prices in Haiti.
The estimated capital cost to construct an AD facility would be $40.5 million (excluding improvements to the landfill for materials that are not processed by the AD facility), and the plant would produce approximately 38,813 MWh of electricity annually. Estimated annual revenues from electricity sales would be roughly $7.8 million, and the net annual operating costs for an AD facility would be roughly $8.9 million, assuming the electricity is sold at 20 cents/kWh.
Using a simple financial analysis, an improved landfill equipped with a LFGTE facility is the lowest-cost electricity-generation option for the Trutier waste site. If the project is developed as a commercial venture (i.e., including capital costs), the LFGTE facility would have a net cost of roughly $19.30/tonne, versus $21.10/tonne for an AD facility. If capital costs are covered by the donor community, the LFGTE facility would have a net operating cost of roughly $0.50/tonne, versus $4.80/tonne for an AD facility.
Using an economic analysis that includes quantifiable environmental costs and benefits, an AD facility is the lowest-cost electricity-generation option for the Trutier site, costing roughly $22.90/tonne, versus $26.90/tonne for an LFGTE facility.
There are some significant uncertainties regarding project development, related costs, and overall socioeconomic viability. The most notable uncertainty is the financial crisis faced by the Haitian government and the associated risk that the government will not be able to support and maintain the waste collection infrastructure. Without reliable waste collection, any waste treatment and power generation system could be rendered useless.

iv
Other uncertainties stem from the fact that the quantity and composition of waste used in this report's analysis are based on estimates of waste quantity and composition observed in late 2011. Recent changes to the waste collection efforts have resulted in significant, but likely temporary, changes to the quantity of waste collected (as much as 40% higher). This change reveals the variability of the conditions in Haiti, which underscore the level of uncertainty in establishing the appropriate facility size. The above energy production and cost estimates are based on a single waste characterization study that found the total quantity of waste collected at the Trutier site is 238,345 tonnes/year and that AD is likely the preferred technology for a WTE system due to the high proportion of moist organics in the waste stream. Additional studies are needed to evaluate seasonal variations in the composition and quantity of the waste stream, as this could influence the choice of technology and size of the facility.
Other uncertainties include the potential impact of unpredictable catastrophic events (earthquakes and hurricanes), unknown site conditions of the Trutier site as they pertain to seismic and flooding events, uncertain legal and permitting requirements, final project costs (this analysis assumes U.S. mainland costs), the composition of the project implementation team, and challenges with securing project financing.
In determining the most appropriate WTE technology and project financing vehicle for Trutier, it is important to consider whether the goal is to build a financially self-sustaining solid waste management system, to focus on WTE energy production, or to provide as much aid as possible. The optimal choice of technology is dependent on the objectives selected and, in particular, the way in which project costs and benefits are valued.

v
TABLE OF CONTENTS 1.0 Project Background and Prior Studies ................................................................... 1
1.1 Disclaimer and Disclosure of Report Uncertainties ............................................ 1 1.2 Technologies for Converting Waste to Energy ................................................... 3 1.3 NREL Desktop Study ......................................................................................... 4 1.4 UNOPS Waste Characterization Study .............................................................. 5 1.5 UNOPS Truck Monitoring Study ......................................................................... 6
2.0 Waste Generation, Characterization, and Collection ............................................. 7 2.1 Haiti's Waste Management Authority ................................................................. 7 2.2 Waste Generation .............................................................................................. 8 2.3 Waste Collection ................................................................................................ 9
2.3.1 Waste Components and Characteristics...................................................... 9 2.4 Valuable Uses for the Waste Stream ............................................................... 11
2.4.1 Recycling ................................................................................................... 11 2.4.2 Green Waste ............................................................................................. 11 2.4.3 Human Waste ............................................................................................ 12 2.4.4 Effluent and Digestate ............................................................................... 12
3.0 Trutier Site Details and Characteristics ............................................................... 13 3.1 Initial Site Assessment ..................................................................................... 13 3.2 Maps, Drawings, and Coordinates ................................................................... 14 3.3 Current Trutier Site Operations and Layout...................................................... 15 3.4 Potential Location for Anaerobic Digestion Facility .......................................... 17
4.0 Anaerobic Digestion and Landfill Gas-to-Energy: Technical Details .................... 20 4.1 Anaerobic Digestion ......................................................................................... 20
4.1.1 Summary of Anaerobic Digestion Equipment: Conceptual Design ............ 21 4.1.2 Digestion Facilities ..................................................................................... 27 4.1.3 Digestate Management.............................................................................. 29 4.1.4 Biogas Management and Power Production .............................................. 30 4.1.5 Mass and Energy Balance/Process Flow Diagram .................................... 30 4.1.6 Anaerobic Digestion Plant Utility Interfacing and Requirements ................ 31 4.1.7 Anaerobic Digestion Planning Level Facility Cost Estimates ..................... 31
4.2 Modern Sanitary Landfill Alternative ................................................................. 36 4.2.1 Modern Landfill Components ..................................................................... 37

vi
4.2.2 Liner System .............................................................................................. 37 4.2.3 Leachate Collection and Removal Systems .............................................. 38 4.2.4 Landfill Gas Collection System .................................................................. 38 4.2.5 Preliminary Design of a Modern Landfill and Landfill Gas-to-Energy System .................................................................................................................. 39 4.2.6 Modern Sanitary Landfill Planning-Level Cost Estimates .......................... 40
4.3 Comparison of Systems ................................................................................... 43 5.0 The Power Grid and Potential Interconnects ....................................................... 45
5.1 Overview of the Power Grid in Haiti ................................................................. 45 5.2 The Need for Reliable Electricity ...................................................................... 45 5.3 The Need for Indigenous Power ....................................................................... 46 5.4 The Power Grid in the Port-au-Prince Area ...................................................... 46 5.5 Potential Interconnection Locations ................................................................. 47 5.6 Plans to Improve the Grid................................................................................. 49
5.6.1 The Electricité d’Haïti Action Plan .............................................................. 49 5.6.2 Grid Projects by International Donors ........................................................ 50
5.7 Electricité d’Haïti Revenues, Costs, and Power Purchase Agreements Rates. 50 6.0 Social and Environmental Factors ....................................................................... 52
6.1 Basis for Considering Social and Environmental Factors ................................. 52 6.2 Qualitative Factors ........................................................................................... 53 6.3 Social and Environmental Cost-Benefit Parameters ........................................ 57
6.3.1 Externalities for Landfills with and without Landfill Gas Collection ............. 57 6.3.2 Externality Costs for Trutier Development Scenarios ................................ 57
7.0 Financial and Economic Analysis ........................................................................ 61 7.1 Cost Summary ................................................................................................. 61
7.1.1 Scenario 1: Waste Dump ........................................................................... 61 7.1.2 Scenario 2: Modern Landfill with Landfill Gas Capture and Electricity Generation .............................................................................................................. 61 7.1.3 Scenario 3: Anaerobic Digestion Facility with Electricity Generation ......... 63
7.2 Financial Analysis ............................................................................................ 66 7.3 Economic Analysis ........................................................................................... 67 7.4 Economic Sensitivities to Variables .................................................................. 68 7.5 Conclusion ....................................................................................................... 70
8.0 Project Development Steps ................................................................................. 72

vii
8.1 Site ................................................................................................................... 72 8.2 Resource .......................................................................................................... 74 8.3 Off-Take ........................................................................................................... 74 8.4 Permits ............................................................................................................. 76 8.5 Technology ....................................................................................................... 76 8.6 Team ................................................................................................................ 76 8.7 Capital .............................................................................................................. 77 8.8 Conclusion ....................................................................................................... 77
9.0 Project Risks ....................................................................................................... 78 9.1 Technology-Related Risks ............................................................................... 78 9.2 Other Potential Failure Mechanisms ................................................................ 79 9.3 Case Study: Project Risks Faced by E-Power ................................................. 79
10.0 Conclusions and Recommendations ................................................................... 82 10.1 Summary of Report Findings ........................................................................ 82
10.1.1 Societal Benefits of a Waste-to-Energy Project ...................................... 82 10.1.2 Electricity Generation Over Time ............................................................ 82 10.1.3 Incorporating Local Conditions into Project Planning ............................. 82 10.1.4 Availability of Suitable Labor .................................................................. 83 10.1.5 Waste Disposal Requirements ............................................................... 83 10.1.6 Timing of Construction ........................................................................... 84
10.2 Conclusions .................................................................................................. 84 10.3 Next Steps .................................................................................................... 84 10.4 Suggestions for Further Study ...................................................................... 85
Glossary ........................................................................................................................ 86 References .................................................................................................................... 87 Appendix A: Anaerobic Digestion Technology Description ............................................ 91 Appendix B: UNOPS Waste Sort Study and National Renewable Energy Laboratory Calculations ................................................................................................................. 107 Appendix C: UNOPS Trutier Truck Monitoring Study .................................................. 113 Appendix D: Study on Colocating and Co-Firing Biogas in Diesel Gensets ................ 116

viii
LIST OF FIGURES Figure 1. Solid waste management sector in Haiti .......................................................... 8
Figure 2. Population growth estimate for Haiti ................................................................. 9
Figure 3. Comparison of sites by category .................................................................... 13
Figure 4. Satellite view of Port-Au-Prince, showing location of Trutier .......................... 15
Figure 5. Trutier satellite view #2 (medium zoom) ......................................................... 16
Figure 6. Trutier satellite view #3 .................................................................................. 16
Figure 7. ICH Trutier drawing and site layout ................................................................ 17
Figure 8. Trutier west loop and site of former septic disposal site ................................. 18
Figure 9. Potential location for and layout of an AD facility at Trutier ............................ 19
Figure 10. Anaerobic digestion conceptual process flow diagram ................................. 22
Figure 11. Typical MSW manual sorting lines (photo of the Western Placer Waste Management Authority’s Materials Recovery Facility in Lincoln, California) .................. 26
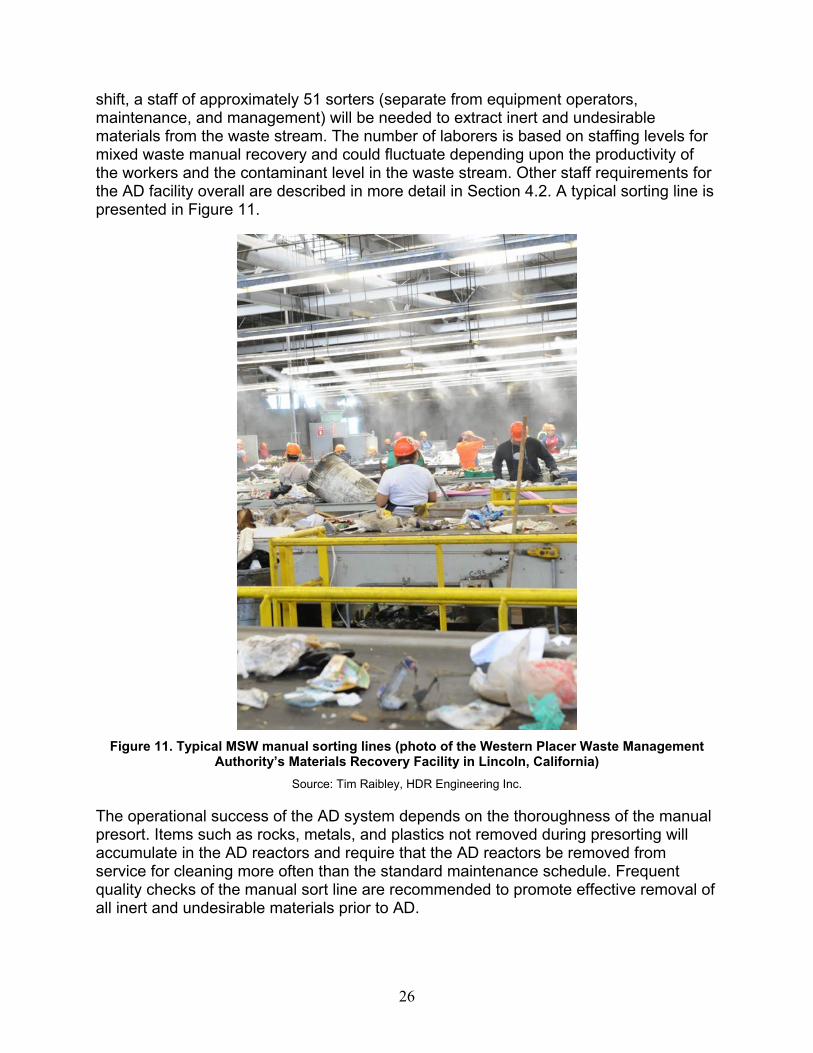
Figure 12. Typical AD facility (photo of Valorga-Urbaser AD facility in Madrid, Spain) .. 28
Figure 13. Cross-section through a modern landfill ....................................................... 37
Figure 14. Estimated landfill gas production (first 20 years) .......................................... 40
Figure 15. Transmission lines in Port-au-Prince, 2010: 69 kV (red) and 115 kV (blue) 47
Figure 16. Potential interconnects for the Trutier power plant (labeled "A") .................. 48
Figure 17. EDH costs, revenue collected, and deficit (2010) ......................................... 50
Figure 18. Graphical comparison of each site ............................................................... 73
Figure 19. EDH costs, revenue collected, and deficit (2010) ......................................... 75
LIST OF TABLES Table 1. Suitable Waste Categories and Percent Constituency of MSW ........................ 6
Table 2. Organic Materials Summary—Total and Volatile Solids .................................... 7
Table 3. Summary of Constituents of Waste Collected in the Port-au-Prince Area ....... 10
Table 4. Total Solids, Moisture Content, and Volatile Solids of the Waste Organic Materials ........................................................................................................................ 10
Table 5. Sites Included in Initial Evaluation ................................................................... 13
Table 6. Opinion of Probable Anaerobic Digestion Capital Construction Cost .............. 32
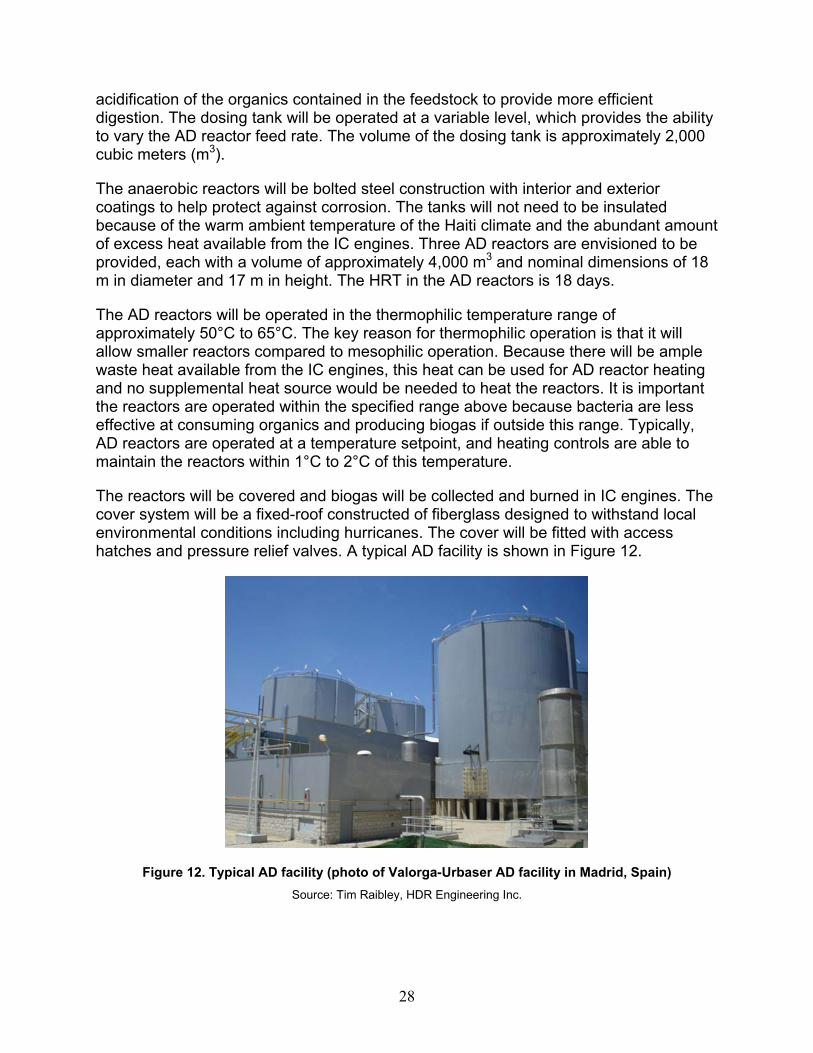
Table 7. Staffing Requirements Estimate for Anaerobic Digester at Trutier .................. 34
Table 8. Anaerobic Digestion Cost Summary Details .................................................... 36
Table 9. Opinion of Probable Landfill Capital Construction Cost ................................... 41

ix
Table 10. Estimate of Landfill System Staffing Requirements ....................................... 42
Table 11. Landfill Equipped with LFGTE System Cost Summary Details ...................... 43
Table 12. Comparison of Annual Power Generation Rates ........................................... 43
Table 13. Comparison of Key Cost Features ................................................................ 44
Table 14. Comparison of System Cost per Tonne ........................................................ 44
Table 15. Economic Valuations of Externalities from Landfills ($/tonne)a ...................... 57
Table 16. Derived Externalities Costs for Three Alternative Scenarios at Trutier ($/tonne) ........................................................................................................................ 58
Table 17. Scenario 2 Total Capital Costs ...................................................................... 62
Table 18. Scenario 2 Annual Operating Costs .............................................................. 63
Table 19. Scenario 3 Total Capital Costs ...................................................................... 63
Table 20. Scenario 3 Annual Operating Costs .............................................................. 65
Table 21. Net Annual Costs for Each Scenario ($ millions) ........................................... 66
Table 22. Net per Tonne Costs for Each Scenario ($/tonne) ......................................... 67
Table 23. Per Tonne Economic Analysis for Each Scenario ($/tonne) .......................... 67
Table 24. Economic Sensitivity to Variables of Key Cost Factors ................................ 70
Table A-1. Advantages, Disadvantages, and Applicability of Various AD Approaches in Haiti ............................................................................................................................. 102
Table A-2. Advantages, Disadvantages, and Applicability of LFGTE in Haiti .............. 105
Table B-1. Sample Data from Waste Characterization Study ...................................... 110
Table B-2. Waste Composition—Percent Total Solids ................................................ 111
Table B-3. Waste Composition—Volatile Solids, as Percent of Total Solids ............... 111
Table B-4. Waste Composition—Volatile Solids as Percent of Total ........................... 111
Table B-5. Organic Materials Summary—Total and Volatile Solids ............................ 112
Table C-1. Sample Truck Monitoring Log File from Saturday, Dec. 10, 2011 ............. 113
Table C-2. Assumed Densities Used to Convert from Volume to Mass ...................... 114
Table C-3. Truck Monitoring Data Summary ............................................................... 114
Table C-4. Total Quantities of Materials Delivered to the Landfill ................................ 115
Table D-1. Technology Summary ................................................................................ 117
Table D-2. GTI Technologies—Bifuel Model Series Summary .................................... 119
Table D-3. Bifuel Reference Projects .......................................................................... 119
Table D-4. Summary of Biogas Cleaning Costs for Various Recovery Alternatives .... 121

1
1.0 Project Background and Prior Studies In 2010, in close collaboration with the Haitian government agency Direction Nationale de l’Eau Potable et de l’Assainissement (DINEPA), the United Nations Environment Programme (UNEP) set up and facilitated a biogas working group with the aim of catalyzing the expansion of anaerobic biodigestion technology (biogas) as part of the sanitation solution for Haiti.
One result of this working group is that the United States Agency for International Development (USAID), the United States Department of State, and the United States Department of Energy (DOE) commissioned DOE's National Renewable Energy Laboratory (NREL) to evaluate the feasibility of converting municipal solid waste to energy in the Port-au-Prince area.
This project is being performed in coordination with a wind and solar resource study also being conducted by NREL. The overall purpose of this work effort is to support renewable energy deployment in Haiti to assist with the country's reconstruction efforts following the 2010 earthquake that destroyed parts of the country's infrastructure.
This report was preceded by an NREL desktop study in 2010, which recommended installation of an anaerobic digestion (AD) system at the Trutier (sometimes spelled "Truitier") waste disposal site outside the capital city. The system would produce electricity through an internal combustion engine. AD is the recommended technology because of the nature of the waste, which is high in both organic and moisture content. This report compares AD to a landfill gas-to-energy (LFGTE) system, which would be simpler to operate but would not produce as much gas and electricity as an AD system.
That desktop study is one of several studies that serve as reference and foundational documents for this report. Other examples include various technical memoranda produced by HDR Engineering Inc. (an NREL subcontractor), and waste composition and truck monitoring studies performed by UNOPS. Some of these reports are briefly described below, and information from them is used throughout the analysis and final report.
1.1 Disclaimer and Disclosure of Report Uncertainties This report was prepared with the understanding that numerous unknowns would not be resolved in this study. The absence of existing accurate data about the nature and extent of the waste in the Port-au-Prince area meant the project team had to perform independent studies to ascertain waste composition and approximate quantity estimates. Uncertainties that could affect the conclusions in this report include, but are not limited, to:
• The quantity of waste. Planning and design efforts in this report relied on estimates of waste quantities as observed at the Trutier site in December 2011. The various facility sizing estimates are based on a single waste characterization study that, when projected over a year, concludes the total quantity of waste collected at the Trutier site is 238,345 tonnes/year. A recent but temporary increase in waste collection in the Port-au-Prince area resulted in significantly
2
more waste being collected (as much as 40% more) [1]. This change reveals the variability of the conditions in Haiti, underscoring the level of uncertainty in determining the appropriate project size.
• The optimal WTE technology. The preferred technology is heavily dependent on the caloric value of the waste stream, which was evaluated during a single waste composition study conducted in October 2011. The use of thermal technologies, such as incineration, is more commonly used for waste-to-energy production in developed countries worldwide. However, thermal technologies are very sensitive to the energy value of the feedstock, which is significantly reduced with the presence of high moisture content. The waste characterization study indicated the waste delivered to the Trutier site contains a high proportion of moist organics, which favors the use of anaerobic digestion as the preferred technology for a WTE system.
• The seasonal variability of the waste. Additional waste characterization studies are needed to evaluate seasonal variations in the composition and quantity of the waste stream, which could influence both the choice of technology and size of the facility.
• The potential impact of unpredictable catastrophic events (earthquakes and hurricanes) in the waste collection system and to the site.
• Unknown site conditions at Trutier as they pertain to subsurface stability for seismic events and possible flooding events.
• Uncertain legal and permitting requirements, which can affect the facility cost and development schedule.
• The cost of both skilled and unskilled labor. Because Haitian costs were unavailable, this report uses U.S. mainland costs. While the dramatically lower cost of unskilled labor in Haiti is significant and will improve the attractiveness of the project, the cost of skilled labor for both the capital cost and ongoing operational costs could be significantly higher if the skilled workers needed for the project have to be imported or trained, and could have an offsetting effect on the project's financial viability.
• The cost of shipping construction materials to Haiti, including docking fees, unloading, and related transportation to the project site has not been addressed in this report as those costs could not be determined with certainty.
• The cost of supporting the ongoing operations over the life of the project, including the execution of routine and periodic equipment maintenance, parts availability, etc., has not been addressed.
• Sales of digestate as an agricultural and forestry amendment is assumed to merely offset the cost of trucking and mechanical spreading of the digestate, but it is possible the digestate has greater value than this.
• The uncertain cost of disposing of residue, rejects, and the remainder of the waste stream that the AD system would not treat, which was assumed in this report to be $7/tonne.
• The composition of the project implementation team. • The challenges with securing project financing in a politically and economically
unstable country.

3
• The uncertain price of electricity in an eventual power purchase agreement (PPA) with the local utility, which will affect project economics. The analysis in this report assumes the WTE plant's electricity will be sold at 20 cents/kilowatt-hour (kWh). The utility is currently paying between 16 cents/kWh and 34 cents/kWh under existing PPAs. NREL chose an electricity price at the lower end of the current PPA range out of concern for the ability of the local utility to sustainably afford high payments. If a higher rate could be charged, it would improve the financial prospects of the facility.
1.2 Technologies for Converting Waste to Energy There are several different methods of converting municipal solid waste (MSW) to energy. The two primary categories of treatment processes that are employed commercially include thermochemical conversion and biochemical conversion.
Thermochemical conversion is when heat is applied to the waste, either combusting or gasifying the waste, converting the carbon in the waste into heat or a carbon-rich gas that can be subsequently converted to energy. Thermochemical conversion technologies include mass burn (combustion of unsorted waste); refuse-derived fuel (RDF), which includes presorting, drying, and densification into a pelletized fuel as a coal replacement; gasification; pyrolysis; and plasma gasification. These technologies typically require a fairly dry material; as moisture content increases, the available energy within the fuel decreases until, at about 65% moisture content,1 the useful energy available within the fuel approaches zero.
Biochemical conversion is when bacteria are allowed to consume the organic materials present in the waste under oxygen-deprived conditions, thereby producing gaseous emissions consisting primary of methane and carbon dioxide. Biochemical conversion technologies include tank-type anaerobic digestion or landfill-type decomposition. The primary biochemical conversion method used with MSW in the United States is the entombment of waste in a landfill that is equipped with a landfill gas recovery system and a LFGTE facility. This involves burying the waste within cells, where it is broken down by biological processes over an extended period of time. The decomposition process produces landfill gas, which is collected, filtered, dried, and pressurized for use in a gas engine or turbine. Although this process is biochemical, it is referred to as "decomposition" because of the long duration of the process (typically decades). Anaerobic digestion also employs a biochemical process, but the process occurs much more quickly, and is performed in enclosed tanks, bunkers, or covered lagoons as opposed to a landfill cell. All of the anaerobic digestion systems that use tanks, bunkers, or covered lagoons are referred to as biodigesters. Both AD and LFGTE methods are examined in more detail throughout this report.
1 In this document, moisture contents (MC) are expressed on a wet basis (wb); that is, MC, wb = (weight water)/(weight water + weight dry matter).

4
The primary differences between thermochemical and biochemical conversion are the operating temperatures, feedstock, gaseous emissions, and residues, as follows:
• Operating temperature. Thermochemical processes require temperatures ranging from 800°C to 1500°C in order to burn or gasify the waste. To maintain a healthy bacterial community, biochemical processes operate at “living temperatures” ranging from 37°C to 65°C.
• Feedstock. Thermochemical processes function best using dry, carbon-rich feedstock (wood, plastics, paper, etc.). Biochemical processes function best using easily digestible feedstock (food, grass, manure, etc.).
• Gaseous emissions. Thermochemical processes produce either combustion gases or synthesis gases, both of which require robust emission control systems. Biochemical processes produce biogas consisting of methane (natural gas), carbon dioxide, nitrogen, and other trace constituents, necessitating less robust emission control.
• Residues. Thermochemical processes produce ash, slag, char, and other products of high temperature/combustion-type processes. Biochemical processes produce undigested materials, mostly the fibrous portions that the bacteria could not digest, which if free from inert materials (glass, metals, and plastics), can be processed further into compost for agricultural purposes.
1.3 NREL Desktop Study In November 2010, NREL staff completed a desktop study titled Haiti Waste-to-Energy Opportunity Analysis2 (an internal project report) for DOE's Office of Energy Efficiency & Renewable Energy. The study did not include a waste characterization study, instead relying on publicly available documents. It analyzed three technologies (combustion, gasification, and anaerobic digestion) that could be deployed at various sites around Haiti for their potential to meet, or help meet, two objectives:
• The collection and disposal of MSW
• Provision of electricity for the local grid. The three technologies operate as follows:
• Combustion systems burn the waste in the presence of oxygen to produce heat. • Gasification systems heat the waste in the presence of a limited quantity of
oxygen to produce a gas that can be combusted. • Biodigesters utilize bacteria to break down biologically available waste into
methane and carbon dioxide gases. This gas mix can then be combusted.
The desktop study determined the composition and characteristics of the waste generated in Haiti in general, and in Port-au-Prince specifically (primarily wet food
2 Prepared under task number IGIN.9F06.

5
waste), are best suited for conversion to energy through AD, rather than through combustion or gasification, due to the high moisture content of those wastes.
The study estimated that the waste stream in Haiti would contain between 65% and 75% organics, primarily in the form of food waste. Food waste typically does not make good fuel or feedstock for combustion or gasification systems, because the waste has high moisture content. The food waste would likely need to be dewatered, either mechanically or thermally, to make combustion or gasification a viable option. This would require a significant amount of energy. Food waste is an ideal energy source for the biodigestion process; however, because performance is not affected by moisture content. Furthermore, the biodigestion process produces digestate, which can be used as a fertilizer to increase crop yields.
Based on the composition of the waste produced, as well as the scalability and versatility of the systems, the authors of the desktop study selected biodigesters as the most viable option for a WTE project in Haiti. They also noted any WTE project would need to be coordinated with a robust waste management program, and integrated with energy planning and development efforts. The desktop study also concluded, “Additionally, biodigesters present a solution to the issue of human waste management, which is one of the biggest problems affecting Haiti today.”3
1.4 UNOPS Waste Characterization Study A waste sort analysis (WSA) was conducted by UNOPS in October 2011 in conjunction with NREL and with guidance from an engineering firm, HDR Inc. The goal of the WSA was to characterize the wastes generated in Port-au-Prince to evaluate their suitability for AD. The AD process is used for converting organic materials to biogas (and byproducts); the WSA identified and quantified the composition of organic and inorganic matter in waste delivered to the Trutier waste site.
The WSA was conducted over an 11-day period at various waste collection points. Samples were collected from a total of 285 incoming trucks carrying waste from different areas of Port-au-Prince. Each sample was weighed and then sorted into 11 categories. Of the 11 defined waste categories, only the ones listed in Table 1 are suitable for digestion. They were found by the WSA to constitute the MSW in the mass percentages indicated in Table 1. Additional details about the waste composition can be found in Section 2.3.1.
3 As mentioned below, sewage treatment plants are being constructed throughout Haiti to deal with human waste, so it is not included in this analysis.

6
Table 1. Suitable Waste Categories and Percent Constituency of MSW
Waste Category Percent of Total Mass (%)
Food and misc. organics 54.8
Paper 10.6
Textiles 6.5
Wood 1.9
Total organic waste 73.8
The other seven categories (see Table 3) are inorganic and could not be digested for biogas.
The WSA indicates slightly more than half of the MSW collected in Port-au-Prince is food waste (54.8% of total mass). Of the other organic materials, there is some question about whether there might be technical challenges with digesting the textiles or wood waste in an anaerobic digester.
Additional testing of 10 sorted organic waste samples was performed to estimate the samples’ total solids (TS) content (which determines water content) and volatile solids (VS) content (expressed as a percentage of TS).
The WSA study report is included in Appendix B.
1.5 UNOPS Truck Monitoring Study The waste sort analysis did not include an estimate or measurement of the typical quantity of waste received, so a separate truck monitoring study was conducted by UNOPS in December 2011. The results of that study are included in Appendix C and used throughout this report, along with the WSA data, to determine an appropriate system size and potential energy production from AD and landfill gas (LFG).
The truck monitoring study indicates about 4,571 tonnes (metric tons) of waste is delivered to Trutier each week, for an average of 653 tonnes per day. There is considerable uncertainty about this number, partly due to it being derived from a single truck monitoring period of five days, to the waste tonnage being derived from an estimate of waste volume per truck (multiplied by an assumed density), and to the effects of moisture content on waste density.

7
2.0 Waste Generation, Characterization, and Collection
Exact figures for waste generated and collected in Haiti are not available. It has been estimated that 0.6 kilograms (kg) to 0.7 kg of waste are generated per capita, per day in Port-au-Prince [2]. It has been variously estimated that only 20% [3] or 22% [2] of the waste generated in the Port-au-Prince region is collected and delivered to the Trutier waste disposal site.
Waste delivered to Trutier was measured by UNOPS over a period of five days in December 2011. A report on the truck monitoring study is included in this report as Appendix C. This study determined, for that specific monitoring period, an average of 653 tonnes of MSW per day was delivered to Trutier. UNOPS performed a separate study during 10 days in October 2011 to determine the composition of the waste. This study, included in Appendix B, estimated that roughly 55% of the waste collected was "organics" (food waste), 11% paper, 7% textiles and 2% wood (to the nearest 1%). The remaining components are not suitable for conversion to biogas in an anaerobic digester or in a landfill.
Some of the material was analyzed to determine total solids and volatile solids, as shown in Table 2. These measures are important for determining potential biogas production and will influence the design of the digester equipment.
Table 2. Organic Materials Summary—Total and Volatile Solids
Summary Total Solids Volatile Solids (% of TS)
Samples Average Standard Deviation Average Standard
Deviation
Textiles 53.8 12.9 87.4 7.6
Paper 45.7 9.5 86.0 9.3
Wood 68.8 12.5 88.7 7.1
Organics 18.3 4.5 84.3 5.7
2.1 Haiti's Waste Management Authority Service Metropolitain de Collecte des Residus Solides (SMCRS) [3] is the state-appointed agency that collects and disposes of solid waste in the greater Port-au-Prince area, which includes eight cities and a population of about 2.5 million. SMCRS reportedly has approximately 1,200 employees and an annual budget of about $2.4 million.
Since the earthquake, SMCRS has been operating 24 hours per day, servicing eight routes every 12 hours. Their current fleet includes 34 45-cubic-meter rear-loading compactor trucks and 14 open-bed trucks. They also have 307 4-cubic-meter and 20-
8
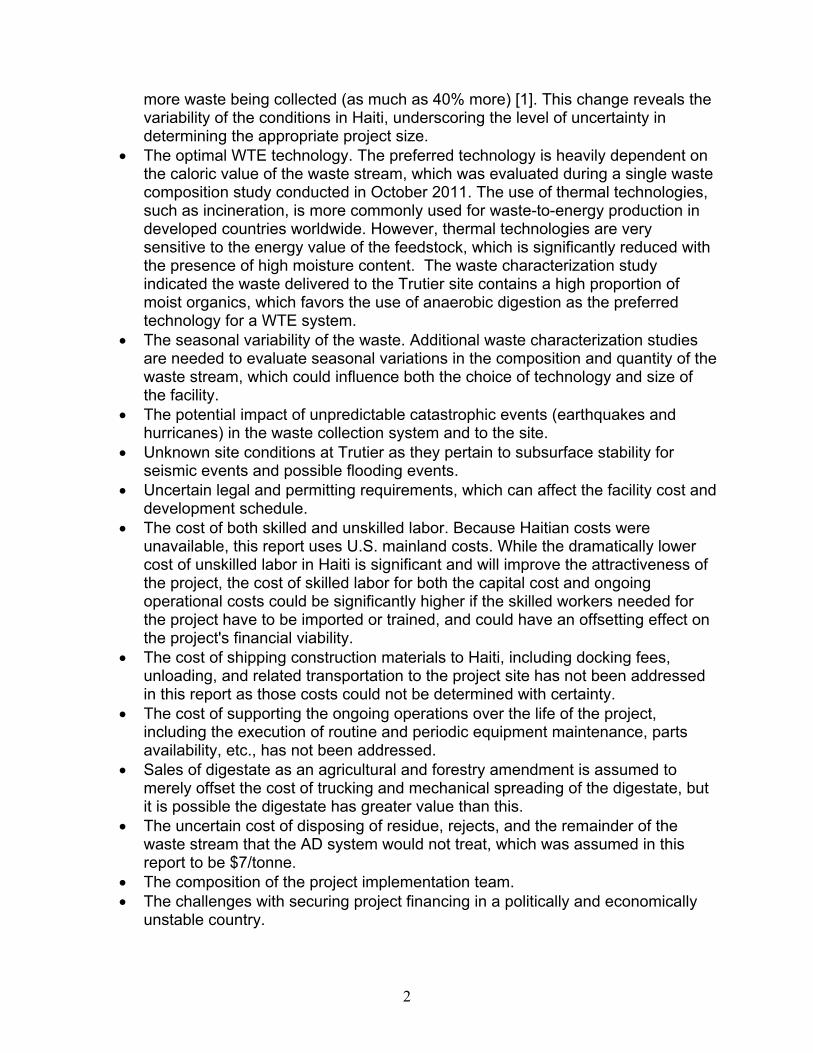
cubic-meter dumpsters available that have not yet been deployed for waste collection. Their equipment maintenance program is reportedly poor. SMCRS owns and operates a waste disposal site about 5 kilometers north of the city. Figure 1 gives an overview of the solid waste management sector.
Figure 1. Solid waste management sector in Haiti
2.2 Waste Generation The Solid Waste Association of North America (SWANA) published a position paper titled Municipal Solid Waste Collection Needs in Port-au-Prince, Haiti in August 2010. SWANA reported that 1,400 to 1,600 tonnes per day of solids waste is generated in the Port-au-Prince area [3].
The NREL desktop study [4] noted that:
"The population in Haiti is expected to grow substantially over the next 40 years. The projected compound annual growth rate from 2010 to 2050 is approximately 0.8%. This growth will increase waste generation rates, sanitation issues, and power demands."
The past population and future growth estimate from the U.S. Census Bureau for Haiti is shown in Figure 2.

9
Figure 2. Population growth estimate for Haiti Source: U.S. Census Bureau (www.census.gov/population/international/data/idb/region.php)
2.3 Waste Collection Only a portion of the waste around Port-au-Prince is currently being collected and delivered to Trutier. Some of the remaining waste is being left in the streets, and some ends up in canals. The waste in the streets is often burned in open piles. When the rains come, some of the waste in the canals washes out to the ocean. The SWANA report indicates that “Even if its equipment is fully operational and sufficiently staffed, the SMCRS is only able to collect about 20% of the MSW that is generated in Port-au-Prince on a daily basis [3].”
2.3.1 Waste Components and Characteristics
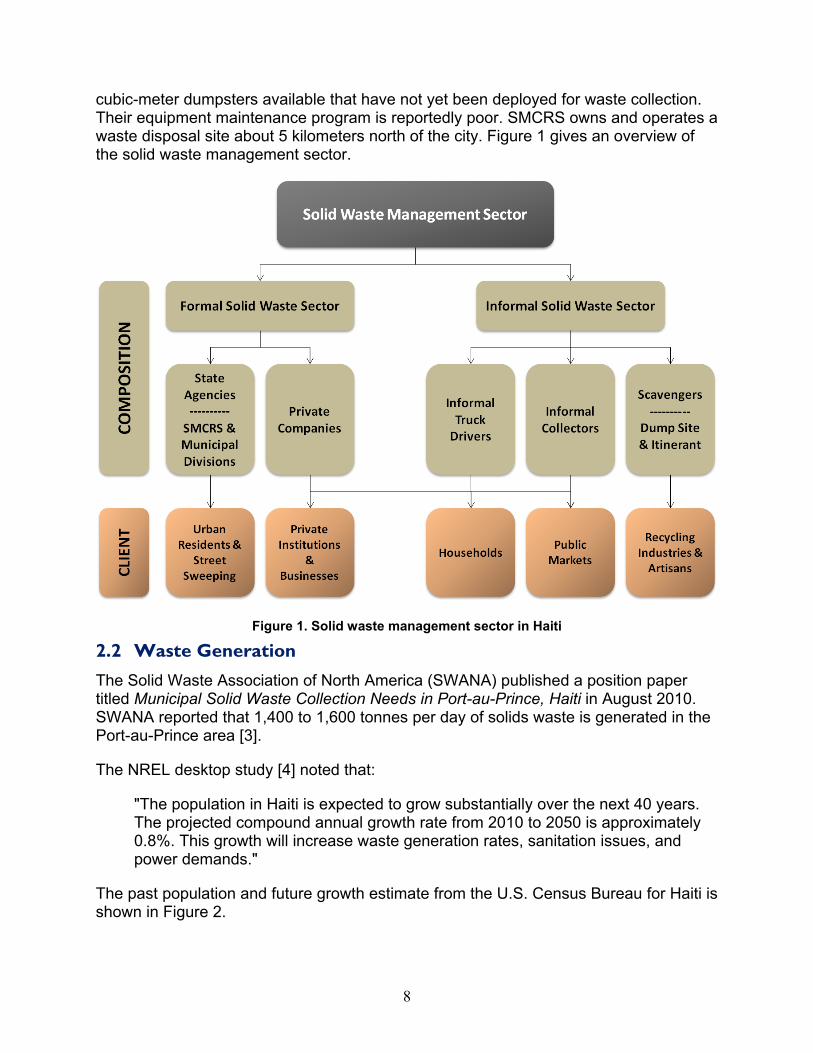
A categorical summary of the WSA for all waste collected is presented in Table 3. The results for each category are expressed as a percent of total waste collected, rounded to the nearest 0.1%. Category numbers do not add up to 100% due to rounding.
10
Table 3. Summary of Constituents of Waste Collected in the Port-au-Prince Area
Waste Category Percent of Total (%)
Food and misc. organics (organic) 54.8
Paper (organic) 10.6
Textiles (organic) 6.5
Wood (organic) 1.9
Organics Subtotal 73.8
Plastic 13.8
Debris 4.8
Other 3.2
Glass 2.3
Metal 1.4
Electronics 0.4
Hazardous Waste 0.2
Grand Total 100
Table 3 shows that just over half (roughly 55%) of the waste collected is essentially food-based organic waste and almost three-quarters of the waste is organic in nature. Total waste collected is 653 wet tonnes per day. Total organics collected amount to about 482 wet tonnes per day.
Moisture Content
Testing was conducted to determine the levels of TS and VS for the organic waste sort materials; test results are summarized in Table 4, rounded to the nearest 1%. Data presented in Table 4 include the averages for 10 analyses that were conducted for each waste constituent. The combined organic wastes, based on the WSA analysis, would have 27% total solids (i.e., a moisture content of 73%) and a ratio of VS to TS of 85%.
Table 4. Total Solids, Moisture Content, and Volatile Solids of the Waste Organic Materials
Organic Waste Components TS (%) Moisture Content (%)
VS (% of TS)
Textiles 54% 46% 87%
Paper 46% 54% 86%
Wood 69% 31% 89%
Food-Based Organics 18% 82% 84%
Total Combined Organics 27% 73% 85%
11
Energy Content
The energy that can be derived from the organic fraction of the waste depends on the conversion system used—either AD or LFGTE. These two systems are detailed in Section 4.0, including expected electricity production potential.
2.4 Valuable Uses for the Waste Stream This section discusses possible uses for the valuable components of the waste collected in the Port-au-Prince area.
2.4.1 Recycling
Some of the materials collected and delivered to Trutier are suitable for recycling. Removing plastics, metals, and glass for recycling provides a higher value for those materials and, as they are not suitable for AD or LFG production, removing them from the waste stream will not negatively impact energy production. In fact, these materials must be removed prior to introduction of waste to an AD system or the system will not function properly. Removing paper and cardboard would decrease gas production, but not significantly.
The NREL desktop study, combined with further investigation, indicates there is no formal government recycling program in Haiti, but that there are for-profit businesses that recycle, and that most of the materials are collected by individuals and delivered to these businesses.
UNEP [6] has determined “there is an existing but weak plastics recycling private sector. This should be strengthened on a one-time basis with seed-funding grants allocated on a competitive basis and access rights to waste aligned with the planned new infrastructure.”
At the Trutier waste site, NREL staff observed large piles of plastic bottles that had been separated from the trash for later transport to recyclers. There were also fires observed at the site. Evidence indicates that tires and wire cables are often burned to enable collection of the metal bands or wire for recycling.
2.4.2 Green Waste
The majority of the energy potential from the solid waste in Haiti in an AD system will be from food waste. Some of this food waste might have value as livestock feed.
When NREL staff visited the Trutier site in August 2012, the American contractor operating the site, Ceres, informed them that local people bring their livestock (primarily goats and pigs) onto the site to eat green waste. NREL confirmed the presence of goats at the site but could not determine the portion of waste that might be removed in this fashion. This warrants further investigation.

12
2.4.3 Human Waste
In 2010, when the NREL desktop study was published, no wastewater treatment facilities existed in Haiti. In Port-au-Prince, sewage was collected by trucks and taken to Trutier. The estimated amount of sewage spread on the dump at that time was 91 cubic meters (24,000 gallons) per day. There was some consideration to add the sewage waste to an anaerobic digester, but in May of 2012 a new wastewater treatment plant was opened roughly 8 kilometers (km) north of Trutier. This plant treats 900 cubic meters of sewage per day and converts it to clean water [7].
The waste is brought to the treatment plant by truck. The sludge produced as a byproduct of wastewater treatment will be used for agricultural compost. Additional sewage plants are planned for Port-au-Prince and other Haitian cities [8].
2.4.4 Effluent and Digestate
In a typical anaerobic digester, about 30% to 50% of the initial feedstock mass remains as a wet slurry called digestate. The digestate will typically be 70% to 90% water with the rest as solids. For reduced handling costs, the moisture content is typically reduced, either through mechanical filtration (belt filter/filter press) or by drying in evaporation ponds. Once the digestate has been dried, its characteristics match that of typical compost, with high portion of organic matter. Anaerobic digesters produce digestate with very good fertilizing properties due to the high nutrient content available in the waste. The level of effort necessary to make the digestate material suitable for the compost market depends on the feedstock and the screening processes used prior to digestion [4].
Large-scale production and distribution of soil amendment could improve farm productivity and hence increase food production.
In August 2012, NREL staff observed a pilot project at Trutier that was operated by Sustainable Organic Integrated Livelihoods (SOIL), a Haiti-based organization that distributes composting toilets and specializes in producing compost from a mix of toilet waste, animal waste, and sugarcane bagasse. NREL contacted the director, Sasha Kramer, to discuss SOIL’s work in Haiti and potential beneficial uses of the digestate and effluent that would be produced by an AD system. Discussions with SOIL are ongoing.

13
3.0 Trutier Site Details and Characteristics This section details the selection of Trutier for the location of a WTE facility and provides some details about the site. A potential AD facility layout is also provided.
3.1 Initial Site Assessment NREL and HDR Engineering Inc. performed an initial site assessment in September 2011 in which six potential sites around Port-au-Prince were evaluated as potential locations for an AD facility. The sites were compared, and the preferred site was identified to be a portion of the Trutier waste disposal site. Table 5 shows the sites considered and the final ranking.
Table 5. Sites Included in Initial Evaluation
Site Ranking
Site Number
Site Name/Location
1 6 Trutier
2 5 Morne Cabri
3 1 Rue de Frere, Tabarre
4 4 Near Morne Cabri
5 2 Rue Lespinasse, Tabarre
6 3 Rue Roumain, Tabarre 27
Figure 3 shows the sites and the categories by which they were rated.
Figure 3. Comparison of sites by category Source: NREL and UNEP

14
A secondary conclusion of that study is that the Morne Cabri (Site 5, ranked #2) human waste treatment site could be considered for a small anaerobic digester plant. This land is owned by DINEPA, and a digester could effectively increase the capacity and life of the human waste treatment facility.
The Trutier waste site is operated by SMCRS, which is an autonomous entity under the Ministry of Public Works. Public Works provides technical advice and guidelines, and the Ministry of Interior provides funding for SMCRS.
The waste site formally employs 76 people on their payroll and over 100 informally. It operates 24 hours a day. Waste sorting is done by people who have taken up residence at Trutier, though they are not employed by SMCRS—they earn their living by recovering and reselling materials. The typical process is that trucks dump their loads on top of the MSW pile, plastic bags are torn open, and plastic bottles, glass, metals, and fabric are separated by hand. All of the recycled materials are sold to local merchants, who collate, bail, and ship the materials off the island. Cardboard and paper are recycled to some extent, and plastic is burned. Wet organic matter either rots or is eaten by the many pigs and goats on site [10].
There is currently no fee charged to trucks dumping at the site. In many areas of the world, tipping fees are usually charged to trucks unloading at a waste disposal site, and these fees are used to offset the cost of operations. Concern exists in Haiti that an imposition of tipping fees will increase the amount of illegal dumping and decrease the amount of material received at Trutier; currently, all dumping is funded by the Government of Haiti (GOH) or donor organizations. Scales are present at the site, but it could not be confirmed the scales are working.
In addition to operating the waste site, SMCRS also operates approximately half of the trucks unloading at the facility.
SMCRS has indicated interest in a WTE plant being located at Trutier, and has confirmed it is possible for them to own and operate a power generation facility [9].
3.2 Maps, Drawings, and Coordinates Relatively recent (2010) high-resolution maps of Trutier are available from Google Earth, as shown in Figure 4 and the following sections. Additional maps are included in appropriate sections of this document.

15
Figure 4. Satellite view of Port-Au-Prince, showing location of Trutier Source: Google Earth
3.3 Current Trutier Site Operations and Layout Until recently, Trutier operated as a waste dumping site. In 2012, NREL staff noticed some areas of the site are being operated as an unlined landfill, with layers of trash deposited in mounds and then covered with a layer of crushed rock.
The Trutier site covers 250 hectares (approximately 618 acres), of which about 50 hectares is currently developed [11]. Dumping is divided into areas reserved for MSW, medical waste, and rubble.
Figure 5 and Figure 6 show Google Earth views of the Trutier site. The red “A” label is the approximate entrance to the facility.

16
Figure 5. Trutier satellite view #2 (medium zoom)
Source: Google Earth
Figure 6. Trutier satellite view #3
Source: Google Earth
17
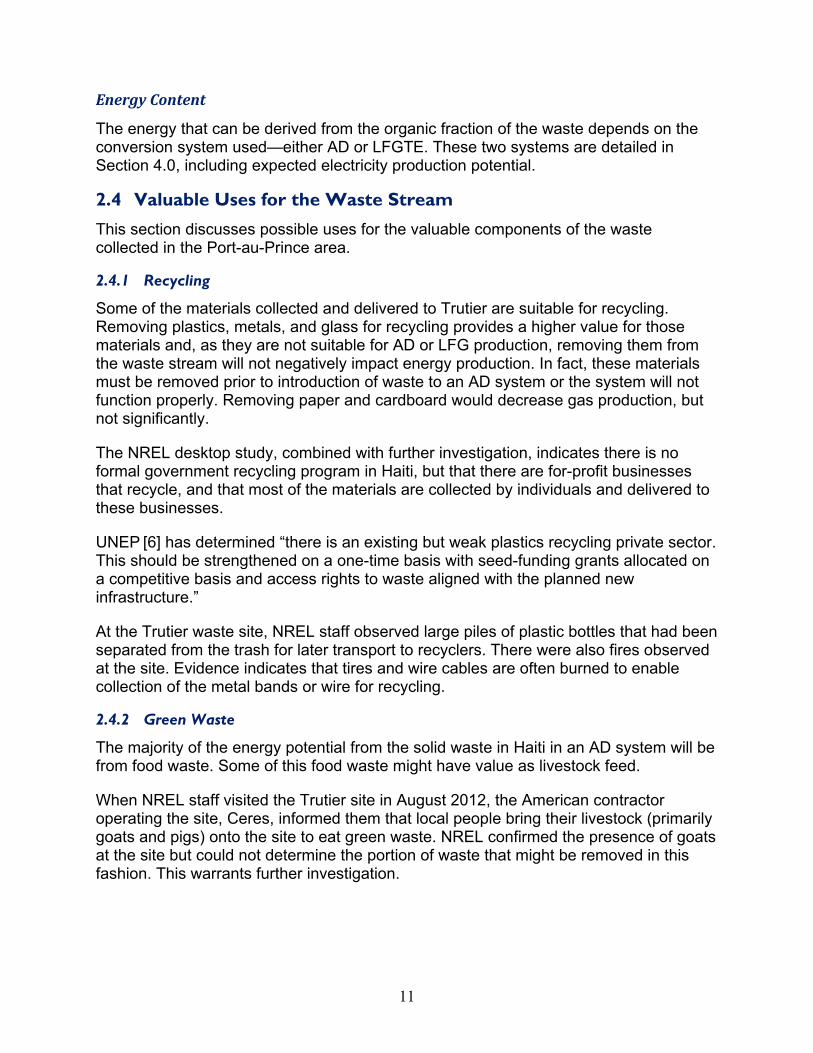
Figure 7 is from a World-Bank-funded Trutier environmental site assessment, prepared by Integrity Disaster Consultants LLC in December 2010. The orange line shows the then-current boundary of the MSW pile. This pile has since been consolidated, with MSW primarily south of the access roads and building rubble to the north. [12]
Figure 7. ICH Trutier drawing and site layout Source: Integrity Disaster Consultants
3.4 Potential Location for Anaerobic Digestion Facility It is proposed to place the AD system in the western loop, between the northern and southern access roads, near SB-16I, as shown in Figure 7. This is also the location of the former septic waste disposal, as shown in Figure 8. This has since been closed and filled in; testing of the soils in this area is recommended before selecting this as a final site location.

18
Figure 8. Trutier west loop and site of former septic disposal site Source: Google Earth
Siting of the WTE project at Trutier needs to be further evaluated with input from SMCRS and the current operators of Trutier once fundamental issues of feasibility have been resolved. In addition, site control options need to be discussed with SMCRS to determine the appropriate use model (lease, easement, or other vehicle to officially establish legal rights to utilize space at Trutier) if the project is to be owned by a private developer.
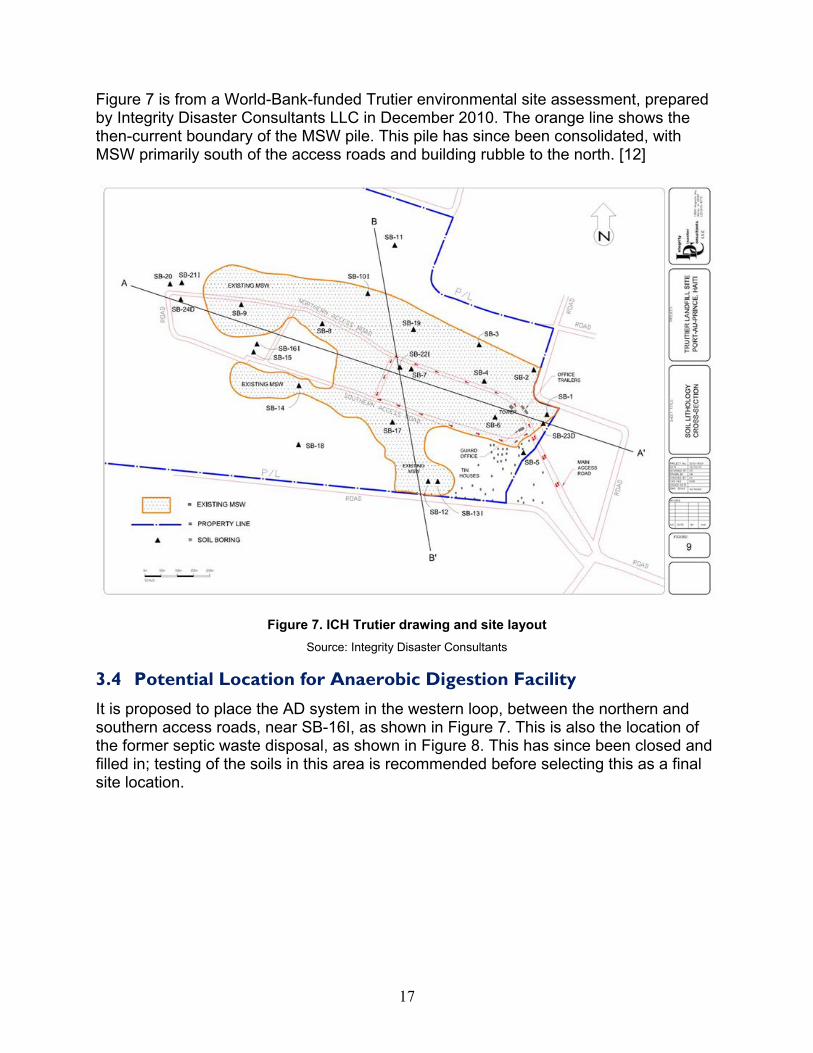
For purposes of the initial analysis, HDR developed a site layout showing the approximate size and shape of an AD system, and overlaid it on an image of the Trutier site (see Figure 9).
19
Figure 9. Potential location for and layout of an AD facility at Trutier

20
4.0 Anaerobic Digestion and Landfill Gas-to-Energy: Technical Details
This chapter builds on the prior analyses performed by the project team, following a subsequent, more-detailed analysis of the technical and economic feasibility of constructing a large-scale AD facility in Haiti.
This chapter also includes consideration of the use of a sanitary landfill equipped with a LFG collection system and a LFGTE system as a possible alternative to the implementation of the AD facility in Haiti. This alternative is included to reflect the reality that the predominant waste management method in the United States is disposal of solid waste in sanitary landfills. Also, the extraction of LFG and subsequent conversion to electrical energy is a common practice in the United States which, if employed in Haiti, would reflect a significant improvement to the current open dump/unlined landfill waste disposal methods, as well as add a renewable energy source to Haiti’s electric grid.
4.1 Anaerobic Digestion Prior to anaerobic digestion, the waste collected from the region would require presorting to remove objectionable materials. The importance of sorting materials is higher for anaerobic digestion than other WTE technologies. Therefore, the first step is material sorting to remove inorganic materials and recycle those materials with value. This step can be automated, to some extent, or can be a manual operation. For an application at Trutier, a mostly manual system is recommended and described in more detail below.
Following presorting, the organic materials are placed into a digester, where microorganisms break down the material and produce a biogas that is high in methane. Other components of the biogas include carbon dioxide and small amounts of other materials.
The biogas produced by digestion is captured and can be used to produce energy through:
• Steam for electricity production. The biogas can be combusted to provide heat for steam to drive a turbine that is coupled to a generator for power production.
• Gas turbine or internal combustion (IC) engine for electricity production. The biogas can be conditioned and serve as fuel for an IC engine or gas turbine, linked to an electrical generator for power production.
• Fuel cell for electricity production. The biogas can be conditioned and serve as fuel for a fuel cell. This option requires more stringent cleanup of the gas, compared to using a gas turbine or IC engine.

21
• Energy storage or off-site electricity production. The biogas can be stored for later use or transferred to another location,4 such as the nearby E-Power generation station.
Similar to syngas produced from gasification, the products of anaerobic digestion are captured, and the only resulting emissions come from the eventual combustion of the gas.
In addition to the waste composition and collection rate discussed in Section 2.0, the following factors and assumptions influenced the design and analysis of the digester system:
• Power is available at or nearby the site for powering facility electrical components.
• Natural gas is not available at the site. • Potable water is not available at the site, but a well can be drilled to provide the
water necessary for maintenance and facility operation [12]. • AD effluent, or digestate, will be dewatered to yield a digestate solid stream and
a liquid effluent stream (centrate). • A sanitary sewer is not available at the Trutier site or in its vicinity. Therefore,
centrate from the AD facility may be land-applied or discharged to an evaporation pond near the site.
• Biogas will be burned in IC engines to produce electricity. • Electricity will be wheeled to the power grid that is near to the site, but may
require an interconnection extended to the specific location of the power-generating system at the site.
4.1.1 Summary of Anaerobic Digestion Equipment: Conceptual Design
For the purposes of sizing equipment, estimating costs, estimating water use and digestate production, and other factors, an AD system was designed based on the selected site and available waste. This conceptual system is detailed and analyzed in the following sections.
Unit Process Description and Sizing
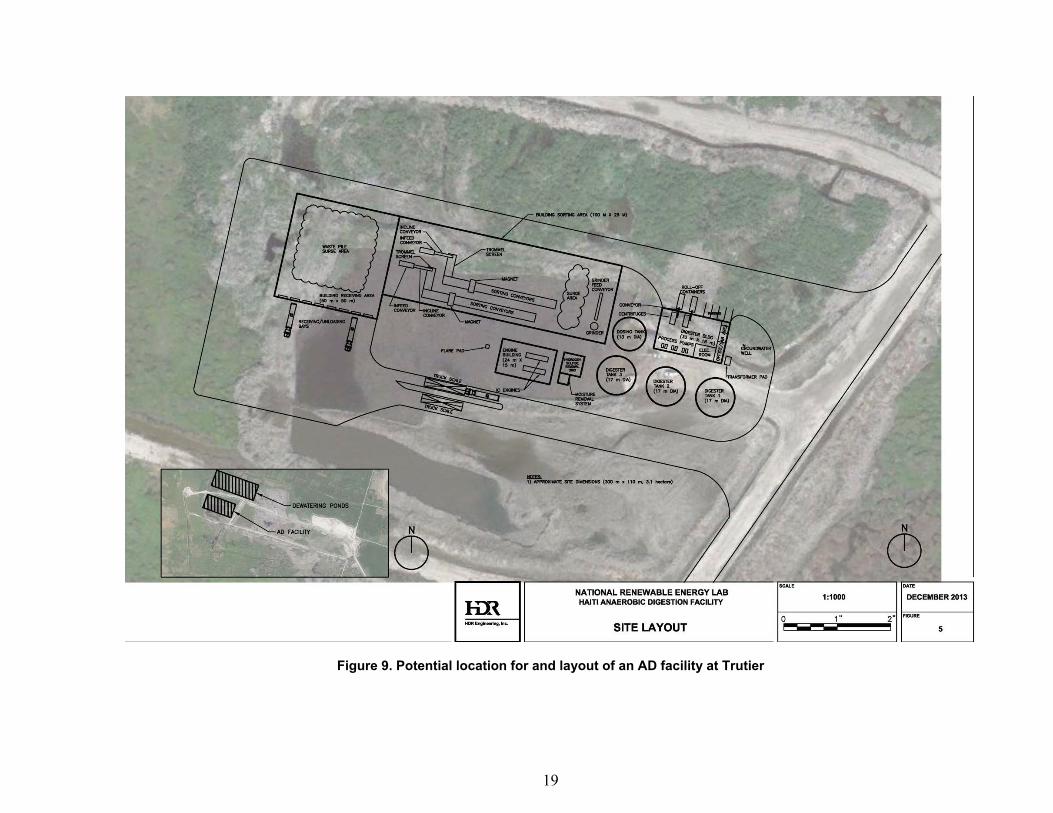
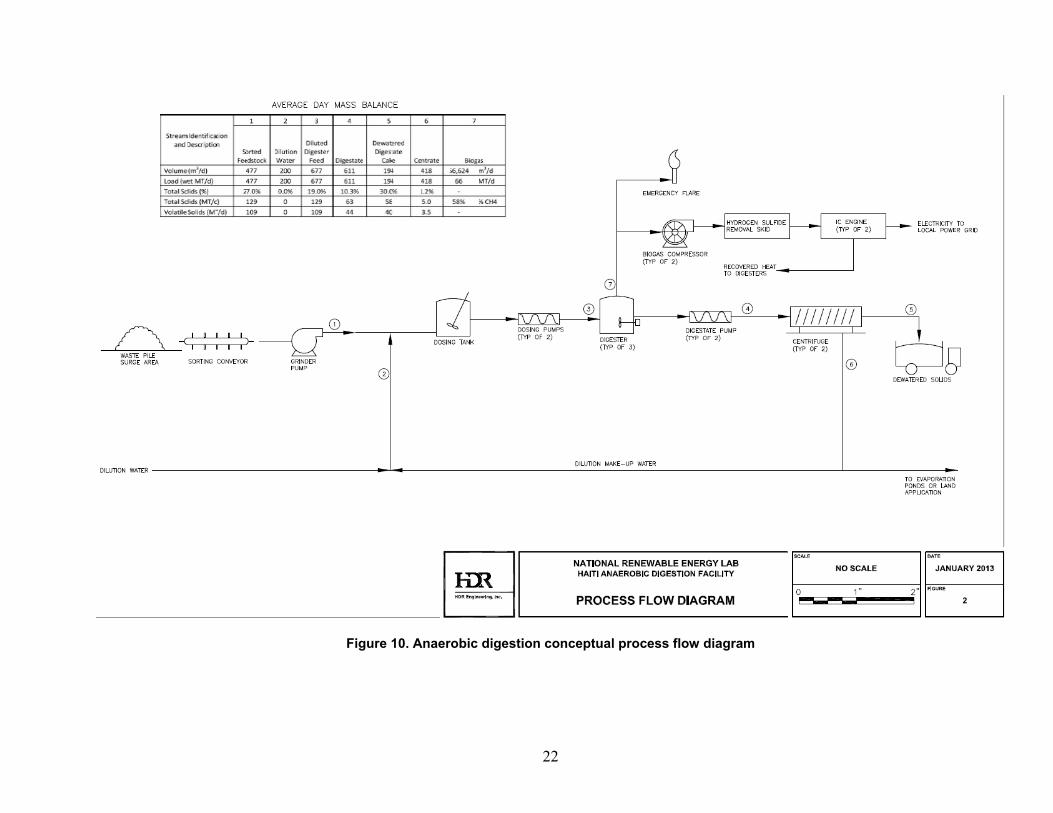
The AD conceptual facility design includes four major processing areas: materials sorting and recovery, digestion, digestate management, and biogas management and power production. The size of each processing area is based on the amount and composition of MSW available. A process flow diagram depicting these processing areas is presented in Figure 10.
4 A concern with piping the gas off-site is that a digestion system typically uses waste heat from electricity production to maintain the digester temperature within a fairly narrow range. Shipping the gas off-site eliminates that local waste heat production.
22
Figure 10. Anaerobic digestion conceptual process flow diagram

23
Materials Sorting and Recovery Facilities
The waste streams that are brought to the AD facility need to be preprocessed in order to remove inert and undesirable materials and prepare the organic waste to be feedstock for the anaerobic reactors. The removal of undesirable materials is accomplished at the materials sorting and recovery facility prior to the digestion process. The materials sorting and recovery facility process described below is envisioned based on the expectation of quantity and types of waste that are received, as shown in the recent waste characterization, as well as on the labor resources that are assumed to be available in the local area.
Receiving and Surge Area
The MSW arriving at the AD facility would be directed to the receiving area, where the arriving vehicles will have their contents weighed at the entrance scale. A data management system will be employed (electronic or manual) to track the arriving vehicle information, including the truck’s empty tare weight if applicable, to be maintained in the system. After being weighed, the vehicle will be directed to the unloading area. The unloading area will be equipped with sufficient room to allow for truck maneuvering and backing into the appropriate unloading stalls. The maneuvering and backing is assumed to occur outdoors so as to minimize the roof canopy of the unloading/surge area. The receiving area will be equipped with eight unloading bays. This should accommodate the incoming vehicles, assuming the typical truck can unload its contents within 15 minutes, the truck arrivals are averaged over an eight-hour day, and the peak arrival rate is two times the average arrival rate. This results in a peak of 30 vehicles per hour. The additional bays are assumed to be provided in this conceptual design so as to avoid requiring collection fleet vehicles to wait to unload. The information available shows the peak arrival rate to be about 40 trucks per hour. In these cases, some trucks would need to wait in a queuing area until a bay is available for unloading. The trucks that do not have an empty tare weight on record will need to be re-weighed at the exit scale upon leaving the facility.
After unloading, the waste material will be consolidated in a “surge area.” The surge area is where the material is consolidated and then fed into the materials sorting and recovery area for the removal of inert and undesirable materials. Occasional maintenance, differences between the conveyor process rates and the waste arrival rates, and other related issues create the necessity for a surge area. The surge area will be sized to accommodate the quantity of an average weekday waste arrival rate of 755 tonnes per day (assuming wastes are not collected on Sunday) or 653 tons per day if collected seven days per week. Waste material received at the facility will be consolidated using a front-end loader into a pile approximately two meters (m) deep to allow space for the front-end loader to maneuver and circulate around the pile.
The surge area is envisioned as a covered roof canopy without walls. The purpose of the canopy is to provide a covering for the waste materials during the rainy season so that the arriving waste materials do not become overly saturated before they are processed. For planning purposes, the roof canopy is ideally configured without internal columns in order to avoid vehicle encounters and to allow the area to be the most useful for pile management.
24
The receiving area should be approximately 50 meters wide to allow at least eight collection vehicles to unload at the same time. The surge area should be approximately 2,500 square meters (m2) to accommodate the peak arrival of waste and allow for maneuvering area around the pile for front-end loaders to manage the pile.
Preparation of Feedstock
Before digestion of the wastes, the MSW will be processed into a feedstock appropriate for the anaerobic digestion process. The first step in this process is to remove inert and undesirable materials (metals, plastics, construction debris, etc.) from the waste stream. Although removal of inert materials could be performed using either mechanical or manual methods or a combination of both, systems that are primarily mechanical are assumed to be cost-prohibitive considering the availability of local labor. Consequently, this conceptual design relies on manual removal of inert and undesirable materials using elevated sorting conveyors combined with the use of screens to remove grit and related small-sized materials. The sorting area has been sized to initially include two identical materials sorting and recovery conveyor systems, with room for a third system.
For each materials sorting and recovery conveyor system, incoming MSW will be dropped into a hopper or an in-floor/in-feed pit equipped with a conveyor. The material will be fed to the conveyor belt or pushed into an in-floor conveyor equipped with a self-leveling device, feeding MSW onto the elevated sorting conveyor at a relatively constant rate. The conveyor will be equipped so that its speed is adjustable, allowing the depth of waste on the conveyor to be controlled and kept to a modest depth and at a modest speed, allowing workers to see and extract materials from the conveyor. A speed of approximately 0.20 m/second (s) is considered typical.
Each sorting line will have workers stationed on both sides of the conveyor and able to reach to the center of the conveyor from each side. The conveyor belt will be approximately 1-meter wide. The conveyor is elevated and equipped with platforms on both sides of the conveyor where workers will be stationed to extract inert and undesirable materials from the waste material on the conveyor. Beneath the elevated conveyor and sorting platforms are a set of bunkers equipped with bins. Workers will manually extract inert and undesirable materials from the sorting conveyer and place the inert and undesirable materials in a chute that directs the contaminant material to the bin below. Different workers will extract specific commodities (plastics, glass, etc.) so as to consolidate those materials of potential value separate from the remainder of the contaminant materials.
Each materials sorting and recovery system will be equipped with a screening device to remove fines, such as grit, dirt, broken glass, ceramics, and other small materials. For planning purposes, a trommel screen has been included on each line in the conceptual facility configuration. A trommel screen consists of a rotating drum with exterior screens that allow smaller items to pass through the screened sections as the device rotates. The screen could be configured for various sizes of fine materials, but would typically screen out materials less than 3 centimeters (cm). The screen would be located along the alignment of the sorting line, typically at the beginning of the line so as to remove fines from the feedstock prior to manual sorting. The fines will be inspected and if they

25
contain a high quantity of undesirable material, the fines will be disposed of as waste. However, if the fines contain mostly organic material, they could be added to the digesters.
The materials sorting and recovery systems are not completely efficient in the removal of undesirable materials, and therefore, some inert materials will pass through materials sorting and recovery and to the AD reactors. Some of the heavier inert material, such as grit and dirt, may settle to the bottom of the reactors. Some of the less dense materials may float to the top of the reactors. These materials will accumulate over time and warrant periodic reactor cleaning. Each reactor may need to be temporarily removed from service for cleaning. For planning purposes, it is estimated that cleaning will be required approximately once every two to three years.
The materials remaining on the conveyor lines should include organic materials, food scraps, paper, woody material, and textile materials. Food waste and related food preparation waste materials are the most biodegradable of these materials, while textiles, paper, and woody materials are less degradable. Projected biogas production rates for the Haiti facility account for the range of biodegradability of the different feedstocks.
Following removal of inert and undesirable materials, the remaining material should be of appropriate composition for digestion. Prior to digestion, the material will require size reduction by grinding. After the materials are discharged from the sorting conveyors, front-end loaders or similar equipment will be used to consolidate the material and move it to a second surge area and in-floor/in-feed conveyor system, which will feed the material into a device where it will be ground and blended with water into a pumpable mixture. This grinding step reduces the particle size of the material to enhance its digestion and simplifies conveyance of the material.
The entire materials sorting and recovery area will require approximately 5,000 m2 of space, which is envisioned to be covered with a roof canopy to provide a sheltered work environment for the workers to perform their duties out of the sun and rain. Note the area required for these activities is in addition to the 2,500 m2 needed for the surge area. A set of two elevated sorting lines, each equipped with an in-feed and incline conveyor, trommel screens, magnets, and sorting conveyors, would be constructed. Each sorting line would be approximately 50 meters long. The length is required to allow enough sorter stations to remove the undesired portion of the waste stream. Room for a third elevated sorting conveyor will provide potential for future expansion. The necessity of two shifts requires a well-lit working area for the sorters to perform their duties. The roof canopy is envisioned to provide support for the lighting system as well as possible ventilation systems. The grinder is assumed to be located outside the roof canopy or to fit within the 5,000 m2 roof canopy described above.
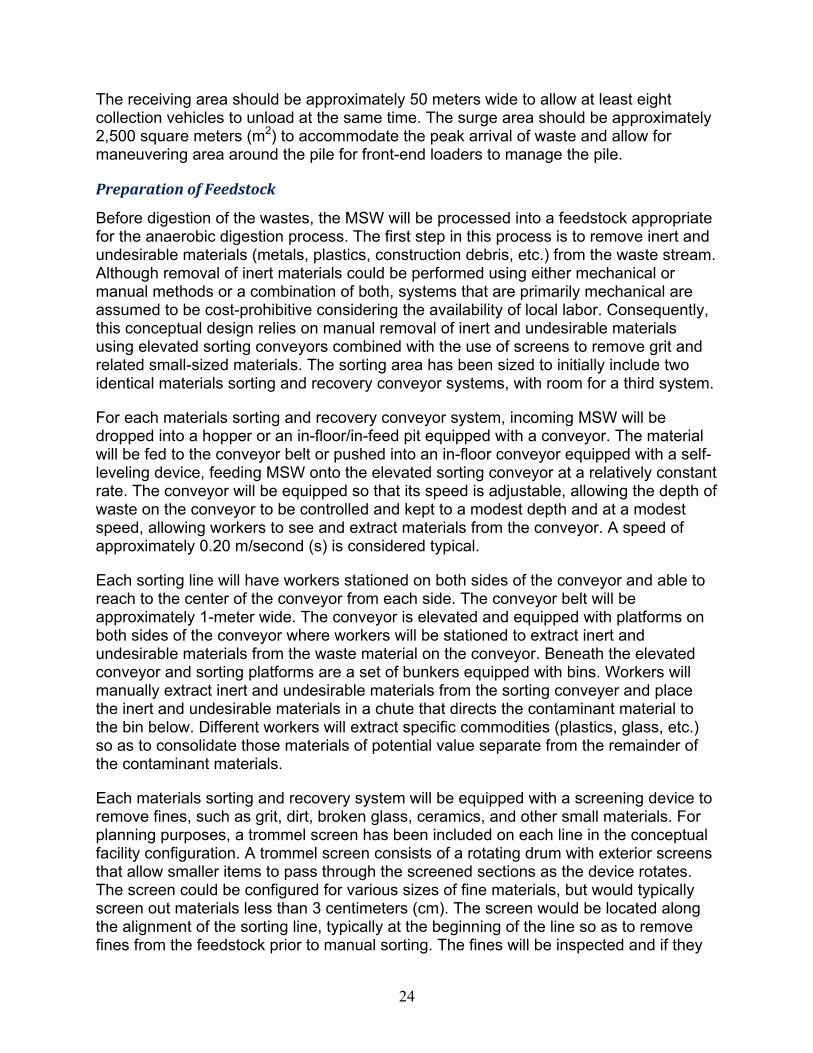
The project team has been informed there is an ample local labor force in the Trutier region, which is expected to be sufficient for the life of the project. For planning purposes, the presorting conveyors are sized to operate two shifts per day so as to minimize the capital investment of the materials sorting and recovery facility. For each
26
shift, a staff of approximately 51 sorters (separate from equipment operators, maintenance, and management) will be needed to extract inert and undesirable materials from the waste stream. The number of laborers is based on staffing levels for mixed waste manual recovery and could fluctuate depending upon the productivity of the workers and the contaminant level in the waste stream. Other staff requirements for the AD facility overall are described in more detail in Section 4.2. A typical sorting line is presented in Figure 11.
Figure 11. Typical MSW manual sorting lines (photo of the Western Placer Waste Management
Authority’s Materials Recovery Facility in Lincoln, California) Source: Tim Raibley, HDR Engineering Inc.
The operational success of the AD system depends on the thoroughness of the manual presort. Items such as rocks, metals, and plastics not removed during presorting will accumulate in the AD reactors and require that the AD reactors be removed from service for cleaning more often than the standard maintenance schedule. Frequent quality checks of the manual sort line are recommended to promote effective removal of all inert and undesirable materials prior to AD.

27
To the extent that human fecal matter is also included in the AD feedstock, the presorting of MSW would occur prior to the addition of fecal matter, so as to prevent human contact with fecal matter. It is assumed the fecal matter would be pumped into a receiving tank that would function somewhat like a septic tank. The receiving tank would be equipped with two compartments, the first of which would allow settling of solids and passage of the liquid into the second compartment of the tank. The liquids in the second compartment would be pumped directly into the reactors where they would be blended with the organic fraction of the MSW material.
Automated Presorting Option
The project team also explored the possibility of employing a materials sorting and recovery system consisting of primarily mechanical sorting equipment to perform the contaminant removal. For the most part, the separation of organics from MSW is an emerging technology, particularly when not using source-separated collection systems. Where organic materials are collected for processing (e.g., San Francisco, California, and Edmonton, Canada), the materials are separated at the source and contain relatively small quantities of inert and undesirable material as compared to the anticipated material in Haiti. However, for comparative purposes, the project team contacted representatives of the Dufferin Anaerobic Digestion facility in Edmonton, Canada. The Dufferin facility separates inert and undesirable materials from the organics in its waste stream using a mechanical system whose main component is a hydropulper. Using the Dufferin feedstock quality, moisture content, and throughput values as a base and scaling up to the Port-au-Prince waste characteristics, the project team prepared an estimate of the number of hydropulpers needed to perform the contaminant removal in Haiti. The result is that seven hydropulpers would be required, at an approximate cost of $1.5 million each, for a total of $10.5 million. For planning purposes, the team concluded the use of hydropulpers as the mechanical system to remove inert and undesirable materials would be financially unattractive, and therefore, not worthy of further consideration.
4.1.2 Digestion Facilities
The AD system is sized to process the average daily load expected at the facility. Based on the daily average of 653 tonnes and assuming 73.8% organics, the AD reactors are expected to process approximately 482 tonnes of organic feedstock per day. Calculations in this report assume all of the organic material in the waste stream is recovered during sorting and passed to the digestion facility. There is a possibility that some of the digestible material may not be recovered from the incoming waste due to potential inefficiencies in the presorting system; such inefficiencies should be modeled when conducting an investment-grade project feasibility study.
Once organics have passed through the materials sorting and recovery facilities, they will be conveyed at a TS concentration of approximately 27% from a feed hopper to a dosing tank using an auger. Provisions for adding dilution water to the incoming feed in the processing area will be provided to convey the material more easily and allow better mixing of the reactor contents. The hydraulic retention time (HRT) in the dosing tank will range between approximately two and three days. The dosing tank allows for
28
acidification of the organics contained in the feedstock to provide more efficient digestion. The dosing tank will be operated at a variable level, which provides the ability to vary the AD reactor feed rate. The volume of the dosing tank is approximately 2,000 cubic meters (m3).
The anaerobic reactors will be bolted steel construction with interior and exterior coatings to help protect against corrosion. The tanks will not need to be insulated because of the warm ambient temperature of the Haiti climate and the abundant amount of excess heat available from the IC engines. Three AD reactors are envisioned to be provided, each with a volume of approximately 4,000 m3 and nominal dimensions of 18 m in diameter and 17 m in height. The HRT in the AD reactors is 18 days.
The AD reactors will be operated in the thermophilic temperature range of approximately 50°C to 65°C. The key reason for thermophilic operation is that it will allow smaller reactors compared to mesophilic operation. Because there will be ample waste heat available from the IC engines, this heat can be used for AD reactor heating and no supplemental heat source would be needed to heat the reactors. It is important the reactors are operated within the specified range above because bacteria are less effective at consuming organics and producing biogas if outside this range. Typically, AD reactors are operated at a temperature setpoint, and heating controls are able to maintain the reactors within 1°C to 2°C of this temperature.
The reactors will be covered and biogas will be collected and burned in IC engines. The cover system will be a fixed-roof constructed of fiberglass designed to withstand local environmental conditions including hurricanes. The cover will be fitted with access hatches and pressure relief valves. A typical AD facility is shown in Figure 12.
Figure 12. Typical AD facility (photo of Valorga-Urbaser AD facility in Madrid, Spain) Source: Tim Raibley, HDR Engineering Inc.

29
The AD reactor contents will be agitated with propeller-style mixers. The goal is to agitate tank contents and not to completely mix reactor contents. Three 10-kilowatt (kW) mixers have been included for each reactor.
Equipment associated with the dosing system, transfer pumps, dewatering equipment, electrical components, and other facilities will be located in a 540-m2 equipment building to protect this equipment from weather.
4.1.3 Digestate Management
The average un-dewatered digestate production from the reactors is 611 m3/day at a 10% TS concentration. Digestate will be pumped from the AD reactors to two centrifuges. It is assumed that dewatering operations will occur eight hours per day, seven days per week and that the two centrifuges will operate simultaneously. Dewatering would occur eight hours per day during normal, daylight working hours to facilitate simpler hauling and disposal operations. If one centrifuge is out of service, the dewatering campaign will increase to 16 hours per day. The centrifuges will dewater the digestate to approximately 30% solids and allow transport of the digestate off-site. The average dewatered digestate generated is 194 wet tonnes/day.
The dewatered digestate will have organic and nutrient value suitable for blending and improving other soils agronomic value. There may be contractors and facilities in the Port-au-Prince area who will accept the digestate for use as a soil amendment and for erosion control. It is assumed the dewatered digestate will be conveyed from the centrifuges to roll-off containers outside the equipment building. The roll-off containers of digestate will be hauled by an outside party for off-site use and then returned to the AD facility.
Centrate (liquid effluent stream) discharged from the centrifuge will be stored in a 30-m3 (10,000 gallon) tank and then a portion (approximately half) will be pumped back to the dosing tank to serve as dilution water for the raw feedstock to the AD reactors. Two centrate pumps will be included. The balance of the centrate must be evaporated in an on-site pond, or pumped for off-site disposal, such as evaporation or land application. Because the centrate will still have approximately 1.2% solids, it would likely clog most spray nozzles in irrigation systems and so it is assumed an evaporation pond will be used to evaporate the liquid contained in the centrate.
Based on available data for climates in the Caribbean similar to Haiti’s, the assumed annual net pan evaporation rate for evaporating centrate is 1.6 meters per year. [13] This pan evaporation rate accounts for both annual precipitation and evaporation, but does not account for the effect of elevated dissolved solids that may reduce the net evaporation rate by approximately 20% to roughly 1.3 m per year. At this adjusted evaporation rate, the area of the evaporation pond is approximately six hectares or 60,000 m2. As solids will accumulate in the ponds, provisions will be provided so that these solids can be removed from the ponds periodically.

30
4.1.4 Biogas Management and Power Production
Biogas from the AD reactors is envisioned to be scrubbed to remove sulfur to protect the IC engines from corrosion. An iron sponge scrubber has been included in the cost estimate. Sulfur in the biogas adheres to the iron impregnated media and is retained within the scrubber. The media needs periodic regeneration or replacement once the available iron within the media is exhausted.
The scrubbed biogas would pass through a refrigerant-based chiller to remove moisture prior to feeding it to three IC engines. A total average output of approximately 4.9 megawatts (MW) is estimated from the IC engines based on the design feedstock rate to the AD reactors. Each engine is sized to produce up to 2.5 MW, which allows one engine to be out of service for maintenance while still producing the average design electricity output or allows all three engines to operate simultaneously in order to accommodate peak loadings or future increases in loading.
The electrical output from the engine gensets is anticipated to connect to the local electrical grid near the Trutier waste site. The main components for the grid connection will likely include the following and will depend on the electrical utility’s grid connection requirements:
• Power conditioning equipment • Safety equipment • Meters and instrumentation.
These components include switches to disconnect the system from the grid in the event of a power surge or power failure, and power conditioning equipment to ensure the power exactly matches the voltage and frequency of the electricity flowing through the grid. Finally, the amount of power delivered to the grid must be metered.
Approximately 1.8 MW (thermal) of recoverable waste heat is available from each of the IC engine’s exhaust gas and high-temperature circuit (equivalent to an average of 3.6 MW of total waste heat during normal operation). It is estimated that only about 1.7 MW of heat will be required to heat the AD reactors, and so sufficient waste heat is available for AD reactor heating. Each engine would include a heat recovery module containing gas-to-water heat exchangers. A hot water loop would circulate between the module and the AD reactors, returning hot water at a nominal temperature of 100°C to piping loops within the AD reactors to transfer heat to the AD reactor contents. The quantity of water circulated would be controlled based on maintaining the AD reactors at approximately 50°C.
The IC engines and associated recovery modules would be located in a dedicated building near the AD reactors. The building is sized at 360 m2.
4.1.5 Mass and Energy Balance/Process Flow Diagram
A conceptual mass and energy balance for the Haiti AD facility was prepared and was presented in conjunction with the process flow diagram in Figure 10, which depicts major components of the facility design.

31
The AD facility will consist of the following major areas utilizing existing land at the Trutier waste site:
• Feedstock receiving and materials sorting and recovery • AD reactors • AD reactor equipment building (including the dewatering system, an office, lab,
and control room) • Biogas cleaning and IC engines (housed in a building).
The total footprint for these facilities is estimated to be between approximately 3.0 to 3.5 hectares, not including the estimated 6 hectares for the dewatering ponds. A site layout for the facility is provided in Figure 9.
4.1.6 Anaerobic Digestion Plant Utility Interfacing and Requirements
Some of the AD equipment will require electricity to operate. In addition, the engine-generator will be connected to the grid to be able to provide electricity to the community.
Water will be needed for operation of the AD and for cleaning.
Power
Power at the facility will primarily be used to convey MSW/feedstock and digestate material, and to operate AD reactor mixers, transfer pumps, and centrifuges. Based on a preliminary motor list, the installed power at the AD facility will be approximately 500 kW. The projected operating power demand at the facility may be approximately 225 kW.
Water
The facility will recycle centrate for use in diluting the feedstock. A small quantity of utility water (which does not necessarily need to be potable) will be required for day-to-day cleaning and other needs. It is expected that less than 100 m3/day will be required on average. This need could be met by adding a well or a non-potable water supply. The supply should have a capacity of approximately 150 liters (L) per minute accessible at all times.
4.1.7 Anaerobic Digestion Planning Level Facility Cost Estimates
Capital and operating costs were developed for the AD facility and are summarized in the following sections. These cost estimates were prepared using U.S.-based cost assumptions. In particular, U.S. labor rates [14] were used for both construction and

32
facility operations. The conversion of these cost estimates into Haiti-based costs5 is assumed to be a joint effort in a subsequent version of this report.
Overview of Anaerobic Digestion Facility Capital Cost Estimate
An order-of-magnitude capital cost estimate (in U.S. dollars) of the AD facility was developed (see Section 7.0) and will be refined during the next phase of preliminary engineering. Budgetary pricing was obtained from equipment vendors for larger equipment, such as the IC engines and sorting conveyor systems. Historical equipment pricing from past projects was also used for developing costs. The costs reflect a variety of assumptions about the site and its condition. Although truck scales were observed at the site, they were not operational. Consequently, new scales are included in the cost estimate. Costs are preliminary and may fall within +30% and -15% of the values presented in Table 6. It is also worth noting that costs assume construction at a generic site in the United States, under average construction conditions. For clarity, costs in the right-hand column are shown to the nearest dollar; total project cost at the end of the table is shown to the nearest $100,000.
The cost estimate reflects a fully developed facility configured as illustrated in Figure 10. The site improvements include an entry truck scale and scale house, receiving enclosure, materials sorting and recovery equipment, digestion system, digestate management system, and biogas treatment/power generation system.
Table 6. Opinion of Probable Anaerobic Digestion Capital Construction Cost
Item Quant. Unit Unit Price Cost Earthwork (excavation, backfill, structural fill) 1 lsa $275,000 $275,000
Truck scales 2 ls $70,000 $140,000
Materials sorting and recovery system consisting of two conveyor systems (loading conveyors, sorting conveyors and platforms, magnets, trommel screens, and one grinder with in-feed conveyor)
1 ls $2,588,000 $2,588,000
Equipment foundations (two conveyor systems, one grinder) 1 ls 150,000 $150,000
Vehicle unloading/circulation, and ½-loader circulation area (paved, uncovered)
485 m2 $86.50 $41,953
Materials sorting and recovery building enclosure, concrete slab foundation, overhead lighting
5,000 m2 $700 $3,500,000
Groundwater pumping 1 ls $10,000 $10,000
Receiving pit 1 ls $128,000 $128,000
Dosing feed augers 1 ea $20,000 $20,000
Dose tank (heated and covered) 2,000 m3 $290.50 $581,000
Dose tank mixers 1 ea $40,000 $40,000
5 The official Haitian minimum wage is 300 Haitian gourdes (HTG), which is $7.24 (1 U.S. dollar = 41.4474 HTG using the mid-market rates as of Nov. 21, 2013 19:22 UTC posted on www.xe.com/currency/htg-haitian-gourde?r=3).

33
Item Quant. Unit Unit Price Cost AD reactor feed pumps 3 ea $9,500 $28,500
AD reactor tanks (heated and covered, includes foundations) 12,200 m3 $237.50 $2,897,500
AD reactor mixing system 1 ls $2,400,000 $2,400,000
AD reactor heating tubes and hot water pumps 1 ls $204,000 $204,000
Digestate pumping 2 ea $14,000 $28,000
Centrifuges 2 ea $440,000 $880,000
Centrifuge hoppers and conveyors 2 ea $23,000 $46,000
Centrate storage tank 38 m3 $317 $12,046
Centrate pumps 2 ea $4,000 $8,000
Yard piping (buried process, water, sewer, drain piping) 1 ls $275,000 $275,000
Miscellaneous metals—stairways and platforms 1 ls $30,000 $30,000
Equipment building 500 m2 $492 $246,000
Biogas scrubber 1 ls $500,000 $500,000
IC engines and heat recovery modules 3 ea $1,700,000 $5,100,000
Engine building 400 m2 $492 $196,800
Biogas emergency flare and safety equipment 1 ls $145,000 $145,000
Electrical interconnection 1 ls $250,000 $250,000
Roadways 1,110 m2 $130 $144,300
Landscaping 1 ls $15,000 $15,000
Water well 1 ls $12,000 $12,000
Centrate evaporation pond earthwork 1 ls $100,000 $100,000
Centrate evaporation pond synthetic liner 60,800 m2 $13.50 $820,800
Fencing and gating 1 ls $25,000 $25,000
Subtotal $21,837,899
Electrical/I&C $2,620,548
Mechanical $1,965,411
Subtotal with Subcontractors $26,423,858
Undefined scope/contingency $3,963,579
Contractor administration $792,716
Contractor profit and overhead $3,170,863
Construction Total $34,351,016
Engineering, environmental, administration, permitting, construction management
$6,183,183
Project Total $40.5 Million a ls = lump sum
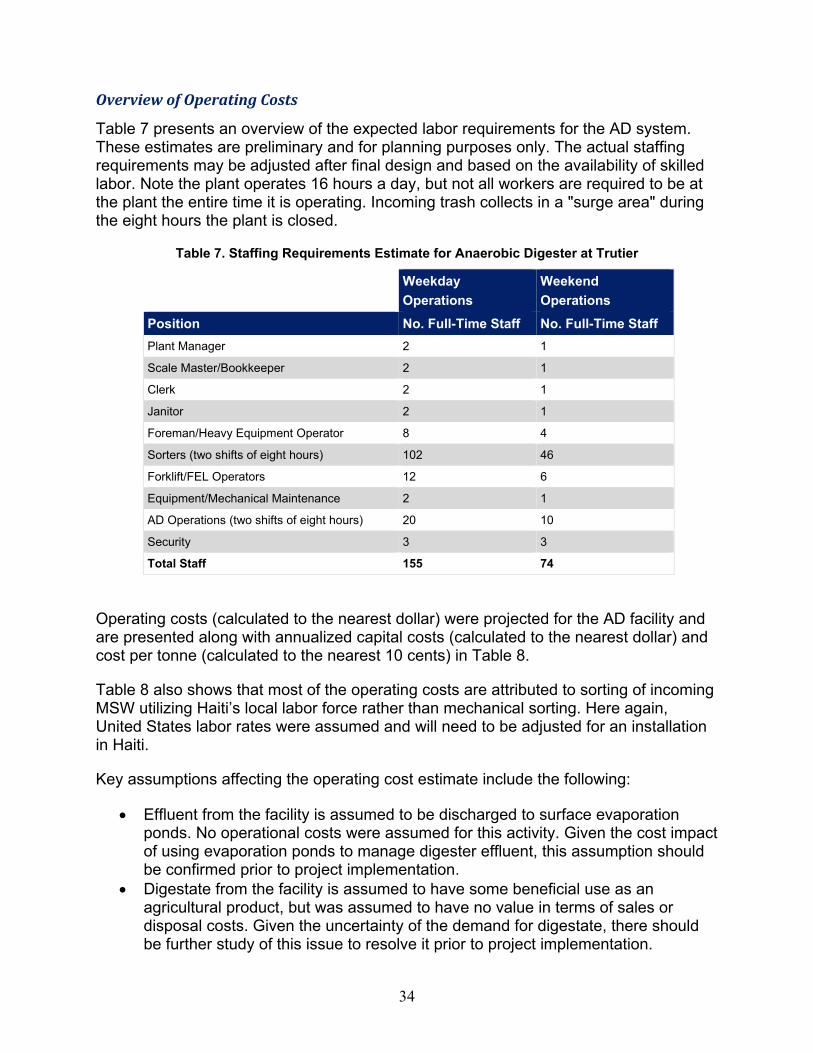
34
Overview of Operating Costs
Table 7 presents an overview of the expected labor requirements for the AD system. These estimates are preliminary and for planning purposes only. The actual staffing requirements may be adjusted after final design and based on the availability of skilled labor. Note the plant operates 16 hours a day, but not all workers are required to be at the plant the entire time it is operating. Incoming trash collects in a "surge area" during the eight hours the plant is closed.
Table 7. Staffing Requirements Estimate for Anaerobic Digester at Trutier
Operating costs (calculated to the nearest dollar) were projected for the AD facility and are presented along with annualized capital costs (calculated to the nearest dollar) and cost per tonne (calculated to the nearest 10 cents) in Table 8.
Table 8 also shows that most of the operating costs are attributed to sorting of incoming MSW utilizing Haiti’s local labor force rather than mechanical sorting. Here again, United States labor rates were assumed and will need to be adjusted for an installation in Haiti.
Key assumptions affecting the operating cost estimate include the following:
• Effluent from the facility is assumed to be discharged to surface evaporation ponds. No operational costs were assumed for this activity. Given the cost impact of using evaporation ponds to manage digester effluent, this assumption should be confirmed prior to project implementation.
• Digestate from the facility is assumed to have some beneficial use as an agricultural product, but was assumed to have no value in terms of sales or disposal costs. Given the uncertainty of the demand for digestate, there should be further study of this issue to resolve it prior to project implementation.
Weekday Operations
Weekend Operations
Position No. Full-Time Staff No. Full-Time Staff Plant Manager 2 1
Scale Master/Bookkeeper 2 1
Clerk 2 1
Janitor 2 1
Foreman/Heavy Equipment Operator 8 4
Sorters (two shifts of eight hours) 102 46
Forklift/FEL Operators 12 6
Equipment/Mechanical Maintenance 2 1
AD Operations (two shifts of eight hours) 20 10
Security 3 3
Total Staff 155 74

35
• The non-digestible portion of the waste is required to be landfilled using a nominal landfill disposal rate of $7/tonne, which reflects a rough estimate of current waste disposal costs at Trutier. Given the financial impact of the disposal of the non-digestible portion of the waste, there should be further study and clarification of the cost of operating the exiting Trutier waste facility for the disposal of non-digestible materials be resolved prior to project implementation.
• The cost of labor is based on U. S. labor rates. Adjustments up (for transport, mobilization of personnel, etc.) or down (for lower cost of labor in Haiti) are required to determine the in-country cost. Given the uncertainty and potentially significant influence of the cost of labor in Haiti, there should be further study to evaluate and apply Haitian labor rates for locally supplied labor in addition to the cost of imported labor for those labor-related expenses that must be provided from out-of-the country labor.
In addition to operating costs, Table 8 includes a summary of the total system costs including amortized capital costs, annual revenues and related overall system costs. The resulting overall system cost is presented on a per tonne basis to illustrate the approximate cost of the AD system. Revenues from the sale of electricity were calculated at $0.20 per kilowatt-hour.

36
Table 8. Anaerobic Digestion Cost Summary Details
Parameters Total Waste (tonnes/yr) 238,345
Contamination Level (%) 27%
Organic Waste (tonnes/yr) 173,992
Tonnes Contamination for Disposal (tonnes/yr) 64,353
Tonnes Digestate for Reuse as Soil Amendment (tonnes/yr) 70,638
Capital Cost Total Project Capital Cost to the Nearest Dollar, as Calculated in Table 6 $40,534,199
Revenues and Avoided Cost
Unit cost Units Quantity Cost
Sale of Digestate $0 tonnes 70,638 $0
Electrical Sales Income (net—accounts for parasitic load) $0.20 kWh 38,812,657 $7,762,531
Total Revenues and Avoided Cost $7,762,531
Annual O&M Costs
Unit cost Units Quantity Cost
Labor
$8,108,173
Equipment Maintenance (including an allowance for digester cleaning every three years)
$354,279
Landfill Disposal of Non-Organics $7
64,353 $450,471
Disposal of Digestate $0
70,638 $0
Total O&M Cost $8,912,923
Total Costs Total O&M Cost $8,912,923
Total Revenues and Avoided Cost -$7,762,531
Annualized Capital Cost (6.0%, 20 yrs) $3,887,352
Total Annual Cost $5,037,744
Total Cost per Tonne ($/tonne) $21.10
4.2 Modern Sanitary Landfill Alternative For the most part, conversion of municipal solid WTE in the United States is accomplished using either thermal conversion, typically referred to as “mass burn,” or by the collection and use of landfill gas through LFGTE systems. The use of landfill gas as a fuel source for electricity generation is very similar to the use of AD reactor biogas for electricity production. Specifically, the collection of landfill gas, which typically contains approximately half methane, is conditioned and burned as a low-grade fuel in an IC engine, which in turn powers an electrical generator. Consequently, another option to produce energy from MSW at Trutier is to develop a modernized landfill that

37
includes a system to collect landfill gas, which could be used in a similar manner as described for the biogas from the AD facility.
4.2.1 Modern Landfill Components
Modern landfill designs have several aspects that serve to protect the environment from inert and undesirable materials disposed of in the landfill and to collect and use landfill gas for energy production. These include liner systems, operational protocols, liquids management systems, gas collection systems, and a variety of related controls described below. A diagram depicting the components of a modern landfill is presented in Figure 13.
Figure 13. Cross-section through a modern landfill Source: Waste Management Inc.
4.2.2 Liner System
Most modern landfills have composite liner systems. In the United States, all new landfills and all lateral expansions to existing landfills that receive MSW are required to have composite liners installed prior to the placement of waste. U. S.-federal regulations require these liners be composed of a flexible membrane liner (minimum 30 millimeters (mm), or minimum 60 mm if high density polyethylene [HDPE] liner) over at least two feet (0.6 meters) of compacted soil that has a hydraulic conductivity of no more than 1x10⁻⁷ cm/sec. Individual state regulations may add additional requirements for landfills under their jurisdiction.
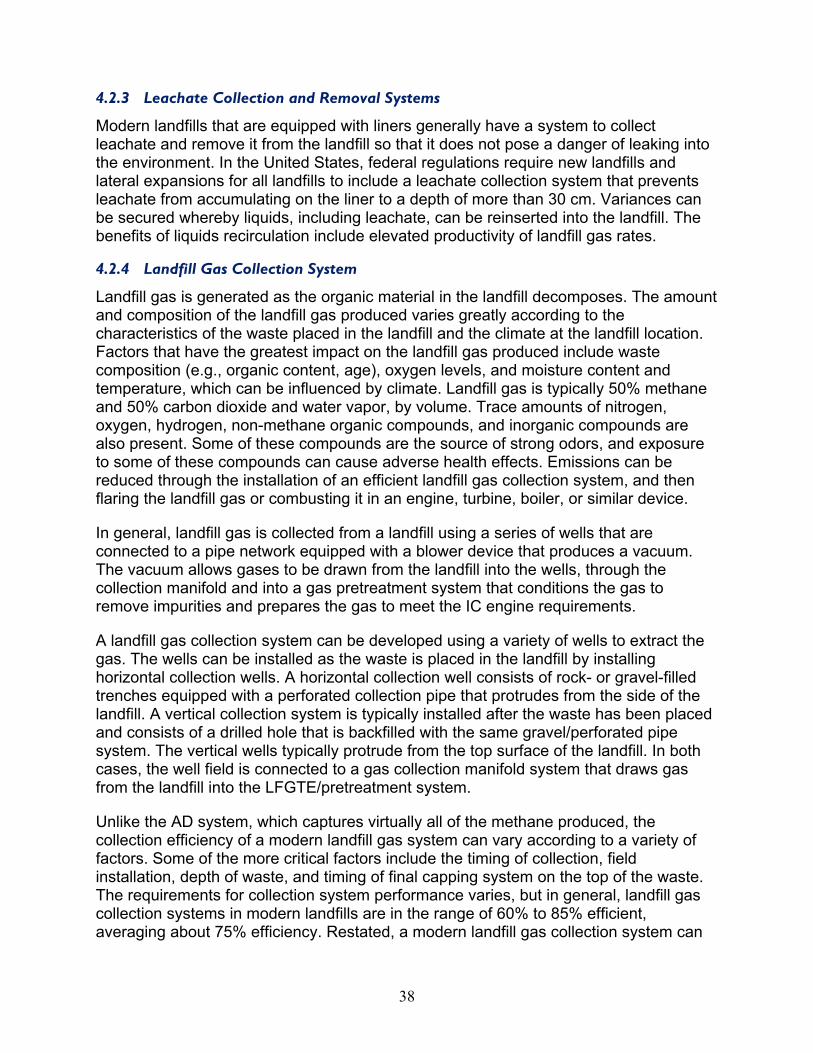
38
4.2.3 Leachate Collection and Removal Systems
Modern landfills that are equipped with liners generally have a system to collect leachate and remove it from the landfill so that it does not pose a danger of leaking into the environment. In the United States, federal regulations require new landfills and lateral expansions for all landfills to include a leachate collection system that prevents leachate from accumulating on the liner to a depth of more than 30 cm. Variances can be secured whereby liquids, including leachate, can be reinserted into the landfill. The benefits of liquids recirculation include elevated productivity of landfill gas rates.
4.2.4 Landfill Gas Collection System
Landfill gas is generated as the organic material in the landfill decomposes. The amount and composition of the landfill gas produced varies greatly according to the characteristics of the waste placed in the landfill and the climate at the landfill location. Factors that have the greatest impact on the landfill gas produced include waste composition (e.g., organic content, age), oxygen levels, and moisture content and temperature, which can be influenced by climate. Landfill gas is typically 50% methane and 50% carbon dioxide and water vapor, by volume. Trace amounts of nitrogen, oxygen, hydrogen, non-methane organic compounds, and inorganic compounds are also present. Some of these compounds are the source of strong odors, and exposure to some of these compounds can cause adverse health effects. Emissions can be reduced through the installation of an efficient landfill gas collection system, and then flaring the landfill gas or combusting it in an engine, turbine, boiler, or similar device.
In general, landfill gas is collected from a landfill using a series of wells that are connected to a pipe network equipped with a blower device that produces a vacuum. The vacuum allows gases to be drawn from the landfill into the wells, through the collection manifold and into a gas pretreatment system that conditions the gas to remove impurities and prepares the gas to meet the IC engine requirements.
A landfill gas collection system can be developed using a variety of wells to extract the gas. The wells can be installed as the waste is placed in the landfill by installing horizontal collection wells. A horizontal collection well consists of rock- or gravel-filled trenches equipped with a perforated collection pipe that protrudes from the side of the landfill. A vertical collection system is typically installed after the waste has been placed and consists of a drilled hole that is backfilled with the same gravel/perforated pipe system. The vertical wells typically protrude from the top surface of the landfill. In both cases, the well field is connected to a gas collection manifold system that draws gas from the landfill into the LFGTE/pretreatment system.
Unlike the AD system, which captures virtually all of the methane produced, the collection efficiency of a modern landfill gas system can vary according to a variety of factors. Some of the more critical factors include the timing of collection, field installation, depth of waste, and timing of final capping system on the top of the waste. The requirements for collection system performance varies, but in general, landfill gas collection systems in modern landfills are in the range of 60% to 85% efficient, averaging about 75% efficiency. Restated, a modern landfill gas collection system can

39
reasonably be assumed to collect 75% of the gas generated by the waste. Landfill gas that is not captured by the collection system is generally thought to pass through the cap where microbial activity consumes some portion of the gas and the remainder escapes into the atmosphere as surface (fugitive) emissions.
4.2.5 Preliminary Design of a Modern Landfill and Landfill Gas-to-Energy System
The project team developed conceptual estimates of the area and features necessary to provide a modern landfill in the Port-au-Prince Haiti area. The landfill would be designated for the disposal of the MSW stream only. Capturing the MSW portion of the waste stream will provide the greatest environmental protection and best landfill gas production, for a much lower cost than if the landfill also included the debris waste stream, which is assumed to be mostly inert. For simplicity, the design and cost estimate are based on the following assumption:
• Average MSW disposal rate to remain at approximately 653 tonnes per day • Life of the landfill will be 20 years (same as AD system estimate) • In-place density of MSW in the landfill will be approximately 0.71 tonnes per
cubic meter (1,200 pounds per cubic yard).
Landfill Metrics
For planning purposes, it is assumed there are no constraints on the size or shape of the landfill. The landfill should have 3:1 (horizontal to vertical) side slopes. As an example of potential volume, it is assumed the landfill will begin placing waste at approximately 5 m below grade and will be filled to approximately 18 m above grade. These assumptions, such as the depth of excavation, are intended to reflect the appropriate soil quantities needed to operate a sanitary landfill. The existing conditions, such as the depth of groundwater, are not known at this time and could affect the depth of excavation and other related assumptions. It is assumed that approximately one quarter of the airspace will be filled with cover soil, which is used to cover lifts of waste placed at the end of an operating day. Based on these assumptions, it is estimated that the landfill will be approximately 40 hectares and be filled over the course of approximately 20 years.
Landfill Gas Collection and Landfill Gas-to-Energy Systems
Figure 14 shows the amount of landfill gas estimated to be produced by the landfill and collected during the first 20 years of operation. Landfill gas production starts out low, but increases as more waste is placed in the landfill and the collection system is expanded. The project team estimated the capital cost investment needed for the installation of a landfill gas collection system and a LFGTE system using IC engines. Based on the amount of landfill gas expected to be produced, the LFGTE system could use up to five IC engines during its years of peak production, which are expected to begin at year 13 of the landfill life.
The net electrical output with all five engines producing power is estimated to be approximately 24,000 megawatt-hours (MWh) per year with a 3-MW system at its peak and an average of approximately 16,000 MWh per year over the 20-year period used for

40
modeling purposes. The reader may notice that smaller IC engines are assumed in this calculation. The use of smaller, containerized IC engines is common in the LFGTE industry and allows simple and relatively fast installation/removal as compared to larger IC engines. This practice allows the landfill operator to increase or decrease the power-generating capacity to more closely match the landfill gas generation rate, which increases slowly over time and then diminishes near the end of the landfill’s life. In comparison, gas production from an AD facility is consistent over the life of its operation (assuming the feed rate is consistent) and so larger IC engines may be used.
Figure 14. Estimated landfill gas production (first 20 years)
4.2.6 Modern Sanitary Landfill Planning-Level Cost Estimates
Capital and operating costs were developed for the modern landfill equipped with a LFGTE system and are summarized in the following sections. These cost estimates were prepared using U.S.-based cost assumptions. Similar to the AD cost estimate above, U.S. labor rates were used for both construction and facility operations. The conversion of these cost estimates into Haiti-based costs is assumed to be a joint effort in a subsequent version of this report.
Capital Cost Estimate for a Modern Landfill Equipped with a Landfill Gas-to-Energy Facility
An order-of-magnitude capital cost estimate (in U.S. dollars) of the modern sanitary landfill with a LFGTE facility was developed and will be refined during the next phase of preliminary engineering. Costs are preliminary and may fall within +30% and -15% of the values presented in Table 9. For clarity, costs in the right-hand column are shown to the nearest dollar; total project cost at the end of the table is shown to the nearest $100,000. Although shown as a capital cost, the landfill gas collection and power

41
production system is typically constructed over time as an operational cost. However, for comparative purposes, it has been illustrated in the capital cost estimate as an attempt to correlate with the AD capital cost above. In reality, the landfill gas collection field would be constructed in a series of phases over the 20-year operation of the landfill as the waste is filled in modules. Similarly, the addition of IC engines would typically be added to the system as the landfill gas generation rate increased over time. The IC engines would typically be modular, shipped in pre-manufactured containers to the site and connected to the landfill gas collection manifold at the LFGTE power plant site. It is also worth noting that costs assume construction in the United States under average construction conditions.
Table 9. Opinion of Probable Landfill Capital Construction Cost
Item Quantity Unit Unit Price Cost Initial earthwork (excavation for initial module) 92,500 m3 $2.65 $245,125
Truck scale 2 lsa $70,000 $140,000
Landfill liner, cushion, etc. 343,000 m2 $53.80 $18,453,400
LCRS 343,000 m2 $21.50 $7,374,500
LFG collection system 34.35 hectare $86,500 $2,971,275
LFG flare, blower 1 ls $250,000 $250,000
LFGTE system (over 20-year period) 1 ls $9,670,000 $9,670,000
Electrical interconnection 1 ls $250,000 $250,000
Roadways 1,110 m2 $130 $144,300
Water well 1 ls $12,000 $12,000
Fencing and gating 2,344 m $19.70 $46,177
Subtotal
$39,556,777
Engineering, environmental, administration, permitting, construction management
$7,120,220
Project Total
$46.7 Million
a ls = lump sum
Overview of Landfill Operating Costs
Table 10 presents an overview of the expected labor requirements for the landfill system. These estimates are preliminary and for planning purposes only. The actual staffing requirements may be adjusted after final design and based on the availability of skilled labor.
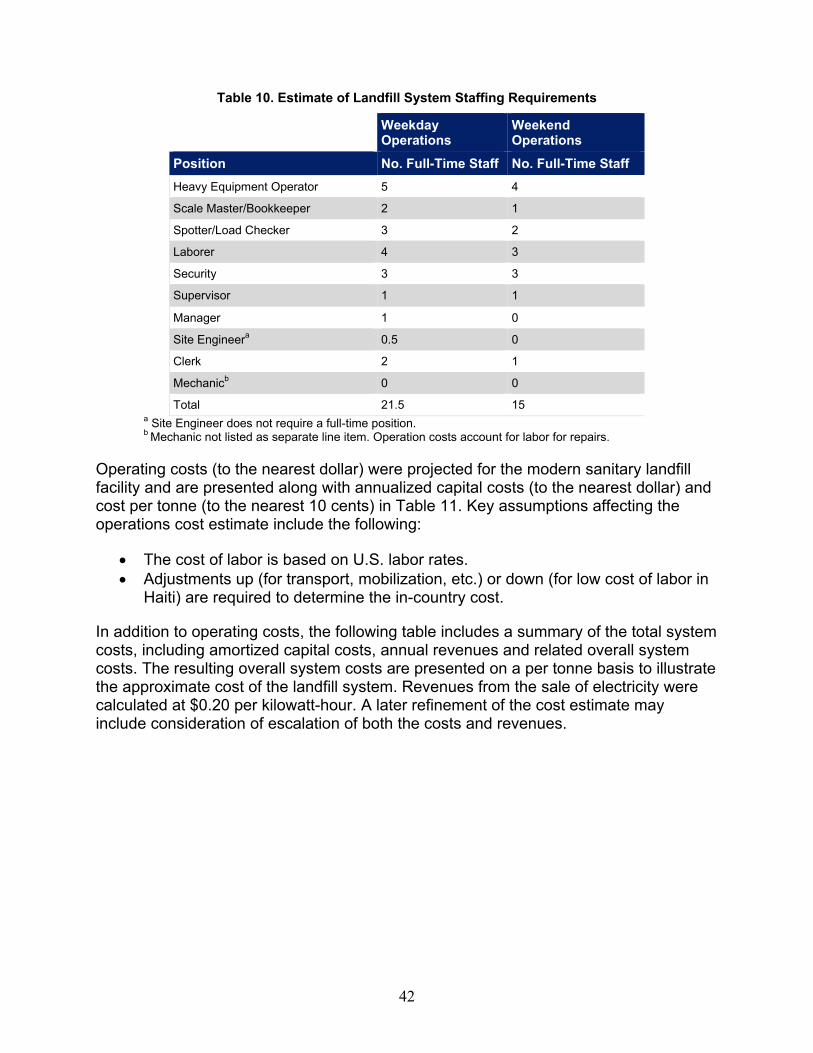
42
Table 10. Estimate of Landfill System Staffing Requirements
Weekday Operations
Weekend Operations
Position No. Full-Time Staff No. Full-Time Staff Heavy Equipment Operator 5 4
Scale Master/Bookkeeper 2 1
Spotter/Load Checker 3 2
Laborer 4 3
Security 3 3
Supervisor 1 1
Manager 1 0
Site Engineera 0.5 0
Clerk 2 1
Mechanicb 0 0
Total 21.5 15 a Site Engineer does not require a full-time position. b Mechanic not listed as separate line item. Operation costs account for labor for repairs.
Operating costs (to the nearest dollar) were projected for the modern sanitary landfill facility and are presented along with annualized capital costs (to the nearest dollar) and cost per tonne (to the nearest 10 cents) in Table 11. Key assumptions affecting the operations cost estimate include the following:
• The cost of labor is based on U.S. labor rates. • Adjustments up (for transport, mobilization, etc.) or down (for low cost of labor in
Haiti) are required to determine the in-country cost.
In addition to operating costs, the following table includes a summary of the total system costs, including amortized capital costs, annual revenues and related overall system costs. The resulting overall system costs are presented on a per tonne basis to illustrate the approximate cost of the landfill system. Revenues from the sale of electricity were calculated at $0.20 per kilowatt-hour. A later refinement of the cost estimate may include consideration of escalation of both the costs and revenues.
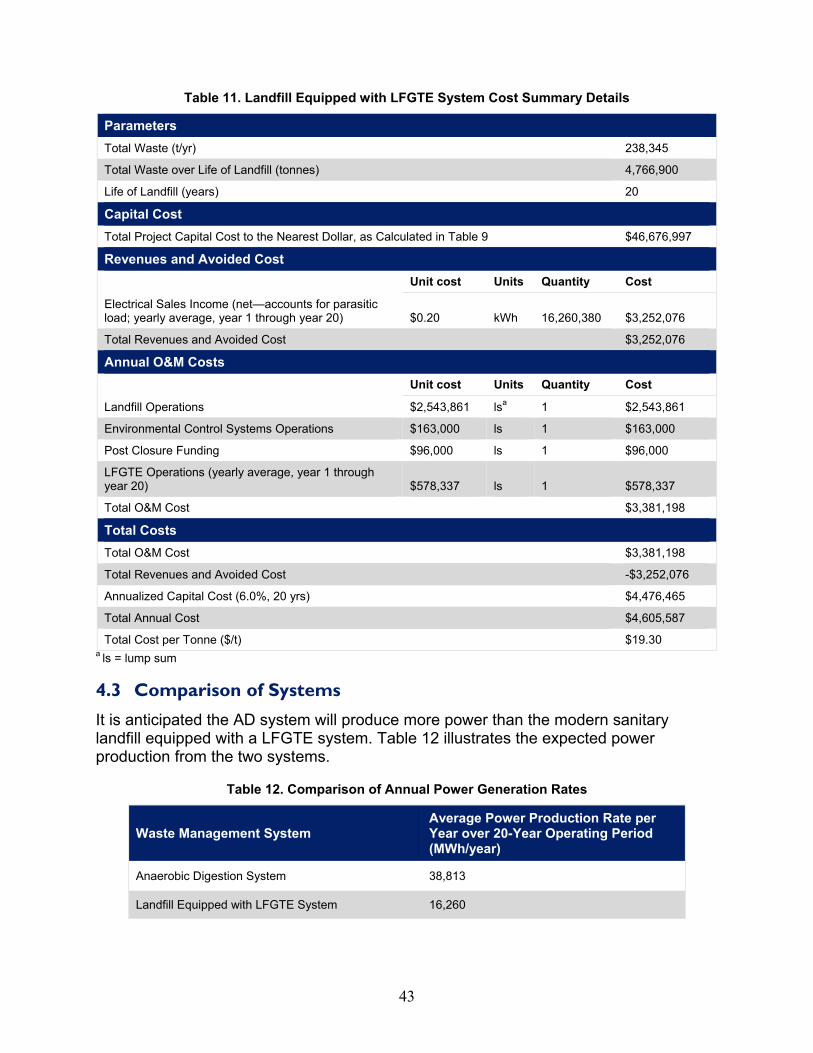
43
Table 11. Landfill Equipped with LFGTE System Cost Summary Details
Parameters Total Waste (t/yr) 238,345
Total Waste over Life of Landfill (tonnes) 4,766,900
Life of Landfill (years) 20
Capital Cost Total Project Capital Cost to the Nearest Dollar, as Calculated in Table 9 $46,676,997
Revenues and Avoided Cost
Unit cost Units Quantity Cost
Electrical Sales Income (net—accounts for parasitic load; yearly average, year 1 through year 20) $0.20 kWh 16,260,380 $3,252,076
Total Revenues and Avoided Cost $3,252,076
Annual O&M Costs
Unit cost Units Quantity Cost
Landfill Operations $2,543,861 lsa 1 $2,543,861
Environmental Control Systems Operations $163,000 ls 1 $163,000
Post Closure Funding $96,000 ls 1 $96,000
LFGTE Operations (yearly average, year 1 through year 20) $578,337 ls 1 $578,337
Total O&M Cost $3,381,198
Total Costs Total O&M Cost $3,381,198
Total Revenues and Avoided Cost -$3,252,076
Annualized Capital Cost (6.0%, 20 yrs) $4,476,465
Total Annual Cost $4,605,587
Total Cost per Tonne ($/t) $19.30 a ls = lump sum
4.3 Comparison of Systems It is anticipated the AD system will produce more power than the modern sanitary landfill equipped with a LFGTE system. Table 12 illustrates the expected power production from the two systems.
Table 12. Comparison of Annual Power Generation Rates
Waste Management System Average Power Production Rate per Year over 20-Year Operating Period (MWh/year)
Anaerobic Digestion System 38,813
Landfill Equipped with LFGTE System 16,260

44
The landfill option includes disposal of all MSW, but the AD system does not. To fairly compare the AD system to the modern sanitary landfill, the project team considered the cost of disposing of the residuals of the AD system. For accounting purposes, the AD system cost estimate includes a landfill disposal fee of $7/tonne for approximately 64,000 tonnes of non-digestible materials per year, based on the assumption that the MSW residuals would be relatively benign. As a consequence, the landfill accepting the AD residuals would not be modernized to include protective liners and caps and would not be equipped with a LFGTE system. Instead of providing a detailed tipping fee cost estimate of the MRF residues from the AD system, the cost estimate uses a tipping fee commensurate with a relatively low-tech landfill, assuming minimal environmental controls, operations, etc. Further, the AD system estimate is based on the assumption the digestate produced by the digestion system will have adequate nutrient and physical properties to be used as an agricultural product. The value of the digestate is assumed to be zero, so no revenues are included in the economic analysis. Similarly, the cost of the digestate is assumed to be zero based on the assumption the agricultural value is such that the recipient will be willing to pay for transportation and applying it as a fertilizer and soil amendment.
Table 13 provides a comparison of the amortized capital cost, annual revenue, and operations costs. The total annual cost reflected in Table 13 represents an amortized capital cost, annual revenue, and annual operating cost to summarize the costs of the facility over a 20-year period. Numbers are rounded to the nearest $100,000.
Table 13. Comparison of Key Cost Features
Cost Element Anaerobic Reactor ($ millions)
Landfill Equipped with LFGTE System ($ millions)
Amortized Capital Cost $3.9 $4.5
Operations Cost $8.9 $3.4
Annual Revenue $7.8 $3.3
Total Annual Cost $5.0 $4.6
Another useful comparison is the overall system cost per tonne of MSW, which is shown in Table 14 (rounded to the nearest 10 cents).
Table 14. Comparison of System Cost per Tonne
Waste Management System Overall System Cost in Terms of Total Cost/Total Tonnes Received ($/t)
Anaerobic reactor $21.10
Modern sanitary landfill equipped with LFGTE system $19.30

45
5.0 The Power Grid and Potential Interconnects 5.1 Overview of the Power Grid in Haiti
Haiti does not have a national power grid. Instead, there are ten isolated regional grids, with power outside of the capital city of Port-au-Prince mostly supplied by diesel generating units [15].
Haiti’s electricity transmission and distribution (T&D) system was damaged by the severe earthquake that struck the country in January 2010, and is in dire need of repair [15]. Even prior to the earthquake, the power sector in Haiti was, according to the U.S. Dept. of State, among the most problematic in the Western world [16]. Today, only an estimated 25% of the population of 10 million people has access to grid electricity at all, with most customers receiving only intermittent and unreliable service. In Port-au-Prince, for example, electricity is available for an average of only 10 hours per day [15].
The electric utility, Electricité d’Haïti (EDH), is an autonomous, government-owned, vertically integrated enterprise [38] that faces considerable technical, managerial, and financial challenges. It has a monopoly over the transmission and distribution of electricity in Haiti, but purchases more than 80% of the energy it distributes from independent power producers (IPPs). Technical and commercial losses amount to more than 50% of the power produced, and EDH receives payment for only about 30% of the electricity it produces or purchases [17]. Half of those Haitians who do have access to electricity are connected to the grid illegally [39]. As a result, EDH is unable to cover the cost of basic maintenance services, fuel, and payments due for generation under PPAs signed with IPPs [17].
To maintain its commercial operations, EDH requires an annual subsidy from the Government of Haiti of more than $120 million, which represents approximately 12% of the national budget [16]. Since 2011, EDH's operations have been managed by Tetra Tech Inc., an "operations improvement contractor" recruited by the Government of Haiti and financed by USAID [17].
In August 2012, the Haitian electricity grid was declared to be in a state of emergency [22], a move that should set the stage for significant improvements to the grid, such as those outlined in Section 5.6.
5.2 The Need for Reliable Electricity
Haiti is one of the poorest countries in the world. According to the World Bank, more than half of the population lives in absolute poverty (earning less than $1 per day) and 78% earn less than $2 per day. Roughly 4.5 million Haitians are considered to be destitute [17].
Providing reliable access to electricity and other energy services is essential to achieving an economic recovery in Haiti and improving the quality of life of the populace. Industrial and commercial activities are the main drivers of job creation, and these activities cannot develop in a sustainable manner without affordable, reliable

46
electricity. Electricity is also necessary for the delivery of basic services, such as healthcare, education, and security. In addition, until alternatives exist, Haitians will continue to rely on other energy sources, such as wood and charcoal, for cooking and heat, an unsustainable practice that is contributing to health problems and is causing continuing environmental damage [17].
5.3 The Need for Indigenous Power
Government expenditures on PPAs and imported fuel amounted to $180 million in fiscal year 2011. These expenditures are increasing, partly due to an expansion in generating capacity, and partly due to increasing oil prices. This expense is unsustainable and diverts government funds away from services that it could otherwise be providing for its citizens. Haiti is heavily dependent on imported petroleum for power generation, with 85% of its electricity produced by oil-based generating units, making both the power sector and the national budget more vulnerable to external price shocks [15].
Some of the oil-based generators in Haiti run on diesel fuel, and others use heavy fuel oil (HFO), which could potentially contribute to health problems for Haitians. According to E-Power, which operates a 30-MW HFO plant in Port-au-Prince, "heavy fuel oil is a viscous residual fuel oil that contains relatively high amounts of pollutants ... however, its undesirable properties make it very cheap [18].”
5.4 The Power Grid in the Port-au-Prince Area
Until the 2010 earthquake, very little was known about the characteristics of the power grid in Port-au-Prince. The transmission system was mapped for the first time immediately following the earthquake and, as of late 2011, EDH still did not have the distribution system mapped [19].
As more information about the T&D system has been gathered, the picture is clearer today, but there are some discrepancies in the information provided by different credible sources. The information presented in this section is the best available as of April 2013.
In 2012, installed generating capacity in the Port-au-Prince metropolitan area was roughly 226 MW, of which only 157 MW was actually available to generate electricity, with the remainder down due to mechanical or electrical issues. More than half of the installed capacity was provided by just four IPPs operating thermal power plants: PBM (34-MW HFO), Sogener (36-MW diesel), Haytian Tractor (21-MW diesel), and E-Power (30-MW HFO) [15].
But the electricity grid is not capable of handling all of the available generation. EDH's transmission capacity in the metropolitan area varies between 105 MW and 120 MW, depending on the current state of the system. Real-world demand varies from a low of 75 MW during the night to a high of 120 MW during the day. However, this does not take into consideration the suppressed demand from potential customers, such as the brewery and the U.S. Embassy, that are not connected to the grid because of reliability concerns [9].

47
Total potential demand, including suppressed demand, is estimated at somewhere between 160 MW peak [9] and 220 MW peak [21], and EDH estimates there are 50,000 diesel gensets in Port-au-Prince for independent power generation due to reliability issues. Annual growth in demand for electricity is expected to be somewhere between 3% and 5% [9].
Figure 15. Transmission lines in Port-au-Prince, 2010: 69 kV (red) and 115 kV (blue)
Source: Google Earth, edited by Myk Manon
The power grid in the Port-au-Prince area comprises a 56-km transmission line (115 kilovolt [kV]) connecting the capital to the Péligre hydropower plant, a dispatch center operated manually and interconnecting three power plants by a 69-kV transmission line of 53 km, nine substations (identified by the yellow arrows on the map above) transforming 69 kV in distribution voltage, and 32 distribution circuits totaling 1,029 km and transforming 12.5-7.3 kV in 120 V and 240 V [15]. There is a tenth substation located at the new E-Power power plant, not shown on the map above, that is connected to the grid by a 72.5-kV transmission line [22].
The repair and upgrade of five of the substations in Port-au-Prince were identified as critical priorities, as the underperformance of these substations was drastically reducing the system’s capacity for transmission and distribution of electrical power [16].
5.5 Potential Interconnection Locations
As there is currently no map of the distribution system in the metropolitan area (see Section 5.4), it is impossible to determine where the proposed anaerobic digestion plant at Trutier could connect to the grid. There may be several options, as EDH has confirmed that a generating plant at the scale planned for Trutier could tie into 12-kV
48
lines instead of requiring a connection to the more constrained 69-kV lines [9]. But according to the former EDH consultant who created the transmission map shown in Figure 15, "The status of the distribution system is in such disarray that any information useful for an intertie would be meaningless [19].”
With only information on the transmission grid available as of April 2013, the nearest potential grid intertie for the Trutier plant is the substation at the 30-MW E-Power heavy fuel oil plant (labeled with a green "1" in Figure 16), which is served by a 72.5-kV transmission line [21], and is located roughly 4.7 km from Trutier. The next-closest potential interconnect is at the southeast Varreux substation (labeled with a green "2" in Figure 16), which is served by a 69-kV transmission line [19], and is located roughly 6.1 km away. The distances stated here assume new power lines will follow existing roads and not cut through areas occupied by residential and commercial buildings. However, it is currently uncertain whether these substations have the capacity to support additional generation.
Figure 16. Potential interconnects for the Trutier power plant (labeled "A") Source: Google Earth

49
Planned improvements to the grid and substations in the Port-au-Prince area, to be completed in 2013, are expected to clarify options for interconnection. Until these upgrades are finished, there is not enough information to make any definitive statements about how to connect the proposed AD plant at Trutier to the grid or the potential costs of that interconnection.
5.6 Plans to Improve the Grid The current state of the grid in Haiti in general, and Port-au-Prince in particular, makes the addition of significant amounts of new power generation a daunting task. However, the local utility and international donor agencies have recognized the importance of a reliable electricity grid as a backbone of future economic development and self-sufficiency for Haiti, and several capital improvement projects are already under way or planned for the near term. These initiatives should make it easier to add power to the grid through projects, such as the proposed Trutier WTE plant.
5.6.1 The Electricité d’Haïti Action Plan
Approved by the EDH Board of Directors in September 2012, the "EDH Action Plan 2012-2013" outlines the near-term steps EDH will take to reach its ultimate goal of providing reliable electricity to its customers. By the end of 2013, EDH will also develop a strategic plan for additional improvements over the 2013-2016 time period [22].
In the coming year, EDH aims to increase its stated nationwide electricity availability from 14 to 18 hours a day. This involves improvements to the T&D grid aimed at reducing technical system losses from 16% to 13%, to be accomplished by modernizing nine circuits and five substations in the Port-au-Prince area, upgrading the transmission line connecting the Péligre hydropower plant to the capital, and adding 126 km of power lines in provincial towns.
EDH anticipates these improvements to the T&D system will allow it to concurrently increase power production by 24%. It expects to add 35 MW of generating capacity over the next three years by overhauling existing thermal and hydroelectric power plants in Port-au-Prince and elsewhere.
In order to move toward solvency and ultimately give it the ability to cover the cost of ongoing grid maintenance and improvements, the EDH action plan includes measures to more than double its income stream over the coming year by installing 110,000 radio-frequency meters for residential customers, 450 m for commercial customers, and in an effort to reduce expenditures on power purchase contracts, it will also be metering the output of 16 electricity suppliers. It also plans to recover bad debts from more than 43,000 customers.
This concerted effort by EDH to overhaul its generation and distribution system and billing practices bodes well for other power-generation projects, particularly in the Port-au-Prince area, which is receiving most of the attention.

50
5.6.2 Grid Projects by International Donors
Many of the improvements EDH cites in its action plan are being carried out by international donor agencies, such as USAID, the Inter-American Development Bank (IDB), and the World Bank. These three agencies are investing $400 million in the rehabilitation and expansion of the generation, transmission, and distribution infrastructure throughout Haiti over the next five years, and are supporting EDH in its efforts to improve its commercial and financial performance [17].
The World Bank is investing $40 million in improving the T&D network in the Port-au-Prince area alone, IDB is spending $28 million [17], and USAID is spending $12.7 million [24] on the rehabilitation of the five substations in Port-au-Prince noted in the EDH action plan: Canape Vert, Carrefour Feuille, Toussaint Brave, Croix-des-Bouquets, and Nouveau Delmas [40]. Many smaller donors are also supporting improvements to the power infrastructure, such as the U.S. Trade and Development Agency, which donated $350,000 to EDH to support priority reconstruction projects [24].
5.7 Electricité d’Haïti Revenues, Costs, and Power Purchase Agreements Rates
Tetra Tech conducted a commercial analysis of EDH in August 2010 [26], revealing the extent of the utility's severe financial imbalance between revenues and costs. The operating costs of EDH at that time were about $13.8 million per month, with revenues collected far below costs. The revenues recovered before the earthquake, immediately after, and in the spring of 2010 are shown in Figure 17.
Figure 17. EDH costs, revenue collected, and deficit (2010)

51
The budget deficit shows the difference between costs and revenue for the utility, yielding a cost recovery rate of approximately 22%. According to an August 2012 report by the World Bank, EDH's cost recovery had not improved in the intervening two years [15]. This budget gap has traditionally been filled with transfers from the treasury of the Government of Haiti.
As of 2012, the residential electricity rate was $0.30/kWh. Commercial and industrial rates vary, but can be as high as $0.35/kWh depending on consumption [15].
Tetra Tech's 2010 analysis revealed EDH was paying between $0.16 /kWh and $0.30/kWh under existing PPAs. These are the base PPA rates; in some cases, added fuel surcharges drive the de facto electricity price as high as $0.34/kWh.6 It is expected the Trutier WTE project could operate under a PPA contract with the utility in a similar price range.
6 Ascertained during an NREL site visit in 2011.
52
6.0 Social and Environmental Factors The potential social and environmental impacts of a project—such as the health effects of air pollutants, contribution to global warming from greenhouse gases, and land-use impacts—are not captured or addressed in a simple financial analysis, which is focused on direct project cash flows and risk analysis. However, such "externalities" represent very real costs and benefits to society, and including them in an economic analysis provides a more complete picture of the advantages and disadvantages of each proposed project.
This chapter discusses qualitative social and environmental factors that should be considered when developing a WTE project in Haiti. It then derives quantitative measures of the costs and benefits associated with those factors for inclusion in a holistic economic analysis in Chapter 7.0.
6.1 Basis for Considering Social and Environmental Factors Key drivers for consideration of social and environmental factors in development of a WTE project lie in three essentially stakeholder-specific categories:
• Legal requirements imposed by the country in which the project is being developed
• Principles of project financial risk management • Social responsibilities involving the local, regional, and global environments [26].
Considerations in these categories fall under the rubric of sustainable development, a philosophical framework that encourages a holistic approach to project design. This approach considers environmental and social aspects not as add-ons, but as primary components of project design along with economic considerations. These three components, then, are defined to have broad objectives as follows:
• Economic evaluation - maximization of welfare • Sociological evaluation - social coherence • Ecological evaluation - preservation of the integrity of ecosystems [26].
The World Bank has issued a set of guidelines to be used when preparing an environmental assessment (EA) that is accepted by most other financiers. [27, 41]. Those guidelines state that potential adverse environmental and social consequences should be identified, minimized, and mitigated [26]. Consideration of social and environmental responsibilities involving local, regional, and global environments is required by some government agencies, bilateral and multilateral development agencies, various environmental groups, and neighboring communities that may be affected [27]. All financiers and some state legal regimes require EAs for energy projects [27]. The World Bank’s guidelines are supplemented with notes in an environmental assessment sourcebook available on the World Bank website [28].

53
6.1.1 Financiers’ Requirements for Sustainable Development
Direct project stakeholders, such as the developer, owner/operator, and financiers, will consider social and environmental aspects of development and operation because project returns and investments can be ruined by non-adherence to environmental standards. Furthermore, changes in environmental requirements imposed upon a project over its lifetime pose financial risks to a project [27].
6.1.2 Country-Specific Legal Requirements
Many developing countries have legal requirements regarding the social and environmental consequences of development [26]. Though a focused consideration of Haitian legal requirements is beyond the scope of this report, the passage in Haiti in 2002 of “Law on the Investment Code” (modifying the 1989 “Decree on the Investment Code”) is noteworthy in that it carves out for “[e]xemptions from duty and from taxes as well as other special benefits” and “certain kinds of investments [and investors, both national and foreign] likely to increase competitiveness in sectors, which are considered priorities or strategically important and because of their respective contributions to added value, to the creation of sustainable employment, to the renewal of national production equipment; to economic growth; to the reduction of balance of payments deficit and to the creation of a national labor force.” The law applies to “enterprises working toward improving the environment” and allows the Ministry of the Environment to recommend annulment of benefits to those whose processes generate negative externalities exceeding generally accepted levels.”
In other words, Haitian law requires that both internal and external costs and benefits of projects are addressed.
The law is also noteworthy in its provision to “any enterprise wishing to establish itself in a location where the infrastructures are insufficient or inexistent” authority to “build them and to exploit them…” [29]. The law appears to be generally supportive of sustainable development investments in Haiti and would likely support the development of the WTE projects explored in this report.
6.2 Qualitative Factors Externalities can be defined as the costs and benefits that arise when the social or economic activities of one group of people have an impact on another, and when the first group fails to fully account for their impact [30]. The EA takes account of project externalities by predicting alternative future states of resources and environment that will result from various development paths. It does this by base-lining environmental quality parameters, identifying significant impacts the project would have on the environment, and then quantifying the environmental impacts and analyzing qualitatively those that are less quantifiable [27].
A number of studies have discussed the externalities associated with various MSW management approaches. This chapter compiles external costs categories from the studies reviewed by the NREL team.

54
The practice of landfilling (and dumping) results in numerous environmental impacts that can be broadly categorized into two groups:
• Emissions to air, water, and soil • Impacts in terms of disamenity (visual intrusion, noise, odor, vermin, and litter)
[31].
The potential exposure pathways for human health come through:
• Landfill gases • Airborne dust • Leachate contamination • Direct contact (by employees and the public entering contaminated sites).
These externality costs are broader than the disamenity costs enumerated in this section and also cover:
• Greenhouse gases (GHGs) causing climate change • Conventional air pollutants and airborne toxic substances causing health effects • Leachate to soil and water • Risks of accidents and potential exposure at closed sites [32].
6.2.1 Emissions from Dumps and Landfills
AEA Technology (1998) calculates that in a landfill containing 1 million tonnes of mixed waste, 7 m3 of landfill gas with a methane content of 50% can be produced every year by every tonne of waste. Methane is a more potent GHG than carbon dioxide (CO2), albeit with a shorter atmospheric life. Landfill gas, mostly methane and CO2 created by the decomposition of wastes in a landfill, can continue to be emitted for 25 to 30 years after closure of a landfill site. Furthermore, volatile organic compounds (such as benzene and vinyl chloride) that are toxic or carcinogenic may cause health effects.
As for adverse health effects of living in proximity to landfill sites, the SAHSU (2001 and 2001b) study in the UK examined birth weights and cancers for residents living closer than 2 km to landfill sites. The study concluded there are small but significant excess health risks associated with living close to landfill sites [31]. Adverse health effects from modern landfills in the United Kingdom might be expected to have less severe health impacts than an open dump, such as Trutier, near the urban center Port-au-Prince.
Exposure to air and water pollution from some old-style landfills has been linked to developmental abnormalities, low birth weights, and cancer. A 1995 Canadian study showed high rates of stomach and cervical cancer among women living near a landfill and higher than normal incidence of stomach, liver, and prostate cancer in men. Concentrations of up to 25 parts per million of methane and known carcinogens benzene and vinyl chloride were recorded on streets near the landfill [33].
Dumps and landfills without liners can leach chemicals from discarded items, such as batteries, paints, and cleaners, directly into underground aquifers used for drinking
55
water. Water samples taken downslope of a municipal landfill that closed in 1985 in Norman, Oklahoma, revealed significant levels of benzene, toluene, and vinyl chloride. A study published in the March 1998 issue of Ecotoxicology and Environmental Safety recorded levels of these chemicals sufficient to cause abnormalities and death in amphibian embryos, though whether the toxicants posed a danger to humans in the area could not be confirmed. Unregulated landfills or dumps compound concerns about leachate because of the difficulty of knowing what they contain, making it difficult to know what types of toxicants to test for and what types of interactions may occur between different materials [32]
Uncovered landfills can also be a major source of biological contaminants, such as Clostridium botulinum (the bacterium that causes botulism), which can be carried by seagulls and other scavengers who feed at landfills [33].
6.2.2 Disamenity Costs of Dumps and Landfills
Disamenity costs can be thought of as those local nuisance costs, such as odor, dust, noise, vermin, and visual intrusion, experienced by households living close to a landfill that are associated with it [31].
Although these findings are not necessarily directly translatable to Haiti, it is interesting to note that a number of U.S. property price studies have found a significant effect on house prices associated with the existence of nearby landfill sites:
• In general, no price effects for houses farther than four miles (6.4 km) away from a site.
• As a rule of thumb, house prices increase by 5%-8% per mile (per 1.6 km) distance from a landfill site within a four-mile (6.4-km) radius.
• Studies focusing on shorter distances have found very large declines in prices of houses of close proximity to landfills (21%-30% within 0.25-0.5 mile, or 0.40-0.80 km) [31].
6.2.3 Benefits of Biodigester Waste-to-Energy
Energy empowerment is directly linked to poverty reduction, and quality of life has been said to be proportionally related to per capita energy use of a nation. Furthermore, in countries with electricity infrastructure that adequately serve only a fraction of the population, there is an opportunity to build a grid infrastructure that will accommodate a diversity of generation the future of renewable energy supply may require [33].
The potential labor intensity of biogas energy production and other activities in waste management presents opportunities for employment and broader income distribution. The economy can also be expected to benefit from the energy produced by WTE as a substitution for imported fossil fuels, potentially improving balance of payments and reducing exposure to risks of external price and currency fluctuations affecting prices of imported fossil fuels [33].
56
Biogas treatment of organic wastes (and other integrated waste management measures) can reduce expenditures on health care through significant improvements in sanitary and health conditions in the community served. This can manifest as a reduction in impact of intestinal diseases, which occurred in rural China with a reduction of schistosomiasis by 99%, as well as a reduction in tapeworm infections to 13% of pre-biogas levels with the introduction of biogas technology [33].
As biogas facilities produce rich organic waste, fertilizers, as a byproduct, can be used to replace commercial fertilizers. Inorganic fertilizers are often provided by means of subsidies, representing an opportunity for economic savings or repurposing of subsidies to support renewable energy and soil replacement work [33] in Haiti, which faces a challenging food security problem because the poor quality of its soils permits very little farming activity [34].
6.2.4 Baseline: Trutier Waste Facility
There are a number of possible alternatives to the WTE project under consideration. The business-as-usual case, in which Trutier is left as a trash dump with some areas operated as an unlined landfill, is the baseline. There are a number of challenges and uncertainties associated with a cost-benefit analysis using the Trutier dump scenario as a baseline, however. First, the current costs of operating the dump are not known and should be accounted for. Second, there are a number of uncertainties in valuing the externalities associated with an open dump such as Trutier. Such valuations tend to be highly location-specific, and externalities valuation studies such as those that have been done in the first world have not similarly been carried out in developing countries. With these caveats in mind, however, this study will present unqualified ranges of valuations from these studies somewhat as scoring mechanisms to indicate relative levels of impact of various externalities.
Another approach to assigning a cost to a given externality, however, is calculation of the cost of elimination or mitigation of that externality. In the case of an open, unlined dump, for example, the negative value of the leachate externality might be calculated as the monetized sum of the negative external environmental including health effects. Another approach might be to calculate the cost of installing a liner and leachate collection or collection and recirculation system to mitigate or eliminate those negative externalities, and use the cost of mitigation as a stand-in for the cost of the externality (an arguably much more difficult and uncertain quantity to calculate).
Another perspective that would appear to agree with this approach is the assessment that the Trutier dump in its current state is not a legitimate baseline by virtue of the standards the United Nations, the World Bank, and other development agencies and financiers apply to development projects. Arguably, certain costs should be incorporated into the baseline analysis of any situation below environmental standards of the prospective project participants.
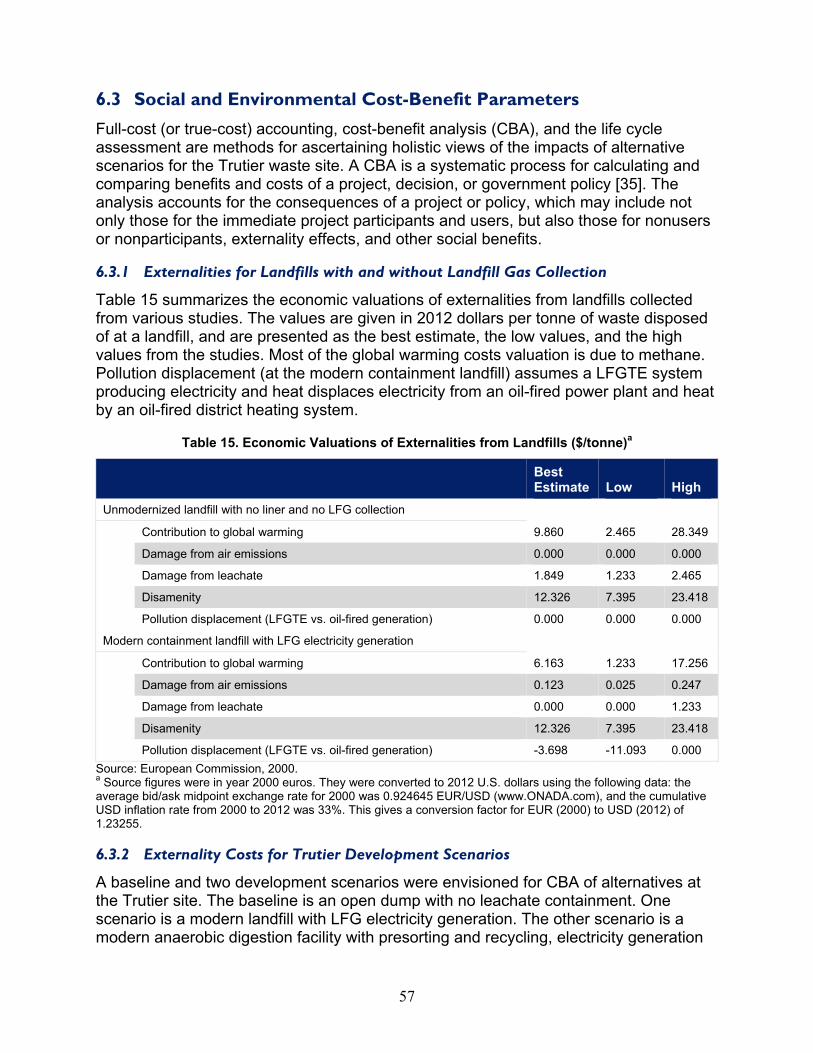
57
6.3 Social and Environmental Cost-Benefit Parameters Full-cost (or true-cost) accounting, cost-benefit analysis (CBA), and the life cycle assessment are methods for ascertaining holistic views of the impacts of alternative scenarios for the Trutier waste site. A CBA is a systematic process for calculating and comparing benefits and costs of a project, decision, or government policy [35]. The analysis accounts for the consequences of a project or policy, which may include not only those for the immediate project participants and users, but also those for nonusers or nonparticipants, externality effects, and other social benefits.
6.3.1 Externalities for Landfills with and without Landfill Gas Collection
Table 15 summarizes the economic valuations of externalities from landfills collected from various studies. The values are given in 2012 dollars per tonne of waste disposed of at a landfill, and are presented as the best estimate, the low values, and the high values from the studies. Most of the global warming costs valuation is due to methane. Pollution displacement (at the modern containment landfill) assumes a LFGTE system producing electricity and heat displaces electricity from an oil-fired power plant and heat by an oil-fired district heating system.
Table 15. Economic Valuations of Externalities from Landfills ($/tonne)a
Best Estimate Low High
Unmodernized landfill with no liner and no LFG collection
Contribution to global warming 9.860 2.465 28.349
Damage from air emissions 0.000 0.000 0.000
Damage from leachate 1.849 1.233 2.465
Disamenity 12.326 7.395 23.418
Pollution displacement (LFGTE vs. oil-fired generation) 0.000 0.000 0.000
Modern containment landfill with LFG electricity generation
Contribution to global warming 6.163 1.233 17.256
Damage from air emissions 0.123 0.025 0.247
Damage from leachate 0.000 0.000 1.233
Disamenity 12.326 7.395 23.418
Pollution displacement (LFGTE vs. oil-fired generation) -3.698 -11.093 0.000 Source: European Commission, 2000. a Source figures were in year 2000 euros. They were converted to 2012 U.S. dollars using the following data: the average bid/ask midpoint exchange rate for 2000 was 0.924645 EUR/USD (www.ONADA.com), and the cumulative USD inflation rate from 2000 to 2012 was 33%. This gives a conversion factor for EUR (2000) to USD (2012) of 1.23255.
6.3.2 Externality Costs for Trutier Development Scenarios
A baseline and two development scenarios were envisioned for CBA of alternatives at the Trutier site. The baseline is an open dump with no leachate containment. One scenario is a modern landfill with LFG electricity generation. The other scenario is a modern anaerobic digestion facility with presorting and recycling, electricity generation

58
from the gas product of the digestion, provision of the digestate to stakeholders who would haul the digestate away to be spread as a soil amendment, and the non-digestible portion of the waste continuing to be placed in the existing Trutier waste disposal site.
Because externality costs were not available for the exact scenarios contemplated as alternatives for analysis at Trutier, NREL utilized the externalities costs found in the literature and derived from them externalities costs that should be reasonable approximations of externalities costs for the alternatives contemplated for Trutier. Table 16 lists the externalities costs derived for the three alternatives. The derivations and rationale are described in the following paragraphs.
Table 16. Derived Externalities Costs for Three Alternative Scenarios at Trutier ($/tonne)
Unmodernized Landfill
Modern Landfill with LFG Generation
Anaerobic Digestion
Global Warming 15.000 6.163 2.582
Air Emissions 0.000 0.025 0.025
Leachate 1.849 0.000 0.000
Disamenity 3.000 3.000 3.000
Pollution Displacement (LFGTE vs. oil) 0.000 -1.627 -3.883
Total Net Cost (Externalities Only) 19.849 7.560 1.723
A number of influences were considered qualitatively and the factors adjusted accordingly in an effort to translate them from metrics for developed countries with much more land area to a third-world small island nation. The literature notes the different ways in which the factors were derived—some were derived via a “cost of mitigation” approach, while others were derived with a “cost of impact” approach.
Global Warming Components
Given the comparatively high percentage of organic solids in the Port-au-Prince waste stream, methane emissions will likewise be higher as the waste degrades in an open dump. Estimates of external costs due to global warming from old landfills ranged from $2 to $23 per tonne with the best estimate at $10 per tonne. A conservative estimate of the impact of the much higher organic solids content in the waste stream and correspondingly higher expected methane emissions, which are said to make up much more of the global warming impact from the waste than the CO2 emissions, justifies a number closer to the upper estimate. Fifteen dollars per tonne is still closer to the best estimate than to the upper end, but may help account for the expected higher methane emissions from an open dump with waste with high organic solids content. The best value given in the literature for a modern landfill with LFG generation is $6.163 per tonne.
Anaerobic digestion will have a much diminished global warming impact because it is “digesting” the organics much more thoroughly than the LFG case, as may be
59
evidenced by the additional energy production of the AD facility. Probably a more efficient collection and capture of the combustible gases as well as GHGs. Utilizing the energy production comparison factor as a scaling factor for difference in GHG production and capture between the AD scenario and the LFG generation scenario.
Air Emissions
The externality effects of waste disposal systems are highly dependent on the circumstances surrounding the specific site for disposal and the contents of the waste streams. Also, some categories of externalities are very local in their effects (proximate to the disposal site or the relatively local collection and transportation routes to the site), whereas others, such as global warming, affect the global commons and have geographically broader effects. In the case of harmful emissions to the atmosphere other than greenhouse gases, the harmful effects of air emissions may be considered to be relatively more local than global. The harmful effects of air emissions depend to some extent on the degree of dilution and dispersion of the emission flume as it is carried away from the site. Because Haiti is on an island and some air emissions will be dispersed over the ocean, NREL chose to use the low estimate for the external costs of air emissions. However, it should be noted that if the costs were based on the cost of mitigation, the value would be higher as a result of the emissions controls that would have to be added to the WTE project.
It may be that AD offers advantages in terms of the relative impact of air emissions over modern landfill flaring of gases and landfill with flaring and LFG electric power generation because of the waste sorting that precedes AD in the waste stream process, which might be expected to reduce the relative levels of volatile organic compounds in the gases that are combusted, leading to a cleaner-burning fuel in the AD case. However, as this difference is uncertain, NREL chose to use the same emissions externality cost for LFGTE and AD scenarios.
Leachate
For the old landfill, NREL used the best value estimate. This may be an underestimate of potential impacts of leachate and/or runoff cost as it does not take into consideration the costs associated with potential leachate penetration into the aquifer that is located under Trutier. For the modern landfill with LFG generation and AD cases, leachate management systems in the case of the former, and the waste sorting, processing, and then digestate handling systems in the latter, are thought to bring this cost to zero.
Disamenity
Disamenity costs are almost completely focused on effects on property values, and the studies that produced these figures were all done in developed countries where residents have more choice about where they live and land valuations are substantially higher than in Haiti. For this reason, NREL chose to use conservative estimates of the disamenity effects of proximity to waste disposal sites, using values below the lowest estimate in the first-world studies ($7-$23, with a best estimate of $12/tonne [did not change for type of facility]) and $3/tonne for all other scenarios.

60
Pollution Displacement (Landfill Gas-to-Energy vs. Oil)
The pollution displacement figure used for the LFGTE scenario is based on the best value number for displacing oil-fired power generation but is reduced to 46% of its original value because the best value estimate given in the source study is based on combined heat and power (CHP) generation from LFG with the heat utilized in a district heating application. In a modern, efficient CHP engine that includes all the cost-effective heat recovery equipment and 95% mechanical to electrical energy conversion, 46% of the useable output is electrical energy and 54% is useable heat. This study thus used a cost that was 46% of the number in the original study.

61
7.0 Financial and Economic Analysis This section considers the costs of various options for the Trutier waste site. Due to the many uncertainties regarding material, equipment, and labor costs in Haiti, U.S. mainland costs are provided.
First, the planning-level facility cost estimates for three scenarios are reviewed:
1. Leaving Trutier as a waste dump/unlined landfill—this is the baseline or business-as-usual scenario
2. Improving the Trutier waste site to modern landfill standards with a landfill gas capture system and electricity generation from the landfill gas
3. Constructing an AD facility at the Trutier waste site with electricity generation from the digester gas.
This section then presents financial analyses of each scenario first with capital costs undertaken by the project itself, then with capital costs covered by contributors. Finally, the economic (cost-benefit) analysis of each scenario, incorporating the quantified estimates of externalities that were derived in Section 0, is presented.
7.1 Cost Summary 7.1.1 Scenario 1: Waste Dump
It is assumed there is no capital cost in the baseline scenario of the existing Trutier waste facility. The baseline operating cost per tonne of waste disposal at the Trutier waste facility was estimated to be $7/tonne.
7.1.2 Scenario 2: Modern Landfill with Landfill Gas Capture and Electricity Generation
This scenario considers the financial consequences of improving the Trutier waste site to modern landfill standards with a landfill gas capture system and electricity generation from the landfill gas.
Table 17 shows the estimated capital costs for constructing an LFGTE facility would be $46.7 million. Note that costs in the right-hand column are shown to the nearest dollar; total cost at the end of the table is shown to the nearest $100,000.
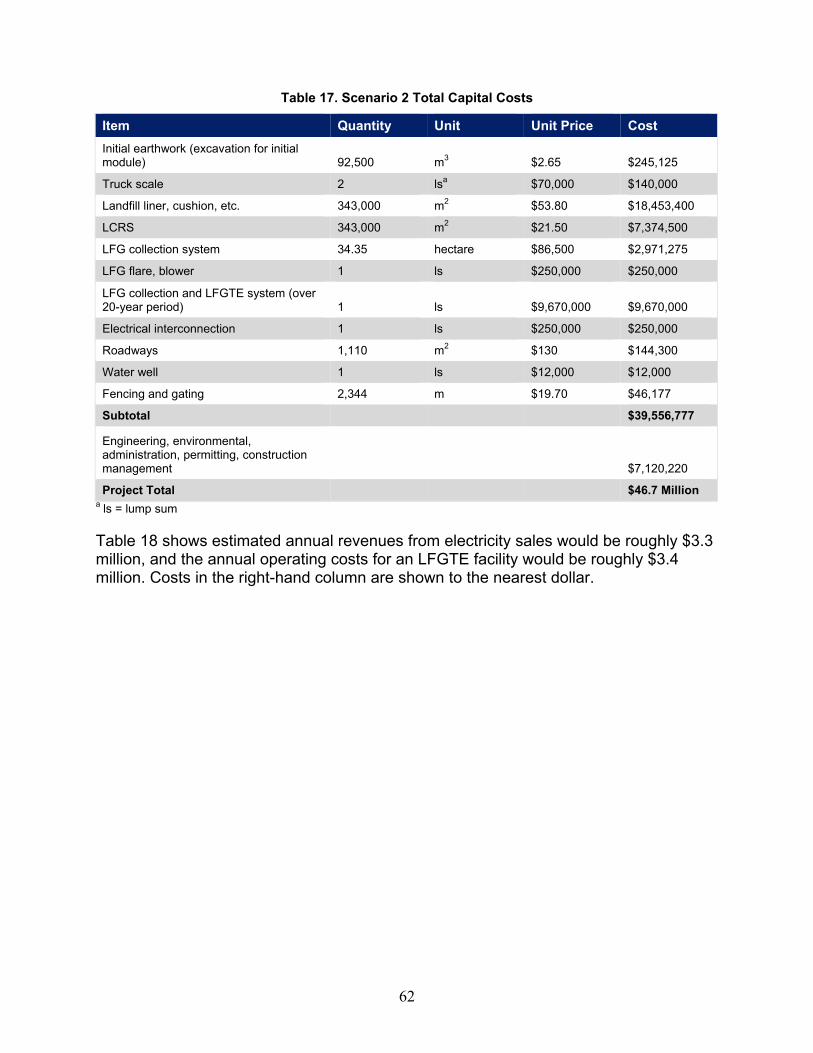
62
Table 17. Scenario 2 Total Capital Costs
Item Quantity Unit Unit Price Cost Initial earthwork (excavation for initial module) 92,500 m3 $2.65 $245,125
Truck scale 2 lsa $70,000 $140,000
Landfill liner, cushion, etc. 343,000 m2 $53.80 $18,453,400
LCRS 343,000 m2 $21.50 $7,374,500
LFG collection system 34.35 hectare $86,500 $2,971,275
LFG flare, blower 1 ls $250,000 $250,000
LFG collection and LFGTE system (over 20-year period) 1 ls $9,670,000 $9,670,000
Electrical interconnection 1 ls $250,000 $250,000
Roadways 1,110 m2 $130 $144,300
Water well 1 ls $12,000 $12,000
Fencing and gating 2,344 m $19.70 $46,177
Subtotal
$39,556,777
Engineering, environmental, administration, permitting, construction management
$7,120,220
Project Total
$46.7 Million a ls = lump sum
Table 18 shows estimated annual revenues from electricity sales would be roughly $3.3 million, and the annual operating costs for an LFGTE facility would be roughly $3.4 million. Costs in the right-hand column are shown to the nearest dollar.
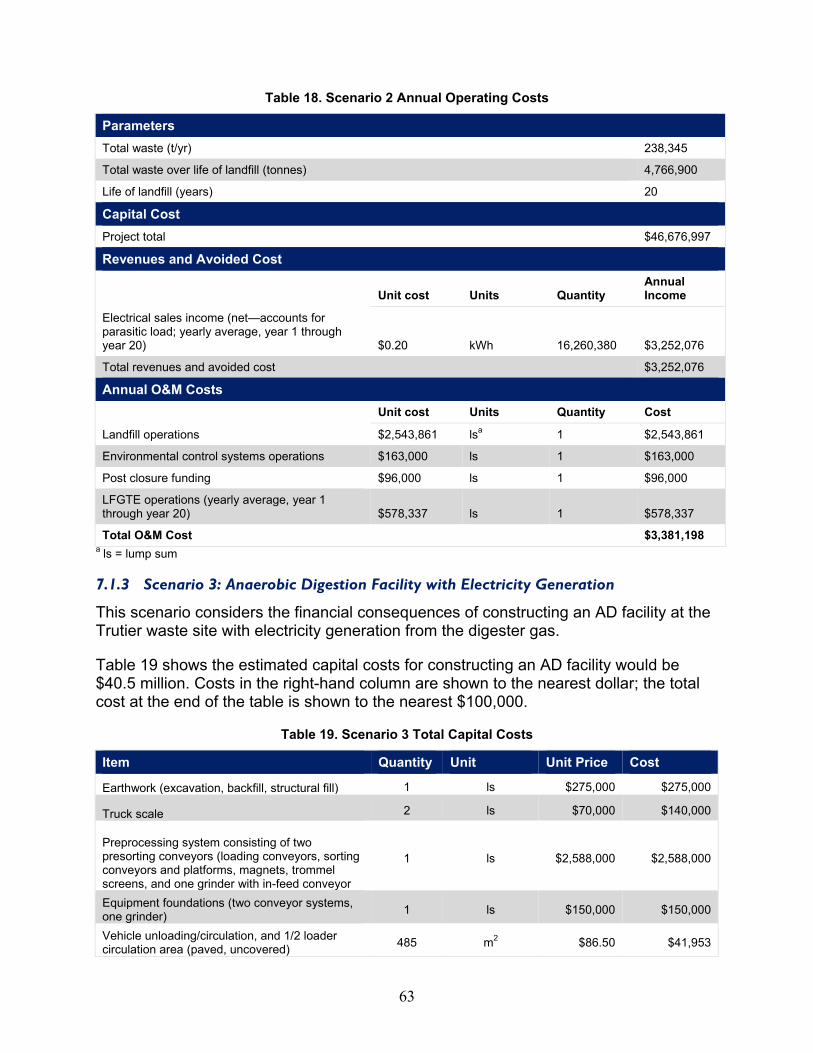
63
Table 18. Scenario 2 Annual Operating Costs
Parameters Total waste (t/yr) 238,345
Total waste over life of landfill (tonnes) 4,766,900
Life of landfill (years) 20
Capital Cost Project total $46,676,997
Revenues and Avoided Cost
Unit cost Units Quantity Annual Income
Electrical sales income (net—accounts for parasitic load; yearly average, year 1 through year 20) $0.20 kWh 16,260,380 $3,252,076
Total revenues and avoided cost $3,252,076
Annual O&M Costs Unit cost Units Quantity Cost
Landfill operations $2,543,861 lsa 1 $2,543,861
Environmental control systems operations $163,000 ls 1 $163,000
Post closure funding $96,000 ls 1 $96,000
LFGTE operations (yearly average, year 1 through year 20) $578,337 ls 1 $578,337
Total O&M Cost $3,381,198 a ls = lump sum
7.1.3 Scenario 3: Anaerobic Digestion Facility with Electricity Generation
This scenario considers the financial consequences of constructing an AD facility at the Trutier waste site with electricity generation from the digester gas.
Table 19 shows the estimated capital costs for constructing an AD facility would be $40.5 million. Costs in the right-hand column are shown to the nearest dollar; the total cost at the end of the table is shown to the nearest $100,000.
Table 19. Scenario 3 Total Capital Costs
Item Quantity Unit Unit Price Cost
Earthwork (excavation, backfill, structural fill) 1 ls $275,000 $275,000
Truck scale 2 ls $70,000 $140,000
Preprocessing system consisting of two presorting conveyors (loading conveyors, sorting conveyors and platforms, magnets, trommel screens, and one grinder with in-feed conveyor
1 ls $2,588,000 $2,588,000
Equipment foundations (two conveyor systems, one grinder) 1 ls $150,000 $150,000
Vehicle unloading/circulation, and 1/2 loader circulation area (paved, uncovered) 485 m2 $86.50 $41,953

64
Item Quantity Unit Unit Price Cost
Preprocessing building enclosure, concrete slab foundation, overhead lighting 5,000 m2 $700 $3,500,000
Groundwater pumping 1 ls $10,000 $10,000
Receiving pit 1 ls $128,000 $128,000
Dosing feed augers 1 ea $20,000 $20,000
Dose tank (heated and covered) 2,000 m3 $290.50 $581,000
Dose tank mixers 1 ea $40,000 $40,000
AD reactor feed pumps 3 ea $9,500 $28,500
AD reactor tanks (heated and covered, includes foundations) 12,200 m3 $237.50 $2,897,500
AD reactor mixing system 1 ls $2,400,000 $2,400,000
AD reactor heating tubes and hot water pumps 1 ls $204,000 $204,000
Digestate pumping 2 ea $14,000 $28,000
Centrifuges 2 ea $440,000 $880,000
Centrifuge hoppers and conveyors 2 ea $23,000 $46,000
Centrate storage tank 38 m3 $317 $12,046
Centrate pumps 2 ea $4,000 $8,000
Yard piping (buried process, water, sewer, drain piping) 1 ls $275,000 $275,000
Miscellaneous metals—stairways and platforms 1 ls $30,000 $30,000
Equipment building 500 m2 $492 $246,000
Biogas scrubber 1 ls $500,000 $500,000
IC engines and heat recovery modules 3 ea $1,700,000 $5,100,000
Engine building 400 m2 $492 $196,800
Biogas emergency flare and safety equipment 1 ls $145,000 $145,000
Electrical interconnection 1 ls $250,000 $250,000
Roadways 1,110 m2 $130 $144,300
Landscaping 1 ls $15,000 $15,000
Water well 1 ls $12,000 $12,000
Centrate evaporation pond earthwork 1 ls $100,000 $100,000
Centrate evaporation pond synthetic liner 60,800 m2 $13.50 $820,800
Fencing and gating 1 ls $25,000 $25,000 Subtotal $21,837,899
Electrical/I&C
$2,620,548
Mechanical
$1,965,411
Subtotal with subcontractors
$26,423,858
Undefined scope/contingency
$3,963,579
Contractor administration
$792,716
Contractor profit and overhead
$3,170,863
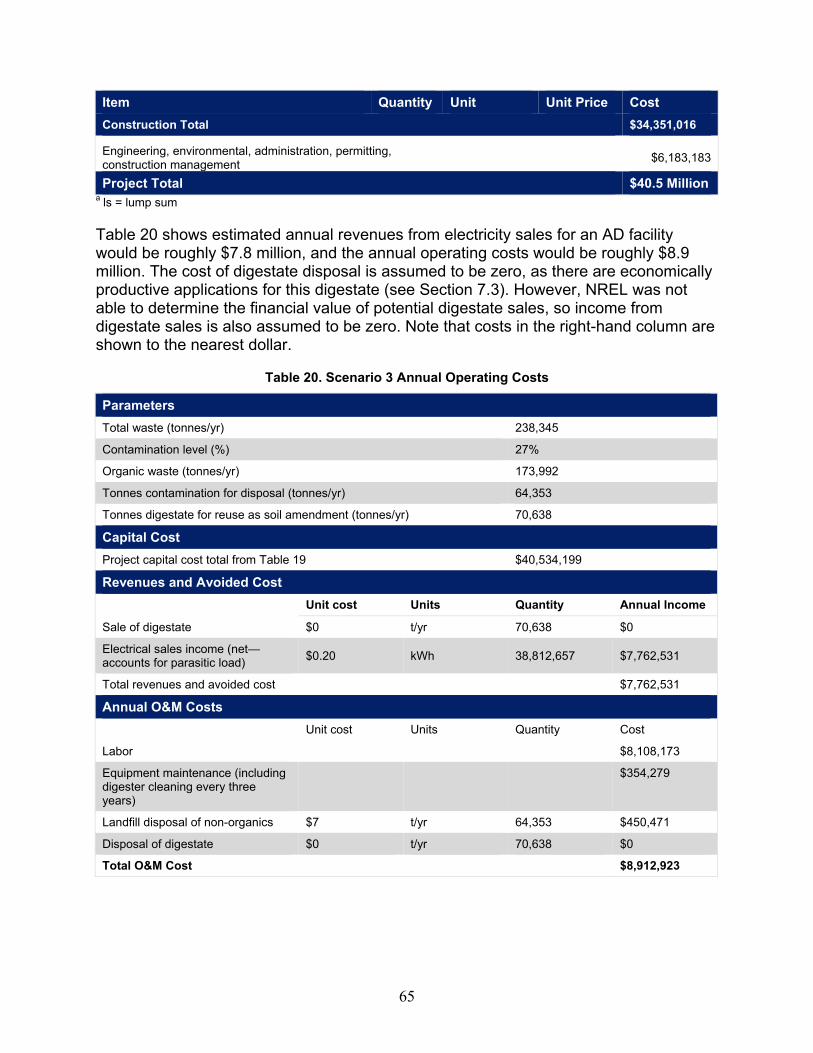
65
Item Quantity Unit Unit Price Cost Construction Total $34,351,016
Engineering, environmental, administration, permitting, construction management
$6,183,183
Project Total $40.5 Million a ls = lump sum
Table 20 shows estimated annual revenues from electricity sales for an AD facility would be roughly $7.8 million, and the annual operating costs would be roughly $8.9 million. The cost of digestate disposal is assumed to be zero, as there are economically productive applications for this digestate (see Section 7.3). However, NREL was not able to determine the financial value of potential digestate sales, so income from digestate sales is also assumed to be zero. Note that costs in the right-hand column are shown to the nearest dollar.
Table 20. Scenario 3 Annual Operating Costs
Parameters Total waste (tonnes/yr) 238,345
Contamination level (%) 27%
Organic waste (tonnes/yr) 173,992
Tonnes contamination for disposal (tonnes/yr) 64,353
Tonnes digestate for reuse as soil amendment (tonnes/yr) 70,638
Capital Cost Project capital cost total from Table 19 $40,534,199
Revenues and Avoided Cost
Unit cost Units Quantity Annual Income
Sale of digestate $0 t/yr 70,638 $0
Electrical sales income (net—accounts for parasitic load) $0.20 kWh 38,812,657 $7,762,531
Total revenues and avoided cost $7,762,531
Annual O&M Costs
Unit cost Units Quantity Cost
Labor
$8,108,173
Equipment maintenance (including digester cleaning every three years)
$354,279
Landfill disposal of non-organics $7 t/yr 64,353 $450,471
Disposal of digestate $0 t/yr 70,638 $0
Total O&M Cost $8,912,923

66
7.2 Financial Analysis This section presents comparative financial analyses of each scenario with capital costs undertaken by the project itself and with capital costs covered by contributors. Annual and per-tonne costs are provided. Capital costs include the cost of raising capital and the cost of borrowing (at 6% per year).
Table 21 shows the net annual costs of the business-as-usual scenario (keeping Trutier as a waste dump/unlined landfill) are roughly $1.7 million.
Assuming an energy-generation facility is developed as a commercial venture (capital costs included in calculations), the LFG facility would have a net cost of roughly $4.6 million per year, and the AD facility would have a net cost of roughly $5.0 million. Assuming capital costs are covered by the donor community, the LFG facility would have a net cost of roughly $0.1 million per year, and the AD facility would have a net cost of roughly $1.2 million. Note this is not an apples-to-apples comparison, as the total capital cost of the LFG facility is $6.2 million higher than the cost of the AD facility.
Table 21. Net Annual Costs for Each Scenario ($ millions)
Scenario 1: Waste Dump
Scenario 2: LFG Electricity Generation
Scenario 3: AD Electricity Generation
Annual amortized capital cost 0 4.476 3.887
Annual O&M cost 1.668 3.381 8.913
Annual revenues and avoided costs 0 -3.252 -7.763
Net annual cost (capital costs included) 1.668 4.606 5.038
Net annual cost (capital costs covered by donors) 1.668 0.129 1.152
Table 22 shows the net cost of the business-as-usual scenario is $7.00/tonne. Note that all of the figures in the table are rounded to the nearest ten cents.
Assuming an energy-generation facility is developed as a commercial venture (capital costs included in calculations), the LFG facility would have a net cost of roughly $19.30/tonne, and the AD facility would have a net cost of roughly $21.10/tonne. Assuming capital costs are covered by the donor community, the LFG facility would have a net cost of roughly $0.50/tonne, and the AD facility would have a net cost of roughly $4.80/tonne.

67
Table 22. Net per Tonne Costs for Each Scenario ($/tonne)
Scenario 1: Waste Dump
Scenario 2: LFG Electricity Generation
Scenario 3: AD Electricity Generation
Per tonne capital cost 0 18.80 16.30
Per tonne O&M cost 7.00 14.20 37.40
Per tonne revenues and avoided costs 0 -13.60 -32.60
Net per tonne cost (capital costs included) 7.00 19.30 21.10
Net per tonne cost (capital costs covered by donors) 7.00 0.50 4.80
7.3 Economic Analysis This section presents a per-tonne economic analysis of the three scenarios, including capital costs in the calculations and incorporating the quantified estimates of externalities costs that were derived in Section 0. As described in Section 0, financial analysis is focused on direct project cash flow and does not take into consideration the potential environmental costs and benefits of projects, such as emissions of air pollutants and GHG or land-use impacts. Such externalities represent very real costs and benefits to society, and including them in an economic analysis provides a more complete picture of the advantages and disadvantages of each scenario.
Table 23 shows that, when quantifiable project externalities are included, the cost of continuing to operate the Trutier waste site as a dump/unlined landfill grows to $26.80/tonne, upgrading the site to a lined landfill with LFG electricity generation would cost $26.90/tonne, and upgrading the site to an AD plant with electricity generation would cost $22.90/tonne. All of the figures in the table are rounded to the nearest ten cents. Negative costs are benefits.
Table 23. Per Tonne Economic Analysis for Each Scenario ($/tonne)
Scenario 1: Waste Dump
Scenario 2: LFG Electricity Generation
Scenario 3: AD Electricity Generation
Net project-direct cost—financial analysis (Table 22) 7.00 19.30 21.10
Net project externalities (Table 16) 19.80 7.60 1.70
Total net cost—economic analysis 26.80 26.90 22.90
These net economic cost figures include the externalities noted in Section 0. Many external costs and benefits are difficult to capture, and there are other externalities that NREL was not able to quantify, such as the value to the local economy the jobs that could be created at the facility adds, the greater economic security provided by the additional electricity generation, and the additional food security and employment in farming and forestry industries that could result from the application of a nutrient-rich fertilizer/soil-amendment byproduct (the AD digestate) to agricultural land and

68
deforested hillsides. Inclusion of a broader range of externalities would likely improve the economics of both the LFG and AD scenarios, particularly the AD scenario.
7.4 Economic Sensitivities to Variables To explore the economic effect of key assumptions noted above on the economic pro forma, a sensitivity analysis of the impact of these variables was prepared. The key variables explored include the effect of:
• Haitian labor rates • The spreading of digestate for the AD option • Trutier waste facility operations for the placement of residuals for the AD facility
option.
This analysis was prepared as follows:
The effect of using Haitian labor rates as opposed to U.S. labor rates7 was explored by applying a ratio of the Haitian labor rate8 of $0.90 per hour compared to $8.00 per hour for minimum wage labor in California, United States, which was the source of the reference facilities developed for this report (California's minimum wage is higher than the U.S. federal minimum wage of $7.25). This ratio of labor rates was applied to all operational labor rates developed in the prior analysis. The result is a significant reduction in operations costs from $8.9 million to $1.7 million for the AD option as illustrated in column AD 1 of Table 24. Similarly, the lower labor rates were applied to the landfill option. The reduced operations costs are less significant due to the lesser reliance on labor and higher reliance on heavy operating equipment. The reduced Haitian labor rates are shown in column LF 1.
While this reduction in cost is attractive to the project pro forma, it does not necessarily convey an accurate economic projection of the facility cost. Instead, there are likely to be labor-related costs that are both higher and lower than the U.S. labor cost included in the original pro forma. For example, it is unlikely that low-cost Haitian labor can be used to operate and maintain the equipment to the satisfaction of the manufacturer’s warranty. Also, it may be appropriate to include elevated cost of construction labor to mobilize and construct either of the facilities. At this point, the higher cost for importing skilled labor to construct, operate, and maintain the system is not known and has not been included in this sensitivity analysis. The important point to consider is the possible variability in the project pro forma due to this single issue of the cost of labor.
7 U.S. federal minimum wage is $7.25 for an eight-hour day (www.dol.gov/whd/minwage/america.htm), although 19 states have minimum wages higher than this. 8 Daily minimum wage: 300 Haitian gourdes (HTG) = $7.24. One U.S. dollar = 41.4474 HTG using mid-market rates as of 19:22 UTC Nov. 21, 2013 (www.xe.com/currency/htg-haitian-gourde?r=3). The Haitian standard work week is eight hours per day and 48 hours per week (which means a six-day work week), according to Article 96 of the Haitian Labor Code as reported in Haiti Libre on Sept. 14, 2012 (www.haitilibre.com/en/news-6645-haiti-economy-minimum-wage-300-gourdes-on-1-october-2012.html).

69
The effect of paying for the spreading of digestate to reflect a similar approach to the use of wastewater treatment biosolids as land application was explored. Although the digestate material may have agricultural properties, the agricultural community may not be capable or interested in acquiring and using the material. To maintain a functioning facility, the digestate will need to be removed from the site regardless of the agricultural community’s appetite. So, similar to a wastewater treatment plant with excess biosolids in the U.S., the cost of applying the material may need to be incorporated into the cost of the facility. The increased cost associated with spreading digestate as opposed to the currently modeled assumption of the digestate being free at the facility but necessitating those interested in paying for hauling and spreading of the digestate was explored. The estimated cost of $100/wet tonne was used to reflect the approximate cost for hauling (a distance of no more than 20 km) and spreading the digestate similar to that of land application of biosolids. This increase in costs is reflected by an increase in the operations cost of approximately $2.12 million per year. Assuming the reduced Haitian labor rates in column AD 1 of Table 24, the resulting operations cost of $3.84 million in column AD 2 illustrates these costs with the increased digestate spreading cost.
The effect of increased Trutier waste facility operations cost was also explored. The increased cost of waste receipt and placement was increased from the prior $7/tonne to $20/tonne. The $20/tonne figure is intended to reflect the cost of a landfill equipped with a liner and modern sanitary waste placement protocols, but not necessarily a landfill gas collection system or related improvements. This change of waste disposal costs would increase the operations cost by approximately $1.35 million per year. Building on the prior analysis and using the lower Haitian labor with the increased digestate spreading cost, the resulting operations cost is $5.19 million, as shown in column AD 3 of Table 24.
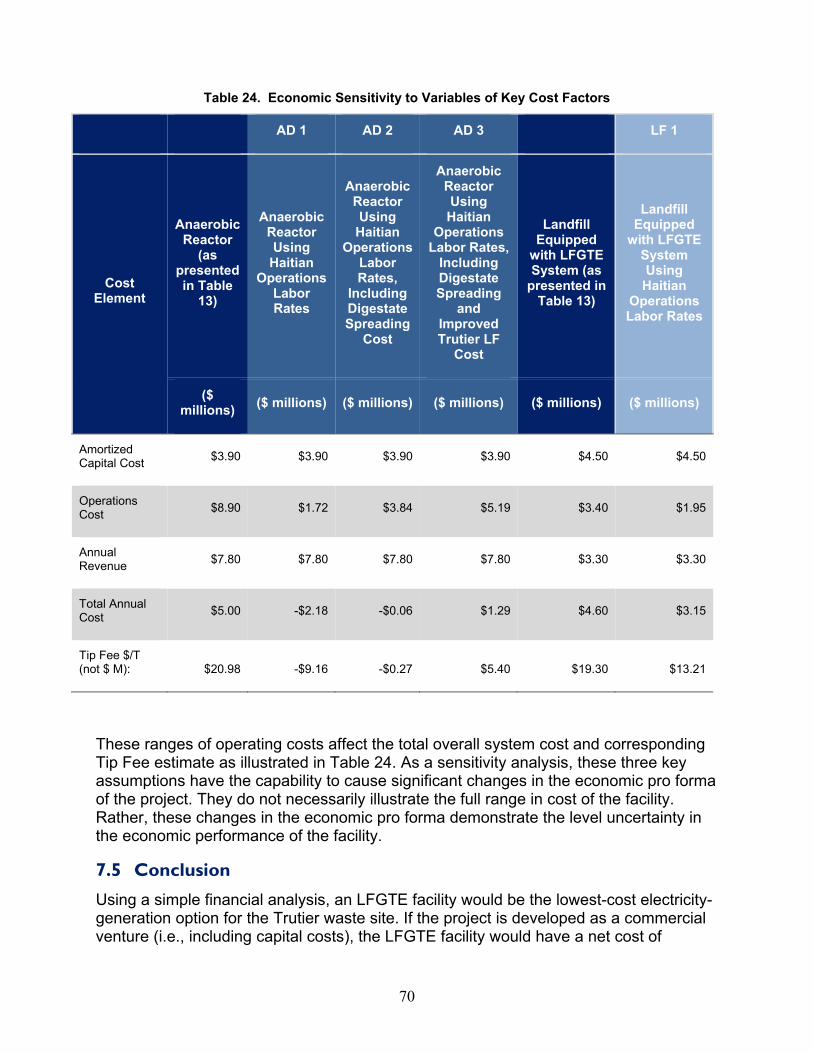
70
Table 24. Economic Sensitivity to Variables of Key Cost Factors
AD 1 AD 2 AD 3 LF 1
Cost Element
Anaerobic Reactor
(as presented in Table
13)
Anaerobic Reactor Using
Haitian Operations
Labor Rates
Anaerobic Reactor Using
Haitian Operations
Labor Rates,
Including Digestate Spreading
Cost
Anaerobic Reactor Using Haitian
Operations Labor Rates,
Including Digestate Spreading
and Improved Trutier LF
Cost
Landfill Equipped
with LFGTE System (as
presented in Table 13)
Landfill Equipped
with LFGTE System Using Haitian
Operations Labor Rates
($ millions) ($ millions) ($ millions) ($ millions) ($ millions) ($ millions)
Amortized Capital Cost $3.90 $3.90 $3.90 $3.90 $4.50 $4.50
Operations Cost $8.90 $1.72 $3.84 $5.19 $3.40 $1.95
Annual Revenue $7.80 $7.80 $7.80 $7.80 $3.30 $3.30
Total Annual Cost $5.00 -$2.18 -$0.06 $1.29 $4.60 $3.15
Tip Fee $/T (not $ M): $20.98 -$9.16 -$0.27 $5.40 $19.30 $13.21
These ranges of operating costs affect the total overall system cost and corresponding Tip Fee estimate as illustrated in Table 24. As a sensitivity analysis, these three key assumptions have the capability to cause significant changes in the economic pro forma of the project. They do not necessarily illustrate the full range in cost of the facility. Rather, these changes in the economic pro forma demonstrate the level uncertainty in the economic performance of the facility.
7.5 Conclusion Using a simple financial analysis, an LFGTE facility would be the lowest-cost electricity-generation option for the Trutier waste site. If the project is developed as a commercial venture (i.e., including capital costs), the LFGTE facility would have a net cost of

71
roughly $19.30/tonne, versus $21.10/tonne for an AD facility. If capital costs are covered by the donor community, the LFGTE facility would have a net operating cost of roughly $0.50/tonne, versus $4.80/tonne for an AD facility.
Using an economic analysis that includes quantifiable environmental costs and benefits, an AD facility would be the lowest-cost electricity-generation option for the Trutier site, costing roughly $22.90/tonne, versus $26.90/tonne for an LFGTE facility.
72
8.0 Project Development Steps This section outlines the project development considerations for an AD WTE project at the Trutier waste site in Haiti. It uses NREL’s SROPTTCTM project development framework to examine the key issues and identifies the next steps needed to move the project forward. NREL utilizes a standardized, proven project development framework when analyzing and supporting projects. This framework highlights the key steps in project-level development. These steps and the current information for each step are described below.
In the second phase of the project, a waste sort was performed by UNOPS, and it appears the waste stream going to the landfill is larger than previously estimated. The waste sort also confirmed that AD is likely the preferred technology for a WTE system due to the high proportion of moist organics in the waste stream. With these findings, the project team evaluated project-level considerations and identified steps to reduce any uncertainties associated with the project.
8.1 Site The choice of site for a WTE project is paramount to project success. A site with desirable characteristics, such as easy access, proximity to existing waste streams, available water, access to electric transmission, and off-take potential is needed. NREL identified several sites and ranked them for desirability [36]. Based on the sites visited and discussions with UNOPS and SMCRS, the preferred location for a WTE plant is the Trutier waste site. There is available land, and waste would not have to be diverted from current transport routes. Land would need to be acquired (leased or purchased) at each of the other potential locations. The rankings and NREL's discussions with project stakeholders show a clear preference for Trutier as the WTE project site. A summary of the rankings is shown in Figure 18.

73
Figure 18. Graphical comparison of each site
The Trutier landfill has 250 hectares of land, which is divided into areas that hold MSW, human waste, medical waste, rubble, and canal waste. It is operated by SMCRS, which is an autonomous entity under the Ministry of Public Works. Public Works provides technical advice and guidelines, and the Ministry of Interior provides funding for SMCRS. About 25% of the land available at the waste site is currently in use. People living at the landfill currently sort some of the waste—after the trucks dump the waste, plastic bags are torn open, and plastic bottles are separated by hand. Plastic bottles are sold to a local company that bails them and ships them to China. Scales are already present at the site and ready to be installed for monitoring truck deliveries. SMCRS is considering tipping fees, but has not settled on a price; currently, all dumping is funded by GOH or donor organizations. The landfill is currently employing 76 people and operates 24 hours a day.
During meetings with NREL staff, SMCRS indicated interest in a WTE plant being located at Trutier. Also, SMCRS confirmed it is possible for them to own and operate a power generation facility.
The next steps include:
The project team needs to discuss siting of the WTE project at Trutier with SMCRS. SMCRS needs to identify available pieces of property for the project within the landfill boundary. Options for allowing a lease, easement, or other mechanism to officially establish the legal right to utilize space at Trutier should be explored with SMCRS (this
0
10
20
30
40
50
60
70
80
Rue
de F
rère
, Tab
arre
Rue
Lesp
inas
se, T
abar
re
Rue
Roum
ain,
Tab
arre
27
Mor
ne C
abri
Mor
ne C
abri
Trut
ier
Site 1 Site 2 Site 3 Site 4 Site 5 Site 6
Geographic Available Space
Geographic Near Collection
Geographic Accessable
Geographic Topography
Geographic Roads
Electrical Interconnection Voltage
Electrical Access
Water Drainage
Water Water Available

74
is not needed if SMCRS owned the project). The project team needs to determine the approximate footprint required for the project, given the new waste sort information from UNOPS, and provide this for discussions with SMCRS.
8.2 Resource The feedstock for a WTE project needs to be controlled and maintained to ensure a sufficient amount of waste is available in order to produce the required power output. When developing a WTE project, the project implementation team should attempt to secure control of the waste stream in question for this project to reduce the risk that it may not be available. This is typically done through a contractual arrangement.
Currently, there is no coordination between SMCRS and private waste collection companies. Private waste collection companies operate under contracts with the Ministry of Finance and private non-government organizations. Once their money runs out, they quit collecting waste. The contracts are not based on performance, it appears, and there are multiple disparate collection companies making coordinating contracts difficult. The simplest path forward appears to be to secure the rights to the organic waste that enters Trutier regardless of who brings it in. This would be most easily accomplished through SMCRS.
The next steps include:
Discuss the ability for flow control of waste with SMCRS. Determine if there is a contractual mechanism that could guarantee the WTE project will have rights or control over the organic waste brought to Trutier. Address the social implications of having the organic waste go to the digester system prior to the residents of Trutier being allowed to sort through it. Perhaps this potential conflict can be mitigated by hiring the residents as waste sorters.
8.3 Off-Take The financial viability of the proposed Trutier WTE project hinges on the ability to sign an agreement to sell electricity, biogas, or compost at sufficient quantities and prices to recoup costs.
An electrical off-take agreement in the form of a PPA is the most likely scenario. EDH only enters into PPAs through a transparent public request for proposal process that includes open bids. For PPAs, the Ministry of Finance, Ministry of Public Works, and EDH need to be included in planning and will have signature authority.
A technical study for interconnection performed by EDH would also be required, as EDH transmission capacity is limited (see Section 5.0). During discussions with NREL, EDH said the grid would have difficulty accepting more than 5 MW to 10 MW of additional generation at the present time. This size range would be easier because it could tie into 12-kV lines, and larger plant sizes would need to tie into the more constrained 69-kV lines.
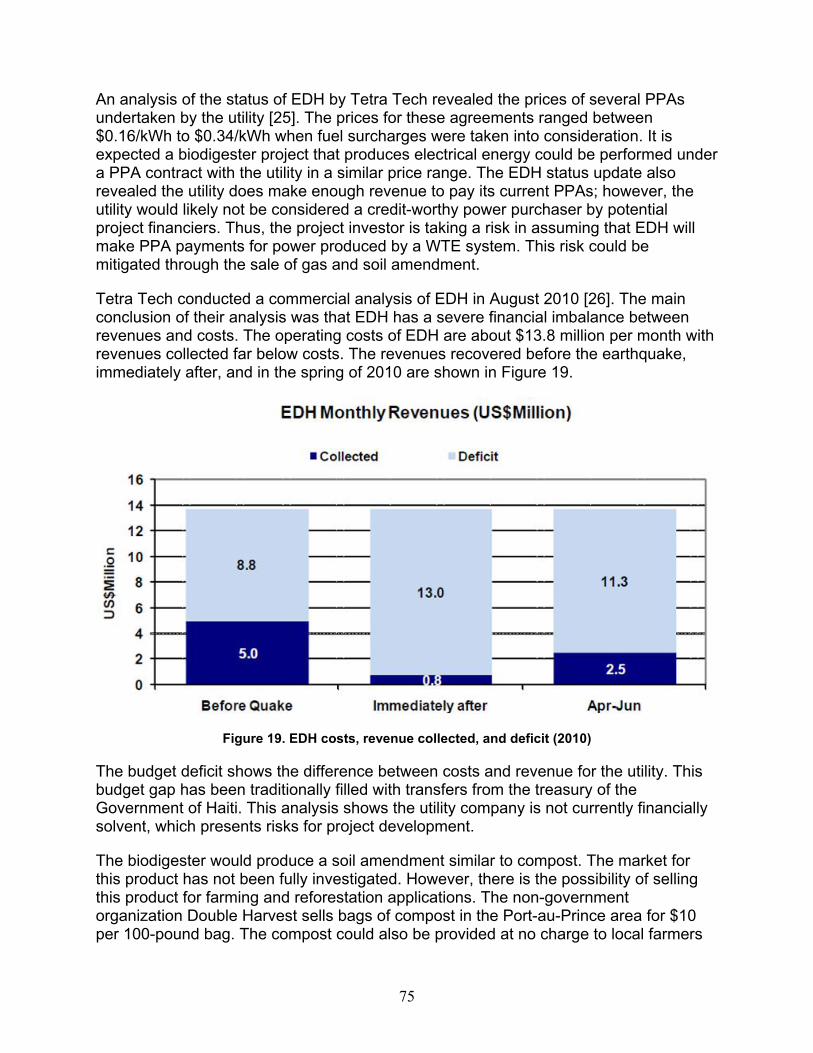
75
An analysis of the status of EDH by Tetra Tech revealed the prices of several PPAs undertaken by the utility [25]. The prices for these agreements ranged between $0.16/kWh to $0.34/kWh when fuel surcharges were taken into consideration. It is expected a biodigester project that produces electrical energy could be performed under a PPA contract with the utility in a similar price range. The EDH status update also revealed the utility does make enough revenue to pay its current PPAs; however, the utility would likely not be considered a credit-worthy power purchaser by potential project financiers. Thus, the project investor is taking a risk in assuming that EDH will make PPA payments for power produced by a WTE system. This risk could be mitigated through the sale of gas and soil amendment.
Tetra Tech conducted a commercial analysis of EDH in August 2010 [26]. The main conclusion of their analysis was that EDH has a severe financial imbalance between revenues and costs. The operating costs of EDH are about $13.8 million per month with revenues collected far below costs. The revenues recovered before the earthquake, immediately after, and in the spring of 2010 are shown in Figure 19.
Figure 19. EDH costs, revenue collected, and deficit (2010)
The budget deficit shows the difference between costs and revenue for the utility. This budget gap has been traditionally filled with transfers from the treasury of the Government of Haiti. This analysis shows the utility company is not currently financially solvent, which presents risks for project development.
The biodigester would produce a soil amendment similar to compost. The market for this product has not been fully investigated. However, there is the possibility of selling this product for farming and reforestation applications. The non-government organization Double Harvest sells bags of compost in the Port-au-Prince area for $10 per 100-pound bag. The compost could also be provided at no charge to local farmers

76
or organizations to improve soil conditions or used as landfill coverage as the waste is currently covered each night.
If an electrical off-take agreement could not be signed, it would be possible to sell the gas produced by the digester for cooking, heating, or other industrial applications. This would require additional equipment to capture and transport the gas to a customer and a different contract. The potential market for this has not been investigated but appears limited based on current knowledge.
The next steps include:
Hold discussions with EDH to determine if they are intending to have an open competition for additional power in the near future, to explore grid interconnection options near Trutier, and to ascertain the potential for a PPA agreement with a GOH entity.
8.4 Permits The construction and operation of a WTE project will require permits from the Government of Haiti. Water, air, and other environmental permits require coordination with DINEPA. All government-backed loans and incentives require coordination with the Department of Finance. It is unclear what construction and building permits, if any, are required.
The next steps include:
Once the final site has been identified, investigate the permitting process further.
8.5 Technology The recent waste sort appears to have confirmed the selection of a biodigester as the most appropriate technology for a WTE project in Haiti.
Biodigesters are relatively common, and the technology is well understood. However, there is a risk the technology will not perform as designed. The opportunity for co-firing with diesel or HFO should also be examined if the need for power is greater than the output of the WTE plant or if conventional power plants are also needed in the area. Operating parameters and maintenance requirements of the WTE plant will need to be understood.
The next steps include:
Confirm technology selection and project size.
8.6 Team The team of participants to develop, design, and build a WTE project in Haiti has yet to be identified. In order for this feasibility study to be developed into a project, multiple team members are needed. Key roles on the team include project developers, project

77
managers, construction teams, Haitian government organizations, and project financiers.
The next steps include:
Determine who the likely members of a project development team would be. Initiate discussions between those members as to the commitments and resources they could provide to successfully develop, build, and operate a WTE project, and to ascertain their perceived risks.
8.7 Capital The capital markets in Haiti are limited. The capacity for both the government and the private sector to borrow money is subject to challenges and high interest rates. Many government enterprises in Haiti appear to be largely insolvent and are consequently not credit-worthy organizations. Private-sector borrowing appears to be limited and subject to annual interest rates as high as 30%. The reduced ability for both the private sector and the government to borrow capital at reasonable interest rates limits the financial viability of new electricity generation facilities. This also emphasizes the need for foreign government or development bank financing.
In determining the most appropriate WTE project financing vehicle, it is important to consider whether the goal is to build a financially self-sustaining project or to provide as much aid as possible. The previous waste collection programs undertaken in Haiti provided great benefits and aid in the cleanup of Port-au-Prince, but were not financially self-sustaining because they did not produce a positive financial return. The optimal system of biodigesters depends on economic and aid goals, and these goals will need to be determined for inclusion in further analysis.
The next steps include:
Determine possible financing options with the stakeholder group. Evaluate the potential for each option and its positive and negative aspects. Continue to refine and update estimates of project capital costs and economic value.
8.8 Conclusion There are many steps and aspects to consider in order to develop, design, construct, and operate a WTE system in Haiti. The UNOPS waste sort has helped clarify project size and technology; however, much more work is need regarding project siting, resource control, off-take agreements, project team, and project capital. Discussions with stakeholders to determine common goals, gather additional information, and inform the feasibility analysis of WTE options will be held in the near term and as needed through completion of the feasibility analysis.

78
9.0 Project Risks There are a wide variety of potential challenges associated with developing a WTE project in Haiti. This section summarizes some key risks faced by the proposed AD plant at Trutier, all of which have been described in preceding sections.
9.1 Technology-Related Risks There are several technology-related uncertainties associated with the project.
• Properties of the waste stream. Waste characterization studies provide an indication of the materials collected and their properties at the time of collection, but one can only estimate the actual quantities and characteristics of the waste generated over time. This analysis assumes roughly 74% organics, 27% total solids, 85% volatile solids, 58% of the gas volume as methane, and 653 wet tonnes of waste being delivered per day. However, if the quantity of waste collected increases, the properties of the waste stream could be different than indicated by collection studies, which could affect technology performance. In addition, only a single waste characterization was performed. It would be preferable to perform three or four studies at different times of the year to determine how the quantity, components, and properties of the waste collected vary by season.
• Waste flow control. The feedstock for the AD project needs to be controlled and maintained to ensure a sufficient quantity of waste and the right sort of waste is available to produce the plant's target power output. The project investor should attempt to secure control of the waste stream in question for this project to reduce the risk it is not available. This is typically done through a contractual process [9, 10].
• Technology performance. Biodigesters are relatively common, and the technology is well understood. However, there is a risk the technology will not perform as designed, especially in light of uncertainties about the properties of the waste stream.
• Project sizing. The most appropriate WTE project size (in terms of tonnes per day processed or electricity generated) has been determined based on the waste currently being delivered to Trutier. However, there is a risk the project chosen will be over- or undersized if the waste generation or waste collection rate changes significantly.
• Regulations and permitting. The Environmental Ministry is responsible for the requirements and regulations for waste disposal in Haiti. Currently, the waste disposal system is not functioning properly, and it is unclear how it will evolve in the future. NREL was unable to find information about regulations pertaining to WTE projects in Haiti and further research is needed in this area to determine factors, such as legal status and permitting requirements. As an “unknown,” this variable presents a risk for future project development.

79
9.2 Other Potential Failure Mechanisms Other uncertainties surrounding the AD project include the following:
• Project costs and revenues. Sources of uncertainty within the analysis include capital costs, which are estimated to be between -15% to +30% of the values quoted. To this a contingency is added, which is an attempt to account for uncertainty in cost estimates and scheduling, and in effect, offsetting risk. Further, these costs are quoted as if it were a U.S. installation; capital and operating costs for an installation in Haiti cannot be accurately ascertained without conducting an investment-grade project development feasibility study. The revenues from power sales do not pay for the cost of the infrastructure and operations of either proposed system, despite the relatively high value of electricity ($0.20 per kilowatt-hour). Facility tip fees are needed in each of the two system scenarios for the facility to be self-funded, and it is uncertain if such fees could be implemented.
• Uncertain events. Examples include the risk of earthquakes and hurricanes impacting the facility. Some of these could be modeled with historical statistics. For example, the likelihood of a category 1 hurricane striking can be derived from historical records. Other events that could impact the financial prospects of a WTE project are more uncertain and unpredictable.
• Grid interconnection. There are uncertainties regarding the ability of the WTE facility to connect to the grid given the various challenges with the grid in the Port-au-Prince area.
• Project development team. The team that will develop, design, and build a WTE facility in Haiti has yet to be identified. The composition of this team is critical to project success.
• Project financing. According to the desktop study that NREL conducted in 2010, "Haiti presents a challenging environment for doing business and project development. Currently the local utility EDH does not appear to be fiscally solvent or a credit-worthy off-taker for the power generated from a biodigester project, although it does appear that current PPA providers are being paid by EDH. Due to limited capital markets and the financial condition of the utility, financing for electricity generation projects will likely be needed from foreign governments or development banks [4].” Note the 6% financing rate used in this report assumes that financing will be secured in a developed country, not Haiti. There is the possibility that a lender might require a higher financing rate due to risks associated with working in Haiti, including the prospect of the utility defaulting on the PPA payments.
9.3 Case Study: Project Risks Faced by E-Power E-Power is a 32-MW gross, 30-MW net, HFO/diesel power plant located within a few kilometers of the Trutier dump. The cost of the facility was $50 million to $59 million (various costs are cited on their website).
The following timeline, from E-Power’s website [37], provides a case study of some of the difficulties an electricity-generation project can encounter, including, in this case, the
80
financial collapse of 2008, the earthquake of January 2010, the cholera outbreak in 2010, and the demonstrations following presidential elections, also in 2010. It also demonstrates the value of persistence. The text has been copied directly from the site, without edits or modifications.
June 2004: Daniel Gérard Rouzier launches the project idea.
March 2005: 56 Haitian and Haitian American Professionals create E-Power S.A. and make commitment to invest $56 million in the production of electricity. Citibank and Overseas Private Investment Corporation (OPIC) immediately show interest in the project.
October-December 2006: E-power participates and wins an international request for proposal (quotation) (international bidding) launched by EDH to build a 30-Megawatt-electric plant in Cite Soleil.
March 26, 2007: E-Power is declared winner of the international bidding for the construction of an electric plant in Cite Soleil.
January 17, 2008: E-Power, the Public Works Ministry and the Ministry of finance sign a 30 Megawatt, 15-year, power purchase agreement that will save nearly $24 million to the National Treasure.
March 14, 2008: La Convention d'Etablissement est signée.
May 28, 2008: The Haitian Government grants a Contract with Sovereign Guarantee to the project.
July 2008: The Financial Crisis causes the Citibank and OPIC to rethink their involvement. On July 16th, E-Power turns to the World Bank for financial support and contacts three local banks on July 29th: Sogebank, BNC and Capital Bank.
August 14, 2008: On August 14th, OPIC withdraw.
August 15, 2008: The negotiations with IFC-World Bank Group, the Entrepreneurial Development Bank of the Netherlands (FMO), PROPARCO, CIFI, Sogebank, BNC et Capital Bank begin.
August 22, 2008: E-Power signs a US $ 4 million contract with Hyundai Heavy Industries for the plants erection.
August-November 2008: PROPARCO and CIFI withdraw on August 30th and November 15th.
April 1, 2009: Basic Energy, our technical partner is rethinking our business association. On April 10th, E-Power contacts Korea East-West Power Company (EWP).
81
April 15- May 15, 2009: Capital Bank withdraw on April 15 and Basic Energy, a month later.
June 25, 2009: E-Power signs a contract with EWP who acquires 30% of E-Power S.A on June 30th.
July 1, 2009: E-Power signs loans agreements with --- and ----- with DECCO Ltd.
October 1, 2009: DECCO begins the construction of the plant in Cité Soleil.
January 2010: After the devastating earthquake of January 12, the ship carrying the plant refuses to land in Port-au-Prince and our 16.000 tons of supplies are landed in Rio Haina, Dominican Republic (about 230 km from Port-au-Prince).
February 25, 2010: After days of negotiations with the US Navy, insurance companies and the plant are finally unloaded in Port-au-Prince and the construction is resumed in March.
October 2010: An outbreak of cholera is confirmed in Haiti on October 21. Hyundai Heavy Industries are threatening to delay the opening of the plant scheduled for January 2011. The company rapidly takes actions to keep the epidemic from entering the construction site and succeeds in convincing the foreign technicians to stay to finish the construction in time. The wrong turn taken by the presidential elections of December 2010 results in several days of street unrest and postpones once more the construction of the power plant.
January 13, 2011: Finally, on January 13, 2010, E-power opens the Michel Arthur Volel electrical plant built to respect the US Environmental Protection Agency’s (USEPA) standards.

82
10.0 Conclusions and Recommendations 10.1 Summary of Report Findings This report provides further analysis of the feasibility of a WTE facility near Port-au-Prince, Haiti. NREL’s previous analysis and reports identified AD as the optimal WTE technology. Building on the prior analyses, this report evaluates the conceptual financial and technical viability of implementing a combined waste management and electrical power production strategy by constructing a WTE facility—either an AD system or a modern sanitary landfill equipped with a LFGTE facility. Some key observations noted in earlier chapters of this report are summarized below.
10.1.1 Societal Benefits of a Waste-to-Energy Project
The implementation of either an AD or LFGTE system would provide significant improvement to the waste management system and power supply system of the Port-au-Prince region. The need for proper sanitary management of wastes is a crucial component of a community's health and welfare. The current waste management system, consisting of an unlined landfill and waste dump operating with minimal sanitation protocol, poses certain risks to the surrounding community in terms of detrimental effects on groundwater, surface water, air quality, and vector transmitted pathogen-related health issues. Developing countries, including Haiti, lack financial, regulatory, and institutional strength, which typically allows solid waste management to lag behind other pressing societal needs, such as water supply, power distribution, transportation, and other infrastructure development. However, by simultaneously addressing both power supply and waste management, this project provides the potential of improving both systems.
10.1.2 Electricity Generation Over Time
The amount of energy produced varies according to the technology employed. The AD system produces more than twice as much electricity as the LFGTE system. This difference is due to a variety of issues, including the difference in collection efficiency of the two systems, but is also due to the slower microbial activity typical of landfills. Over time, the generation rate of a landfill can be expected to increase as more waste is placed in the landfill and additional gas collection wells are installed. However, when averaged over the 20-year planning horizon employed in this report, the LFGTE system produces less gas and consequently less power than the AD system.
10.1.3 Incorporating Local Conditions into Project Planning
Construction and operation of an LFGTE or AD facility in Haiti presents additional challenges compared to other more developed parts of the world.
Developed nations practice routine collection and management of MSW, which means that an AD facility can expect reliable collection and delivery of a consistent feedstock. Haiti has limited collection of MSW, and an AD facility there could expect more variation in the feedstock provided.

83
The financial and economic analysis in this report is based on U.S. labor rates. However, typical labor rates in the United States are approximately ten times greater than Haitian labor rates. Clarification of Haitian labor costs for energy-project construction and operation is needed. Using Haitian rates for both skilled and unskilled labor will significantly impact the financial evaluation of the two systems considered.
In addition to local labor rates, a conversion factor is needed to equate the U.S.-based capital construction costs illustrated in this report to costs of constructing a facility in Haiti. The conversion factor should take into account key issues, such as shipping, receiving, taxes, inspections, transportation of materials from the port to the site, the availability of a variety of skilled construction labor workers, fuel, electricity, and any other local issue that is likely to affect the project cost.
In addition to these logistical cost considerations, other local and political issues should be evaluated for their potential impact. For example, the need to relocate residents, improve roads, bring power to the site during construction, or any other number of issues could affect the financial viability of the project.
10.1.4 Availability of Suitable Labor
The labor pool is largely unskilled in Haiti, and the operation of both AD and LFGTE systems requires skilled labor. Further analysis of the availability of various skilled laborers in both construction and operations is needed. The potential need to train the local labor force or import skilled labor for construction and perhaps for plant operations should also be considered.
An AD system would require a higher number of unskilled laborers to perform the manual materials-sorting function in the preprocessing phase of the system. Ultimately, efficient operation and maintenance of the AD system relies heavily on the ability to manually separate organics from the MSW feedstock.
The need for skilled labor would also be greater for the AD facility because it contains much more mechanical equipment, requiring more unique and developed skills, than an LFGTE facility. An AD system requires highly skilled labor to perform the ongoing mechanical maintenance and biological management of the AD digestion system. In contrast, operation of the LFGTE system would require moderately skilled equipment operators and mechanics to maintain the heavy landfill equipment. Both systems require skilled labor for the conversion of biogas or landfill gas into energy using the IC engines.
10.1.5 Waste Disposal Requirements
Another technical difference between the two systems is the need for waste disposal of residues. An AD system requires a landfill for the disposal of unacceptable materials, residues, and wastes during equipment outages or maintenance. An LFGTE system is the ultimate disposal alternative and does not require an additional disposal element.
84
10.1.6 Timing of Construction
Although the initial construction of both systems is envisioned to occur on relatively similar schedules, an AD system requires a one-time construction period at the beginning of the project, whereas an LFGTE system requires ongoing construction of the liner system, landfill gas collection field, and the addition of IC engines over time. This need for ongoing construction of new landfill cells, and subsequent expansion of the landfill gas collection system with appropriately timed installation of new IC engines, is common in the LFGTE operations industry. However, the one-time construction of the AD system is notably simpler in terms of financing and managing capital improvements.
10.2 Conclusions In conclusion, both AD and LFGTE systems are viable with the following key considerations:
• The current US-based financial model for the AD system depends heavily on the relatively low-cost labor that performs the necessary function of preparing the feedstock. The AD system also requires the availability of a few highly skilled technicians to operate the digestion and power production portions of the AD facility. The availability and cost of both low-skilled manual sorters and highly skilled digester and power plant operators should be confirmed.
• The LFGTE system depends on relatively expensive equipment with moderately skilled equipment operators to perform the landfill operation functions and the ongoing construction of landfill liner, gas collection system, and IC engine installations, using relatively few laborers as compared to the AD system. The ability to fund ongoing landfill construction should be confirmed. Similar to a portion of the AD system, the LFGTE system requires the availability of highly skilled labor to operate and maintain the power production portion of the system. Also, to a lesser degree, moderately skilled labor to operate and maintain the heavy landfill equipment will be needed. The availability and cost of both moderately skilled equipment operators/mechanics and highly skilled power plant operators should be confirmed.
• The AD system produces approximately twice as much energy as the landfill system over the 20-year project lifetime evaluated. As currently projected using $0.20 per kilowatt-hour as the estimated income from electricity sales, the higher production of the AD system benefits from this relatively high sales value. The likely future value of electricity in Haiti should be evaluated, and the current value of power sales should be confirmed to be assured of this revenue.
• Both systems require significant long-term funding. The key revenues to support these systems consist of power off-take purchases and waste management tip fees. The ability of Haiti to support operating costs over the lifetime of the facility should be evaluated and confirmed.
10.3 Next Steps This section lists some of the next steps for further project work and development.

85
• Performing one or more additional waste characterizations, including determining quantities and composition of waste. This should be done at different times of the year to determine seasonal variation in composition and amount of waste generated. There should also be some attempt to classify and quantify the waste generated but not collected.
• Conducting small-scale biodigester demonstration projects with partners. • Exploring ways to increase the waste collection rate. UNEP [6] has proposed
installing 20+ supervised community collection centers and three to five larger sorting and transfer stations, with dedicated and supervised organic waste collection units at all markets.
• Analyzing legal and permitting requirements. • Evaluating different ownership and operation strategies. • Refining the financial scenarios, including:
o Converting the U.S.-based based project capital and operating costs to representative costs for building and operating the AD facility in Haiti.
o Confirming the value of electricity sales of $0.20 per kilowatt-hour. o Ascertaining whether there are any port fees and receiving or related taxes
for the importation of equipment and materials. o Confirming there is either a market for the dewatered digestate for use as a
soil amendment or there is likely no additional system cost for the subsequent management of this material.
o Ascertaining whether moderate tipping fees could be introduced for private sector waste firms, which would change the project economics.
• Confirming the availability and cost of the various unskilled, moderately skilled, and skilled labor required.
• Further refining the project scope from this conceptual level to a higher level of certainty, clarifying key issues, such as location, infrastructure, utilities, and the issues described above.
10.4 Suggestions for Further Study As noted in the desktop study, there appears to be two viable options for WTE project development in Haiti. The first is large-scale development of systems that involve cooperation with the energy sector for interconnection, transmission, and distribution, as well as cooperation with the waste management authority for waste collection and recycling. A second option is to develop community-level WTE systems that could be owned, operated, and maintained by members of the community without the reliance on entities, such as the waste management authority. These options are not mutually exclusive and further analysis is needed to determine the most appropriate scale and option.
86
Glossary biochemical conversion Waste treatment process in which bacteria are allowed to
consume the organic materials present in the waste under oxygen-deprived conditions, thereby producing gaseous emissions consisting primary of methane and carbon dioxide.
centrate (see effluent) combustion systems Waste treatment systems that burn the waste in the
presence of oxygen to produce heat. digestate A byproduct of the anaerobic digestion process that
contains the portion of the initial feedstock mass that did not decompose in the anaerobic digestion process. The digestate will typically be 70% to 90% water, with the rest as solids.
effluent A liquid byproduct of the anaerobic digestion process (also called centrate).
gasification systems Waste treatment systems that heat the waste in the presence of a limited quantity of oxygen to produce a gas that can be combusted.
leachate Liquid that drains from a landfill after percolating through the buried waste.
mesophilic temperature range of approximately 32°C to 40°C thermochemical conversion Waste treatment process in which heat is applied to the
waste, either combusting or gasifying the waste, converting the carbon in the waste into heat or a carbon-rich gas that can be subsequently converted to energy.
thermophilic temperature range of approximately 50°C to 65°C
87
References [1] Morton, A., United Nations Environment Programme. Personal communication. Nov. 14, 2013.
[2] Hoornweg, D. and Bhada-Tata, P. What a Waste. A Global Review of Solid Waste Management. Washington, D.C.: World Bank, 2012. http://documents.worldbank.org/curated/en/2012/03/16537275/waste-global-review-solid-waste-management.
[3] Municipal Solid Waste Collection Needs in Port-au-Prince, Haiti. Solid Waste Association of North America (SWANA), August 2010. http://swana.org/Portals/Press_Releases/Hurricane/Haiti_Response_Team_Position_Paper_2010.pdf.
[4] Booth, S., Haase, S., and Funk, K. Haiti Waste-to-Energy NREL Desktop Assessment Final. Golden, CO: The National Renewable Energy Laboratory, Nov.14, 2010.
[5] “International Database.” U.S. Census Bureau. Accessed September 2010: http://www.census.gov/population/international/data/idb/informationGateway.php.
[6] Port au Prince Waste Management and Waste-to-Energy Alternatives: Rapid Advice Note 26. United Nations Environment Programme, Haiti Sustainable Energy Programme. October 2012.
[7] “Haiti: A new sewage plant for Port-au-Price.” H5N1 blog, May 24, 2012. http://crofsblogs.typepad.com/h5n1/2012/05/haiti-a-new-sewage-plant-for-port-au-prince.html.
[8] “Port-au-Prince: A City of Millions, with no Sewer System.” NPR blog, April 13, 2012. http://www.npr.org/blogs/health/2012/04/13/150501695/port-au-prince-a-city-of-millions-with-no-sewer-system.
[9] “Haiti WTE Project Development Memo, Port au Prince Waste-to-Energy Evaluation (rev. 2).” The National Renewable Energy Laboratory and United Nations Environment Programme, Dec. 19, 2011.
[10] “Haiti WTE Project Development Memo, Port au Prince Waste-to-Energy Evaluation.” The National Renewable Energy Laboratory and United Nations Environment Programme, Dec. 16, 2011.
[11] “Presentation by G. Paulemon to the SWANA Haiti Response Team.” Municipal Solid Waste Collection Needs in Port-au-Prince, Haiti. Solid Waste Association of North America (SWANA), August 2010. http://swana.org/Portals/Press_Releases/Hurricane/Haiti_Response_Team_Position_Paper_2010.pdf.
[12] Baseline Environmental Site Assessment Report for the Truitier Landfill Port-au-Prince, Haiti. Wilmer, AL: Integrity Disaster Consultants, LLC., 2010.

88
[13] Ground Water Atlas of the United States: Alaska, Hawaii, Puerto Rico and the U. S. Virgin Islands. HA 730-N. United States Geological Survey, 1999. http://pubs.usgs.gov/ha/ha730/ch_n/N-PR_VItext1.html.
[14] “Minimum Wage Laws in the States–January 1, 2014.” U.S. Department of Labor, 2014. http://www.dol.gov/whd/minwage/america.htm.
[15] Project Appraisal Document on a Proposed Grant in the Amount of SDR 59.7 Million US$90.0 Million Equivalent) to the Republic of Haiti for a Rebuilding Energy Infrastructure and Access Project. 72266 – HT. Washington, D.C.: World Bank, August 2012. http://documents.worldbank.org/curated/en/2012/09/16734564/haiti-rebuilding-energy-infrastructure-access-project.
[16] “Fast Facts on the U.S. Government's Work in Haiti: Energy.” Washington, D.C.: U.S. Dept. of State, January 2013. http://www.state.gov/s/hsc/factsheets/2013/212161.htm.
[17] Rebuilding Energy Infrastructure and Access. PIDC637. Washington, D.C.: World Bank, October 2012. www.worldbank.org/projects/P127203/rebuilding-energy-infrastructure-access?lang=en.
[18] “E-Power FAQs.” E-Power, undated. Accessed April 9, 2013: http://www.epowerhaiti.com/#!faq.
[19] Manon, M. Personal communication. January 2013.
[20] Technical Assistance for the Electricity Generation, Transmission and Distribution Project. POWER Engineers, prepared for USTDA FRE 098-429 (RB 120374), November 2010.
[21] “Company Profile.” FORTEK Inc., 2013. http://www.fortek.co.kr/korea/com/Information%20of%20Company.pdf.
[22] “Haiti - Economy: Action Plan 2012-2013 for the EDH.” Haiti Libre, Sept. 10, 2012. http://www.haitilibre.com/en/news-6841-haiti-economy-action-plan-2012-2013-for-the-edh.html.
[23] “USAID Haiti Awards Electrical Reconstruction Project to Perini Management Services Inc.” Tutor Perini Corporation, May 3, 2012. http://investor.perini.com/phoenix.zhtml?c=106886&p=irol-newsArticle&ID=1691040&highlight=.
[24] “Electricity Transmission & Distribution Sector.” U.S. Trade and Development Agency, undated. Accessed April 9, 2013: http://www.ustda.gov/program/sectors/etransmissiondistribution.asp.
[25] Commercial Assessment of EDH Operations: Initial Highlights. Tetra Tech Inc., August 2010.
89
[26] Razavi, H. Financing Energy Projects in Developing Countries. 2nd Ed. PennWell Corp., 2007.
[27] The World Bank Operations Manual. Washington, D.C., World Bank, 2012. http://siteresources.worldbank.org/OPSMANUAL/Resources/EntireOM_External.pdf.
[28] “Environmental Assessment Sourcebook and Updates.” Washington, D.C.: World Bank, 2011. Accessed March 25: http://web.worldbank.org/WBSITE/EXTERNAL/TOPICS/ENVIRONMENT/EXTENVASS/0,,contentMDK:20282864~pagePK:148956~piPK:216618~theSitePK:407988,00.html.
[29] Haiti—Law on the Investment Code Modifying the October 30, 1989 Decree on the Investment Code. 2002.
[30] A Study on the Economic Valuation of Environmental Externalities from Landfill Disposal and Incineration of Waste. European Commission, DG Environment, 2000. http://ec.europa.eu/environment/enveco/waste/pdf/cowi_ext_from_landfill.pdf.
[31] A Study to Estimate the Disamenity Costs of Landfill in Great Britain. Cambridge Econometrics, EFTEC, and WRc. Department for Environment Food and Rural Affairs, February 2003. http://archive.defra.gov.uk/environment/waste/strategy/legislation/landfill/documents/landfill_disamenity.pdf.
[32] Taylor, D. “Talking Trash.” Environmental Health Perspectives. (107:8); August 1999. http://connection.ebscohost.com/c/articles/2259845/talking-trash-economic-environmental-issues-landfills.
[33] “INVENT Handbook on Integrated Waste Management.” E-Learning Modules. Asia-Link, EuropeAid Co-Operation Office, 2009.
[34] Synthesis of National Assessment Reports on the Implementation in the Caribbean of the Programme of Action for the Sustainable Development of Small Island Developing States. Caribbean Community (CARICOM) Secretariat, November 2003. http://www.cep.unep.org/meetings-events/11th-igm/report-regional-synthesis-final.pdf.
[35] “Cost–benefit Analysis.” Wikipedia, 2013. http://en.wikipedia.org/w/index.php?title=Cost%E2%80%93benefit_analysis&oldid=539674515.
[36] Port au Prince Waste-to-Energy Evaluation Initial Site Assessment Technical Memorandum. The National Renewable Energy Laboratory and HDR Engineering Inc., September 2011.
[37] “Project Development.” E-Power, undated. Accessed Jan. 30, 2013: http://www.epowerhaiti.com/#!project-development/vstc7=project-development.

90
[38] Haiti Energy Sector Development Plan (2007-2017). Ministry for Public Works, Transportation, and Communications; Bureau of Mines and Energy; and Electricity of Haiti. November 2006. http://www.bme.gouv.ht/energie/National_Energy_Plan_Haiti_Revised20_12_2006VM.pdf.
[39] Transition Electricity Management Contract. U.S. Agency for International Development, October 2011.
[40] Electrical Substation Rehabilitation. U.S. Agency for International Development, May 2012.
[41] “Safeguard Policies—Environmental Assessment.” World Bank, 2012. Accessed March 21, 2013: http://web.worldbank.org/WBSITE/EXTERNAL/PROJECTS/EXTPOLICIES/EXTSAFEPOL/0,,contentMDK:20543912~menuPK:1286357~pagePK:64168445~piPK:64168309~theSitePK:584435,00.html.
91
Appendix A: Anaerobic Digestion Technology Description Introduction This technical memorandum has been prepared by HDR Engineering Inc. (HDR) to provide a comparative summary of approaches and process features of anaerobic digestion (AD) technology and evaluates which of these are best suited to digestion of municipally generated wastes in the Port-au-Prince area, Haiti. Preliminary municipal solid waste (MSW) generation quantities and characteristics were previously estimated in HDR’s Waste Sort Analysis—Planning Summary technical memorandum. The waste sort analysis suggested that approximately 653 tonnes per day of solid waste is generated in the Port-au-Prince area, and approximately 73% of this total (approximately 477 tonnes/day) is organic and suitable for AD.
The Haiti Waste-to-Energy Opportunity Analysis prepared by the National Renewable Energy Laboratory (NREL) in November 2010 reviewed six different AD approaches, which are summarized below:
• Membrane-covered lagoon (MCL) • Heated and mixed membrane-covered lagoon (HMMCL) • Plug-flow digester (PFD) • Complete mix and hybrid digesters (CMHD) • Fixed-film digester (FFD) • Upright cylinder digester (UCD).
This technical memorandum reviews these six potential approaches and features, as well as additional AD approaches and features to be considered for the Port-au-Prince AD facility.
Approaches and Features of Anaerobic Digestion Technology Anaerobic digestion is a process where organic matter is consumed by bacteria in the absence of oxygen and converted to methane and carbon dioxide. Potential waste-derived organic feedstock materials include, but are not necessarily limited to, MSW-derived organics, wastewater treatment biosolids, industrial organic residuals, manure, farm wastes, and food waste. The technology can be engineered in a variety of ways with different features, which are generally categorized and described below.
• Solids content o Low solids o High solids o Dry fermentation
• Process configuration o Single stage o Phased o Plug flow

92
• Biomass immobilization o Suspended growth o Attached growth
• Reactor construction o Earthen lagoon o Concrete or steel tanks o Bunkers
• Temperature o Ambient temperature o Mesophilic o Thermophilic
• Feeding operation o Continuous feed o Batch feed
• Digester mixing o Unmixed o Partially mixed o Completely mixed
Solids Content
AD systems can operate at a wide range of solids concentrations and are characterized by total solids (TS) percentage defined as the mass of total solids divided by the total feedstock mass (solids plus water). It should be noted there are differing percentages for each category reported in literature and used in the industry for low- and high-solids systems and dry fermentation.
Low-Solids Systems
Low-solids systems generally operate with total solids less than 15%. There is extensive operating experience with low-solids systems because practically all AD systems at municipal wastewater plants are operated at the low end of this range. The reason for this is that municipal wastewater biosolids are dilute by nature. In some cases, feedstocks high in nitrogen (such as some manure) may need to be diluted to a TS concentration with low risk of ammonia toxicity; in such cases, a low-solids digester is warranted.
The benefits of low-solids systems are its demonstrated success and that the digester contents are simpler to convey and are often pumpable, where high-TS materials require augers and/or manual transport. A second advantage of low-solids digestion is that the liquid serves as a medium to promote contact between the organic substrate and bacteria. At the same time, feedstock impurities, such as plastic bags, can clog pumping and other mechanical equipment if not removed from the incoming raw feedstock. Other disadvantages of low-solids systems is that they require a larger AD reactor size, supplemental feedstock dilution water could be needed, and the digestate is normally dewatered, which yields a liquid stream that must be managed, recovered, and/or disposed.

93
High-Solids Systems
High-solids systems generally operate in the range of approximately 15% to 40% TS. High-solids AD systems have grown in popularity over the past 20 years as more experience has been gained with their operation. A key differentiator of high-solids systems is the waste that is digested must be handled as a solid rather than a liquid, normally requiring the use of augers and conveyors rather than conventional pumping equipment. However, high-solids systems are more robust with regard to feedstock physical impurities, as they are able to pass larger inert objects, such as plastics, glass, metal, and similar objects. Such materials can damage pumps, valves, and associated pumping and conveyance equipment in low-solids systems, as noted earlier.
High-solids AD systems employ mixing; however, such systems serve to agitate, rather than completely mix, digester contents. Due to the viscous nature of high-solids AD reactor contents, complete mixing is difficult to achieve and so gas-mixing or paddle-mixing devices are used to agitate AD reactor contents and allow the material to be conveyed from the reactor. High-solids systems are less homogenous and more difficult to mix and, as a result, provide less contact between the organic substrate and bacteria. This reduced contact results in reduced biogas production compared to low-solids systems.
Dilution water is generally not added to high-solids systems. As a result, an advantage of high-solids systems is the digestate from the AD system may not require dewatering, as it can be managed and utilized as a solid rather than a liquid. Costs associated with dewatering and the need to manage and potentially treat dewatering reject (or centrate) is eliminated.
Dry Fermentation
The use of organics derived from MSW as a feedstock for AD is evolving and involves the development of new technologies. Technology advancement has been occurring in Europe in response to the need to meet strict regulations limiting quantities of biodegradable waste that can be disposed in landfills. The cost of traditional low-solids AD systems for MSW-derived feedstock materials has been too high to be financially attractive. As a consequence, several companies have developed “dry fermentation” digestion technologies primarily for the treatment of mixtures of biosolids, “green” waste, and food waste. Dry fermentation AD systems are being considered in the United States as a method to efficiently utilize and manage non-liquid organic wastes. Dry systems can use input organic material with total solids content of up to 60%; however, supplemental green or wood waste is typically required so the bulk material is porous enough to allow liquid and biogas to pass through it.
For dry fermentation AD processes, the organic material is maintained in bunker-type reactors at solids concentrations of up to 60%. There are several variations on the use of this technology, employing different methods of liquid circulation through the solids.

94
Bunker-Type Dry Fermentation
Bunker-type dry fermentation facilities consist of a series of concrete bunkers equipped with air-tight ceilings and doors. The materials are typically loaded using a front-end loader; hence stackable feedstock composition is required. If the water content of the feedstock is so high the material is not stackable, bulking materials, such as chipped wood, must be used to increase porosity, as well as improve the ability to stack the material in the bunker. The bunkers are filled and the door sealed closed to initiate the anaerobic phase. The bunkers are equipped with a liquids circulation system and a biogas collection system. Depending upon the manufacturer’s recommendations, the feedstock is moisture conditioned and biogas is extracted from the closed bunker. After the digestion process, the bunker is purged with fresh air to cease the anaerobic phase. The purged air is collected and treated in a biofilter to remove odorous and contaminated air. The remaining material is usually removed from the bunker using a front-end loader. This digestate is typically stabilized in a brief aerobic composting phase.
Due to the solid nature of the feedstock, these systems do not typically employ a method of mixing; rather, a method of liquid recirculation is used. Unlike low-solids and high-solids systems, dry fermentation plants are designed around the principle that microorganisms are more easily moved than a large amount of material. To facilitate digestion, water is recycled through the system and percolated through the mass of waste by the forces of gravity. This allows the organic input to remain stationary for the digestion retention time while the needed biochemical reactions still occur. Because the mass stays stationary, the overall structure of a dry fermentation plant is very different from a wet plant. There are no moving parts inside the fermentation bunker.
Digestate material from a dry digestion process is solid in character, so it does not require dewatering prior to the further processing that is required to biologically stabilize the mass (e.g., composting) prior to use. Dry fermentation is operated in a batch mode. Once gas generation peaks and declines, the partially stabilized organic matter can be aerobically cured and used as compost.
Dry fermentation offers many advantages for the processing of the organic fraction of the waste stream. Because material does not require movement or pumping in a dry AD plant, pre-processing of the input materials to remove plastic bags and other inert materials is significantly reduced; input material does not need to be ground, nor diluted with water, nor even have the contaminants removed. These systems do not require dilution of the feedstock. As a result, centrate from a digestate dewatering process found in low-solids and some high-solids systems is eliminated.
The operation and maintenance of dry digesters include some complexities not seen with other technologies. The feedstock handling is complex as the waste is no longer a liquid stream and, like high-solids systems, conveyance of the feedstock can be challenging and is typically done with front-end loaders or similar manually operated equipment.

95
Using a dry fermentation system minimizes processing costs, both prior to and after digestion, and the use of water and other resources within the system itself. This allows for the most efficient and productive recovery of resources within the organic material. One disadvantage of a dry fermentation system is that it produces less biogas compared to low-solids and high-solids systems, which must be considered when evaluating the economics of these systems.
Flexible Membrane Type Dry Fermentation
The use of a flexible membrane liner (FML) to enclose the dry fermentation process is another alternative. The use of an FML has gained the attention in the US of management of several solid waste organizations that own/operate landfills. The FML type system is a low-cost alternative to the bunker-type dry fermentation process described above. The FML type process employs an HDPE (high-density polyethylene) membrane type containment system, typically on a landfill rather than in a concrete bunker or tank reactor system. The FML type dry fermentation process employs a technique to efficiently process large quantities of organic waste without constructing the concrete bunker enclosure described above. The FML-type dry fermentation process is in essence a combination of existing organic waste processing technologies including anaerobic digestion and composting, but it requires less capital as it takes place within a landfill cell.
Anaerobic digesters produce a stabilized material in a matter of days or weeks; composting systems stabilize materials in a matter of months; but the FML-type residence time depends on a number of factors such as organic waste mixture, initial moisture content, leachate recirculation efficiency, and temperature. The time required can range from six months to a few years to complete the entire stabilization process. One benefit of the FML-type system is that it does not require the organic waste to undergo extensive pre-processing and/or handling during the process. It also has a lower capital cost than other techniques used to process and recycle organic waste because it can utilize an existing landfill cell and does not require new infrastructure to be constructed.
The FML-type system involves the sequential application of anaerobic degradation, aerobic decomposition and residuals mining in a single module. Once the module is filled, it is capped and sealed with an impermeable geomembrane liner. After the module is sealed, it essentially becomes an anaerobic digester to recover biogas generated as the organic waste degrades. Once the anaerobic phase is completed, the biogas is extracted to produce energy. After the digestion phase is essentially complete, air is pushed into the module to create an aerobic condition to finish the composting process. The finished compost is then exhumed from the module. Once the material has been removed, a final curing step is conducted prior to the use of the stabilized material. Once the material has been exhumed, the empty module is then ready to accept new organic material to begin the process once again. Because the system operates in an extended batch mode, there is little minimal labor required, and the skill level required of operators is low compared to other systems. The FML-type system AD phase is designed to treat many biodegradable wastes, such as biosolids and other

96
organic wastes generally not considered for conventional composting, including animal byproducts, meat, and cooked food.
Process Configuration
Anaerobic digestion systems originated as a one-stage process where feed is digested in a single (most often, continuously fed) reactor. As AD technology research and experience has progressed, a clearer understanding of the digestion process fundamentals has developed. One finding from this experience is the digestion process is a sequential process primarily between two types of bacteria.
In general, there are two phases to anaerobic digestion known as the “acid phase” and the “methane-producing phase,” or “methanogenic phase.” In the first phase, complex organic matter is hydrolyzed and converted to simpler organic acids. In the second phase, organic acids are converted to methane, carbon dioxide, water and simpler end-products. Acid and methane production can occur in a single containment vessel or be separated into two vessels, one for each phase. Generally, in a digester that is working on a continuous basis, both the acid phase and methanogenic phase occur simultaneously within the reactor space through the action of different types of bacteria. However, some designs of high-solids and low-solids systems purposely and physically segregate the acid phase process from that of the methane-producing phase as discussed below. The objective of separating the phases is to provide favorable environmental conditions to both the acid-forming and methane-forming bacteria.
To some extent, phasing can be achieved by designing the reactors to be plug flow. Plug-flow reactors are designed with a high length to width (or height to diameter for vertical tanks) ratio so that feed travels through the reactor like a plug and is not mixed with the balance of the reactor contents. The benefit of plug flow is the two phases of digestion can be separated spatially using a plug-flow design. Many of the installed high-solids AD systems utilize a plug-flow arrangement, including prominent European technology providers Valorga and Kompogas.
The key benefit of phased systems is they are largely accepted to be more efficient than a single-stage process, which results in smaller-volume AD reactor volume compared to single-stage systems when digesting the same quantity of feedstock material. A disadvantage of phasing is it requires multiple tanks and associated mixing equipment and appurtenances. As a result, the cost savings associated with reduced overall volume for a phased system are offset by the need for multiple tanks and equipment.
Biomass Immobilization
Suspended Growth
Suspended-growth AD systems are those where bacteria are suspended within the reactor along with the organic feedstock. For most low-solids and high-solids systems, the bacteria grow within the reactor and then are discharged along with the digester effluent (i.e., the digestate). For low-solids systems that operate at TS content less than about 1%, a shortfall of suspended growth systems is that bacteria can often be

97
discharged with the effluent, whereas the goal is sometimes to retain bacteria in the reactor for digesting organics. The advantage of suspended growth systems is they are well established, and there is significant operating experience using them.
Attached Growth/Fixed-Film Systems
Anaerobic systems are sometimes designed as attached growth, or fixed-film systems where a media is provided (sand or other material) within the anaerobic reactor that bacteria can attach to. Because anaerobic bacteria are characteristically difficult to settle out of wastewater, the media provide an anchor by which bacteria are retained within a reactor system. Attached growth systems are used for treating soluble organic wastes (TS less than approximately 0.5 to 1.0%) and are not applicable to treating organic wastes similar to MSW.
Reactor Construction
Anaerobic digestion reactors are commonly constructed as covered earthen lagoons, or concrete, steel, or stainless steel tanks. Tanks are more common for feedstocks with higher TS because solids are difficult to remove from lagoons when TS is high. Anaerobic tank reactors generally include a rigid stainless steel, fiberglass, or synthetic membrane cover for collecting biogas. Concrete construction is typically more expensive than steel construction but is dependent on local material availability and cost. Tank systems generally include more mechanical components and therefore require more skilled operation compared to lagoons.
Lagoons typically require a larger footprint than tank reactors and are commonly used for agricultural applications and liquid organic waste treatment. Lagoons often include a synthetic liner to help prevent liquid from seeping through the lagoon floor and synthetic covers for collecting biogas from the lagoon for recovery. Lagoons are typically less expensive to construct than tank-style AD systems and are also common in rural areas where abundant space is available. Tanks appear to be the more conventional choice of construction for most MSW-type AD applications. For construction in Haiti, lagoons may be more susceptible to failure during an earthquake and/or flooding due to liquid soil characteristics. Tank construction can be better designed to resist the impacts of earthquakes and/or flooding.
A new AD reactor design includes concrete bunkers that are typically used in dry fermentation systems described in Section 2.1.3. These AD reactors can be built as rectangular bunkers so that feedstock can be delivered to the reactor and digestate can be removed from the reactor using manually operated front-end loading equipment.
Temperature
Anaerobic digestion systems commonly operate either in the mesophilic (32oC to 40oC) or thermophilic (48oC to 58oC) temperature ranges. These above-ambient temperatures are required for healthy, functioning methanogenic bacteria. Mesophilic operation has been more widely practiced than thermophilic primarily due to historical notions with process stability of thermophilic systems and the energy needed to raise the digester temperature to more than 48oC. However, thermophilic operation has become more

98
common, particularly with digestion of organic wastes and MSW. In the last 10 years, approximately one-third of the digesters installed in Europe for organic wastes and MSW were thermophilic systems.
The advantage of thermophilic systems is that the bacteria metabolize organic substrate at a higher rate compared to mesophilic systems. A second advantage is the hydrolysis of particulate organic matter occurs more rapidly at higher temperatures. As a result of these factors, the volume of thermophilic systems is less than mesophilic systems. As noted above, the disadvantage of thermophilic systems is reduced process stability and additional heat addition required. However, if cogeneration is used to produce electricity, a portion of the waste heat from the engines is typically used to heat the digester contents for both mesophilic and thermophilic operation.
A second disadvantage is that free ammonia (which is toxic to methanogenic bacteria at elevated levels) is present in higher concentrations in thermophilic systems compared to mesophilic systems due to its higher solubility at elevated temperatures. Depending on the nitrogen content of the feedstock, the feedstock may require dilution to lower the nitrogen concentration to be acceptable to methanogenic bacteria under thermophilic operation. Typically, the nitrogen content of MSW feedstocks is low enough that it does not present a toxicity concern to safe digester operation.
Feeding Operation: Continuous and Batch Feed
AD systems are either operated as a batch or continuous process. A batch system is fed raw feedstock, left to react over a prescribed period and followed by removal of the reactor contents from the system. A continuous system is fed continuously with raw untreated organics and material is also removed from the AD reactor continuously. For a single-stage batch process, hydrolysis, acidification, and methane formation occur sequentially within the reactor during the prescribed reaction period of the system. It has been noted in some cases that batch feeding is more efficient than continuous feeding as hydrolysis and acidification are allowed to occur in the early stages of the detention period, followed by methane formation in the latter stages. For a single-stage continuously fed system, hydrolysis, acidification, and methane formation occur simultaneously within the reactor; because of this, localized acid-forming and methane-forming bacteria populations must coexist under sometimes less-than-ideal environmental conditions.
Batch systems are unique in that there must be multiple tanks available for feeding raw feedstock. While one AD reactor is in batch operation, it cannot be fed additional feedstock, so additional reactor(s) must be available for feeding. Continuous systems do not have this limitation.
Digester Mixing
The goal of digester mixing is to help bring organic feedstock in contact with the anaerobic bacteria, maintain relatively uniform temperature and pH, and reduce the potential for biogas pockets to accumulate within the digester. Traditional digester mixing methods include pumped mixing, mechanical mixing, and gas recirculation

99
mixing. In pumped mixing, external pumps are used to recirculate digester contents. Digester mixing is common for low-solids systems but less common in high-solids and dry fermentation systems simply because AD reactor contents are so thick they cannot be effectively mixed within the reactor. Mixing that is employed for high-solids systems serves to agitate digester contents rather than mix them. The efficiency of this method varies depending on several parameters, including digester size, viscosity of the contents, and turnover rate. The key benefit of pumped mixing is that no moving parts are inside the digester and so maintenance of mixing equipment is simplified because it is external to the digester. Pumped mixing can only be applied to low-solids systems due to difficulty in pumping thick materials and associated excessive power requirement.
Mechanical mixing, also known as internal mixing, uses a mechanical device inside the digester to mix the contents. These devices are generally impellers, propellers, and turbine wheels, and are subject to wear and tear damage, as well as damage from vibration, due to being submerged in the digestate, which could contain grit and debris. Mechanical mixing can be used for low-solids digesters but not high-solids digesters because they cannot mix systems with TS content above approximately 10% to 15%. Nonetheless, mechanical mixing is a relatively simple approach to mixing.
In gas recirculation mixing, the gas produced is collected, compressed, and then released from tubes, lances, or diffusers on the bottom of the digester tank to promote mixing. These systems can be unconfined or confined, and the efficiency of either depends on energy input. Unconfined systems use top-mounted lances and diffusers on the bottom of the digester tank. Confined systems use draft tubes to discharge gas. One benefit of gas-mixing systems is their ability to mix reactors with relatively high-solids content. A disadvantage of gas mixing is that biogas used for the mixing is an explosive and corrosive gas. As a result, it must be handled carefully, and gas-handling equipment must use corrosion-resistant materials, which add to the cost for mixing.
Summary of Anaerobic Digestion Technologies Considered by NREL As mentioned previously, the Haiti WTE opportunity analysis (NREL, 2010) reviewed six different AD approaches. Each of these approaches in some way incorporate some of the alternative process and design features presented in Section 2.0 and summarized below. Because the specific characteristics of the feedstock were not identified during the NREL study, its TS content was unknown and AD approach with regard to low- or high-solids operation was not presented. Also, the report does not describe operating temperature or if and how the AD reactors would be mixed.
Membrane-covered lagoon: The MCL option uses lagoons as its reactor construction method. Some MCLs use a non-insulated membrane cover placed over a concrete-lined lagoon; lagoons are also commonly constructed of earthen materials. The desired approach to lagoon construction is to utilize a cut-and-fill approach with native soils to build the lagoon while eliminating the need to import fill material. Lagoons are typically lined with a synthetic liner to help prevent seepage from the lagoon and to protect groundwater; however, this requirement is dependent on the local regulating authority. As with other approaches that utilize lagoons, the footprint required will normally be

100
larger than with other construction methods. Although the gas production was estimated as low (due to a non-insulated cover and lower operating temperature) and the retention time was estimated as greater than 20 days, it was also the lowest cost. NREL ranked this option first in terms of the lowest capital and operating costs among the approaches that was studied. As noted earlier, the drawback of a lagoon is the difficulty in removing solids from the reactor. This is a particular issue of concern for the Haiti waste materials due to the composition of the waste. The more traditional use of an MCL is for low TS feed where solids removal is a lesser concern; the devices used for solids removal in an MCL would likely not function for the removal of the Haitian MSW solids.
Heated and mixed membrane-covered lagoon: The HMMCL is similar to an MCL, except it uses an insulated membrane cover instead of a non-insulated one. This reduces the reactor size and footprint required because the bacteria are more effective at destroying organics at the higher temperature resulting from the insulated cover. Again, capital and operating costs were considered substantially lower than other approaches, although gas production was also low by comparison and retention time was greater than 20 days. Solids removal is also an issue for this method.
Plug-flow digester: The PFD also uses the lagoon construction method with a cover, but has higher capital costs and a substantially higher operating cost. It is designed to control material viscosity and function like a plug-flow system at the exit. It does require less space than the other two lagoon approaches presented, and the gas production is described as highly variable. The retention time was estimated to be 20 days.
Complete mix and hybrid digester: The CMHD use bolted steel vessels with external pumps and heating. The report does not specify if the tanks are used as a single-stage or phased-process configuration, but does describe the construction method as having a significantly lower space requirement than the PFD. The lower space requirement is presumably due to a taller reactor size compared to a lagoon. The option is ranked fourth in terms of capital and operating costs. Operational costs are higher because of the cost of operating the mechanical mixing equipment and providing for their repair and replacement as needed. The CMHD provides a medium level of gas production compared to the other approaches listed, with a retention time of 20 days.
Fixed-film digester: The FFD approach described in the NREL report utilizes low-solids content and attached growth biomass immobilization using plastic media fill-in steel tanks. It is listed as having similar footprint requirements to the CMHD, but again does not specify single stage or phased. The FFD utilizes external pumps, as in pumped mixing, and heating. The retention time is listed as five to 20 days, with excellent volatile reduction and gas production when compared with the other NREL approaches. It requires well-screened, dilute feedstock, and thus has high water usage and higher capital and operating costs than previous approaches. As such, this system could be considered a low-solids system.
The significant challenge with an FFD in treating MSW that has relatively high TS is the quantity of dilution water needed to prevent the plastic media from exiting the reactor with digester contents. FFD systems are more applicable to treating soluble organic

101
wastewaters with a TS content less than approximately 0.3% to 0.5% TS. As a result, a significant amount of dilution water would be needed to reduce feedstock TS, and therefore, is not applicable to digesting MSW in Haiti. It is ranked fifth for both capital and operating costs.
Upright cylinder digester: The last approach evaluated by NREL is the UCD, which employs high-solids content in tall vessels with small diameters, implying a quasi-plug-flow process configuration. The NREL report indicates this approach uses proactive mixing and a high bacteria concentration. With a reported retention time of only five days, the UCD has a small footprint and is estimated to have high volatile solids reduction and gas production. A five-day retention time appears quite low and would likely be higher when designed. It is ranked with the highest capital and operating costs.
Anaerobic Digestion Approaches Applicable to Haiti Screening criteria to identify an appropriate AD technology for Haiti conditions were considered. Based on project development to this date, the following criteria appear appropriate for selecting a suitable approach to AD.
• Cost. The system should be cost-effective. • Applicability to feedstock characteristics. The WSA resulted in a feedstock
that is 73% organic, with a 27% TS content. • Footprint. The Trutier dump site is the currently planned location of the AD
facility and is understood to have adequate footprint for essentially any AD technology.
• Contamination. The Trutier site will utilize manual laborers to hand sort and remove metals, plastics and other contaminants from MSW hauled to the site prior to AD. However, plastic bags and other contaminants may still enter the waste stream, and therefore, the AD system shall be able to accommodate such contamination.
• Heat Requirements. The biogas from the AD system will be converted to electricity, and in doing so, waste heat will be generated and available for digester heating.
Table A-1 summarizes the advantages and disadvantages of the features described in Section 2.0, and also presents the applicability of the different approaches and design feature to Haiti based on criteria presented in Section 4.0. Each feature is ranked as high, moderate, low, applicable, or not applicable.

102
Table A-1. Advantages, Disadvantages, and Applicability of Various AD Approaches in Haiti
Approach Advantages Disadvantages Applicability to Haiti
Solids Content Low-Solids Demonstrated success (municipal biosolids) Digester contents are easily conveyed and pumped Liquid provides high contact between organic substrate and biomass
May require larger AD reactors Robust preprocessing required, as contamination could damage system Digestate usually requires dewatering and resulting liquid needs to be managed appropriately Supplemental water must be available to dilute the raw feedstock
Low
High-Solids Can handle higher level of contamination because there is no easily damaged pumping or conveyance equipment Supplemental water generally not required for feedstock dilution Digestate may not require dewatering and can be managed as a solid byproduct Strong operating record for digesting MSW.
Solids are more challenging to handle and convey, requiring augers and conveyors Less homogenous and complete mixing is difficult to achieve, leading to less contact between organic substrate and biomass Handling thick feedstock and digestate to and from can be challenging
High
Dry Fermentation
Does not require robust preprocessing or dilution of feedstock Does not require dewatering
Conveyance of feedstock is more challenging and requires equipment like front-end loaders Produces less biogas relative to low- and high-solids systems Less operating experience May require a green/wood waste to provide porosity to bulk material
Moderate to High
Process Configuration
Single-Stage Lower costs for tank and related equipment Well established
Requires greater reactor volume Applicable
Phased Systems
More efficient, requiring less reactor volume Stable operation
Increased costs associated with multiple tanks and related equipment Less operating experience
Applicable
Biomass Immobilization
Suspended Growth
Robust with regard to passing material and inerts Well established
May risk losing biomass inventory in low-solids systems operated at very low TS content
High
Attached Growth/Fixed-Film Systems
Provides means to retain bacteria within reactor system
Only applicable for soluble organic wastes
Low

103
Approach Advantages Disadvantages Applicability to Haiti
Reactor Construction
Earthen Lagoon
Typically less expensive to construct than tanks
Require larger footprint than tanks Better suited for low-solids systems Difficult to remove solids from system Higher potential for damage during earthquake and/or flood
Moderate to High
Concrete or Steel Tanks
More common for feedstocks with high total solids, like MSW
Range of costs based on material chosen and availability, but typically more expensive to construct than lagoons
Moderate to High
Bunkers Practical approach to reactor construction for high-solids feedstocks
Relatively uncommon method Solids must be removed manually
Moderate
Temperature Ambient Temperature
Heating of AD reactor contents unneeded
Low gas production Low to Moderate
Mesophilic Stable process Proven method
Supplemental digester heating required
Moderate to High
Thermophilic Required volume of system is lower, due to higher rate of metabolism and more rapid hydrolysis
Reduced process stability Increased supplemental heat demand Higher risk of ammonia toxicity so may require dilution of feedstock with high concentration
Moderate to High
Feeding Operation
Continuous Feed
Proven method Single-stage tank limits ability to easily increase capacity
Applicable
Batch Feed Capacity can be easily increased by adding additional hydrolysis/acidification tanks More efficient for single-stage systems than continuous feeding
There must be multiple tanks or storage available to receive raw feedstock
Applicable
Sanitary Landfill as an Alternative Solid Waste Management Approach Although the Haiti WTE opportunity analysis prepared by NREL reviewed six different AD technologies, the most common and least costly method of managing municipal solid wastes in the United States is the placement of wastes in a modern, sanitary landfill. If properly constructed, filled, and maintained, a sanitary landfill equipped with a landfill gas collection system and landfill gas-to-energy (LFGTE) power system can also produce renewable energy in the form of electricity, albeit years later after the landfill has been constructed. This method of waste management and power production could be considered as a comparable baseline option compared to the use of AD. As such, the following description is provided for NREL’s consideration.
The same biological mechanisms for converting organics to biogas that occur at an AD facility also occur in a landfill. A sanitary landfill can convert the volatile solids of the organic fraction of the waste into a biogas (landfill gas) at a similar overall percentage yet over a much longer period compared to AD. Landfill gas is similar to biogas and consists of methane, carbon dioxide, nitrogen, and other trace gases. Landfill gas is approximately half methane and generally somewhat lower than biogas.

104
The process of converting landfilled organics into landfill is typically slower than a digester converting the same organics into biogas. This slower landfill rate is due to a variety of environmental issues, such as temperature, moisture content, poor contact between organics and anaerobic bacteria, and also operational issues, such as the time from the initial placement of the waste until such time the landfill gas can be extracted. However, on a steady-state basis over the duration of many years, the landfill will generally tend to produce a similar quantity of methane as an anaerobic digester.
A sanitary landfill consists of a properly designed and constructed containment system to prevent the leakage of liquids and gases from beneath the waste to the surrounding soil or underlying groundwater. The containment system could consist of local clay materials if they are available or could be constructed of manmade geo-textile fabrics typical of flexible membrane liner products similar to the materials used to prepare the lagoon-type digester described above.
Filling of the sanitary landfill requires compaction to properly place the waste materials. Compaction provides several necessary benefits, including efficient use of the capacity of a lined landfill cell; avoidance of the waste attracting rodents, birds, or other vectors; as well as structural integrity for stability as the waste prism is raised in depth. Also, properly compacted waste provides the necessary structure to allow drilling through the waste for the placement of landfill gas extraction wells, which are typically installed after a cell or module has been filled.
The installation of a landfill gas collection and power system is installed once the waste in a cell or module has reached its intended depth/grade. The collection system consists of vertically drilled wells in the waste, constructed somewhat similar to a groundwater well with perforated collection pipes deep in the waste and well seals at the surface to prevent the intrusion of oxygen into the waste. Gas is collected by a grid of pipes placed on the surface of the landfill and equipped with a blower to draw the gases from the waste using a blower. The extracted gas typically requires some pretreatment before use, which is somewhat similar to biogas. At a minimum, the gas is pretreated typically to remove excess moisture and compressed for use in an internal combustion engine or gas turbine.
Lined landfills require leachate collection and management. If designed properly, the leachate can be returned to the landfill, which can enhance the production of landfill gases. The limitation of this practice is if liquid levels within the landfill become too high, impeding the ability to collect landfill gas. Leachate is also commonly used for dust suppression on roads and the waste receiving area. This practice is limited to dry seasonal use, however, so leachate storage (either within the landfill or in separate tanks) may be necessary.
Once the landfill has been filled, it can be capped with soils or geo-textile materials similar to the liner materials used to construct the liner beneath the waste. Once capped, the landfill will continue to produce landfill gas as long as there are organics readily available to bacteria within it. Consequently, the ongoing extraction of landfill gas is necessary. The generation cycle of landfill gas ranges in a five- to 15-year logarithmic declining curve depending on variables such as moisture content and organic content.
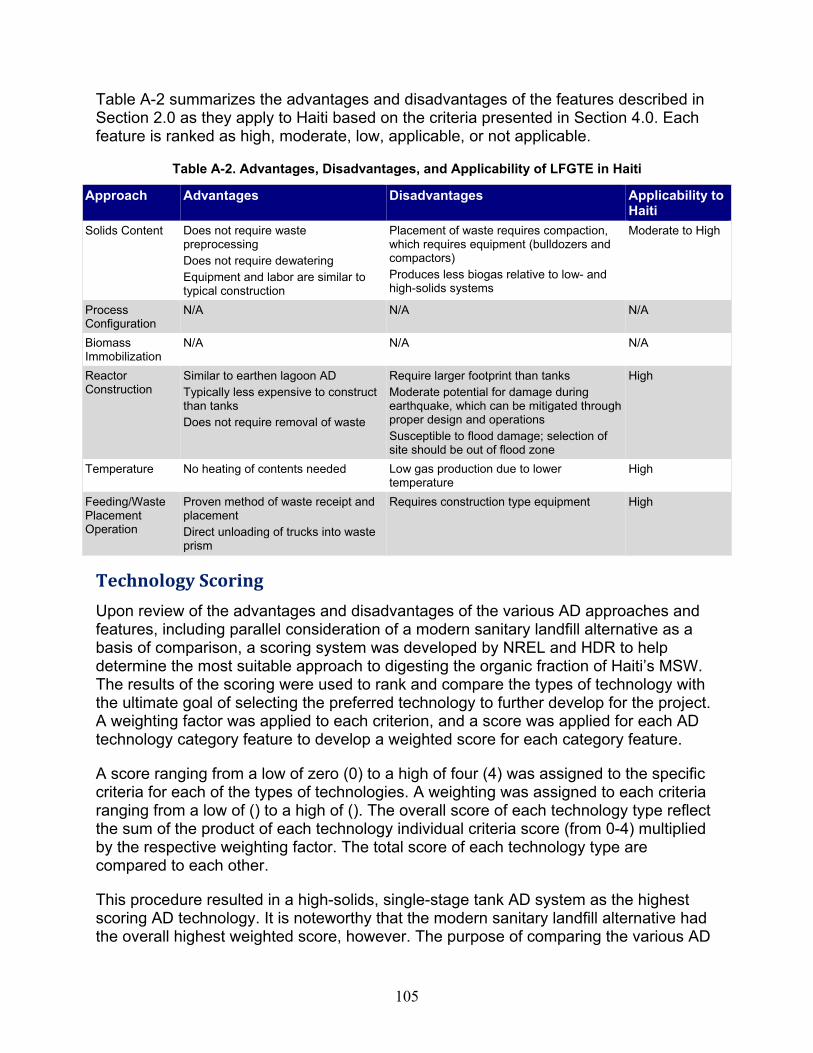
105
Table A-2 summarizes the advantages and disadvantages of the features described in Section 2.0 as they apply to Haiti based on the criteria presented in Section 4.0. Each feature is ranked as high, moderate, low, applicable, or not applicable.
Table A-2. Advantages, Disadvantages, and Applicability of LFGTE in Haiti
Approach Advantages Disadvantages Applicability to Haiti
Solids Content Does not require waste preprocessing Does not require dewatering Equipment and labor are similar to typical construction
Placement of waste requires compaction, which requires equipment (bulldozers and compactors) Produces less biogas relative to low- and high-solids systems
Moderate to High
Process Configuration
N/A N/A N/A
Biomass Immobilization
N/A N/A N/A
Reactor Construction
Similar to earthen lagoon AD Typically less expensive to construct than tanks Does not require removal of waste
Require larger footprint than tanks Moderate potential for damage during earthquake, which can be mitigated through proper design and operations Susceptible to flood damage; selection of site should be out of flood zone
High
Temperature No heating of contents needed Low gas production due to lower temperature
High
Feeding/Waste Placement Operation
Proven method of waste receipt and placement Direct unloading of trucks into waste prism
Requires construction type equipment High
Technology Scoring Upon review of the advantages and disadvantages of the various AD approaches and features, including parallel consideration of a modern sanitary landfill alternative as a basis of comparison, a scoring system was developed by NREL and HDR to help determine the most suitable approach to digesting the organic fraction of Haiti’s MSW. The results of the scoring were used to rank and compare the types of technology with the ultimate goal of selecting the preferred technology to further develop for the project. A weighting factor was applied to each criterion, and a score was applied for each AD technology category feature to develop a weighted score for each category feature.
A score ranging from a low of zero (0) to a high of four (4) was assigned to the specific criteria for each of the types of technologies. A weighting was assigned to each criteria ranging from a low of () to a high of (). The overall score of each technology type reflect the sum of the product of each technology individual criteria score (from 0-4) multiplied by the respective weighting factor. The total score of each technology type are compared to each other.
This procedure resulted in a high-solids, single-stage tank AD system as the highest scoring AD technology. It is noteworthy that the modern sanitary landfill alternative had the overall highest weighted score, however. The purpose of comparing the various AD
106
systems to a modern sanitary landfill as an alternative is to provide a perspective of how the preferred AD system would compare to a modern sanitary landfill on a criteria-by-criteria basis. We believe this to be an important comparison; particularly insomuch as energy from landfill gas-fired power plants is considered a renewable source in the United States. Also, the comparison allows consideration of the recognition that modern sanitary landfills represent the most employed best-available control technology to manage MSW in the Unites States. Table 3 provides a summary of the scoring results.
Discussion of Results and Next Steps
The following observations and conclusions can be drawn from the digestion technology comparison.
• A high-solids AD system appears to be the most suitable for Haiti considering the Haiti feedstock is at 27% TS and the high-solids AD operational experience digesting MSW.
• A phased- or single-stage system would be effective at digesting MSW and both are suitable for Haiti.
• An attached growth/fixed-film digester is not suitable for Haiti, as this technology is suited to soluble, high organic wastewaters.
• Tank construction may be the preferred method for the Haiti AD system; however, lagoon construction may also be feasible but provisions for routine solids removal should be provided.
• The AD reactors are best operated at mesophilic or thermophilic temperature while utilizing waste heat from electricity production.
• The AD system could be operated either as a continuous- or batch-feed system. • A sanitary landfill equipped with a landfill gas collection and power-generating
system could be more suitable for Haiti than any of the AD systems considering the Haiti waste composition, available labor force, and operational experience. These features and benefits should be weighed against the long period that biogas is generated over the landfill's extended life.
Further evaluation and development of a high-solids digestion system compared to the development of a modern sanitary landfill is recommended. This evaluation would include more detailed description of the high-solids digestion system, a conceptual mass balance, biogas generation estimates, system residuals, costs, and other components. This information will assist NREL in further evaluating the feasibility of an AD facility in the Port-au-Prince area.
Further evaluation and consideration may be appropriate to explore the use of a modern sanitary landfill. If employed, we assume a modern sanitary landfill would receive the waste stream used for this analysis in addition to other commercial, industrial, construction/demolition-type wastes. As such, we envision the modern sanitary landfill would be constructed and operated similar to sanitary landfills in the United States, meeting groundwater protection standards, etc. We also expect the landfill would be equipped with a landfill gas collection system, LFGTE production equipment, etc. The further evaluation of a modern sanitary landfill, particularly its landfill gas generation estimates, costs, and related issues would be addressed in later analyses.

107
Appendix B: UNOPS Waste Sort Study and National Renewable Energy Laboratory Calculations The following study was used in this analysis to estimate the characteristics and composition of the waste arriving at Trutier. Note "taux de matière sèche" in Tableau 1 indicates the dry matter content of the waste components (total solids [TS]), and Tableau 2 shows the volatile solids (VS). There are discrepancies with the body of this report due to rounding by UNOPS (e.g., in the waste composition pie chart).
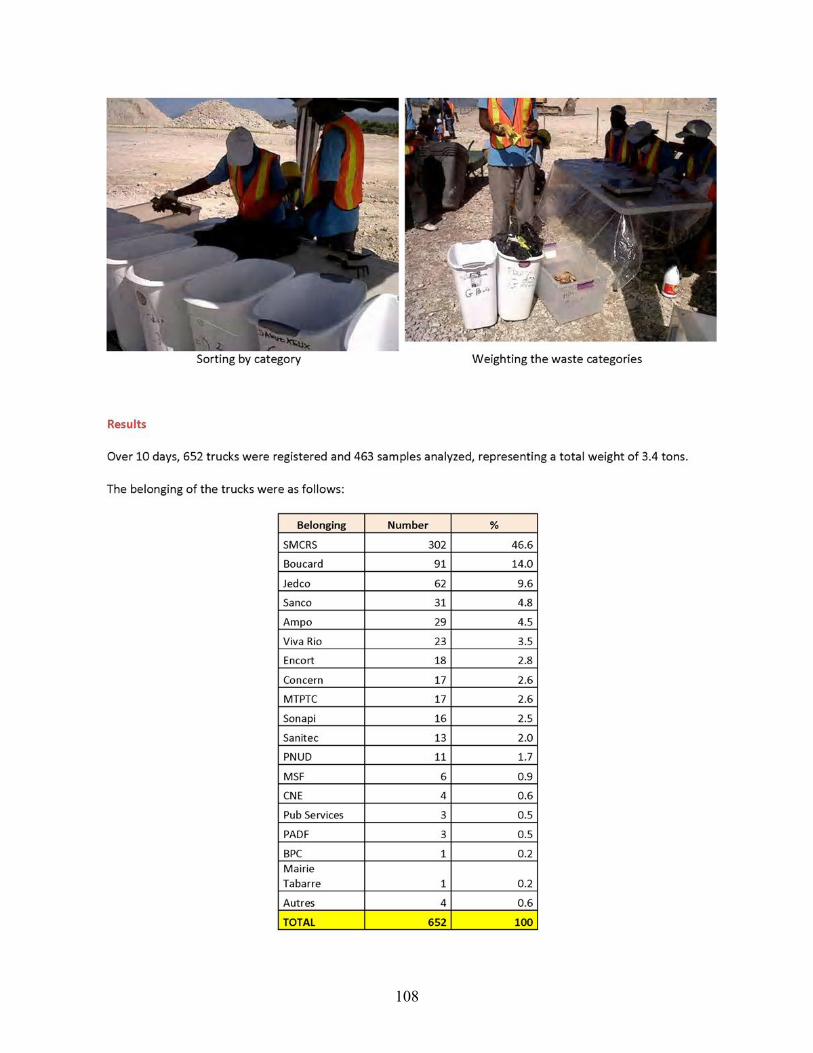
108
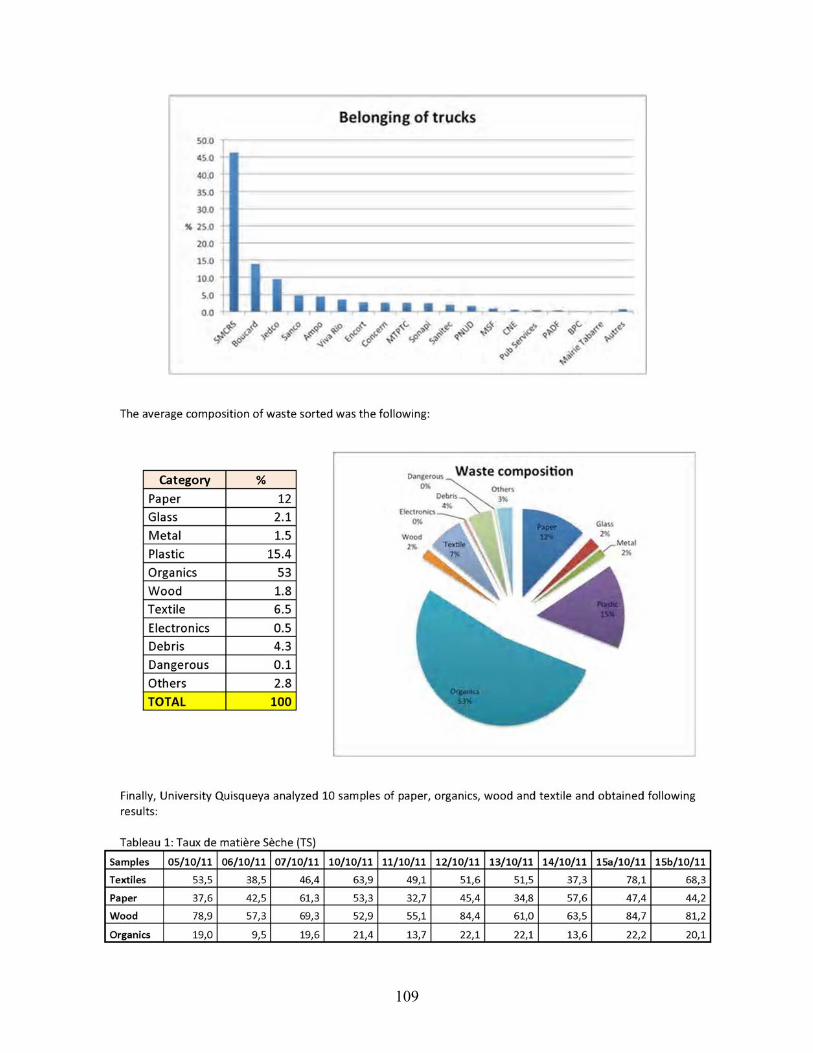
109

110
In addition to a summary report, UNOPS provided an Excel spreadsheet file of the raw data. A sample of that data9 is shown in Table B-1.
Table B-1. Sample Data from Waste Characterization Study
Day
Tim
e Sa
mpl
ing
Com
pany
Truc
k Ty
pe
Tim
e In
itial
Wei
ghtin
g
Sam
ple
Initi
al W
eigh
t (k
g)
Tim
e Fi
nal W
eigh
ting
Fina
l Tot
al W
eigh
t (kg
)
% L
ost W
eigh
t
1.
Pap
er
2.
Gla
ss
3.
Met
al
4.
Pla
stic
5.
Org
anic
6.
Woo
d
7.
Tex
tiles
8.
Ele
ctro
nics
9.
Con
stru
ctio
n D
ebris
10.
Dan
ger
11.
Oth
er
Oct 5 9:15 Jedco Ouvert 10:28 6.485 10:43 3.61 44.3 0.64 0.9 0 0.97 0 0.89 0.215 0 0 0 0
Oct 5 9:18 Boucard Ouvert 10:26 9.255 10:37 9.03 2.4 0.78 1.01 0 1.21 3.465 2.14 0.43 0 0 0 0
Oct 5 9:22 SMCRS Compressif 10:09 6.085 10:12 5.56 8.6 1.865 0 0.02 0.16 2.19 0 1.32 0 0 0 0
Oct 5 9:30 Jedco Ouvert 10:24 3.715 10:41 4.08 -9.7 1.78 0 0 0.595 0.54 0.39 0.77 0 0 0 0
Oct 5 9:34 SMCRS Compressif 10:10 5.105 10:16 5.01 1.9 0.55 0 0 0.33 0.1 0.17 3.865 0 0 0 0
Oct 5 9:55 PNUD Ouvert 11:21 11.56 11:28 11.31 2.2 0.64 0 0.13 0.39 10 0 0.15 0 0 0 0
Oct 5 10:00 SMCRS Ouvert 10:57 4.385 11:01 4.38 0.1 1.59 0 0.12 0.95 1.17 0.55 0 0 0 0 0
Oct 5 10:04 Encort Ouvert 11:06 3.66 11:14 3.58 2.2 1.42 0 0 0.545 1.615 0 0 0 0 0 0
Oct 5 10:08 PNUD Ouvert 10:57 5.51 11:08 5.27 4.4 0.4 0.22 0.11 0.555 2.85 1.06 0.08 0 0 0 0
Oct 5 10:25 Sonapi Ouvert 11:00 2.62 11:04 2.58 1.7 1.965 0 0 0.31 0.3 0 0 0 0 0 0
9 Some columns of data have been removed from the figure to allow it to fit on the page.

111
Not all of these materials can be converted to energy using a biochemical process (which could be either an anaerobic digestion or landfill gas-to-energy facility), so NREL’s analysis included only textiles, paper, wood, and organics. The following tables are taken directly from Tableau 1 and Tableau 2 in the UNOPS report but converted to English.
Table B-2. Waste Composition—Percent Total Solids
Samples 05/10/11 06/10/11 07/10/11 10/10/11 11/10/11 12/10/11 13/10/11 14/10/11 15a/10/11 15b/10/11
Textiles 53.5 38.5 46.4 63.9 49.1 51.6 51.5 37.3 78.1 68.3
Paper 37.6 42.5 61.3 53.3 32.7 45.4 34.8 57.6 47.4 44.2
Wood 78.9 57.3 69.3 52.9 55.1 84.4 61.0 63.5 84.7 81.2
Organics 19.0 9.5 19.6 21.4 13.7 22.1 22.1 13.6 22.2 20.1
Table B-3. Waste Composition—Volatile Solids, as Percent of Total Solids
Samples 05/10/11 06/10/11 07/10/11 10/10/11 11/10/11 12/10/11 13/10/11 14/10/11 15a/10/11 15b/10/11
Textiles 78.6 81.9 91.9 88.3 83.2 75.7 85.9 97.1 96.5 95.0
Paper 84.9 89.0 85.9 79.3 86.8 92.4 65.0 97.5 83.2 96.1
Wood 90.6 77.9 84.2 86.9 86.4 89.3 79.9 95.1 98.6 98.2
Organics 87.8 74.8 79.1 83.4 86.5 84.0 81.5 92.4 92.8 80.6
Table B-4 shows volatile solids as a percent of total materials; this is derived from the previous tables.
Table B-4. Waste Composition—Volatile Solids as Percent of Total
Table B-5 provides a summary of the organic materials.
Volatile Solids [% of total]Samples 5/10/2011 6/10/2011 7/10/2011 10/10/2011 11/10/2011 12/10/2011 13/10/2011 14/10/2012 15/10/2011 15/10/11 (2)
Textiles 42% 32% 43% 56% 41% 39% 44% 36% 75% 65%Paper 32% 38% 53% 42% 28% 42% 23% 56% 39% 42%Wood 71% 45% 58% 46% 48% 75% 49% 60% 84% 80%Organics 17% 7% 16% 18% 12% 19% 18% 13% 21% 16%

112
Table B-5. Organic Materials Summary—Total and Volatile Solids
Summary
SamplesAverage
Standard Deviation
AverageStandard Deviation
Textiles 53.8 12.9 87.4 7.6Paper 45.7 9.5 86.0 9.3Wood 68.8 12.5 88.7 7.1Organics 18.3 4.5 84.3 5.7
Total solids [%] Volatile Solids [% of TS]

113
Appendix C: UNOPS Trutier Truck Monitoring Study The waste characterization study in Appendix B did not include a determination of the quantities of waste delivered per day or per week. Therefore, a separate study was performed to estimate these quantities. The truck monitoring study was conducted from Dec. 10-14, 2011.
During the study, logs were kept, recording the time of arrival, the type of truck, type of load, city of origin, and other relevant data. An example data log, from Saturday, Dec. 10, is shown in Table C-1.
Table C-1. Sample Truck Monitoring Log File from Saturday, Dec. 10, 2011
Time Company Type of Truck Truck
Capacity (m3)
MSW
Truck Capacity
(m3) Debris
Truck Capacity
(m3) Other
Type of Waste Immatriculation Number of
Passengers Origin
16:29 Sanco Compressive 45 MSW ZA8590 3 Centre-Ville
16:49 SMCRS Compressive 45 MSW IC.021 3 Martissant
16:55 Ampo Open 10 MSW ZA33116 3 Petionville
17:16 Ampo Open 10 MSW ZA10115 3 Sarthes
19:12 SMCRS Open 45 MSW A.10 2 Grand Rue
19:49 MTPTC Open 16 MSW MTPTC_430 2 Croix des Bouquets
19:49 SMCRS Open 16 MSW B.06 2 Petite Place
Cazeau
20:33 SMCRS Open 45 MSW A.10 2 Delmas
21:10 SMCRS Open 16 MSW B.04 2 Mais Gate
21:25 SMCRS Open 45 MSW A.09 3 Mais Gate
21:30 SMCRS Open 16 MSW B.06 3 Mais Gate
21:33 SMCRS Compressive 16 MSW IC.022 2 Delmas
21:46 SMCRS Open 16 MSW B.02 3 Mais Gate
21:56 SMCRS Open 45 MSW A.10 3 Croix des Bossales
22:30 SMCRS Open 16 MSW B.04 2 Bon Repos
22:38 SMCRS Open 16 MSW B.06 3 Bon Repos
23:00 SMCRS Open 16 MSW B.02 3 Grand Rue
23:03 SMCRS Open 45 MSW A.10 2 Grand Rue
23:27 SMCRS Compressive 16 MSW IC.10 3 Croix des Bouquets
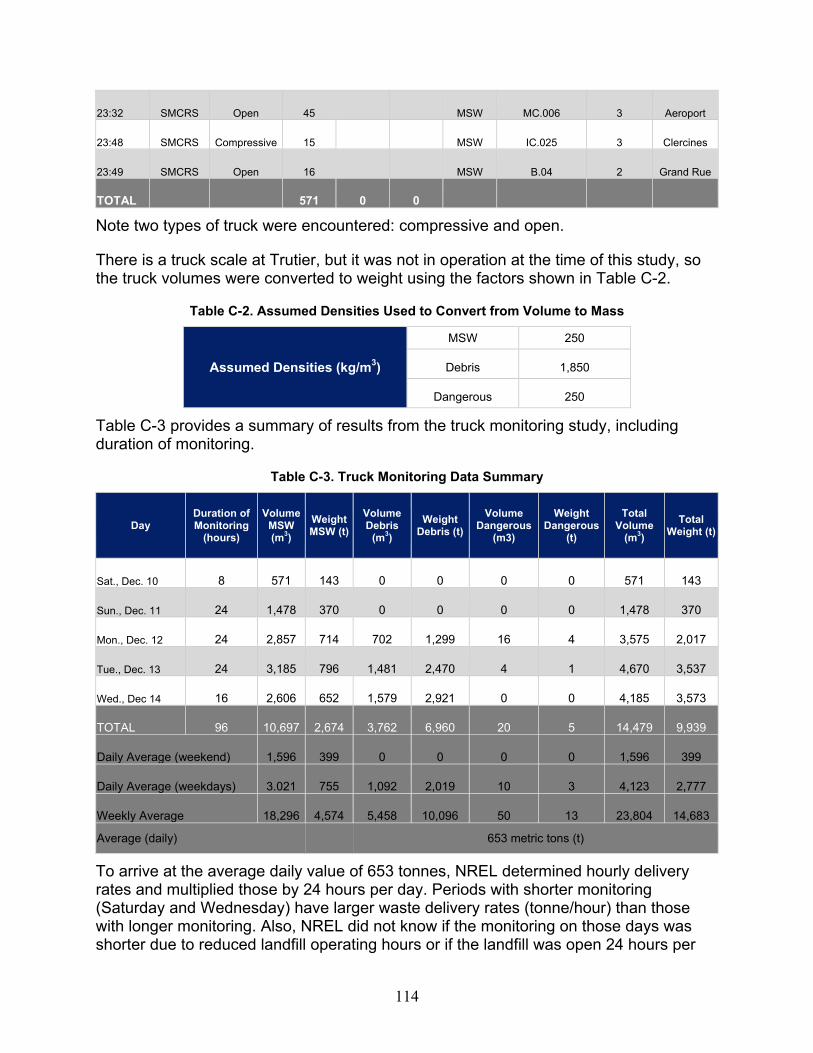
114
23:32 SMCRS Open 45 MSW MC.006 3 Aeroport
23:48 SMCRS Compressive 15 MSW IC.025 3 Clercines
23:49 SMCRS Open 16 MSW B.04 2 Grand Rue
TOTAL 571 0 0
Note two types of truck were encountered: compressive and open.
There is a truck scale at Trutier, but it was not in operation at the time of this study, so the truck volumes were converted to weight using the factors shown in Table C-2.
Table C-2. Assumed Densities Used to Convert from Volume to Mass
Assumed Densities (kg/m3)
MSW 250
Debris 1,850
Dangerous 250
Table C-3 provides a summary of results from the truck monitoring study, including duration of monitoring.
Table C-3. Truck Monitoring Data Summary
Day Duration of Monitoring
(hours)
Volume MSW (m3)
Weight MSW (t)
Volume Debris
(m3) Weight
Debris (t) Volume
Dangerous (m3)
Weight Dangerous
(t)
Total Volume
(m3) Total
Weight (t)
Sat., Dec. 10 8 571 143 0 0 0 0 571 143
Sun., Dec. 11 24 1,478 370 0 0 0 0 1,478 370
Mon., Dec. 12 24 2,857 714 702 1,299 16 4 3,575 2,017
Tue., Dec. 13 24 3,185 796 1,481 2,470 4 1 4,670 3,537
Wed., Dec 14 16 2,606 652 1,579 2,921 0 0 4,185 3,573
TOTAL 96 10,697 2,674 3,762 6,960 20 5 14,479 9,939
Daily Average (weekend) 1,596 399 0 0 0 0 1,596 399
Daily Average (weekdays) 3.021 755 1,092 2,019 10 3 4,123 2,777
Weekly Average 18,296 4,574 5,458 10,096 50 13 23,804 14,683
Average (daily) 653 metric tons (t)
To arrive at the average daily value of 653 tonnes, NREL determined hourly delivery rates and multiplied those by 24 hours per day. Periods with shorter monitoring (Saturday and Wednesday) have larger waste delivery rates (tonne/hour) than those with longer monitoring. Also, NREL did not know if the monitoring on those days was shorter due to reduced landfill operating hours or if the landfill was open 24 hours per

115
day but monitoring only occurred for part of the day. Therefore, NREL ignored in its analysis the data from December 14, but included the data from December 10 to arrive at an annual MSW collection rate of 653 tonnes per day (4,574 tonnes/week).
This rate was multiplied by the component fractions from the waste sort analysis to estimate quantities of all components arriving at the landfill, as shown in Table C-4.
Table C-4. Total Quantities of Materials Delivered to the Landfill
Waste Category
Percentage of Total Waste by Mass (%)
Tonnes/Day
Food and misc. organics 54.8 358.1
Paper 10.6 69.2
Textiles 6.5 42.7
Wood 1.9 12.3
Plastic 13.8 90.3
Debris 4.8 31.3
Glass 2.3 15.2
Metal 1.4 9.3
Electronics 0.4 2.7
Hazardous waste 0.2 1.0
Other 3.2 20.7
Totala 100 653
a Individual line items do not sum to totals due to rounding.
116
Appendix D: Study on Colocating and Co-Firing Biogas in Diesel Gensets
HDR Engineering Inc. was contracted to prepare an analysis of the preferred anaerobic digestion (AD) technology option and include an evaluation of the potential for colocating or co-firing of biogas from AD with a diesel power plant. This memorandum addresses the colocation or co-firing of biogas with a diesel power plant but does not address the broader analysis of AD in Haiti.
This study concludes the following:
• Colocating a biogas-fired power plant with a diesel-fueled power plant is beneficial in terms of connection to the power grid and efficiencies related to facility operations and maintenance.
• Co-firing of biogas with diesel fuel in a bifuel power plant is potentially viable in terms of securing either engine or boiler manufacturers to provide the necessary equipment modifications. Further study of the biogas quantity and quality would need to be performed to determine the ideal mixture of biogas with diesel, engine, or boiler configuration, etc.
These findings are described below.
Colocating a Biogas Power Plant with a Diesel-Fueled Power Plant The colocation of a biogas-fueled power plant with a diesel-fueled power plant has potential benefits for a variety of issues. Clarifying, however, our assumption in colocating these two uses is they would remain independent, separately fueled and operated power systems. Namely, the biogas-fueled internal combustion (IC) engine would operate entirely independent from the diesel-fueled IC engine. This configuration is the more common way to use biogas in the generation of electricity. Similarly, maintaining a separately fueled diesel IC engine is the more common way diesel-fueled electrical power generation units (typically called “gensets”) are configured.
Although the two power-generating units would be separate, colocating of separate biogas and diesel power plants is beneficial for a number of reasons. Both of these types of plants can share some of the same costly infrastructure, such as sharing the electrical grid connectivity, maintenance, and shop areas and other building or equipment needs. In addition, colocating these facilities can help minimize operation and maintenance requirements, reducing the cost substantially. Both plants can utilize the same staff. Of course, colocating the AD project that produces biogas near a diesel boiler plant can be advantageous as well by using the biogas in the diesel boiler.
Co-Firing Biogas with Diesel Fuel in a Bi-Fuel Power Plant To clarify the assumptions used in this report, our understanding in preparing this memorandum is the co-firing of biogas would involve the use of either a diesel IC engine configured as a bifuel system or a blended biogas/diesel boiler. The

117
development of electricity generation from biogas will provide a reliable fuel source developed locally from AD facilities. Another means to capture energy contained in biogas is to burn it in steam or hot-water boilers. Many industrial facilities that use AD to treat waste and utilize boiler systems choose to capture and return biogas to existing facility boilers to supplement natural gas or diesel fuel use.
Development of an IC bifuel system consisting of modifications to existing diesel generators is feasible and should be studied further for the specific biogas treatment facilities and the IC engine modifications that will be required. However, a drawback to this type of system is the facility would have a continued reliance on diesel fuel because the bifuel-configured engines rely on the compression of diesel to ignite the fuel in the engine. For complete independence from diesel fuel, the alternative is a spark-ignited IC engine system optimized to operate on biogas fuel.
All three of these technologies are summarized in Table D-1, including their individual advantages and disadvantages.
Table D-1. Technology Summary
Technology Fuel Type Advantages Disadvantages
IC Engine—Gas Biogas No need for diesel storage Only one fuel system to maintain, optimized to run on specific fuel Can run on treated biogas Original equipment manufacturer (OEM) product
Relatively higher capital cost for a new unit compared to diesel fueled unit Lower power density than a diesel engine
IC Engine—Bifuel Biogas and Diesel
Conversion of existing diesel unit to accept bifuel mixtures Fuel flexibility, 100% diesel backup possible Maintain diesel ignition system
Requires diesel storage Two fuel systems to maintain Extensive gas treatment required Equipment is generally aftermarket modification (non-OEM)
Boiler Applications Biogas and Diesel
Moderately low cost to retrofit a boiler Lower gas treatment compared to diesel bifuel requirements
May not be readily available as an option for this project
Biogas generated during anaerobic treatment can be recovered in a variety of ways to generate electricity or to provide an additional heat source. This evaluation focused on summarizing a few select electricity or heat source technologies, and their respective compatibility with biogas fuel, colocating, and co-firing. A summarized discussion of select available technologies to utilize biogas is provided below.
It should be noted that the use of biogas with cogeneration or combined heat and power (CHP) technologies can produce electricity in addition to recovering heat from the combustion unit. Combined heat and power facilities provide high overall cycle efficiency. If the facility is located near a plant that requires thermal energy, this can be efficient and cost-effective for both facilities.

118
Internal Combustion Engines—Biogas
Biogas IC engines are the most widely used technology for generating electricity from biogas. The size of IC engines range from approximately 300 kilowatts (kW) to 3 megawatts (MW) and larger. Electrical efficiency for IC engines typically ranges between 32%-40%. Heat is recovered from IC engines, providing there is a location for utilizing the heat (as discussed above in cogeneration or CHP applications); otherwise, the heat must be wasted. A disadvantage of IC engines is they characteristically produce higher air emissions as compared to other electrical generation technologies for biogas. However, IC engine capital cost is competitive when comparing this engine to other methods for generating electricity.
A biogas IC engine is typically designed to operate only on a gaseous fuel, which relies on a spark ignition engine system. Spark-ignited engines can be designed to perform efficiently using a specific fuel, such as a high energy fuel like gasoline or a low energy fuel like biogas. These types of engines are readily available from an OEM/supplier.
Internal Combustion Engines—Bifuel
A diesel IC engine is designed to operate on the compression of the fuel as the ignition source. Diesel engines do not utilize spark plugs for ignition; instead, high compression ratios produce ignition of the diesel/air fuel mixture.
A bifuel IC engine is a diesel engine that has been modified with an aftermarket fuel system such that the engine runs on a combination of natural gas and diesel fuel. The bifuel system modifications are typically external to an existing diesel engine and do not employ internal modifications. Typically, the modifications for a bifuel system are limited to the fuel intake/injection system. The modifications include revising the fuel injection system so as to inject gaseous fuel into the air intake system ahead of the turbocharger. The combination air/natural gas mixture is compressed in the turbocharger and fed to each cylinder by the existing engine air intake manifold. The gas mixture is ignited in each cylinder by the existing diesel injector system. The bifuel system intake controls the amount of gas flowing to the engine based on engine performance, load, or ambient conditions. A bifuel system provides the benefit of fuel flexibility, given full diesel operation is still possible if there is an upset in gas supply. However, a bifuel system requires available diesel for the ignition of the engine in order to run. Operating conditions and existing diesel engine physical characteristics typically limit the maximum gas-to-diesel fuel ratio possible; the maximum gas ratio is typically 65%-70%, based on gasoline caloric values but would be lower using biogas. Lower quality gas, operating conditions, and maximum engine loads typically limit the gas ratio to 50%-65%. As a result, using biogas in diesel IC engines could be an attractive option, provided the availability of diesel remains consistent and the AD facility is colocated or in close proximity to the diesel-fueled power plant. This would be an example of colocating an AD facility near diesel IC engine facilities. In addition, bifuel operation emissions typically reduce emission levels as compared to 100% diesel operation.

119
Typically, bifuel systems are applied to high-speed diesel engines up to 3 MW. An aftermarket bifuel system supplier, GTI Technologies, offers standard models covering a range of generator sizes. Table D-2 summarizes the range available.
Table D-2. GTI Technologies—Bifuel Model Series Summary
Model Generator Size (kW)
Series A Up to 150 kW
Series I Up to 300 kW
Series II 350-600 kW
Series III 650-1100 kW
Series IV 1200-3000 kW
Bifuel Case Studies
Our research has identified numerous examples of bifueled facilities. For the most part, the use of bifueled facilities appears to be a relatively recent practice. All of the projects that HDR located have been developed since 2003. Consequently, the operating history of their success is relatively minimal as compared to single-fuel (either biogas or diesel) power plants. Table D-3 is a listing of 10 completed GTI bifuel projects, their location, power output, and installation date. The estimated capital cost of bifuel is $40/kW, and the installation and commissioning would be an additional $15/kW, for a total of $55/kW.
Table D-3. Bifuel Reference Projects
Location Engine kW Rating Installation Date
Jacksonville, FL Cummins KTA-19 350 October 2004 Fayetteville, AR Caterpillar 3516B 2,000 June 2005 Fort Walton, FL Caterpillar 3412 500 June 2005 Miami, FL Cummins KTA-38 750 June 2005 Sunrise, FL Detroit Diesel
800 March 2004
India Caterpillar 3508B 1,000 June 2005 Toronto, CA Caterpillar D349 800 March 2005 Torreon, Mexico Cummins QST30 800 March 2005 Miami, FL Mitsubishi S16R-
1,600 June 2003
Hancock Co, MS CAT C-18 500 N/A
Source: http://diesel2gas.com/projects
Bifuel Boiler Applications
Another efficient means to capture energy contained in biogas is to burn the biogas in a steam or hot water boiler. Steam boilers are approximately 80% efficient in producing energy in the form of steam. Many industrial facilities that use AD to treat waste and utilize boiler systems choose to capture and return biogas to existing facility boilers to supplement natural gas or diesel fuel use. Typically, minor improvements and

120
modifications are necessary to allow biogas to either be blended with a natural gas boiler feed or burned directly in diesel or liquid fuel boilers through burner replacements, modifications, or designated biogas burner additions. As a result, using biogas as a fuel for a boiler is an attractive option, providing boiler facilities are in close proximity to AD facilities. Emissions from boilers are moderately high and, as a result, boilers are typically fitted with special burners to reduce air pollutants, particularly nitrogen oxide emissions.
Biogas Quality and Pretreatment Biogas may contain approximately 60%-70% methane (dry basis), with the remainder composed of carbon dioxide, hydrogen sulfide, and other trace gases. Biogas is also saturated with moisture. As the biogas cools during handling, water will condense in the biogas piping. Therefore, provisions for condensate removal must be considered in this type of system.
Depending on how biogas is recovered and used, as described below, extraneous biogas constituents, including water, sulfur, carbon dioxide, and siloxanes, will likely need to be removed from the gas before it is used. Furthermore, air emission restrictions may require additional biogas treatment upstream of utilization beyond what may be required by the biogas utilization equipment. Therefore, careful consideration of the quality of the biogas is important to properly account for the extent and cost of biogas treatment requirements needed for a particular facility. Appropriate treatment requirements should continue to be further defined and anticipated as the project progresses.
Biogas Treatment Requirements
In order to prepare the biogas for use as either a fuel for an IC engine or a boiler, removal of moisture, hydrogen sulfide, and other trace gases is necessary. For biogas IC engines, the manufacturers generally recommend moisture be substantially removed (to less than 80% relative humidity) from the biogas prior to sending it to an IC engine. Sulfur should also be removed (to less than 250 parts per million by volume) from the biogas to reduce sulfur air emissions from the IC engine. To achieve these gas quality requirements, it is assumed a chiller system and iron sponge would be used for moisture and sulfur removal.
For biogas fed to a boiler, the biogas pretreatment typically requires a similar level of cleanup prior to utilizing biogas, especially if a facility is trying to limit its sulfur emissions. If sulfur emissions are not a critical concern, gas treatment may not be required prior to utilization. However, for planning purposes, we have included the removal of sulfur (in the form of hydrogen sulfur or H2S), as well as moisture removal, as shown in Table D-4.
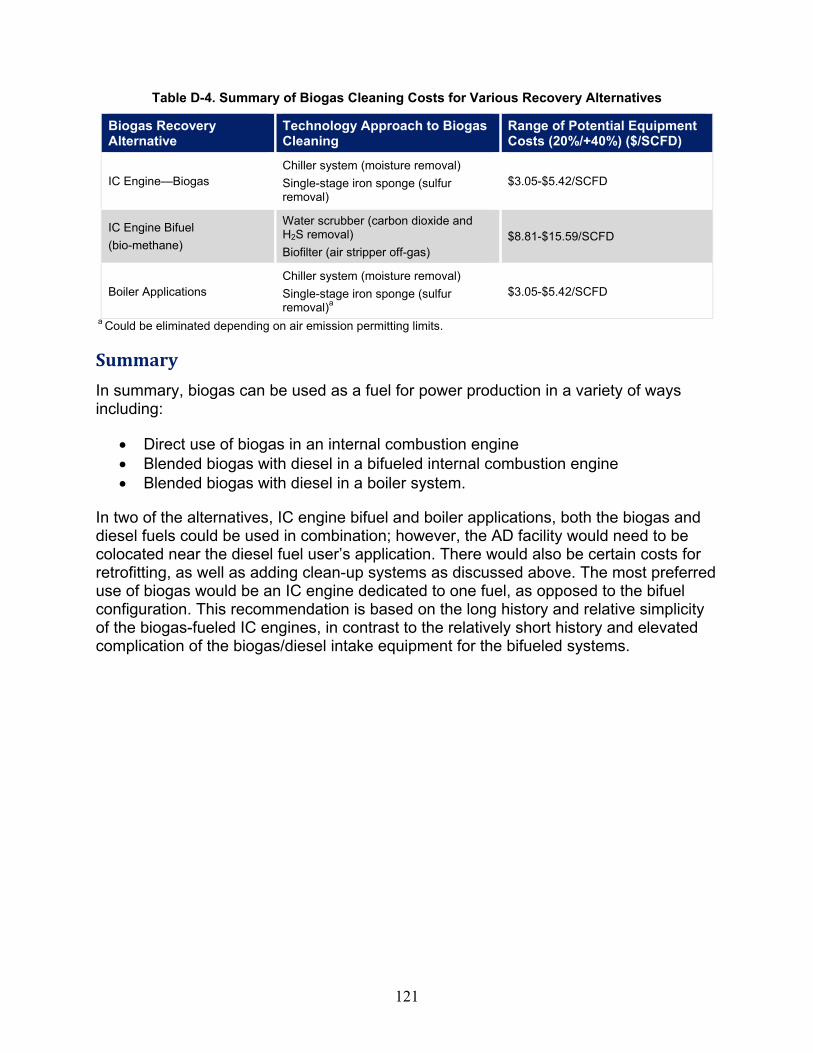
121
Table D-4. Summary of Biogas Cleaning Costs for Various Recovery Alternatives
Biogas Recovery Alternative
Technology Approach to Biogas Cleaning
Range of Potential Equipment Costs (20%/+40%) ($/SCFD)
IC Engine—Biogas Chiller system (moisture removal) Single-stage iron sponge (sulfur removal)
$3.05-$5.42/SCFD
IC Engine Bifuel (bio-methane)
Water scrubber (carbon dioxide and H2S removal) Biofilter (air stripper off-gas)
$8.81-$15.59/SCFD
Boiler Applications Chiller system (moisture removal) Single-stage iron sponge (sulfur removal)a
$3.05-$5.42/SCFD
a Could be eliminated depending on air emission permitting limits.
Summary In summary, biogas can be used as a fuel for power production in a variety of ways including:
• Direct use of biogas in an internal combustion engine • Blended biogas with diesel in a bifueled internal combustion engine • Blended biogas with diesel in a boiler system.
In two of the alternatives, IC engine bifuel and boiler applications, both the biogas and diesel fuels could be used in combination; however, the AD facility would need to be colocated near the diesel fuel user’s application. There would also be certain costs for retrofitting, as well as adding clean-up systems as discussed above. The most preferred use of biogas would be an IC engine dedicated to one fuel, as opposed to the bifuel configuration. This recommendation is based on the long history and relative simplicity of the biogas-fueled IC engines, in contrast to the relatively short history and elevated complication of the biogas/diesel intake equipment for the bifueled systems.