current situation and economic feasibility of e-waste
TRANSCRIPT

UNITED NATIONS INDUSTRIAL DEVELOPMENT ORGANIZATION Vienna International Centre, P.O. Box 300, 1400 Vienna, Austria
Tel: (+43-1) 26026-0 · www.unido.org · [email protected]
OCCASION
This publication has been made available to the public on the occasion of the 50th
anniversary of the
United Nations Industrial Development Organisation.
DISCLAIMER
This document has been produced without formal United Nations editing. The designations
employed and the presentation of the material in this document do not imply the expression of any
opinion whatsoever on the part of the Secretariat of the United Nations Industrial Development
Organization (UNIDO) concerning the legal status of any country, territory, city or area or of its
authorities, or concerning the delimitation of its frontiers or boundaries, or its economic system or
degree of development. Designations such as “developed”, “industrialized” and “developing” are
intended for statistical convenience and do not necessarily express a judgment about the stage
reached by a particular country or area in the development process. Mention of firm names or
commercial products does not constitute an endorsement by UNIDO.
FAIR USE POLICY
Any part of this publication may be quoted and referenced for educational and research purposes
without additional permission from UNIDO. However, those who make use of quoting and
referencing this publication are requested to follow the Fair Use Policy of giving due credit to
UNIDO.
CONTACT
Please contact [email protected] for further information concerning UNIDO publications.
For more information about UNIDO, please visit us at www.unido.org

Economic Feasibility of e-Waste Treatment in Tanzania
Final Version, March 2012
Fabian Blaser & Mathias Schluep
Swiss Federal Institute for Materials Science and Technology (Empa) St.Gallen, Switzerland
Prepared for United Nations Industrial Development Organization (UNIDO)


Economic Feasibilty Study for e-Waste Recycling in Tanzania
A
Executive Summary
To address the issue of Waste Electrical and Electronic Equipment (WEEE) or e-waste in Tanzania the United Nations Industrial Development Organization (UNIDO) aims at the implementation of a manual e-waste treatment facility in Dar es Salaam, Tanzania. As a first step this report presents a financial feasibility study as a basis for the subsequent development of a detailed business plan for a manual e-waste treatment facility. The feasibility study is based on model calculation with the purpose to roughly estimate all relevant financial flows which occur during the operation of local recycling and refurbishment businesses, and to identify key processes and parameters reacting sensitive on changing conditions.
The model calculations are based on a baseline scenario, which represents the current conditions in Tanzania as recently assessed by UNIDO in 2010 and analogies to the situation and experiences in other African countries. In Tanzania e-waste material is often purchased through tenders in bulk volumes, which is usually a mix consisting of obsolete appliances or scrap material and devices apt for refurbishment. This is reflected in a relatively high purchase price which goes beyond the value of pure scrap material. The model therefore considers that collection is followed by a triage of the material to recycling and refurbishment for maximal value creation. As a consequence, results are presented separately for a recycling facility and a refurbishment facility as separate businesses.
Under conditions as given in the baseline scenario, the operation of a refurbishment facility can be a profitable business. At a throughput of ~25 t/y of refurbished Electrical and Electronic Equipment (EEE) break-even is reached. That corresponds roughly to 680 PCs plus 370 TV sets per year, which should be achievable in Tanzania. Changing business conditions are mainly driven by the two factors purchase price of bulk material and sales price of refurbished products. The purchase price of bulk materials obviously has to be reflected in the share of material apt for refurbishment and the business would lose money if this share would drop below 10% at current purchase prices. Competitive low prices of new products, such a netbooks, also need to be anticipated, and might put pressure on the sales prices of refurbished products in the future.
Also for recycling, results suggest that under the current local and global economic conditions the business model is feasible by relying on the intrinsic value of the treated material only. However sufficient throughput is crucial as under current conditions break-even is attained at a throughput of ~230 t/y recycled WEEE only. Even under best case scenarios at least 100 t/y of recycling material is needed for a break-even. Given the rather low potential volumes (2’000 - 3’000 tons) of obsolete computers in 2010 in Tanzania these critical volumes cannot be achieved realistically within a few years. Hence it is expected that seed-funding or providing grants in the initial phase of building up a business might be required to bridge the gap until collection has reached critical volumes.
Changing conditions in general can pose relevant risks to the recycling business. If the commodity prices fall below the average prices of 2010, the business can already become financially unstable.

Economic Feasibility Study for e-Waste Recycling in Tanzania
B
Also changing appliance composition can result in high treatment costs. While it is profitable to treat IT equipment, a high share of CRT monitors and TVs would lower the financial performance. In addition informal cannibalization of the bulk material during collection can affect the intrinsic material value of scrap considerably. However, if this can be avoided results suggest that revenues generated by treating IT equipment allows to cross-finance the processing of other costly appliances, such as CRTs. Nevertheless CRTs will remain a challenge in mid-term and a regional solution should be developed for the treatment of this fraction.
A further aspect to be considered are the minimal lot sizes of Printed Wiring Boards (PWBs), which are required in order to sell those fractions to international end-processors. Currently a minimal throughput of 700t of WEEE per year is required to achieve the minimal lot size of high grade PWBs and 280t/y for medium grade, respectively, at the end of the year. As PWBs are a major revenue driver, unsold PWBs substantially hamper the cash-flow of the business. A strategy to avoid long-term interruption of revenues is to cooperate with similar projects at a regional level and gathering PWBs from several recycling facilities in a regional hub, which should allow to gather the critical volumes in a shorter time frame. Since a regional cross-frontier solution could raise strong resistance from the authorities, there is need for a regional policy framework and awareness building.
Based on this analysis it is concluded that a sustainable recycling business can only grow in Tanzania in combination with a comprehensive framework, which ensures:
1. that business sustainability is also guaranteed under unfavourable economic conditions. I.e. an additional flexible income stream enabled through a financing scheme needs to be established for situations where the intrinsic value of the treated material is not sufficient for a break-even;
2. that recycling businesses can grow in a level playing field. I.e. that rules set by legislation, standards, as well as monitoring and control mechanisms favour high standard operations;
3. that market incentives are set such as high collection and recycling rates are encouraged. I.e. appropriate collection processes need to be attracted, ensuring that high volumes of valuable and non-valuable waste fractions are collected equally and that those fractions reach appropriate treating facilities.
4. that regional cross-national cooperation models are supported in order to gather critical volumes of e.g. PWBs. I.e. this models should allow recyclers to participate in the global market for a maximal return of value for secondary raw materials, which also requires that government bodies guarantee a smooth, reliable and timely handling of export licenses and other administrative procedures to facilitate exports of certain e-waste fractions.

Economic Feasibilty Study for e-Waste Recycling in Tanzania
I
Table of Content
Executive Summary .......................................................................................................... 1
Table of Content ................................................................................................................. I 1 Introduction ................................................................................................................. 2
1.1 Objectives ......................................................................................................................... 2
2 Model Development .................................................................................................... 3 2.1 Model Description ............................................................................................................. 3
2.1.1 Recycling ............................................................................................................................................................... 4 2.1.2 Refurbishment .................................................................................................................................................... 4 2.1.3 Collection .............................................................................................................................................................. 5 2.1.4 Breakdown of Expenses for Collection ..................................................................................................... 5
2.2 Baseline Scenario ............................................................................................................. 6 2.2.1 Recycling Operation ......................................................................................................................................... 7 2.2.2 Refurbishment Operation .............................................................................................................................. 9
2.3 Costs .............................................................................................................................. 10 2.3.1 Labour Costs ..................................................................................................................................................... 10 2.3.2 Rental Costs ...................................................................................................................................................... 10 2.3.3 Commodity Prices (incl. PWB and battery prices) ........................................................................... 10 2.3.4 Transportation Costs .................................................................................................................................... 12 2.3.5 End-processing costs .................................................................................................................................... 13
3 Results and Discussion ........................................................................................... 14 3.1 Baseline Scenario ........................................................................................................... 14
3.1.1 Recycling Operation ...................................................................................................................................... 16 3.1.2 Refurbishment Operation ........................................................................................................................... 19
3.2 Sensitivity Analysis for Recycling .................................................................................... 20 3.2.1 Commodity Prices .......................................................................................................................................... 20 3.2.2 (W)EEE Composition .................................................................................................................................... 21 3.2.3 Dismantling Efficiency .................................................................................................................................. 24 3.2.4 Purchase Price of (W)EEE ........................................................................................................................... 25 3.2.5 Wages for Manual Labour ........................................................................................................................... 27
3.3 Sensitivity Analysis for Refurbishment ............................................................................ 28 3.3.1 Share of Collected (W)EEE apt for Refurbishment ........................................................................... 28 3.3.2 Sales Prices of Refurbished Devices ....................................................................................................... 30
4 Conclusions .............................................................................................................. 32
5 References ................................................................................................................ 35
Glossary ........................................................................................................................... 36
List of Abbreviations ....................................................................................................... 38
List of Figures ................................................................................................................. 38
List of Tables ................................................................................................................... 39

Economic Feasibility Study for e-Waste Recycling in Tanzania
2
1 Introduction
Similar to the global markets, the consumption rates of electrical and electronic equipment (EEE) have accelerated in Africa in the last decade. As a consequence, the volumes of waste originating from those appliances, generally known as Waste Electrical and Electronic Equipment (WEEE) or e-waste, have risen significantly. To date, Africa is lacking appropriate infrastructure to treat e-waste in a controlled manner and most activities in this field are performed by the informal sector. This leads not only to a high loss of valuable resources comprised in e-waste, but to severe environmental and health issues due to the inadequate treatment procedures applied.
To foster the proper management of e-waste in Tanzania, the United Nations Industrial Development Organization (UNIDO) aims at the implementation of a manual e-waste treatment facility in Dar es Salaam. Empa1 – the Swiss Federal Laboratories for Materials Science and Technology – has been mandated by UNIDO to contribute its experience in the field of e-waste with a feasibility study. The study assesses financial aspects of e-waste recycling and refurbishment of EEE in Tanzania.
1.1 Objectives
The main objective of this study is to assess the financial feasibility of an e-waste recycling business and EEE refurbishment business in Dar es Salaam, Tanzania. It aims at providing a basis for the subsequent development of a detailed business plan for a manual e-waste treatment facility.
The study encompasses appliances of the following WEEE categories2: IT and telecommunications equipment (cat. 3) and consumer equipment (cat. 4). The focus is set on desktop PCs, laptops, printers as well as TV sets.
1 www.empa.ch, www.ewasteguide.info
2 See classification according to the EU WEEE Directive 2002/96/EC: http://eur-lex.europa.eu/LexUriServ/LexUriServ.do?uri=OJ:L:2003:037:0024:0038:EN:PDF
Economic Feasibilty Study for e-Waste Recycling in Tanzania
3
2 Model Development
2.1 Model Description
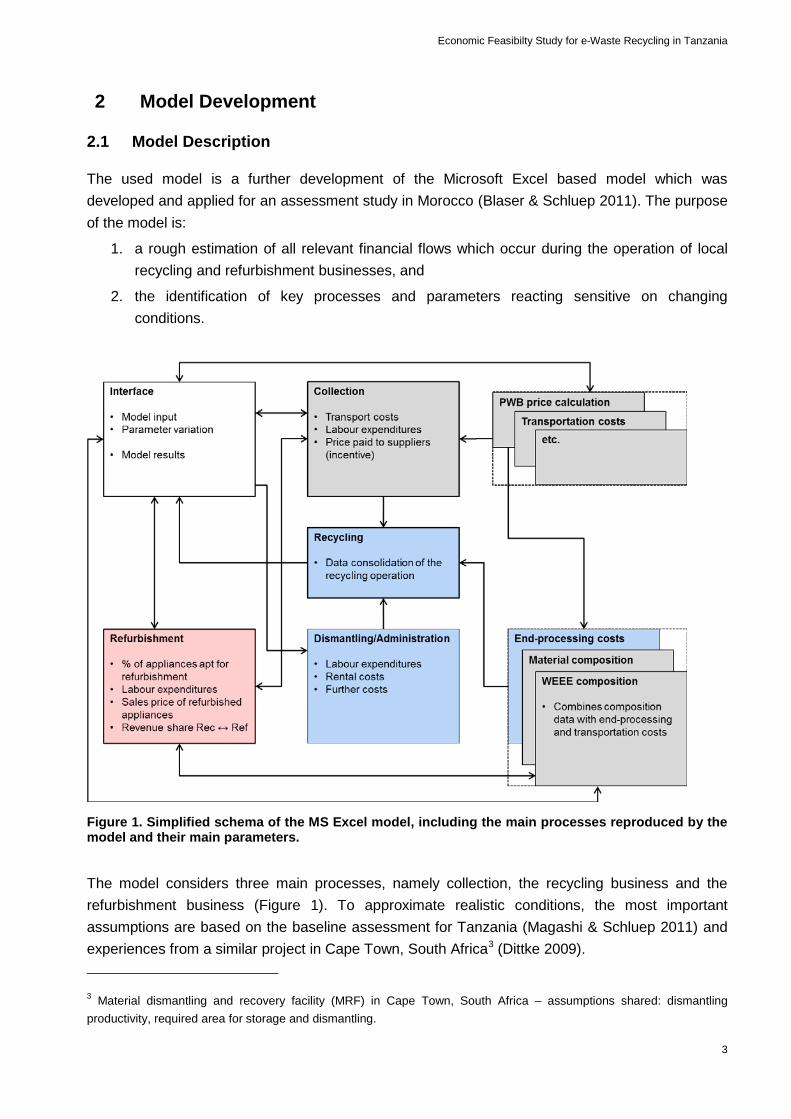
The used model is a further development of the Microsoft Excel based model which was developed and applied for an assessment study in Morocco (Blaser & Schluep 2011). The purpose of the model is:
1. a rough estimation of all relevant financial flows which occur during the operation of local recycling and refurbishment businesses, and
2. the identification of key processes and parameters reacting sensitive on changing conditions.
Figure 1. Simplified schema of the MS Excel model, including the main processes reproduced by the model and their main parameters.
The model considers three main processes, namely collection, the recycling business and the refurbishment business (Figure 1). To approximate realistic conditions, the most important assumptions are based on the baseline assessment for Tanzania (Magashi & Schluep 2011) and experiences from a similar project in Cape Town, South Africa3 (Dittke 2009). 3 Material dismantling and recovery facility (MRF) in Cape Town, South Africa – assumptions shared: dismantling productivity, required area for storage and dismantling.

Economic Feasibility Study for e-Waste Recycling in Tanzania
4
Figure 2. (W)EEE flows in the model; collection is considered as a preceding operation to the recycling and refurbishment operation. From a financial perspective, the two business units remunerate the collection expenses according to their revenue share (see Figure 3).
2.1.1 Recycling
The recycling module of the model consists of a dismantling operation, where the appliances are disassembled manually. It is designed to include several appliances of the EU-WEEE directive categories 3 and 4: PCs (LCD & CRT monitor), laptops, printers, mobile phones, TV sets (LCD & CRT monitor), audio devices and video devices. Within the recycling module, the following processes are taken into account:
• manual dismantling labour and rental costs plus further costs
• transports transports during collection, from dismantling to downstream processing
• downstream processing (mainly recovery and disposal) treatment in recovery and disposal facilities, including associated costs and profits
• administration labour and rental costs, further costs
The purpose of this module is to get an idea of the uncertainties related to the question: What is the economic performance of a recycling operation under changing framework conditions?
2.1.2 Refurbishment
In the refurbishment module, the comprised processes are:
• triage and testing of the collected (W)EEE labour and rental costs, further costs

Economic Feasibilty Study for e-Waste Recycling in Tanzania
5
• refurbishment of the devices apt for reuse labour and rental costs, further costs as well as the sale of the refurbished appliances were taken into account.
• administration labour and rental costs, further costs
The explicit motivation for this business unit is to establish an additional revenue and to extend the life span of the appliances. However, if the refurbishment of collected appliances does not contribute to a better financial performance, there is little reason to include this business unit.
In the model, the whole refurbishment operation comprises several stages. Firstly, all the collected appliances are sorted according to their suitability for being refurbished. Then, those devices are tested for their functionality and finally the refurbishment itself is carried out.
The purpose of this module is to get an idea of the uncertainties related to the question: What is the economic effect of refurbishment under changing framework conditions?
2.1.3 Collection
A special process in the operation chain is the collection, which comprises
• acquisition of (W)EEE purchase prices of the collected material
• collection and transport transport costs, costs for take-back points, labour costs, etc.
Currently material collected in Tanzania usually represents a bulk of obsolete appliances (actual scrap material) and appliances which are still apt for refurbishment. This is reflected in the purchase price for this bulk material, which is higher than for scrap only. That is also why collection is considered as a preceding stage to the recycling and refurbishment operation in the model (see Figure 2) and expenses associated to collection are divided between the two business units.
2.1.4 Breakdown of Expenses for Collection
As mentioned above the purchase price of bulk e-waste material has to be understood as a combined price for scrap material as well as for equipment still apt for refurbishment and subsequent sale as second-hand equipment. It can be assumed that the weight based value of scrap material is lower than the value of material which is still good for reuse. To get a rough idea of the individual purchase prices of these two fractions it was assumed that the share of the purchase price is proportional to the revenue share which each business unit gains from the collected bulk of (W)EEE. Accordingly the individual purchase prices for the material for recycling and material for refurbishment were calculated (Figure 3) The results of the calculation in the present study are shown in Table 7.

Economic Feasibility Study for e-Waste Recycling in Tanzania
6
Figure 3. Calculation scheme for the respective contribution of each business unit to the purchase price. (1) Calculation of the absolute revenue which each business unit can generate with the respective share of appliances. (2) The revenue share of each business unit is calculated. (3) The revenue share is applied to the original purchase price of the mixed material. The revenue share is also used to assign each business’ contribution to the further collection. The numbers used in this figure are just exemplary.
2.2 Baseline Scenario
The baseline scenario represents the current conditions in Tanzania based on the recent baseline assessment (Magashi & Schluep 2011) and analogies to the situation and experiences in other African countries. The main parameters and assumptions of each business unit are described in the next two subchapters.
As mentioned above the collection of (W)EEE is performed in a preceding stage that is financed jointly by both business units. To allocate the respective shares of the total collected amount to each business, the following assumptions are used in the model for the baseline scenario:
Share of collected material which is apt for refurbishment
• From B2B-collection: 40% of collected appliances are suitable for refurbishment; except TVs: 25%.
• From household collections: 25% of collected appliances are suitable for refurbishment.
Rate refurbishment – To the amounts delivered to refurbishment (see above), a general

Economic Feasibilty Study for e-Waste Recycling in Tanzania
7
recycling reduction factor of 25% is applied which reflects the percentage of obsolete material which arises during refurbishment. Thus, 25% of the material assigned to refurbishment ends up as e-waste again (=> recycling module).
To allow a better understanding of the described assumptions, Figure 4 shows the partitioning of an exemplary collected amount of 100 t to the two business units.
Figure 4. Breakdown of an exemplary collected amount of 100 t (W)EEE to the recycling operation and the refurbishment operation, respectively, according to the baseline scenario. The left scheme reflects the (W)EEE collected via B2B channels, the right scheme the (W)EEE collected via the informal sector.
2.2.1 Recycling Operation
The given assumptions provide a rough overview of the most relevant model parameter settings that were used for the baseline scenario in this study.
Some further assumptions are given in appendix 0.
Facility location Dar es Salaam, Tanzania
Appliance scope • Desktop PC (LCD & CRT monitor)
• Laptop
• Printer
• TV set (LCD & CRT monitor)
Ø Appliance composition See Table 1, mainly based on figures from Morocco (GIZ 2010)
Further costs 10% of total considered costs for dismantling & administration
Collection scheme 50% collected via B2B scheme (companies, administrations)
50% collected via informal sector (households)
Purchase price of (W)EEE See Table 2

Economic Feasibility Study for e-Waste Recycling in Tanzania
8
Commodity prices Average prices for 20104 (Au, Ag, Pd, Cu, Fe, Al considered)
Revenue factor Generally, 75% of potential value is recovered by dismantling. For exceptions see appendix 0.
Minimal wage 167 USD/month (ø exchange rate Jan. – June 2011)
Dismantling productivity 2.5 tons of WEEE per month per workforce (based on experiences from Cape Town)
Table 1. (W)EEE composition in the baseline scenario (based on numbers from Morocco, see GIZ (2010) and assumptions, see appendix 0).
Desktop (CPU) CRT
monitor LCD
monitor laptop printer CRT TV LCD TV 19.9% 22.7% 1.7% 1.1% 7.6% 42.0% 5.0%
Table 2. Purchase prices of (W)EEE devices from informal sector (IS) and from companies and authorities (B2B) according to the baseline scenario (source: field survey by CPC Tanzania).
PC
CRT monitor
LCD monitor laptop printer CRT TV LCD TV
IS USD/kg 0.45 0.45 0.45 2.86 0.51 0.21 0.45 B2B USD/kg 0.53 0.53 0.53 3.34 0.51 0.21 0.45 IS USD/unit 4.50 6.41 1.95 10.02 3.34 6.68 6.68 B2B USD/unit 5.25 7.48 2.28 11.69 3.34 6.68 6.68
Downstream processing
Usually, various alternatives exist where a fraction resulting from manual dismantling can be supplied to. The alternatives can differ in financial aspects, but also in aspects related to the quality of the treatment (e.g. environmental and social conditions of treatment). A careful selection of downstream processing is therefore essential for the operation of a recycling facility which complies with environmental and social standards.
Table 3 indicated the downstream processes which have been selected in the present study.
4 Average commodity prices for the period from January 1st 2010 to November 8th 2010

Economic Feasibilty Study for e-Waste Recycling in Tanzania
9
Table 3. Downstream processing for each fraction. fractions destination copper local market, Tanzania aluminium local market, Tanzania iron local market, Tanzania Brass local market, Tanzania PWB high grade Umicore Precious Metals, Belgium PWB medium grade Umicore Precious Metals, Belgium PWB low grade Umicore Precious Metals, Belgium CRT glass Griag, Germany plastics MBA, China plastics with FR MBA, China cables local market, Tanzania waste landfill, Tanzania hazardous waste hazardous waste treatment, Europe Hg-lamps, LCD Relec, Spain batteries Umicore Battery Recycling, Belgium
2.2.2 Refurbishment Operation
The underlying assumptions for this module rely on information provided by the CPC Tanzania and experiences made in South Africa5. In the baseline scenario, the following parameter settings were used:
Appliances scope PCs (CRT & LCD), laptops, printers, TVs (CRT & LCD)
Considered processes Sorting, testing and refurbishment
Further costs 10% of total considered costs
Worker’s productivity • Sorting: 200 units/month per worker
• Testing: 100 units/month per worker
• Refurbishment: 100 units/month per worker
Product prices • Refurbished PC: 100 USD/unit
• Refurbished laptop: 200 USD/unit
• Refurbished printer: 13.4 USD/unit
Refurbished TV: 33.4 USD/unit
Revenue factor • 100%
Work space / worker • 50 m2 for refurbishing, 25 m2 for triage & testing
5 Cape Town Material Recovery Facility (MRF)

Economic Feasibility Study for e-Waste Recycling in Tanzania
10
2.3 Costs
The purpose of this chapter is to give a view of current costs considered in the model. The most crucial numbers are listed below, while in appendix 0 more detailed numbers can be found.
2.3.1 Labour Costs
Because of the labour intensity of a manual dismantling facility, the wages paid to the workers are a relevant factor in the budget.
The minimum wage in Tanzania is 90 USD/month. Based on information of the CPC Tanzania and experiences from other developing countries, the wage for a common worker in a model facility (dismantling, refurbishing, etc.) is assumed to be 167 USD/month, about 85% higher than the minimum wage.
Further wages which were used in the model are given below6:
• Secretary 335 USD/month
• Driver 200 USD/month
• Administration assistant 1’000 USD/month
• Manager 2’000 USD/month
2.3.2 Rental Costs
Without knowing for certain where the dismantling facility is located, it is difficult to determine the rental costs as they can vary according to the location. Several purchase and rental prices can be found in the appendix. For the model, a price of 0.82 USD per m2 and month has been calculated based on a rental price for a storage depot in an industrial zone in Vingunguti Industrial Estate/Dar es Salaam7.
2.3.3 Commodity Prices (incl. PWB and battery prices)
Via the commercialization of the fractions supplied to the downstream processing, in particular of PWBs and metals, the commodity prices significantly affect the revenue of e-waste businesses. These prices are set on an international level, so the business is strongly dependent on the global markets and thus is very sensitive to this factor. A strong fluctuation of the commodity prices could be observed during recent years, what demonstrates the sensitive reaction on this factor of a business like the one delineated in this study. Since the striking decline of the commodity prices in
6 Those wages rely on indications from CPC Tanzania
7 Information provided by CPC Tanzania, source: tenant at Vingunguti for a factory work room at Vingunguti Industrial Estate charged by SIDO.

Economic Feasibilty Study for e-Waste Recycling in Tanzania
11
2008, most of them have reached similar or even higher levels than before the global economic crisis.
The commodity prices which were applied in the model are the average prices of 20108 (baseline scenario, see chapter 2.2.1). In the table below the metal prices which are relevant for e-waste are presented.
Table 4. Average commodity prices for 2010.
gold (Au) silver (Ag) palladium (Pd) copper (Cu) aluminum (Al) iron (Fe)9
USD/oz USD/oz USD/oz USD/t USD/t USD/t
Ø 2010 1'199.15 18.80 493.18 7'300.00 2'150.00 480.00
Locally paid commodity prices differ to the global market prices as listed in Table 4. Hence the sale of the base metals (Cu, Al, Fe) had to be set based on information gathered in a field survey on the local market by the CPC Tanzania. The following prices were used in the model:
• Copper 4’000 USD/ton
• Aluminum 1’330 USD/ton
• Scrap iron 267 USD/ton
• Brass 2’000 USD/ton
The precious metals fraction (Au, Ag, Pd) sits on the PWBs and is a highly relevant fraction for the revenue. Among others, their commodity price is determined by the prices of Au, Ag, Pd and Cu. The price calculation used in this study is based on the business model used by Umicore Precious Metals, Belgium. Hereafter, the PWB prices for the respective minimum lot sizes based on the average metal prices of 201010 are given:
• PWB high grade (Au content of 200 - 300 ppm) 12'500 USD/ton (lot size of 5 tons)
• PWB medium grade (Au content of 100-200 ppm) 7'800 USD/ton (lot size of 7 tons)
• PWB low grade (Au content of 50-100 ppm) 3'400 USD/ton (lot size of 10 tons)
Those prices for PWB include all charges by Umicore, but do not comprise the transportation costs.
8 Average commodity prices for the period from January 1st 2010 to November 8th 2010
9 Prices for steel billets 10 Average commodity prices for the period from January 1st 2010 to November 8th 2010

Economic Feasibility Study for e-Waste Recycling in Tanzania
12
The prices for batteries which Umicore offers depend on the current commodity prices for cobalt (in case of Li-ion batteries) and nickel (NiMH batteries)11. According to Umicore, the average share of those two types of laptop batteries is approximately 87,5% Li-Ion and 12,5% NiMH batteries.
2.3.4 Transportation Costs
Different types of transportation are required in e-waste management, in particular if output fractions are traded in the global markets. First, the appliances must be collected to a facility, then the respective fractions are distributed to national and international downstream processing. In this particular case, transportation by lorry, by train and by ship was considered.
The table below gives an idea about the most important costs which were taken into account in the model.
Table 5. Transportation costs.
type details costs source
lorry, 5t urban collection Dar es Salaam with driver and 4 workers, incl. Taxes
107 USD/day CPC Tanzania
lorry urban transport costs per ton and km, Dar es Salaam
2 USD/(t*km) CPC Tanzania
lorry intercity transport costs per ton and km, Tanzania
0.67 USD/(t*km) CPC Tanzania
ship 6m-container; Dar es Salaam to Antwerp, Belgium
2‘410 USD globalshippingcosts.com
ship 6m-container; Dar es Salaam to Hamburg, Germany
2‘407 USD globalshippingcosts.com
ship 6m-container; Dar es Salaam to Guangzhou, China
1‘988 USD globalshippingcosts.com
ship 6m-container; Dar es Salaam to Chennai, India
1‘673 USD globalshippingcosts.com
ship 6m-container; Dar es Salaam to Sevilla, Spain
2‘254 USD globalshippingcosts.com
train/lorry 6m-container; Hamburg to Berlin 631 USD Zippel
With regard to the transport types, significantly higher transport costs must be expected for the transport by land than for the transport by sea. Furthermore it was found that the contribution of transport costs to the total downstream processing costs are generally rather small.
11 The prices for batteries offered by Umicore Batteries (www.batteryrecycling.umicore.com) are confidential data.

Economic Feasibilty Study for e-Waste Recycling in Tanzania
13
2.3.5 End-processing costs
Depending on the generated volume of the respective fractions, the end-processing can result in a significant expenditure. In the subsequent table, some of the relevant end-processing data are compiled.
Table 6. End-processing costs for different fractions.
fraction costs source
complete cathode ray tube, undestroyed 84 USD/t GRIAG
CRT glass, crushed, uncleaned 105 USD/t GRIAG
CRT monitor, without casing 351 USD/t Recilec
CCFL (Hg-Lamps from flat screens) 1‘193 USD/t Recilec
plastic, with and without flame retardants 0 USD/t* MBA
battery (Li-Ion & NiMH) see commodity prices (chapter 2.3.3)
printed wiring circuit see commodity prices (chapter 2.3.3)
* may be expense or revenue, sample lot has to be shipped to MBA China in order to set the price

Economic Feasibility Study for e-Waste Recycling in Tanzania
14
3 Results and Discussion
The results and their discussion is split up into three subchapters. Chapter 3.1 provides the results of the baseline scenario, which serves as a reference for the sensitivity analyses of the recycling and refurbishment operation in the chapters 3.2 and 3.3.
3.1 Baseline Scenario
This chapter describes in detail the results of the baseline scenario.
In Figure 5 the total income (black) reflects the accumulated incomes of the two business units “recycling operation” (blue) and “refurbishment operation” (red). Their break-even12 is estimated to be at 160 t/y (total income), 300 t/y (recycling) and 120 t/y (refurbishment) of collected (W)EEE, respectively. At 1000 t/y of collected (W)EEE, recycling operation generates an estimated income of 60’000 USD and refurbishment operation an income of 290’000 USD, adding up to a total income of 350’000 USD.
The second and third axis in the figure indicate the share of the totally collected amount of (W)EEE which is treated in the recycling and the refurbishment operation, respectively. In the baseline scenario, 22% of the collected (W)EEE is supplied to the recycling and 78% to the refurbishment operation.
A further split-up of the respective expenses and revenues in the recycling and refurbishment operation is given in the subsequent chapters.
12 break-even is the point at which expenses and revenues are equal

Economic Feasibilty Study for e-Waste Recycling in Tanzania
15
Figure 5. Model results for the baseline scenario.
Purchase prices and revenues split between the two business units are presented in Table 7 (according to the calculation scheme in chapter 2.1.4). For materials collected via B2B channels, the revenue share of the recycling operation amounts to 37%, while the refurbishment operation contributes with 63% of total revenues. For material collected via the informal sector, the revenue shares are 44% for recycling and 56% for refurbishment, respectively. Estimated purchase prices for materials collected via B2B channels and materials collected via the informal sector are in a similar order. For the recycling operation, a price of ~200 USD/ton WEEE is estimated, for the refurbishment operation a price of ~800-900 USD/ton EEE.

Economic Feasibility Study for e-Waste Recycling in Tanzania
16
Table 7. Calculated shares in total revenue and purchase prices according to the scheme described in chapter 2.1.4. The last column “mix” represents a weighted mean of the values of all appliances (weighted according to the appliance composition in the baseline scenario).
unit CRT-
PC LCD-
PC laptop printer CRT-
TV LCD-
TV mix B2B: revenue share by recycling % 21% 18% 2% 42% 50% 67% 37% B2B: revenue share by refurbishment % 79% 82% 98% 58% 50% 33% 63%
B2B: purchase price for recycling $/t 180 160 110 360 140 400 190 B2B: purchase price for refurbishment $/t 1'050 1'090 8'190 740 420 580 820
IS: revenue share by recycling % 34% 31% 4% 60% 50% 67% 44% IS: revenue share by refurbishment % 66% 69% 96% 40% 50% 33% 56%
IS: purchase price for recycling $/t 210 190 140 410 140 400 200 IS: purchase price for refurbishment $/t 1'190 1'260 11'020 830 420 580 920 B2B: collection via business channels IS: collection via informal sector
3.1.1 Recycling Operation
Figure 6. Breakdown of costs and revenues for the recycling operation, calculated according to the baseline scenario. The lower x-axis indicates the total amount of mixed material for recycling and refurbishment, which needs to be collected to gather the corresponding volumes for recycling.

Economic Feasibilty Study for e-Waste Recycling in Tanzania
17
Figure 6 indicates that in the baseline scenario recycling operation reaches break-even at a throughput of ~230 t/y, for which a total of ~300 t/y of mixed material needs to be collected. As Figure 7 demonstrates, especially the expenses for administration account for a relatively great share of total expenses at lower collected amounts (~35% at 100 t/y of collected (W)EEE). However, from Figure 6 it can be seen that from a throughput of ~100 t/y downstream processing and collection are responsible for most of the expenses in the recycling operation. At a throughput of 783 t/y (which corresponds to 1000 t/y total amount of collected mixed material), the two processes constitute almost 75% of total expenses (Figure 7).
Figure 7. Share of expenses of the different processes carried out for the recycling operation.
In the recycling operation, only the sales of certain end-processing fractions generate revenues. Table 8 shows the breakdown of these revenues. Copper (Cu), iron (Fe) and printed wiring board (PWB) fractions account for over 90% of total revenues.
Particularly the revenues generated by the sale of PWBs are crucial for the financial sustainability of the recycling operation, as they sum up to more than 60% of total revenues. Regarding those PWB sales it is important to consider the minimal lot sizes which are required by the downstream partner. This model considers minimal lot requirements as set by Umicore Precious Metals, however it can be assumed that other international refineries would set similar conditions. Table 9 lists the throughput in the baseline scenario which is required to reach those minimal lot sizes. This implies that low, medium and high grade PWBs cannot be sold to the end-processor before 200, 360 and 960 tons of (W)EEE, respectively, are collected.

Economic Feasibility Study for e-Waste Recycling in Tanzania
18
Table 8. Revenue share per fraction for each appliance.
PC (tower)
CRT monitor
LCD monitor laptop printer CRT TV LCD TV
all appliances
Cu 0.1% 49.2% 2.1% 8.0% 13.8% 33.5% 2.0% 19.6% Al 6.7% 4.6% 3.3% 6.5% 0.4% 0.0% 3.0% 3.4% Fe 18.6% 4.2% 6.9% 9.5% 8.5% 8.0% 6.2% 10.1% PWB high grade 0.0% 0.0% 84.6% 0.0% 0.0% 0.0% 87.4% 13.4% PWB medium grade 66.1% 0.0% 0.0% 64.2% 72.9% 0.0% 0.0% 28.1% PWB low grade 4.1% 42.0% 0.0% 0.0% 0.0% 58.5% 0.0% 23.3% cables 4.3% 0.0% 3.1% 2.0% 4.4% 0.0% 1.5% 2.0% batteries 0.0% 0.0% 0.0% 9.8% 0.0% 0.0% 0.0% 0.1%
Table 9. Required throughput to achieve minimal lot sizes.
PWB type Minimal lot size (Umicore) required throughput in baseline scenario
[collected amount] [recycled amount]
low grade 10 t 200 t/y 160 t/y
medium grade 7 t 360 t/y 280 t/y
high grade 5 t 900 t/y 700 t/y

Economic Feasibilty Study for e-Waste Recycling in Tanzania
19
3.1.2 Refurbishment Operation
Figure 8. Breakdown of costs and revenues for the refurbishment operation, calculated according to the baseline scenario. The lower x-axis indicates the total amount of material for recycling and refurbishment, which needs to be collected to gather the corresponding volumes for refurbishment.
The refurbishment operation reaches break-even at a throughput of ~25 t/y, for which a total ~120 t/y of mixed (W)EEE material needs to be collected (see Table 8).
Concerning the expenses for the refurbishment operation, the major shares are attributed to collection and, at lower refurbished amounts, to administration. At a refurbished amount of 217 t/y the expenses for collection account for almost 60%, while the labour intensive triage & testing and the refurbishment process itself only account for 18% and ~6%, respectively (Figure 9). Hence, a variation of wages for manual labour should not have a large impact on overall performance of the refurbishment operation.

Economic Feasibility Study for e-Waste Recycling in Tanzania
20
Figure 9. Share of expenses of the different processes carried out for the refurbishment operation.
Table 10 demonstrates that the sales of PCs (> 60%) and laptops (20%) are responsible for most of revenues in this business unit. Obviously, those shares are closely linked to the sales prices applied in the baseline scenario. The effect of varying sales prices is analysed in chapter 3.3.2.
Table 10. Contribution of each appliance to the revenue of refurbishment in the baseline scenario. The shares of each appliance do not change with varying amounts of (W)EEE that are refurbished. The respective sales prices of each appliance are also indicated.
PC (tower) laptop printer CRT TV LCD TV
share of revenue 62% 20% 5% 11% 3% sales price [USD/unit] 100.2 200.3 13.4 33.4 33.4
3.2 Sensitivity Analysis for Recycling
To evaluate the relevance of the different parameters and processes in the recycling operation, a simple sensitivity analysis is carried out. With different defined parameter sets (e.g. different commodity prices), the recycled e-waste amount per year is varied (x-axis) in order to examine if the business performance increases or decreases with a rising amount recycled (income on y-axis). The different parameter sets and the respective results are described in the following chapters.
3.2.1 Commodity Prices
A significant share of the revenues is linked with the sales of metals or PWBs (see Table 8). Hence, the overall business performance is depending on international commodity prices. To

Economic Feasibilty Study for e-Waste Recycling in Tanzania
21
analyse their impact on the income, the commodity prices of copper (Cu), aluminium (Al), iron (Fe), silver (Ag), gold (Au) and palladium (Pd) are considered in the model.
As depicted in Figure 10, the business performance changes significantly as a result of varying commodity prices. As clearly indicated in Table 11 the average commodity prices have been rising from 2004 to 2011. This in turn allows for a potential positive income of a recycling business in Tanzania since 2008, once enough material is collected to reach break-even (Figure 10).
Figure 10. Sensitivity of income from recycling at varying commodity prices.
Table 11. Revenue generated by commercialization of downstream processing fractions at different commodity prices in relation to the average commodity prices 2010. The prices are an average over a certain period, except in the scenario 06.07.2011, which is assumed to represent the current all-time high prices.
commodity price 06.07.2011 Ø 2010 Ø 2008 Ø 2004-2008 Ø 2004
revenue in relation to Ø 2010
132% 100% 77% 59% 43%
3.2.2 (W)EEE Composition
Each material fraction generated during the dismantling causes a certain expense or revenue. Due to the different material composition of each appliance (see appendix 0), the overall appliance composition of the recycled e-waste has a direct impact on the business performance.

Economic Feasibility Study for e-Waste Recycling in Tanzania
22
Two different scenario sets regarding the composition of the (W)EEE bulk are presented below. The first scenario set describes the impact of collecting and treating a different (W)EEE bulk than given in the baseline scenario (IT bulk or TV bulk), which could be a possible strategy for the recycling operation (see Table 12). Additionally, the second scenario set gives an idea of the potential impact which is caused by the technological shift towards flat screen monitors and laptops (see Table 13). The respective share of the devices is based on a study from Morocco (GIZ 2010) and supplementary assumptions (see appendix 0).
In Figure 11 the business performance for different appliance composition scenarios is shown, the black line reflecting the baseline scenario. Splitting up the original composition used in the baseline scenario into IT devices on the one hand and TV devices on the other hand (see Table 12), it becomes apparent that the treatment of IT devices generates significantly more revenue than the treatment of TV devices. While the treatment of IT devices yields break-even at a recycled amount of ~30 t/y, the exclusive treatment of TVs never reaches break-even under the given settings. It is apparent from these results that TVs are a cost driver for recycling.
Table 12. (W)EEE composition for the different scenarios (by weight).
PC (tower)
CRT monitor
LCD monitor
laptop printer CRT TV LCD TV
IT & TV (baseline) 19.9% 22.7% 1.7% 1.1% 7.6% 42.0% 5.0%
IT 37.5% 42.8% 3.3% 2.2% 14.3%
TV
89.4% 10.6%
Figure 11. Sensitivity of income from recycling at varying (W)EEE composition.

Economic Feasibilty Study for e-Waste Recycling in Tanzania
23
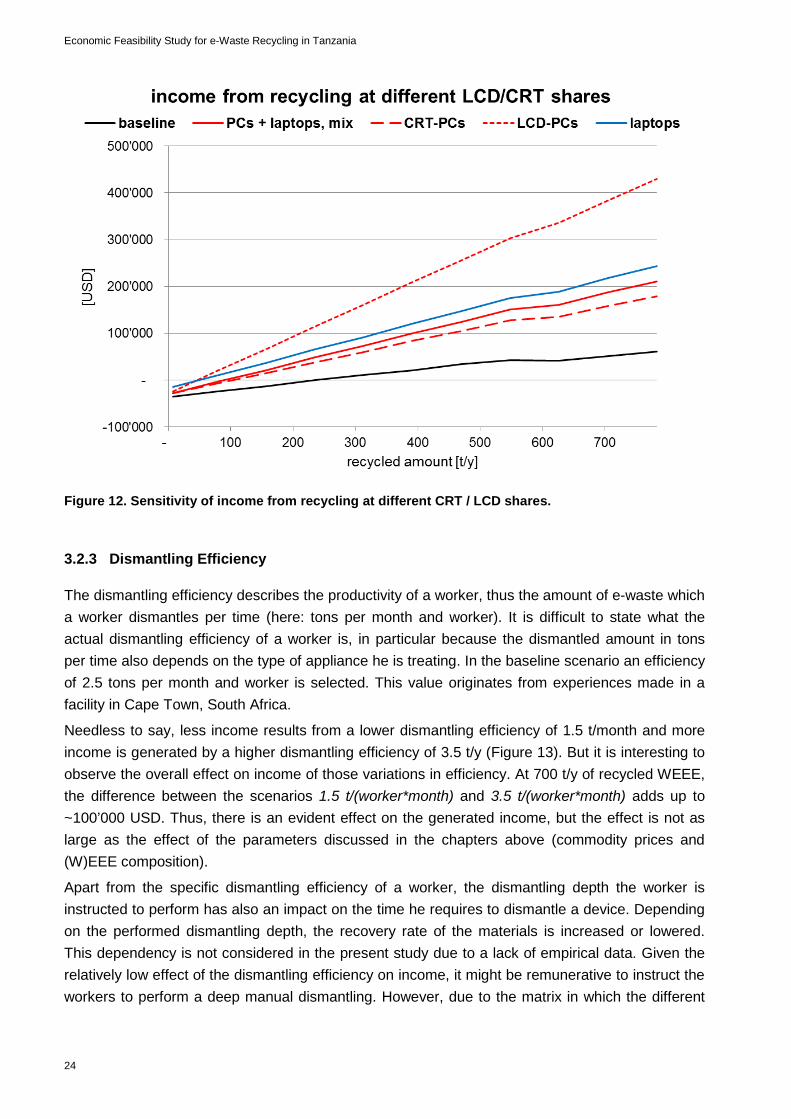
Today, many obsolete PCs are desktop computers with a cathode ray tube (CRT) monitor. It is generally known that the appropriate treatment of CRTs generates relatively high costs due to its significant content of lead glass. In the future, the amounts of CRTs are likely to decrease due to the increasing use of LCD monitors and laptop computers. Figure 12 demonstrates the potential financial impact of this technological development on a recycling business. The presented scenario PCS + laptops, mix comprises all computer appliances, while the other 3 scenarios (CRT-PCs, LCD-PCs and laptops) do only comprise one type of appliance.
In Figure 12 the baseline scenario is shown as a black line as a reference. As it includes TVs, the financial performance is significantly worse than the performance of the other scenarios. Income is similar for the scenarios PCS + laptops, mix, CRT-PCs, and laptops, while the treatment of LCD-PCs leads to a significantly higher income (break-even at ~40 t/y).
The results demonstrate that the trend towards LCD monitors will have a significant positive effect on the income of a recycling operation. This is due to the lower treatment costs of LCD screens. Nevertheless, the treatment of CRT glass will remain a technical and financial challenge for recycling businesses in a short and medium term.
Table 13. (W)EEE composition of the different scenarios for the CRT - LCD share of PCs.
PC (tower)
CRT monitor
LCD monitor laptop printer CRT TV LCD TV
baseline 19.9% 22.7% 1.7% 1.1% 7.6% 42.0% 5.0% PCs + laptops, mix 43.8% 49.9% 3.8% 2.4%
CRT-PCs 41.3% 58.7% LCD-PCs 69.7%
30.3%
laptops
100.0%
Economic Feasibility Study for e-Waste Recycling in Tanzania
24
Figure 12. Sensitivity of income from recycling at different CRT / LCD shares.
3.2.3 Dismantling Efficiency
The dismantling efficiency describes the productivity of a worker, thus the amount of e-waste which a worker dismantles per time (here: tons per month and worker). It is difficult to state what the actual dismantling efficiency of a worker is, in particular because the dismantled amount in tons per time also depends on the type of appliance he is treating. In the baseline scenario an efficiency of 2.5 tons per month and worker is selected. This value originates from experiences made in a facility in Cape Town, South Africa.
Needless to say, less income results from a lower dismantling efficiency of 1.5 t/month and more income is generated by a higher dismantling efficiency of 3.5 t/y (Figure 13). But it is interesting to observe the overall effect on income of those variations in efficiency. At 700 t/y of recycled WEEE, the difference between the scenarios 1.5 t/(worker*month) and 3.5 t/(worker*month) adds up to ~100’000 USD. Thus, there is an evident effect on the generated income, but the effect is not as large as the effect of the parameters discussed in the chapters above (commodity prices and (W)EEE composition).
Apart from the specific dismantling efficiency of a worker, the dismantling depth the worker is instructed to perform has also an impact on the time he requires to dismantle a device. Depending on the performed dismantling depth, the recovery rate of the materials is increased or lowered. This dependency is not considered in the present study due to a lack of empirical data. Given the relatively low effect of the dismantling efficiency on income, it might be remunerative to instruct the workers to perform a deep manual dismantling. However, due to the matrix in which the different

Economic Feasibilty Study for e-Waste Recycling in Tanzania
25
materials are enclosed, a recovery rate of 100% is not even attainable with an extreme effort (deep manual dismantling) for most of the materials.
A detailed analysis of the optimal dismantling depth for computers from an economic and environmental perspective can be found in Gmuender (2007).
Figure 13. Sensitivity of income from recycling for different dismantling depths.
3.2.4 Purchase Price of (W)EEE
A relevant share in the total expenses of the recycling operation is caused by collection (~30%, see Figure 7), which in turn is mainly driven by the purchase price of the (waste) material. Though, it is difficult to determine the actual purchase price which has to be paid for the appliances from either the user itself (e.g. company, individual) or a collector of (W)EEE (e.g. scavengers working in the informal sector). Below, the impact of a varying purchase price on the financial performance of the recycling operation is therefore analysed.
The purchase prices used in the 3 scenarios are given in Table 14, where 100% represents the baseline scenario. The two further scenarios are calculated with the respective percentage of the prices used in the baseline scenario.

Economic Feasibility Study for e-Waste Recycling in Tanzania
26
Table 14. Purchase prices applied in the different scenarios. It is important to note that the prices given refer to mixed (W)EEE-material consisting of obsolete appliance for recycling (WEEE) and appliances that are still apt for refurbishment (EEE). The prices are indicated in USD/kg; 100% is the baseline scenario.
50% 100% 150%
IS B2B IS B2B IS B2B PC 0.23 0.27 0.45 0.53 0.68 0.80 CRT monitor 0.23 0.27 0.45 0.53 0.68 0.80 LCD monitor 0.23 0.27 0.45 0.53 0.68 0.80 laptop 1.43 1.67 2.86 3.34 4.29 5.01 printer 0.26 0.26 0.51 0.51 0.77 0.77 CRT TV 0.11 0.11 0.21 0.21 0.32 0.32 LCD TV 0.22 0.22 0.45 0.45 0.67 0.67
As indicated in Figure 14 the purchase price obviously has a relevant effect on the income in the recycling operation. At 150% of the original purchase price recycling operation only reaches break-even beyond the indicated range of 0 - 780 tons of recycling throughput. On the contrary, income rises significantly if less money is spent for the acquisition of the appliances (50%, break-even at ~150 tons of recycled WEEE).
For the collection of used appliances, this price is a crucial parameter which can potentially amplify the collected amount of (W)EEE by incentivizing the stakeholders. As a consequence, the purchase price should be carefully determined, respectively negotiated, in order to offer a price which provides sufficient incentive to the suppliers but does not strain the budget too much.
Figure 14. Sensitivity of income from recycling at different purchase prices.

Economic Feasibilty Study for e-Waste Recycling in Tanzania
27
3.2.5 Wages for Manual Labour
In the baseline scenario, the wages of the dismantlers account for ~15% of the total expenses by the recycling operation (see Figure 7). According to data provided by the CPC Tanzania, a realistic wage for dismantling work is around 170 USD/month, which was applied in the baseline scenario (100%). As it is assumed that this number represents realistic wages and that greater changes are, only a relatively small variation of wages has been analysed in the sensitivity analyses (+/- 25% of the original wage). The respective wages in USD/month are given in Table 15.
Table 15. Wages for manual labor in the different scenarios. scenario wage 100%, baseline 167 $/month 75% of baseline 125 $/month 125% of baseline 209 $/month
In all three scenarios, break-even is reached between a recycled amount of 200 to 300 t/y (Figure 15). Apparently, the effect of a varying wage for the dismantlers on the generated income is not significant.
Figure 15. Sensitivity of income from recycling for worker’s wage. The percentages applied refer to the wages used in the baseline scenario (see Table 14).

Economic Feasibility Study for e-Waste Recycling in Tanzania
28
3.3 Sensitivity Analysis for Refurbishment
Similar to the analysis of the recycling operation, different parameters that are relevant for the financial performance of the refurbishment operations are analysed hereafter. The different parameter sets and the respective results are described in the following chapters.
3.3.1 Share of Collected (W)EEE apt for Refurbishment
As shown in Figure 2 (see chapter 2.1), the collected (W)EEE is partly sold to the recycling operation and partly sold to the refurbishment operation. To calculate the financial performance of each business unit, a certain share of the overall collected (W)EEE is allocated to the refurbishment operation in the model. Numbers provided by the CPC Tanzania suggest that approximately 30% of all collected appliances end up in the refurbishment process13. The different scenarios are listed in Table 16 and show the shares allocated to the refurbishment operation, indicated in relation to the baseline scenario (100%) at 33%, 66% and 133%.
Table 16. Share of collected (W)EEE which is apt for refurbishment per device and scenario.
sce-nario
PC (tower)
CRT monitor
LCD monitor laptop printer CRT TV LCD TV
B2B (W)EEE2 100%1 40.0% 40.0% 40.0% 40.0% 40.0% 25.0% 25.0%
household (W)EEE2 25.0% 25.0% 25.0% 25.0% 25.0% 25.0% 25.0% B2B (W)EEE
33% 13.3% 13.3% 13.3% 13.3% 13.3% 8.3% 8.3% household (W)EEE 8.3% 8.3% 8.3% 8.3% 8.3% 8.3% 8.3% B2B (W)EEE
66% 26.7% 26.7% 26.7% 26.7% 26.7% 16.7% 16.7% household (W)EEE 16.7% 16.7% 16.7% 16.7% 16.7% 16.7% 16.7% B2B (W)EEE
133% 53.3% 53.3% 53.3% 53.3% 53.3% 33.3% 33.3% household (W)EEE 33.3% 33.3% 33.3% 33.3% 33.3% 33.3% 33.3% 1 baseline scenario
13 It is estimated that 25% of the appliances supplied to the refurbishment operation are dysfunctional and therefore end up in the recycling operation. See assumptions in chapter 2.2 and the numbers which are treated in each business unit in chapter 3.1.

Economic Feasibilty Study for e-Waste Recycling in Tanzania
29
Figure 16. Sensitivity of income from refurbishment at different shares of collected (W)EEE which is apt for refurbishment.
Figure 16 shows the resulting incomes for the different scenarios14. Identically to the other sensitivity analyses in this study, each scenario is calculated for the range from 0 to 1’000 tons of collected (W)EEE per year. Due to the varying share which is allocated to the refurbishment operation in the 4 scenarios, 1’000 t/y of collected (W)EEE result in different amounts of refurbished EEE (see the respective cross (X) in the figure). Figure 16 indicates that the differences in the incomes are large for the different scenarios. In the scenario 133%, break-even is reached at a refurbished amount of ~25 t/y. In contrast, income does not reach break-even in the scenario 33%. At 1’000 t/y of collected (W)EEE, which corresponds to 70 t/y of refurbished EEE, the business loses up to minus 20’000 USD.
The significant drop in income associated with the decrease of the (W)EEE-share supplied to refurbishment can be attributed particularly to two factors. (1) Less revenue is generated as it decreases proportionally to the amount of refurbished (sold) EEE. (2) In all scenarios, the 14 An important aspect is not considered in this analysis (nor in chapter 3.3.2): the adaptation of the purchase price to the revenue per ton which is generated by both businesses. Basically, the purchase prices indicated by the CPC Tanzania are only reasonable for the baseline scenario. If the share of the collected (W)EEE delivered to the refurbishment operation decreases, less revenue can be generated in the total operation (at given prices, the refurbishment operation generates more revenue per ton than the recycling operation). Consequently, the value (purchase price) of the collected (W)EEE should fall. As this effect is not taken into account in the model, the results of the scenarios 33% and 66% can be considered as a worst case.

Economic Feasibility Study for e-Waste Recycling in Tanzania
30
refurbishment operation bears a great share in the total expenses for collection. This share decreases with a declining revenue from the refurbishment operation (see calculation scheme in chapter 2.1.4), but this decrease of expenses is exceeded by the drop in revenue.
The share in the collected (W)EEE which is suitable for refurbishment has an important effect on the income generated by the refurbishment operation. In view of this, it is suggested to assess carefully which share in the collected (W)EEE is actually suitable for refurbishment. Generally, appliances originating from companies and authorities (B2B collection channel) have a larger share of appliances suitable for refurbishment.
3.3.2 Sales Prices of Refurbished Devices
Obviously also the sales prices of the refurbished devices have a direct impact on the revenue of the refurbishment operation. The prices provided by the CPC Tanzania are applied in the baseline scenario (100%, see Table 17). For the sensitivity analysis, two further scenarios are arranged: the scenarios 50% and 150%. The percentages of these scenarios refer to the prices of the baseline scenario. Table 17 lists the resulting sales prices.
Table 17. Average sales prices of refurbished devices in USD/unit.
baseline (=100%) 50% 150%
refurbished desktop PC 100.00 50.00 150.00 refurbished laptop 200.00 100.00 300.00 refurbished printer 13.40 6.70 20.10 refurbished TV 33.40 16.70 50.10
Needless to say, an increase of 150% of the sales prices used in the baseline scenario results in a significantly better income, attaining break-even at ~15 tons of refurbished EEE. Contrariwise, the reduction of sales prices by 50% worsens the income in a manner that break-even is not reached in this scenario.
On the one hand, the variation of the sales prices has a great effect on the income earned by the refurbishment operation. On the other hand, the real market prices of refurbished devices are difficult to figure out and depend on several factors (e.g. quality of refurbished devices, available competitive products, etc.).
In order to budget the refurbishment operation, it should additionally be considered that the prices for new products (in particular for IT equipment) have fallen considerably in recent years. This trend potentially hampers the sale of refurbished devices and obliges to reduce their sales prices.

Economic Feasibilty Study for e-Waste Recycling in Tanzania
31
Figure 17. Sensitivity of the income from refurbishment at different sales prices.

Economic Feasibility Study for e-Waste Recycling in Tanzania
32
4 Conclusions
Results of the financial modelling suggest that under the current local and global economic conditions and if sufficient throughput is guaranteed the recycling operation is a feasible business model by relying on the intrinsic value of the treated material only. Accordingly the refurbishment operation is feasible by generating sufficient income through the sales of appliances for reuse. However, changing conditions can pose relevant risks to the business, which consequently would require additional income streams.
As investigations for this study revealed, the collected material (e.g. purchased in tenders) in Tanzania is commonly a mix consisting of obsolete appliances or scrap material and devices apt for refurbishment. This is reflected in a relatively high purchase price which goes beyond the value of pure scrap material. It is therefore crucial that collection is followed by a triage of the material to recycling and refurbishment for maximal value creation. However, it is suggested to strictly separate the recycling and the refurbishment operation from each other and treat them as separate businesses.
Accordingly, the conclusions for the two business operations are discussed separately:
Refurbishment Operation
Under conditions as given in the baseline scenario, the operation of a refurbishment facility can be a profitable business. At a throughput of ~25 t/y of refurbished EEE break-even is reached. That corresponds roughly to 680 PCs plus 370 TV sets per year, which should be achievable in Tanzania. However, conditions as assumed in the baseline scenario are subject to uncertainties and constant change which can lower or unbalance the business income.
This is driven mainly by the two factors purchase price of bulk material and sales price of refurbished products. The purchase price of bulk materials obviously has to be reflected in the share of material apt for refurbishment. At current purchase prices for bulk material as given in the baseline scenario, model calculations suggest that the refurbishment would lose money once the share of material for refurbishment drops below 10%. Another threat to the business stems from the reduction of the sales prices of refurbished products, which can be triggered through poor quality second-hand products or budget-priced competing products, including low priced new products, such as netbooks.
Recycling Operation
Break-even in the recycling operation is attained at a throughput of ~230 t/y recycled WEEE in the baseline scenario. Success and sustainability of such a recycling business depend on a multitude of parameters, which entail both opportunities and threats. Some crucial parameters have been analysed. The main conclusions of this sensitivity analysis are summarized below.
• Below a throughput of ~100t/y, break-even is not reached. An effective collection system is thus a precondition for a successful recycling business. Thereby incentive systems will play a crucial role, e.g. by providing an attractive service in a B2B collection scheme and a reasonable incentive for individual collectors. In addition ensuring cash flow with e.g. seed-

Economic Feasibilty Study for e-Waste Recycling in Tanzania
33
funding or providing grants in the initial phase of building up a business might be required to bridge the gap until collection has reached critical volumes.
• A further aspect to be considered are the minimal lot sizes of PWBs which are required in order to sell those fractions to international end-processors. According to the baseline scenario, a minimal throughput of 700t of WEEE per year is required to achieve the minimal lot size of high grade PWBs (280t/y for medium grade respectively). As PWBs are a major revenue driver, unsold PWBs substantially hamper the cash-flow of the business. A strategy to avoid long-term interruption of revenues is to cooperate with similar projects at a regional level and uniting PWBs of several recycling facilities (e.g. Camara in Kenya) in a regional hub, which should allow to gather the critical volumes in a shorter time frame. Since a regional cross-frontier solution could raise strong resistance from the authorities, there is need for a regional policy framework and awareness building.
• Commodity prices have a strong impact on the business performance. While current prices allow for a working business case, the budget can readily become unbalanced if the commodity prices fall below the average prices of 2010. Although the global economic trend points towards rather stable or increasing commodity prices for a longer period, this dependency has to be interpreted as a relevant risk for the business’ profitability.
• Due to a different material composition of specific appliances, business performance also depends on the appliance composition of collected e-waste. While it is profitable to treat IT equipment, the treatment of TVs lowers the financial performance. This fact favours a collection scheme via B2B channels, where mostly IT equipment is gathered. Particularly in the initial phase of establishing a business, this can be a promising approach. However, if households are also included in the collection scheme, TVs will inevitably end up in the collection, too. Results suggest that revenues generated by treating IT equipment allows to cross-finance the processing of TVs and other costly appliances.
• The treatment of CRT glass deserves special attention as it is a cost driver for the recycling business. In spite of the decreasing sales numbers of CRT monitors, they will still make up a large proportion of the obsolete monitors in the medium term. Thus, further (regional) downstream processing alternatives which help to reduce the costs along with the compliance of environmental standards should be analysed. In doing so, cooperation with lead smelters could be a potential alternative (see also Schluep et al. (2009)).
Although the model results suggest that, currently, recycling in Tanzania can be run by relying on the intrinsic value of the treated material only, changing conditions can pose relevant risks to the business. In Tanzania, a throughput of 200 - 300 t/y allows a sustainable recycling operation. That corresponds to a collected amount of 300 - 400 tons of ICT and consumer electronics per year. Given the rather low potential volumes (2’000 - 3’000 tons) of obsolete computers in 2010 in Tanzania (Magashi & Schluep 2011), critical volumes cannot be achieved realistically within a few years. It is therefore concluded that a sustainable recycling business can only grow in Tanzania in combination with a comprehensive framework, which ensures:

Economic Feasibility Study for e-Waste Recycling in Tanzania
34
1. that business sustainability is also guaranteed under unfavourable economic conditions. I.e. an additional flexible income stream enabled through a financing scheme needs to be established for situations where the intrinsic value of the treated material is not sufficient for a break-even;
2. that recycling businesses can grow in a level playing field. I.e. that rules set by legislation and standards, as well as monitoring and control mechanisms favour high standard operations;
3. that market incentives are set such as high collection and recycling rates are encouraged. I.e. appropriate collection processes need to be attracted, ensuring that high volumes of valuable and non-valuable waste fractions are collected equally and that those fractions reach appropriate treating facilities.
4. that regional cross-national cooperation models are supported in order to gather critical volumes of e.g. PWBs. I.e. this models should allow recyclers to participate in the global market for a maximal return of value for secondary raw materials, which also requires that government bodies guarantee a smooth, reliable and timely handling of export licenses and other administrative procedures to facilitate exports of certain e-waste fractions.
Economic Feasibilty Study for e-Waste Recycling in Tanzania
35
5 References
Blaser, F. & Schluep, M., 2011. Current Situation and Economic Feasibility of e-Waste Recycling in
Morocco, St.Gallen / Switzerland: Empa, HP.
Dittke, S., 2009. The development of a Cape Town based regional integrated e-waste management facility- a replicable concept for sustainable e-waste management in developing countries.
GDRC, 2011. Solid Waste Management: Glossary. Global Development Research Center GDRC.
GIZ, 2010. Déchets des Équipements Électriques et Électroniques (DEEE) – Développement d’un projet de recyclage orienté sur les conditions nationales et économiquement autonome (autofinancement), Casablanca, Morocco: GIZ.
Gmuender, S., 2007. Recycling - from waste to resource: assessment of optimal manual dismantling depth of a desktop PC in China based on eco-efficiency calculations. Master Thesis. Zurich / St.Gallen Switzerland: Swiss Federal Institute of Technology (EPFL) / Swiss Federal Laboratories for Materials Testing and Research (Empa).
Laffely, J., 2007. Assessing cost implications of applying best e-waste recovery practices in a manual disassembly material recovery facility in Cape Town, South Africa, using process-based cost modelling. master thesis. Lausanne / St.Gallen Switzerland: EPFL / Empa.
Magashi, A. & Schluep, M., 2011. e-Waste Assessment Tanzania, Dar es Salaam, Tanzania: UNIDO, CPC Tanzania, Empa.
Oguchi, M., 2010. Estimation of metal content based on oral information from M. Oguchi.
Schluep, M. et al., 2009. Recycling - from e-waste to resources, Sustainable innovation and technology transfer industrial sector studies, Paris, France: UNEP, Empa, Umicore, UNU.
StEP, 2009. One Global Understanding of Re-Use - Common Definitions, Bonn, Germany: StEP - Solving the e-Waste Problem / UNU - United Nations University.
Wikipedia, 2011. Recycling codes. Available at: http://en.wikipedia.org/wiki/International_Universal_Recycling_Codes [Accessed May 12, 2011].

Economic Feasibility Study for e-Waste Recycling in Tanzania
36
Glossary
Appliance Composition Appliance composition refers to the share each appliance has in the e-waste stream. It does not refer to the specific material composition of the appliances, see Material Composition.
Collection Collection comprises all the processes and infrastructure necessary to carry together the appliances, excluding the actions undertaken to spread information and raise the awareness among the society (see Public Relations).
CPU In this study, CPU (Central Processing Unit) refers to the computer tower. It does not include the monitor, except for special cases when the monitor and the CPU are enclosed in the same casing.
Dismantling Dismantling comprises any action undertaken to disassemble appliances in order to recycle/refine its components and materials. If not specified otherwise, in this study the term generally refers to manual dismantling.
Disposal Disposal comprises the landfilling of waste fractions in (sanitary) landfills and the incineration of waste in adequate plants.
Downstream processes The downstream processes refer to the stages subsequent to the dismantling and comprise all recipients of any fraction, including the wholesalers and the stakeholders of the end-processing and the disposal.
End-processing The end-processing is part of the downstream processes and comprises the processes that aim for a material recovery, e.g. metals refining.
Informal Sector “The informal sector […] is the part of an economy that is not taxed, monitored by any form of government or included in any gross national product (GNP), unlike the formal economy.” (Wikipedia 2011) Examples are scavengers or non-registered companies.
Material Composition The material composition indicates the share of each material/fraction in a device.
Pre-processing The aim of the pre-processing is to liberate the materials, to separate the contaminants and direct them to adequate subsequent downstream processes. It comprises the handling and sorting of the obsolete appliances as well as their manual dismantling and mechanical processing. (StEP 2009)
Public Relations Public relations (PR) comprises marketing and awareness raising. It thus refers to any action or measure which aims to the dissemination of information about the business and to the awareness raising of waste problems and opportunities.
Recovery rate The recovery rate in the model reflects the share of the material which can be recovered during the dismantling in the facility in order to supply it to the appropriate downstream processing. A recovery rate of 1 means that 100% of the potentially recoverable valuable material is recovered.

Economic Feasibilty Study for e-Waste Recycling in Tanzania
37
Refurbishment Refurbishment comprises any action necessary to restore a unit up to a defined condition in function and form that may be inferior to a new unit. The output product meets the original functionality specifications. To refurbish a product requires disassembling the unit only to the extent that is required to ensure the testing and reprocessing of all components not meeting these specifications. The unit’s composition and design is not changed significantly. The term recondition is understood synonymously for refurbish (StEP 2009).
Repair Repair comprises any action necessary to correct any faults in a unit preventing its specified operation. The output product is in functioning condition. To repair a unit requires only process steps necessary to restore the specified operation. The unit’s composition and design is not changed significantly (StEP 2009).
Re-use Re-use of electrical and electronic equipment or its components is to continue the use of it (for the same purpose for which it was conceived) beyond the point at which its specifications fail to meet the requirements of the current owner and the owner has ceased use of the product (StEP 2009).
Scavenger a person who picks out recyclables from mixed waste wherever it may be temporarily accessible or disposed of (GDRC 2011). For the French disambiguation of scavenger, see (GIZ 2010). Scavengers usually belong to the informal sector.
(W)EEE Abbreviation which is introduced in the study; it refers to both waste electrical and electronic equipment (WEEE, obsolete, supplied to the recycling operation) and electrical and electronic equipment (EEE, still working, supplied to the refurbishment operation).

Economic Feasibility Study for e-Waste Recycling in Tanzania
38
List of Abbreviations
B2B Business to Business
CCFL Cold cathode fluorescent lamps
CPC Cleaner Production Center (Tanzania)
CPU Central Processing Unit
CRT Cathode Ray Tube
EEE Electrical and Electronic Equipment
EMPA Swiss Federal Institute for Material Science and Technology
FR Flame Retardants
FTE Full Time Equivalents (= Full Time Employee)
GIZ Deutsche Gesellschaft für Internationale Zusammenarbeit GmbH
ICT Information and Communication Technologies
IS Informal Sector
Li-Ion Lithium-ion battery
LME London Metal Exchange
MRF Material Recovery Facility
MS Microsoft
NiMH Nickel-Metal Hydride battery
PPP Public-Private Partnership
PWB Printed Wiring Board
USD US Dollars
WEEE Waste Electrical and Electronic Equipment
(W)EEE Waste Electrical and Electronic Equipment as well as Electrical and Electronic Equipment
List of Figures
Figure 1. Simplified schema of the MS Excel model, including the main processes reproduced by the model and their main parameters. ................................................................................................................ 3
Figure 2. (W)EEE flows in the model; collection is considered as a preceding operation to the recycling and refurbishment operation. From a financial perspective, the two business units remunerate the collection expenses according to their revenue share (see Figure 3). .............................................. 4
Figure 3. Calculation scheme for the respective contribution of each business unit to the purchase price. (1) Calculation of the absolute revenue which each business unit can generate with the respective share of appliances. (2) The revenue share of each business unit is calculated. (3) The revenue share is applied to the original purchase price of the mixed material. The revenue share is also used to assign each business’ contribution to the further collection. The numbers used in this figure are just exemplary. ............................................................................................................................. 6

Economic Feasibilty Study for e-Waste Recycling in Tanzania
39
Figure 4. Breakdown of an exemplary collected amount of 100 t (W)EEE to the recycling operation and the refurbishment operation, respectively, according to the baseline scenario. The left scheme reflects the (W)EEE collected via B2B channels, the right scheme the (W)EEE collected via the informal sector. ................................................................................................................................................. 7
Figure 5. Model results for the baseline scenario.............................................................................................15 Figure 6. Breakdown of costs and revenues for the recycling operation, calculated according to the baseline
scenario. The lower x-axis indicates the total amount of mixed material for recycling and refurbishment, which needs to be collected to gather the corresponding volumes for recycling. ....16
Figure 7. Share of expenses of the different processes carried out for the recycling operation. .....................17 Figure 8. Breakdown of costs and revenues for the refurbishment operation, calculated according to the
baseline scenario. The lower x-axis indicates the total amount of material for recycling and refurbishment, which needs to be collected to gather the corresponding volumes for refurbishment. ..........................................................................................................................................................19
Figure 9. Share of expenses of the different processes carried out for the refurbishment operation. .............20 Figure 10. Sensitivity of income from recycling at varying commodity prices. .................................................21 Figure 11. Sensitivity of income from recycling at varying (W)EEE composition. ............................................22 Figure 12. Sensitivity of income from recycling at different CRT / LCD shares. ..............................................24 Figure 13. Sensitivity of income from recycling for different dismantling depths. ............................................25 Figure 14. Sensitivity of income from recycling at different purchase prices. ..................................................26 Figure 15. Sensitivity of income from recycling for worker’s wage. The percentages applied refer to the
wages used in the baseline scenario (see Table 14). ......................................................................27 Figure 16. Sensitivity of income from refurbishment at different shares of collected (W)EEE which is apt for
refurbishment. ...................................................................................................................................29 Figure 17. Sensitivity of the income from refurbishment at different sales prices. ...........................................31
List of Tables
Table 1. (W)EEE composition in the baseline scenario (based on numbers from Morocco, see GIZ (2010) and assumptions, see appendix 0). .................................................................................................... 8
Table 2. Purchase prices of (W)EEE devices from informal sector (IS) and from companies and authorities (B2B) according to the baseline scenario (source: field survey by CPC Tanzania). .......................... 8
Table 3. Downstream processing for each fraction. ........................................................................................... 9 Table 4. Average commodity prices for 2010. ..................................................................................................11 Table 5. Transportation costs. ..........................................................................................................................12 Table 6. End-processing costs for different fractions. ......................................................................................13 Table 7. Calculated shares in total revenue and purchase prices according to the scheme described in
chapter 2.1.4. The last column “mix” represents a weighted mean of the values of all appliances (weighted according to the appliance composition in the baseline scenario). ..................................16
Table 8. Revenue share per fraction for each appliance. ................................................................................18 Table 9. Required throughput to achieve minimal lot sizes. .............................................................................18 Table 10. Contribution of each appliance to the revenue of refurbishment in the baseline scenario. The
shares of each appliance do not change with varying amounts of (W)EEE that are refurbished. The respective sales prices of each appliance are also indicated. ..........................................................20
Table 11. Revenue generated by commercialization of downstream processing fractions at different commodity prices in relation to the average commodity prices 2010. The prices are an average over a certain period, except in the scenario 06.07.2011, which is assumed to represent the current all-time high prices. ...........................................................................................................................21

Economic Feasibility Study for e-Waste Recycling in Tanzania
40
Table 12. (W)EEE composition for the different scenarios (by weight). .......................................................... 22 Table 13. (W)EEE composition of the different scenarios for the CRT - LCD share of PCs. .......................... 23 Table 14. Purchase prices applied in the different scenarios. It is important to note that the prices given refer
to mixed (W)EEE-material consisting of obsolete appliance for recycling (WEEE) and appliances that are still apt for refurbishment (EEE). The prices are indicated in USD/kg; 100% is the baseline scenario. ........................................................................................................................................... 26
Table 15. Wages for manual labor in the different scenarios. ......................................................................... 27 Table 16. Share of collected (W)EEE which is apt for refurbishment per device and scenario. ..................... 28 Table 17. Average sales prices of refurbished devices in USD/unit. .............................................................. 30 Table 18. Collected economic data. ................................................................................................................... I Table 19. Material composition of the devices used for the model. ................................................................. IV Table 20. Revenue factors for each fraction supplied to the downstream processing ...................................... 6 Table 21. Results of each calculation step for the determination of the revenue share. .................................. 7

Economic Feasibilty Study for e-Waste Recycling in Tanzania
I
Appendix
Collected economic data
Table 18. Collected economic data.
N° Description (material, service, etc.) Costs Units Source Comments 1 Copper, local market 6’000
4 TZS/kg USD/kg
CPCT Source: Field survey in DSM, Arusha, Moshi and Zanzibar
2 Aluminum, local market 2’000 1.33
TZS/kg USD/kg
CPCT Source: Field survey in DSM, Arusha, Moshi and Zanzibar
4 Iron, local market Price - 50% (LME)
TZS/kg USD/kg
CPCT Source: Field survey in DSM, Arusha, Moshi and Zanzibar
Brass, local market 3’000 2
TZS/kg USD/kg
CPCT Source: Field survey in DSM, Arusha, Moshi and Zanzibar
Cables => copper price x 0.38 - - in average, ca. 38% of a cable are copper
Landfill service for shops, monthly plan 2’000 1.33
TZS/month USD/month
CPCT Disposal fee at the Municipal dumpsite is currently TZS 1,500 per ton for normal garbage and 20,000 - 80,000 per ton for hospital waste or wastes to be destructed by order of the Fair Competition Commission. Source: Landfill Manager, DSM City Landfill
5 Shipping 6m-container from Dar es Salaam to Barcelona, Spain
2’174 USD/Container globalshippingcosts.com
Shipping 6m-container from Dar es Salaam to Sevilla, Spain
2’254 USD/Container globalshippingcosts.com
6 Shipping 6m-container from Dar es Salaam to Antwerp, Belgium
2’410 USD/Container globalshippingcosts.com
7 Shipping 6m-container from Dar es Salaam to Hamburg/Germany
2’407 USD/Container globalshippingcosts.com
8 Shipping 6m-container from Dar es Salaam to Chennai/India
1’673 USD/Container globalshippingcosts.com

Economic Feasibility Study for e-Waste Recycling in Tanzania
II
N° Description (material, service, etc.) Costs Units Source Comments Transport by lorry/train from Hamburg to Griag 631 USD/Container Zippel (Lorry/Train)
9 Shipping 6m-container from Dar es Salaam to Guangzhou/China
1’988 USD/Container globalshippingcosts.com
15 General transport prices for intercity transport 1’000 0.7
TZS/(km*ton) USD/(km*ton)
CPCT General transport cost per ton of normal goods from Arusha to DSM (about 460km) is negotiable, it ranges from TZS 450,000 to 500,000. Therefore the average transport cost per ton per km is about TZS 1,033 Source: Mwembeni Group
16 General transport price for urban collection 3’000 2
TZS/(km*ton) USD/(km*ton)
CPCT Average transport cost in urban areas per ton per km. For example, average transport cost paid by scavengers from Mwenge to Kariakoo (about 14km) using a 1 ton pick-up is TZS 40,000 (USD 27); (Source: Mwembeni Group, Kariakoo, DSM)
18 Official minimal wage 135’000 90
TZS/month USD/month
CPCT Official minimal wage
19 Reasonable wage for dismantler 250’000 167
TZS/month USD/month
CPCT Estimated figure
20 Wage facility administrator 1’500’000 1’000
TZS/month USD/month
CPCT Estimated figure
21 Wage secretary 500’000 333
TZS/month USD/month
CPCT Estimated figure
22 Wage CEO 3’500’000 2’333
TZS/month USD/month
CPCT Estimated figure
28 Purchase price for e-waste from scavengers 15’000 10
TZS/unit USD/unit
CPCT Average price paid by scavengers for 1 unit of obsolete computer ranges from TZS 10,000 - 20,000. Source: Mwembeni Group
29 Purchase price for e-waste at tender offers 17’500 12.5
TZS/unit USD/unit
CPCT During auctioning of government or company assests scavengers normally pay entrance fee of TZS 5000 to 10000 depending on the auctioneer. Obsolete

Economic Feasibilty Study for e-Waste Recycling in Tanzania
III
N° Description (material, service, etc.) Costs Units Source Comments computers are auctioned at an average of TZS 15000 to 20,000. Source: Mwembeni Group.
32 Rent of factory work room 1’200 0.8
MAD/m2 CPCT Current rent per sq meter being charged by SIDO at Vingunguti Industrial Estate - Source: Tenant at Vingunguti
40 Sales price for a refurbished PC 150’000 100
TZS/unit USD/unit
CPCT Source: Mwembeni Group
41 Sales price for a refurbished laptop 300’000 200
TZS/unit USD/unit
CPCT Source: Mwembeni Group
42 Sales price for a refurbished printer 20’000 13
TZS/unit USD/unit
CPCT Source: Mwembeni Group
43 Sales price for a refurbished TV 50’000 33
TZS/unit USD/unit
CPCT Source: Mwembeni Group
45 Plastic export to China (all types - with and without FR), to MBA Guangzhou
0 TZS/t MBA (Chris Sluik) The price strongly depends on the quality and type of plastic; as far as composition unknown, set costs to 0. (=> send a sample container to MBA China to fix the price)
46 CRT-End-Processing GRIAG, Total 47 GRIAG, tube with metal scrap inside 60 €/t Griag For < 100 t/month 48 GRIAG, cullets without metal scrap, without washing 75 €/t Griag For < 100 t/month 49 GRIAG, cullets without metal scrap, with washing less than 75 €/t Griag For < 100 t/month 58 Minimal Lot Size, PWB low-grade, Umicore 10 t Umicore 1 full 20' container 59 Minimal Lot Size, PWB medium-grade, Umicore 7 t Umicore 7t, ultimate minimum lot size 5 t 60 Minimal Lot Size, PWB high-grade, Umicore 5 t Umicore Very high grade (mobile phones): 2t 61 Transport Port Antwerpen => Umicore 0 $ Umicore Steven Art: "on behalf of Umicore" 62 NiMH- and Li-Ion Batterys, Umicore see price grid Umicore 63 Hg-Lamps, Recilec, Sevilla, Spain 800-850 €/t Recilec Remove as many parts as possible
(sockets, etc.) in order to reduce costs 64 CRT monitor, Recilec, Sevilla, Spain 250 €/t Recilec They accept whole monitors, too

Economic Feasibility Study for e-Waste Recycling in Tanzania
IV
Used Material Composition of the Devices
Table 19. Material composition of the devices used for the model.
Fraction PC/Server CRT
monitor LCD
monitor Laptop Printer Mobile
Phones CRT TV LCD TV Audio Video Copper
0.03% 7.00% 0.65% 1.50% 3.50%
3.00% 0.75% 3.00% 3.00%
Aluminum
4.92% 2.00% 3.10% 3.70% 0.30% 2.00%
3.50% 0.80% 1.50%
Iron
75.06% 10.00% 35.25% 29.80% 36.20% 8.00% 12.00% 39.75% 36.00% 60.00%
Brass 0.02%
PWB high grade
8.50%
35.00%
11.00%
PWB medium grade 8.57%
6.50% 10.00%
PWB low grade 1.31% 8.00% 7.00% 10.50% 15.00%
Glass (e.g. LCD)
11.00%
CRT glass
60.00%
52.00%
Plastics
5.80% 13.00% 18.50% 14.50% 46.00% 44.00% 23.00% 18.50% 43.00% 17.00% Cables
2.75%
2.50% 1.00% 3.00%
1.50%
Residue (= waste) 1.54% 0.00% 31.50% 43.00% 1.00% 0.00% 3.00% 25.00% 6.70% 3.50% Toner
1.00%
LCD module
28.50% 19.50%
21.00% Battery
0.02%
19.50%
Transformers
3.00% Motor
0.50%
Capacitor
0.51% Metal-plastic mix 0.51%
Waste
3.00% 4.00%
4.00% 6.70% 3.50% Total 100.00% 100.00% 100.00% 100.00% 100.00% 100.00% 100.00% 100.00% 100.00% 100.00% Indicated weight [kg] 9.9 14.1 4.3 3.5 6.5 0.1 31.6 15 5 4.2
Source: [Own data]
(Laffely 2007)
[Own data] [Own data]
(Laffely 2007) [Own data]
Zhu, J Bejing [Own data]
Oguchi, 2010/ [Own
data]
Oguchi, 2010/ [Own
data]
[Own data]: Data from Empa/Swico-Recycling

Economic Feasibilty Study for e-Waste Recycling in Tanzania
V

Economic Feasibility Study for e-Waste Recycling in Tanzania
6
Assumptions for (W)EEE Composition
Generally, the appliance (W)EEE which is applied in the model is based on data from GIZ (2010). Further assumptions are:
LCD-share (TVs & PCs) 20% of total monitors, by units (baseline scenario)
Printer share 50% of total PCs & laptops, by units (baseline scenario)
Revenue Factor per Fraction
Table 20. Revenue factors for each fraction supplied to the downstream processing
Fraction RF, applied Copper 1 Aluminium 1 Iron 1 Brass 1 Other metals 1 PWB high grade 1 PWB medium grade 1 PWB low grade 1 Glass (e.g. LCD) 0.75 CRT glass 0.75
0.66 0.75 0.34 0.75
Plastics 0.75 0.5 0.75 0.5 0.75
Cables 1 Residue (= waste) 0.75 Toner 0.75 Hg Lamp 0.75 LCD module 0.75 Battery 0.75 Slide-in module 0.75 Transformadores 0.75 Motor 0.75 Capacitor 0.75 Metal-plastic mix 0.75 Waste 0.75 Contaminants 0.75

Economic Feasibilty Study for e-Waste Recycling in Tanzania
7
Calculation of Revenue Share and Purchase Price
Table 21. Results of each calculation step for the determination of the revenue share.
APPLIANCES FROM B2B COLLECTION
unit PC-
CRT PC-
LCD Lapto
p Print
er CRT
TV LCD
TV Mix WEEE-Comp, share by device
38.6% 5.7% 1.1% 7.6% 42.0% 5.0%
Purchase price B2B mix $/t 530 530 3'339 514 211 445 Recycling: revenue/ton $/t 727 1'035 747 1'012 356 1'523 650
Refurbishment: revenue/ton $/t 4'173 7'054 57'236 2'055 1'057 2'226 3'354
B2B: share of (W)EEE to refurbishment % 40.0% 40.0% 40.0% 40.0% 25.0% 25.0%
B2B: Recycling - revenue per mixed ton $/600kg 436 621 448 607 267 1'142
B2B: Refurbishment - revenue permixed ton $/400kg 1'669.37 2'821 22'894 822 264 556
B2B: Total revenue per mixed ton $/t 2'106 3'442 23'342 1'429 531 1'699 B2B: revenue share by recycling % 21% 18% 2% 42% 50% 67% 37%
B2B: revenue share by refurbishment % 79% 82% 98% 58% 50% 33% 63%
B2B: Purchase price Recycling $/600kg 110 96 64 218 106 299 B2B: Purchase price Refurbishment $/400kg 420 435 3'275 295 105 146 B2B: purchase price for recycling $/t 180 160 110 360 140 400 190
B2B: purchase price for refurbishment $/t 1'050 1'090 8'190 740 420 580 820
APPLIANCES FROM THE INFORMAL SECTOR
unit
PC-CRT
PC-LCD
Laptop
Printer
CRT TV
LCD TV Mix
Purchase price from IS mix $/t 454 454 2'862 514 211 445 Recycling: revenue/ton $/t 727 1'035 747 1'012 356 1'523 Refurbishment: revenue/ton $/t 4'173 7'054 57'236 2'055 1'057 2'226 IS: share of (W)EEE to refurbishment % 25.0% 25.0% 25.0% 25.0% 25.0% 25.0% IS: Recycling - revenue/ton $/750kg 545 776 560 759 267 1'142 IS: Refurbishment - revenue/ton $/250kg 1'043 1'763 14'309 514 264 556 IS: Total revenue/ton mix $/t 1'589 2'540 14'869 1'272 531 1'699 IS: revenue share by recycling % 34% 31% 4% 60% 50% 67% 44%
IS: revenue share by refurbishment % 66% 69% 96% 40% 50% 33% 56%
IS: Purchase price Recycling $/750kg 156 139 108 306 106 299 IS: Purchase price Refurbishment $/250kg 298 316 2'754 207 105 146 IS: purchase price for recycling $/t 210 190 140 410 140 400 200
IS: purchase price for refurbishment $/t 1'190 1'260 11'020 830 420 580 920