hadoop integration benchmark - talend · pdf filehadoop integration benchmark ... talend and...
TRANSCRIPT

Hadoop Integration Benchmark
Product Profile and Evaluation: Talend and Informatica
By William McKnight and Jake Dolezal October 2015
Sponsored by

MCG Global Services Hadoop Integration Benchmark
© MCG Global Services 2015 www.mcknightcg.com Page 2
Executive Summary
Hadoop has become increasingly prevalent over the past decade on the information management landscape by empowering digital strategies with large scale possibilities. While Hadoop helps data-driven (or those who desire to be) organizations overcome obstacles of storage and processing scale and cost in dealing with ever-increasing volumes of data, it does not (in and of itself) solve the challenge of high performance data integration—an activity that consumes an estimated 80% or more of time in getting actionable insights from big data. Modern data integration tools were built in a world abound with structured data, relational databases, and data warehouses. The big data and Hadoop paradigm shift has changed and disrupted some of the ways we derive business value from data. Unfortunately, the data integration tool landscape has lagged behind in this shift. Early adopters of big data for their enterprise architecture have only recently found some variety and choices in data integration tools and capabilities to accompany their increased data storage capabilities. Hadoop has evolved greatly since its early days of merely batch-processing large volumes of data in an affordable and scalable way. Numerous approaches and tools have arisen to elevate Hadoop’s capabilities and potential use-cases. One of the more exciting new tools is Spark—a multi-stage, in-memory processing engine that offers high-performance and much faster speeds than its disk-based predecessors. Even while reaching out to grasp all these exciting capabilities, companies still have their feet firmly planted in the old paradigm of relational, structured, OLTP systems that run their day-in-day-out business. That world is and will be around for a long time. The key then is to marry capabilities and bring these two worlds together. Data integration is that key—to bring the transactional and master data from traditional SQL-based, relational databases and the big data from a vast array and variety of sources together. Many data integration vendors have recognized this key and have stepped up to the plate by introducing big data and Hadoop capabilities to their toolsets. The idea is to give data integration specialists the ability to harness these tools just like they would the traditional sources and transformations they are used to. With many vendors throwing their hat in the big data arena, it will be increasingly challenging to identify and select the right/best tool. The key differentiators to watch will be the depth by which a tool leverages Hadoop and the performance of integration jobs. As volumes of data to be integrated expand, so too will the processing times of integration jobs. This could spell the difference for a “just-in-time” answer to a business question and a “too-little-too-late” result.
MCG Global Services Hadoop Integration Benchmark
© MCG Global Services 2015 www.mcknightcg.com Page 3
The benchmark presented here focuses on these two differentiators. The vendors chosen for this benchmark are Talend and Informatica. The benchmark was designed to simulate a set of basic scenarios to answer some fundamental business questions that an organization from nearly any industry sector might encounter and ask, as opposed to some niche scenario or an “academic exercise” use case. In doing so, we hoped to identify, not only performance, but utility as well. The results of the benchmark show Spark to be the real winner—evidenced by the nearly 8x performance advantage in largest scale scenario. Based on the trends, we also anticipate the gap to widen even further with larger datasets and larger cluster environments. In addition, the benchmark also reveals the advantage of leveraging Spark directly through the integration tool, as opposed to attempting to through another medium (Hive, in this case), which proved to be futile due to lack of supportability by even enterprise distributions of Hadoop.

MCG Global Services Hadoop Integration Benchmark
© MCG Global Services 2015 www.mcknightcg.com Page 4
About the Authors
William is President of McKnight Consulting Group Global Services (www.mcknightcg.com). He is an internationally recognized authority in information management. His consulting work has included many of the Global 2000 and numerous midmarket companies. His teams have won several best practice competitions for their implementations and many of his clients have gone public with their success stories. His strategies form the information management plan for leading companies in various industries. William is author of the book “Information Management: Strategies for Gaining a Competitive Advantage with Data”. William is a very popular speaker worldwide and a prolific writer with hundreds of articles and white papers published. William is a distinguished entrepreneur, and a former Fortune 50 technology executive and software engineer. He provides clients with strategies, architectures, platform and tool selection, and complete programs to manage information.
Jake Dolezal has over 16 years experience in the Information Management field with expertise in business intelligence, analytics, data warehousing, statistics, data modeling and integration, data visualization, master data management, and data quality. Jake has experience across a broad array of industries, including: healthcare, education, government, manufacturing, engineering, hospitality and gaming. Jake earned his Doctorate in Information Management from Syracuse University—consistently the #1 ranked graduate school for information systems by U.S. News and World Report. He is also a Certified Business Intelligence Professional through TDWI with an emphasis in Data Analysis. In addition, he is a certified leadership coach and has helped clients accelerate their careers and earn several executive promotions. Jake is Practice Lead at McKnight Consulting Group Global Services.

MCG Global Services Hadoop Integration Benchmark
© MCG Global Services 2015 www.mcknightcg.com Page 5
About MCG Global Services
With a client list that is the “A list” of complex, politically sustainable and successful information management, MCG has broad information management market touchpoints. Our advice is an infusion of the latest best practices culled from recent, personal experience. It is practical, not theoretical. We anticipate our customer’s needs well into the future with our full lifecycle approach. Our focused, experienced teams generate efficient, economic, timely and politically sustainable results for our clients.
We take a keen focus on business justification. We take a program, not a project, approach. We believe in a model of blending with client staff and we take a focus on knowledge
transfer. We engineer client workforces and processes to carry forward. We’re vendor neutral so you can rest assured that our advice is completely client oriented. We know, define, judge and promote best practices. We have encountered and overcome most conceivable information management challenges. We ensure business results are delivered early and often.
MCG services span strategy, implementation and training for turning information into the asset it needs to be for your organization. We strategize, design and deploy in the disciplines of Master Data Management, Big Data, Data Warehousing, Analytic Databases and Business Intelligence.
Hadoop and Data Integration
This benchmark is part of research into the performance of loads on Hadoop clusters - an increasingly important platform for storing the data powering digital strategies. Hadoop usage has evolved since the early days when the technology was invented to make batch-processing big data affordable and scalable. Today, with a lively community of open-source contributors and vendors innovating a plethora of tools that natively support Hadoop components, usage and data is expanding. Data Lakes embody the idea of all data stored natively in Hadoop. Traditionally data preparation has consumed an estimated 80% of analytic development efforts. One of the most common uses of Hadoop is to drive this analytic overhead down. Data preparation can be accomplished through a traditional ETL process: extracting data from sources, transforming it (cleansing, normalizing, integrating) to meet requirements of the data warehouse or downstream

MCG Global Services Hadoop Integration Benchmark
© MCG Global Services 2015 www.mcknightcg.com Page 6
repositories and apps, and loading it into those destinations. As in the relational database world, many organizations prefer ELT processes, where higher performance is achieved by performing transformations after loading. Instead of burdening the data warehouse with this processing, however, you do transforms in Hadoop. This yields high-performance, fault-tolerant, elastic processing without detracting from query speeds. In Hadoop environments, you also need massive processing power because transformations often involve integrating very different types of data from a multitude of sources. Your analyses might encompass data from ERP and CRM systems, in-memory analytic environments, and internal and external apps via APIs. You might want to blend and distill data from customer master files with clickstream data stored in clouds and social media data from your own NoSQL databases or accessed from third-party aggregation services. You might want to examine vast quantities of historical transactional data along with data streaming in real time from consumer transactions or machines, sensors, and chips. Hadoop can encompass all of this structured, unstructured, semi-structured, and multi-structured data because it allows schema-less storage and processing. When bringing data into Hadoop, there’s no need to declare a data model or make associations with target applications. Instead loose-binding is used to apply or discover a data schema after transformation, when the data is written to the target production application or specialized downstream analytic repository. This separation of data integration processes from the run-time engine makes it possible to:
Share and reuse transforms across data integration projects
View data in different ways and expose new data elements by applying different schema
Enhance data sets by adding new dimensions as new information becomes available or additional questions emerge
There are innumerable sources of big data and more springing up all the time. Since being limited by low-performing open source Sqoop, Flume, command line HDFS and Hive in the early days, numerous approaches and tools have arisen to meet the Hadoop data integration challenge. While much has been studied on querying the data in Hadoop, the same cannot be said for getting the data into Hadoop clusters. Many enterprises are brining the features and functions they are used to in the relational world into the Hadoop world, as well as the non-functional requirements, developer productivity, metadata management, documentation and business rules management you get from a modern data integration tool. Vendors benchmarked for this report are Talend and Informatica.

MCG Global Services Hadoop Integration Benchmark
© MCG Global Services 2015 www.mcknightcg.com Page 7
Talend Product Profile
Company Profile
Product Name Talend Big Data Integration
Initial Launch 2012
Current Release and Date
Version 6.0, shipped September 2015
Key Features
Native support for Apache Spark and Spark Streaming leveraging over 100 Spark components, one click conversion of MapReduce jobs to Spark, support for Continuous Delivery, Master Data Management (MDM) REST API and Query Language Support, Data Masking and Semantic Analytics
Hadoop DI Competitors Informatica, Pentaho, Syncsort
Company Founded 2006
Focus Highly scalable integration solutions addressing Big Data, Application Integration, Data Integration, Data Quality, MDM, BPM
Employees 500
Headquarters Redwood City, CA
Ownership Private

MCG Global Services Hadoop Integration Benchmark
© MCG Global Services 2015 www.mcknightcg.com Page 8
Informatica Product Profile
Company Profile
Product Name Informatica Big Data Edition
Initial Launch 2012
Current Release and Date Version 9.6.1, shipped 2015
Key Features All functions on Hadoop, Universal Data Access, High-Speed Data Ingestion and Extraction, Real-Time Data Collection and Streaming, Data Discovery on Hadoop, Natural Language Processing on Hadoop, Attunity Replicate fully embedded; additional GUI improvements; more target platforms
Hadoop DI Competitors Talend, Pentaho, Syncsort, Tervela
Founded 1998
Focus World’s number one independent provider of data integration software.
Employees 5,500+
Headquarters Redwood City, CA
Ownership Private (previously public)

MCG Global Services Hadoop Integration Benchmark
© MCG Global Services 2015 www.mcknightcg.com Page 9
Benchmark Overview
The intent of the benchmark’s design was to simulate a set of basic scenarios to answer some fundamental business questions that an organization from nearly any industry sector might encounter and ask. These common business questions formulated for the benchmark are as follows:
What impact does customers’ views of pages and products on our website have on sales? How many page views before they make a purchase decision (whether online or in-store)?
How do our coupon promotional campaigns impact our product sales or service utilization? Do our customers who view or receive our coupon promotion come to our website and buy more or additional products they might not otherwise without the coupon?
How much does our recommendation engine influence or drive product sales? Do customers tend to buy additional products based on these recommendations?
Our experience working with clients from many industry sectors over the past decade tells us these are not niche use-cases, but common everyday business questions shared by many companies. The benchmark was designed to demonstrate how a company might approach answering these business questions by bringing different sources of information into play. We also have taken the opportunity to show how Hadoop can be leveraged, because some of the data of interest in this analytical case is likely of a large volume and non-relational or semi- to un-structured in nature. In these cases, using Hadoop would likely be our best course of action we would recommend to a client seeking to answer these questions. The benchmark was also setup as a data integration benchmark, because it is also highly probably that the data required resides in different source. Some of these sources are also probably not being consumed and aggregated into an enterprise data warehouse—due to the high volume and difficulty in integrating voluminous amounts of semi-structured data into a traditional data warehouse. Thus, the benchmark was designed to mimic a common scenario and the challenges faced by organization seeking to integrate data to address these and similar business questions.

MCG Global Services Hadoop Integration Benchmark
© MCG Global Services 2015 www.mcknightcg.com Page 10
Benchmark Setup
The benchmark was executed using the following setup, environment, standards, and configurations.
Server Environment
Figure 1: Server Environment and Setup
Feature Selection
Hadoop Distribution Cloudera CDH 5.4.7
EC2 Instance Memory optimized r3.xlarge (4 vCPUs, 30.5 GB Memory, 200 GB Storage)
OS Ubuntu LTS 14.04 (Trusty Tahr)
Source Data Types Text-based log files and a relational database
Data Volume 20GB (Log files) and 12,000,000 rows (RDBMS)
TPC-H Scale Factor 0.125x – 2x
RDBMS MySQL 5.6
Java Version 1.6.0_87

MCG Global Services Hadoop Integration Benchmark
© MCG Global Services 2015 www.mcknightcg.com Page 11
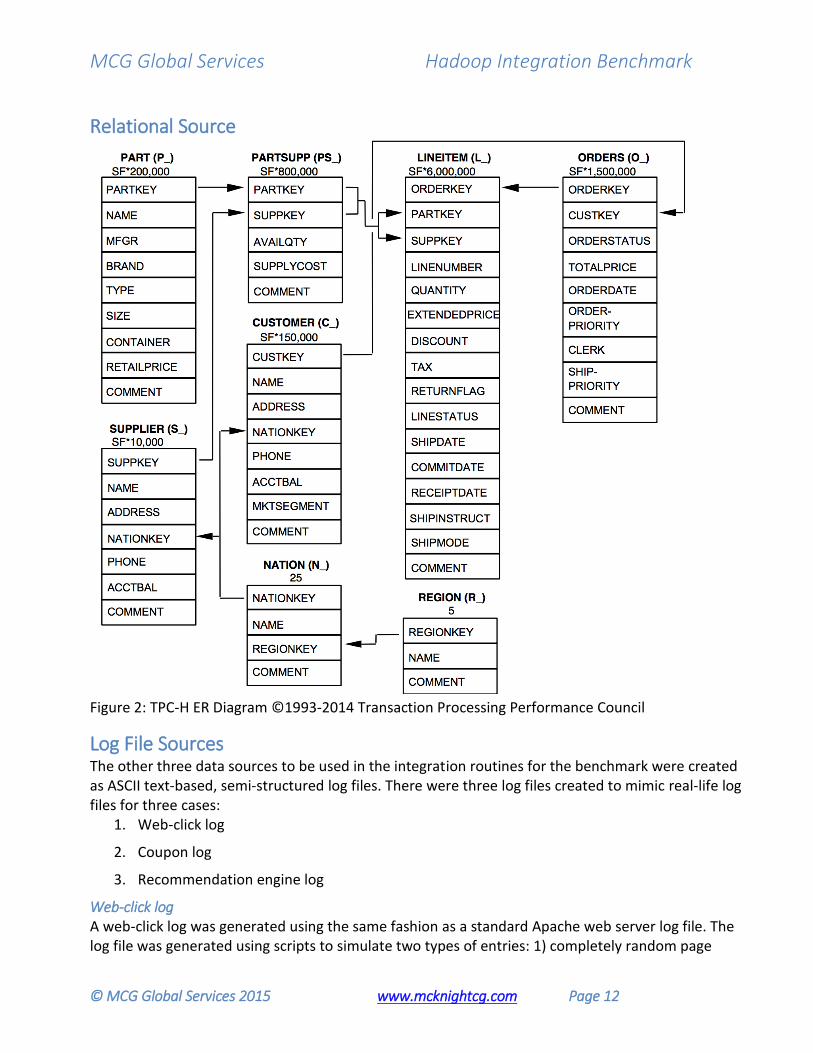
The benchmark was setup using Amazon Web Services (AWS) EC2 Instances deployed into an AWS Virtual Private Cloud (VPC) within the same Placement Group. According to Amazon, all instances launched within a Placement Group have low latency, full bisection, 10 Gigabits per second bandwidth between instances. The first EC2 instance was a memory-optimized r3.xlarge with four vCPUs and 30.5 GB of RAM. A storage volume of 200 GB was attached and mounted on the instance. This Linux instance was running Ubuntu LTS 14.04 (nicknamed Trusty Tahr). On this instance, we deployed Cloudera CDH 5.4.7 as our Hadoop distribution along with MySQL 5.6 to serve as a source relational database. The second EC2 instance was an r3.xlarge machine running Windows Server 2012. The Windows instance was installed with the Talend Studio and Informatica Big Data Edition (BDE) developer suites. NOTE: In order to run Informatica BDE, a third EC2 instance was used to run the domain and repository services required for Informatica. It was a RedHat Linux machine and only was used to serve as the Informatica repository service. It was not involved in processing of data or execution of the benchmark. The relational source for the benchmark (stored in MySQL 5.6 on the Linux instance) was constructed using the Transaction Processing Performance Council TPC Benchmark H (TPC-H) Revision 2.17.1 Standard Specification. The TPC-H database was constructed to mimic a real-life point-of-sale system according to the entity-relationship diagram and the data type and scale specifications provided by the TPC-H. The database was populated by scripts that were seeded with random numbers to create the mock dataset. The TPC-H specifications have a scale factor by which the record count for each table is derived. For this benchmark, we selected a maximum scale factor of 2. In this case, the TPC-H database contained 3 million records in the ORDERS table and 12 million records in the LINEITEM table.
MCG Global Services Hadoop Integration Benchmark
© MCG Global Services 2015 www.mcknightcg.com Page 12
Relational Source
Figure 2: TPC-H ER Diagram ©1993-2014 Transaction Processing Performance Council
Log File Sources The other three data sources to be used in the integration routines for the benchmark were created as ASCII text-based, semi-structured log files. There were three log files created to mimic real-life log files for three cases:
1. Web-click log
2. Coupon log
3. Recommendation engine log
Web-click log A web-click log was generated using the same fashion as a standard Apache web server log file. The log file was generated using scripts to simulate two types of entries: 1) completely random page

MCG Global Services Hadoop Integration Benchmark
© MCG Global Services 2015 www.mcknightcg.com Page 13
views (seeded by random numbers) and 2) web-clicks that correspond to actual page views of ordered products (seeded by random records in the TPC-H ORDERS and LINEITEMS tables). The “dummy” or “noise” web log entries appeared in a variety of possibilities but following a similar format consistent with an Apache web-click log entry. All data were randomly selected. The dates were restricted to the year 2015. For example: 249.225.125.203 - anonymous [01/Jan/2015:16:02:10 -0700] "GET /images/footer-basement.png HTTP/1.0" 200 2326 "http://www.acmecompany.com/index.php" "Windows NT 6.0"
The “signal” web log entries that corresponded to (and were seeded with) actual ORDERS and LINEITEM records had the same randomness as the “dummy” entries. Except actual LINEITEM.L_PARTKEY values and corresponding ORDERS.O_ORDERDATE values from the TPC-H database were selected to create records to represent a page view of an actual ordered item on the same day as the order. The highlighted segments represent those that potentially correspond to actual orders: 154.3.64.53 - anonymous [02/Jan/2015:06:03:09 -0700] "GET /images/side-ad.png HTTP/1.0" 200 2326 "http://www.acmecompany.com/product-search.php?partkey=Q44271" "Android 4.1.2"
The web-click log file contained 26,009,338 entries and was 5.1 GB in size. There was one web-click entry for a random LINEITEM record for each and every ORDERS record (3,000,000 total). Therefore, 12% of the web-click log entries corresponded to orders. The rest of the entries were random. Coupon log A coupon log was generated using the same fashion as a customized Apache web server log file. The coupon log was designed to mimic a special case log file generated whenever a potential customer viewed an item because of a click-through from a coupon ad campaign. Again, the log file was generated using scripts to simulate two types of entries: 1) completely random page views (seeded by random numbers) and 2) page views that correspond to actual page views of ordered products by actual customers via the coupon ad campaign (seeded by random records in the TPC-H ORDERS, LINEITEMS, and CUSTOMERS tables). The “dummy” or “noise” coupon log entry data were randomly selected. The dates were restricted to the year 2015. The “signal” coupon log entries that corresponded to (and were seeded with) actual ORDERS and LINEITEM records had the same randomness as the “dummy” entries. Except actual LINEITEM.L_PARTKEY values and corresponding ORDERS.O_ORDERDATE values from the TPC-H database were selected to create records to represent a page view of an actual ordered item on the same day as the order. The highlighted segments represent those that potentially correspond to actual orders: 49.243.50.31 - anonymous [01/Jan/2015:18:28:14 -0700] "GET /images/header-logo.png HTTP/1.0" 200 75422 "http://www.acmecompany.com/product-view.php?partkey=S22211" "https://www.coupontracker.com/campaignlog.php?couponid=LATEWINTER2015&customerid=C019713&trackingsnippet=LDGU-EOEF-LONX-WRTQ" "Windows Phone OS 7.5"

MCG Global Services Hadoop Integration Benchmark
© MCG Global Services 2015 www.mcknightcg.com Page 14
The coupon log file contained 20,567,665 entries and was 6.6 GB in size. There was one web-click entry for a random LINEITEM record for each and every ORDERS record (3,000,000 total). Therefore, 15% of the coupon log entries corresponded to orders. The rest of the entries were random. Recommendation log A recommendation engine log was generated as an XML tagged output log file. The recommendation log was designed to mimic whenever a potential customer viewed an item because of a click-through from a recommended item on the current item page. In this case, the company’s website recommended 5 additional or related items for every item viewed. Again, the log file was generated using scripts to simulate two types of entries: 1) “dummy” or completely random page views and random recommendations (seeded by random numbers) and 2) page views that correspond to actual page views of ordered products via the recommendations (seeded by random records in the TPC-H ORDERS and LINEITEMS tables). The “dummy” or “noise” recommendation log entry data were randomly selected. The dates were restricted to the year 2015. The “signal” recommendation log entries that corresponded to (and were seeded with) actual ORDERS and LINEITEM records had the same randomness as the “dummy” entries. Except actual LINEITEM.L_PARTKEY values and corresponding ORDERS.O_ORDERDATE values from the TPC-H database were selected to create records to represent a page view of an actual ordered item on the same day as the order. The highlighted segments represent those that potentially correspond to actual orders: <itemview>
<cartid>326586002341098</cartid> <timestamp>01/01/2015:16:53:07</timestamp> <itemid>Q48769</itemid> <referreditems>
<referreditem1> <referreditemid1>R33870</referreditemid1> </referreditem1> <referreditem2> <referreditemid2>P19289</referreditemid2> </referreditem2> <referreditem3> <referreditemid3>R28666</referreditemid3> </referreditem3> <referreditem4> <referreditemid4>P72469</referreditemid4> </referreditem4> <referreditem5> <referreditemid5>S23533</referreditemid5> </referreditem5>
</referreditems> <sessionid>CGYB-KWEH-YXQO-XXUG</sessionid> </itemview>
The recommendation log file contained 13,168,336 entries and was 8.3 GB in size. There was one web-click entry for a random LINEITEM record for each and every ORDERS record (3,000,000 total). Therefore, 23% of the recommendation log entries corresponded to orders. The rest of the entries were random.

MCG Global Services Hadoop Integration Benchmark
© MCG Global Services 2015 www.mcknightcg.com Page 15
Scale Factor Each of the data sources described above were also scaled to different scale factors, so the integration routines (described in the next section) could be executed against data sources of various sizes. The TPC-H database and log files were scaled in the following manner:
Scale Factor 2.0 1.0 0.5 0.25 0.125
LINEITEM records 12,000,000 6,000,000 3,000,000 1,500,000 750,000
ORDERS records 3,000,000 1,500,000 750,000 375,000 187,500
CUSTOMERS records 300,000 150,000 75,000 37,500 18,750
Log Size Total 20 GB 10 GB 5 GB 2.5 GB 1.25 GB
Web-click Log Size 5.1 GB 2.6 GB 1.3 GB 638 MB 319 MB
Web-click Log Entries 26,009,338 13,004,669 6,502,335 3,251,167 1,625,584
Coupon Log Size 6.6 GB 3.3 GB 1.7 GB 825 MB 413 MB
Coupon Log Entries 20,567,665 10,283,833 5,141,916 2,570,958 1,285,479
Recommendation Log Size
8.3 GB 4.2 GB 2.1 GB 1.0 GB 519 MB
Recommendation Log Entries
13,168,336 6,584,168 3,292,084 1,646,042 823,021
Table 1: TPC-H Database Record Counts and Log Files at Different Scale Factors
Integration Routines The big data use case of the benchmark was designed to demonstrate real-life scenarios where companies desire to integrate data from their transactional systems with unstructured and semi-structured big data. The benchmark demonstrates this by executing routines that integrate the TPC-H relational source data with the individual log files described above. The following integration routines were created for the benchmark. In both cases, best practices were observed to optimize the performance of each job. For example, there were no data type conversions, dates were treated as strings, and the sizes of data types were minimized. Informatica Workflow The following diagram represents the workflow that was created in Informatica Developer.

MCG Global Services Hadoop Integration Benchmark
© MCG Global Services 2015 www.mcknightcg.com Page 16
Figure 3: Overview of Informatica Workflow Informatica Big Data Edition offers two ways of interacting with Hadoop: via Hive or directly to the Hadoop File System (HDFS). The first part was the extraction of the MySQL data using the exact same query against MySQL as with the Talend job. This data was stored in Hadoop using Hive. Next, the web, coupon, and recommendation log files were parsed using the same regular expressions as will be used with the Talend jobs and loaded directly into HDFS. The third part consisted of the integration of the TPC-H data with the log files using Informatica’s Lookup transformation. The resulting delimited out files were also stored directly on HDFS. These routines will be described in greater detail in the next section. Note: At the time of the benchmark, Informatica BDE did not have a MySQL connector included in the package we installed. A generic ODBC connector was used instead. This did not seem to have an overall impact on the performance of the integration job.

MCG Global Services Hadoop Integration Benchmark
© MCG Global Services 2015 www.mcknightcg.com Page 17
Talend Job Design The following diagram represents the job design that was created in Talend Studio.
Figure 4: Overview of Talend Job Design Talend Studio 6 offers a new and powerful capability of interacting with Spark on Hadoop in addition to the conventional approach via Hive or directly to Hadoop File System (HDFS). The first part was the extraction of the MySQL data using the following query against MySQL: SELECT L_ORDERKEY, L_PARTKEY, O_CUSTKEY, O_ORDERDATE FROM LINEITEM LEFT OUTER JOIN ORDERS ON L_ORDERKEY = O_ORDERKEY;
This data was stored in Spark. Second, the web, coupon, and recommendation log files were parsed using regular expressions and loaded directly into Spark. The third part consisted of the integration of the TPC-H data with the log files using Talend’s tMap transformation. The resulting delimited files were stored directly on the HDFS. Informatica and Spark We considered and even attempted running the benchmark using Informatica BDE on Spark via Hive. We were able to configure Hive to leverage Spark for execution using the Cloudera CDH administration tools. However, there were significant inconsistencies in execution making this usage instable. According to Cloudera, regarding the use of Hive on Spark there is the following disclaimer:
Important: Hive on Spark is included in CDH 5.4 but is not currently supported or recommended for production use. If you are interested in this feature, try it out in a test environment until we address the issues and limitations needed for production-readiness.

MCG Global Services Hadoop Integration Benchmark
© MCG Global Services 2015 www.mcknightcg.com Page 18
Therefore, this method was deemed unstable and an unsuitable use case at the time of the benchmark.
Benchmark Results
Use Case 1: E-Influence The goal of the first use case for the benchmark was to prepare a data set that correlates products ordered with the page views on the e-commerce website. The integration jobs were written to map the page views to products ordered. The following diagram is a conceptual mapping of the integration. In Informatica, the Lookup transformation was used to link the web-click log with records in the TPC-H database using the field PARTKEY. In Talend, the tMap transformation was used.
Figure 5: E-Influence Mapping Execution Times The following table lists the execution times of the E-Influence (web-click) mapping in seconds. Web-click (Use Case 1) SF 2.0 SF 1.0 SF 0.5 SF 0.25 SF 0.125 Informatica-MapReduce 5,221 1,977 622 308 111 Talend-Spark 579 383 257 148 88 Table 2: E-Influence Mapping Execution Times

MCG Global Services Hadoop Integration Benchmark
© MCG Global Services 2015 www.mcknightcg.com Page 19
Use Case 2: Coupon Influence The objective of the second use case for the benchmark was to prepare a data set that correlates products ordered with a coupon advertisement campaign. The integration jobs were written to map the coupon-ad-related page views and customers to products ordered. The following diagram is a conceptual mapping of the integration. In Informatica, the Lookup transformation was used to link the coupon log with records in the TPC-H database using the field PARTKEY and CUSTKEY. In Talend, the tMap transformation was used.
Figure 6: Coupon Influence Mapping Execution Times The following table lists the execution times of the Coupon Influence mapping in seconds. Coupon (Use Case 2) SF 2.0 SF 1.0 SF 0.5 SF 0.25 SF 0.125 Informatica-MapReduce 8,573 3,197 1,210 693 396 Talend-Spark 882 478 331 202 169 Table 3: Coupon Mapping Execution Times

MCG Global Services Hadoop Integration Benchmark
© MCG Global Services 2015 www.mcknightcg.com Page 20
Use Case 3: Recommendation Influence The intent of the third use-case for the benchmark was to prepare a data set that correlates products ordered with the influence of a recommendation engine. The integration jobs were written to map the recommended products to products ordered. The following diagram is a conceptual mapping of the integration. In Informatica, the Lookup transformation was used to link the coupon log with records in the TPC-H database using the field PARTKEY five times. In Talend, the tMap transformation was used.
Figure 7: Recommendation Influence Mapping Execution Times The following table lists the execution times of the Recommendation Influence mapping in seconds. Recommendation (Use Case 3) SF 2.0 SF 1.0 SF 0.5 SF 0.25 SF 0.125 Informatica-MapReduce 14,973 6,544 2,802 1,272 590 Talend-Spark 1,313 701 473 236 188 Table 4: Recommendation Mapping Execution Times

MCG Global Services Hadoop Integration Benchmark
© MCG Global Services 2015 www.mcknightcg.com Page 21
Results Summary The following tables are the complete result set. All execution times are displayed in seconds (unless otherwise noted.) Scale Factor Summary
SF 2.0 SF 1.0 SF 0.5 SF 0.25 SF 0.125 TPCH Line Item Records 12,000,000 6,000,000 3,000,000 1,500,000 750,000 Log File Size (Total) 20GB 10GB 5GB 2.5GB 1.25GB
+ MapReduce Execution Times Informatica-MapReduce SF 2.0 SF 1.0 SF 0.5 SF 0.25 SF 0.125 Load TPCH (MySQL) into Hadoop 859 711 349 164 95 Load Web Log into Hadoop 388 360 76 43 22 Load Coupon Log into Hadoop 504 404 111 58 32
Load Recommendation Log into Hadoop 578 442 129 65 33
Web-Click (Use Case 1) 5,221 1,977 622 308 111
Coupon (Use Case 2) 8,573 3,197 1,210 693 396
Recommendation (Use Case 3) 14,973 6,544 2,802 1,272 590
TOTAL 31,096 13,635 5,299 2,603 1,279
TOTAL (Minutes) 518.3 227.3 88.3 43.4 21.3
TOTAL (Hours) 8.6 3.8 1.5 0.7 0.4
+ Execution Times Talend-Spark SF 2.0 SF 1.0 SF 0.5 SF 0.25 SF 0.125 Load TPCH (MySQL) into Spark 748 642 302 143 82 Load Web Log into Spark 158 79 33 21 12 Load Coupon Log into Spark 213 123 59 33 17
Load Recommendation Log into Spark 204 117 55 31 16
Web-Click (Use Case 1) 579 383 257 148 88
Coupon (Use Case 2) 882 478 331 202 169
Recommendation (Use Case 3) 1,313 701 473 236 188
TOTAL 4,097 2,523 1,510 814 572
TOTAL (Minutes) 68.3 42.1 25.2 13.6 9.5
TOTAL (Hours) 1.1 0.7 0.4 0.2 0.2
Table 5: Execution Summary

MCG Global Services Hadoop Integration Benchmark
© MCG Global Services 2015 www.mcknightcg.com Page 22
The following chart is a comparison of the total execution times of both the Informatica workflow and Talend jobs to complete all loading, transformations, and file generation. Regression lines were added.
+ SF 0.125 SF 0.25 SF 0.5 SF 1.0 SF 2.0 Times Faster 2.2x 3.2x 3.5x 5.4x 7.6x Figure 8: Comparison of Total Execution Times
Conclusion
Leveraging Spark directly gives a clear advantage in the ability to process increasingly larger datasets. When the size of the datasets was relatively small (i.e., less than 3 million transactional records and 5GB log files), the difference in execution time was negligible, because both tools were able to complete the jobs in less than an hour. However once the scale factor of 0.5 was reached, the difference became impactful. At a scale factor of 2.0, the Informatica job took over 8 hours to complete. Increasing execution times will be frustrating for analysts and data scientists who are eager to conduct their data experiments and advanced analytics, but will be left to wait a day for their target datasets to be integrated. The addition of complexities in the mappings (multiple lookup keys)

MCG Global Services Hadoop Integration Benchmark
© MCG Global Services 2015 www.mcknightcg.com Page 23
seemed to further exacerbate the concern. By using MapReduce, the Lookup transformations digs a large performance hole for itself as the lookup data cache and index cache get overwhelmed. By leveraging the in-memory capabilities of Spark, users can integrate datasets at much faster rates. Spark uses fast Remote Procedure Calls for efficient task dispatching and scheduling. It also leverages a thread pool for execution of tasks rather than a pool of Java Virtual Machine processes. This enables Spark to schedule and execute tasks at rate measured in milliseconds, whereas MapReduce scheduling takes seconds and sometimes minutes in busy clusters. Spark through Hive would not be an approach for achieving Spark results shown here. Execution results will be inconsistent to indefinite. Developing a good use of Spark for a vendor is not dissimilar to developing the product initially. It takes years and millions of dollars. Utilizing the full capability of Spark for Data Integration with Hadoop is a winning approach.