habitat suitability for greater sage-grouse in oil and gas ... · there are several factors related...
TRANSCRIPT

HABITAT SUITABILITY FOR GREATER SAGE-GROUSE IN OIL AND GAS
DEVELOPED AREAS IN NORTH DAKOTA AND MONTANA
Kent C. Jensen, Department of Wildlife and Fisheries Sciences, South Dakota State University,
Brookings, SD
Mark A. Rumble, USDA Forest Service, Rocky Mountain Research Station, Rapid City, SD
INTRODUCTION
The historical range of greater sage-grouse has been dramatically reduced since European
settlement (Connelly and Braun 1997, Schroeder et al. 2004). The range of greater sage-grouse
(sage-grouse hereafter) has been reduced by 45% across North America (Schroeder et al. 2004)
with an estimated range-wide population decline of 45-80% and local declines of 17-92%
(Aldridge and Brigham 2002, Aldridge 1998). The distribution of sage-grouse is clearly
associated with the distribution of sagebrush (Artemisia spp.) and sage-grouse are year-round
obligates of sagebrush communities (Paige and Ritter 1999, Schroeder et al.2004). Reduced
sage-grouse populations are intimately linked to widespread degradation of sagebrush vegetation
communities. The direct and indirect causes of habitat degradation for sage-grouse are
associated with altered fire regimes (Wrobleski and Kauffman 2003), grazing and agriculture,
urbanization, and oil and gas extraction (Connelly et al. 2004). Oil and gas development is the
most recent and least understood impact on sage-grouse and their habitat. Since economic
production of oil and gas are predicted to continue for 20 – 100 years (Connelly et al. 2004), it is
important to understand these impacts. Once understood, it will be possible to plan future
resource development in ways that least impact sage-grouse populations.
There are several factors related to oil and gas development that negatively impact sage-
grouse populations. Development of oil and gas industry requires construction of roads, well
pads, disturbance during drilling, short term storage, and transporting the material off site.
Typical well pads require 0.8-1.9 ha and compressor stations along pipelines require 5-7 ha
(Connelly et al.2004). Construction of roads is a direct loss of habitat. The placement of these
physical structures has varying impacts on wildlife. Soil disturbance along roads and near wells,
facilitates spread of exotic plants species, and power lines and communication structures provide
nest and perch sites for raptors (Connelly et al. 2004).
Direct effects of oil and gas development and long-term effects of pumping stations,
refineries, and other permanent facilities are largely unknown. However, if more than 40% of
the area within 0.8 km or a lek is within 350 m of a coal bed methane well, the number of male
sage-grouse displaying and the total number of active leks are reduced (Walker et al. 2007).
Female sage-grouse are also less likely to select areas for nesting and brooding in areas with coal
bed methane wells (Doherty et al. 2008). Roads related to oil and gas can reduce nest success,
and increased disturbance during lekking and brood-rearing periods (Braun 1998, Lyon and
Anderson 2003). The negative effects of oil and gas development are further exasperated by
increased extraction technology enabling development of oil and gas fields. In 2002, 99% of
4,279 permit applications were approved (Connelly et al.2004). Thus the effects of all factors
related to oil and gas development need to be understood so that accurate management
recommendations can be made.
Previous research on sage-grouse in southwestern North Dakota (Herman-Brunson 2007,
Swanson 2009) identified an area of the Cedar Creek Anticline in Bowman County, ND and
Fallon County, MT with an obvious lack of sage-grouse use. This area (Figure 1) also has

considerable oil and gas development and infrastructure. Before attributing the dispersion
patterns of sage-grouse in this region to oil and gas development, the suitability of the habitat
must be ascertained. The objective of this study is to further develop brood habitat models for
sage-grouse and use these models to assess habitat suitability for sage-grouse in the Cedar Creek
Anticline area.
STUDY AREA
Historically, the study area was sagebrush steppe ecosystem. Populations of sage-grouse
have been declining. Population indices for sage-grouse in North Dakota suggest declining
populations since about 1960 (Smith et al. 2004). Habitat alteration primarily through grazing,
agricultural activities, altered fire regimes, and urbanization has fragmented much of the
contiguous sagebrush communities. The landscape is currently a mixture of crop land, grazed
pasture, and sagebrush communities.
METHODS
Radio-marking and monitoring
Female sage-grouse will be captured via night spotlighting beginning mid-March and
continuing through April (Giesen et al. 1982). Age, sex, and weight of sage-grouse captured was
recorded and female sage-grouse were marked with leg-bands and a necklace-mounted, 20-g
radio transmitter with activity switch attached to each bird. Female sage-grouse were located
using standard telemetry procedures to determine nest locations and if the nest was successful,
locations were obtained bi-weekly for hens with broods. Locations of sage-grouse locations
were recorded in handheld GPS (NAD 1927 CONUS, UTM Zone 13 Projection).
Habitat Measurements

Vegetation characteristics important to resource selection by hens with broods in the
Dakotas included height of sagebrush, percent herbaceous vegetation cover, grass height, and
percent forb cover (Kaczor et al. in press). Vegetation measurement described below include
only those measurements that were collected as part of this study and as supplemental data for
developing resource selection models. Original and extensive descriptions of the sampling
designs are described by Herman-Brunson et al. (2009) and Kaczor et al. (in press). We
characterized vegetation at sites used by females with broods about 14 ± 2 SE days after
recording the location. Two 50-m transects were established in the north-south cardinal
directions, each starting at the marked brood location and terminating at their respective north-
south ends. A modified Robel pole was used to quantify visual obstruction readings (VOR) and
maximum grass height at 10 m intervals (N = 11; Robel et al. 1970, Benkobi et al. 2000). We
estimated sagebrush (A. tridentata spp. and A. cana spp.) density and height at 10-m intervals
(N = 11) using the point-centered quarter method (Cottam and Curtis 1956). Canopy coverage
was estimated using a 0.10 m2 quadrat (Daubenmire 1959). At each 10-m interval, four 0.1 m2
quadrats were placed in an H-shape with each leg of the H being 1 m long (N = 44 per site). We
recorded percent cover in six categories for total vegetation, grass, forb, shrub, litter, bare
ground, shrub species, grass species, and forb species cover in each quadrat (Daubenmire 1959).
In addition, we characterized vegetation at an equal number of random sites during the same
period. Random sites were generated within a 10 km buffer of capture leks with a Geographic
Information System (GIS) with Hawth’s Analysis Tool (Beyer 2004). Random points were
reselected if they were on a road, in a road ditch, or on private lands where we could not obtain
permission for access. Measurements were recorded in the field using a CMT MC-IV (Corvallis
Microtechnology) data entry device.
Vegetation in the Cedar Creek Anticline
We digitized an approximate boundary of the Cedar Creek Anticline in ArcMap (ESRI
2005) geographic information system. We then used Hawth’s tools in ArcMap version 8 to
select approximately 100 random sites within the boundary of the anticline area (hereafter
referred to as oil random sites). Oil random sites in the anticline <30 m from a road were
discarded and another set of coordinates selected. Data collected at oil random sites were the
same as those at used and random sites described above.
Analytical Methods
Data characterizing vegetation at nest and brood sites and the associated random sites
were summarized to a value for each site. These data were then pooled with data collected in
2005-2006 at sites used by hens with broods (Kaczor et al. in press). For shrub height
measurements we entered 0 for measurements when no shrubs were present in the quarter plots
of the point-centered-quarter method. Prior to developing resource selection models we
evaluated the form each variable that best accounted for the variation in used and random sites
using a log-ratio test. We standardized the values from each site as a z-score and evaluated the
linear, quadratic, exponential, and pseudo-threshold (Franklin et al. 2000) forms of each variable.
A set of candidate resource selection models incorporating variables from those publications
were evaluated using logistic regression in an Information Theoretic framework (Burnham and
Anderson 2002) with small sample size correction. We evaluated the post-hoc predictive ability
of the model using receiver operating curve (ROC) in which ROC values > 0.7 were considered
to have good predictive ability.
We then estimated habitat suitability for sage-grouse in the anticline by classifying
probability of oil random sites being used as brood habitat. Habitat suitability is a relative scale

from 0 – 1.0 with 1.0 being ideal habitat. We included 3 estimates of habitat suitability for sage-
grouse nesting and broods: 1) proportion of sites each with a posterior probability of being used
>0.5, 2) calculated average probability of use and nonuse, 3) and qualitative evaluation of
number of sites with posterior probability of being used in the following categories >0.7, 0.6 –
0.7, 0.5 -<0.6, 0.4 - 0.5, and >0.4. Analyses were completed using SAS 9.2 (SAS Institute
2008).
RESULTS
Brood Habitat
We measured 169 locations from 27 individual sage-grouse broods and 161 random sites
from 2005-2007. A resource selection model for sage-grouse brood habitat was developed from
these data (see below). In 2007, we measured 45 oil random sites in the southwestern portion of
the Cedar Creek Anticline (Figure 2).
We evaluated 17 candidate models (Table 1, 2) using variables from resource selection
models for sage-grouse broods from 2005 – 2006 (Kaczor et al. in press). Of the models
considered, the model that included percent herbaceous cover, grass height, and shrub height was
the most supported model (AICwi.= 0.76). A second model with some support (AICwi. = 0.16)
included visual obstruction in place of grass height in that occurred in the most supported model,
but was not within 2 ΔAICc units of the other model. Combined these models received 91% of
the AIC weights. A third model, included percent cover of bunch grasses with variables in the
most supported model but had essentially the same log-likelihood and was dismissed from
further consideration. We average coefficients from supported models because support for the
“best” model was >4 times greater than the next model, there was little support for any other
models.

The odds ratios for percent herbaceous cover and shrub height indicated these were the
primary variables determining resource selection by sage-grouse broods in this area (Table 3).
The odds ratio for grass height suggested that this variable was the least important variable in the
model. However, the model without grass height was substantially less supported.
Probability of the oil random sites being classified as used by sage-grouse broods was
averaged 0.29, whereas the averaged probability of sites being classified as unused was 0.71
(Table 4). Proportion of these sites being classified as used and unused was 0.26 and 0.74,
respectively. Finally, the highest posterior probability of a random sites in the Cedar Creek
Anticline being use was 0.8 only one sites while the highest posterior probability of sites being
unused was 0.96. The posterior classifications based on the resources selection function suggest
that habitat in the portion of the Cedar Creek Anticline evaluated was largely unsuitable as brood
habitat for sage-grouse. Figure 2 shows that of the sites classified as suitable for sage-grouse
broods most only were moderate or weakly classified as suitable habitat. Finally, Figure 3 show
that those sites classified as suitable habitat for sage-grouse broods were mostly located outside
or along the edge of the area of the Cedar Creek Anticline with few sage-grouse locations.
CONCLUSIONS
The areas of the Cedar Creek Anticline that we studied and for which the use by sage-
grouse was absent or minimal is probably because the habitat was unsuitable. Vegetative
conditions in this area did not provide adequate height or abundance of herbaceous vegetation for
sage-grouse broods. Several metrics of habitat suitability based on posterior probabilities from
the resource selection function for the area we evaluated were less than 0.3. The Cedar Creek
Anticline extends well beyond the area we evaluated and this study should not be interpreted to
suggest that those areas are not suitable sage-grouse habitat.

This study was designed to evaluate the habitat suitability for both nesting and brood
rearing by greater sage-grouse, but these objectives were not attainable because the graduate
student left the project after the first year. Another graduate student took over the project, but
the study design was compromised by a combination of weather factors prohibiting the capture
and radio-collaring of additional birds, and habitat data collection protocols that were
incomplete.
LITERATURE CITED
Aldridge, C. L. 1998. Status of the Sage Grouse in Alberta. Wildlife Status Report 13. Alberta
Environmental Protection, Wildlife Management Division, and Alberta Conservation
Association, Edmonton, Alberta.
Aldridge, C. L., and R. M. Brigham. 2002. Sage-grouse nesting and brood habitat in southern
Canada. Journal of Wildlife Management 66:433-444.
Benkobi, L., D. W. Uresk, G. Schenbeck, and R. M. King. 2000. Protocol for monitoring
standing crop in grasslands using visual obstruction. Journal of Range Management 53:
627-633.
Beyer, H. L. 2004. Hawth's Analysis Tools for ArcGIS. <http://www.spatialecology.com/htools>
(10 January 2006).
Braun, C. E. 1998. Sage-grouse Declines in western North America: What are the Problems?
Proceedings of the Western Association of State Fish and Wildlife Agencies 78:139-156.
Burnham, K. P., and D. R. Anderson. 2002. Model selection and multimodel inference: a
practical information-theoretic approach, Second edition. Springer-Verlag, New York, NY.
Connelly, J. W., M. A. Schroeder, A. R. Sands, and C. E. Braun. 2000. Guidelines to manage
sage grouse populations and their habitats. Wildlife Society Bulletin 28:1-19.
Connelly, J. W., and C. E. Braun. 1997. Long-term changes in Sage Grouse populations in
western North America. Wildlife Biology 3:229-234.
Connelly, J. W. S. T. Knick, M. A. Schroeder, and S. J. Stiver. 2004. Conservation Assessment
of Greater Sage-grouse and Sagebrush Habitats. Western Association of Fish and Wildlife
Agencies. Unpublished Report. Cheyenne, Wyoming.

Cottam, G., and J. T. Curtis. 1956. The use of distance measures in phytosociological sampling.
Ecology 37(3): 451-460.
Daubenmire, R. 1959. A canopy-coverage method of vegetational analysis. Northwest
Science 33(1):43-62.
Doherty, K. E., D. E. Naugle, B. L. Walker, and J. M. Graham. 2008. Greater Sage-grouse
winter habitat selection and energy development. Journal of Wildlife Management
72:187-195.
Giesen, K. M., T. J. Schoenberg, and C. E. Braun. 1982. Methods for trapping sage grouse in
Colorado. Wildlife Society Bulletin 10:224-231.
Herman-Brunson, K. M. 2007. Nesting and brood-rearing habitat selection of Greater sage-grouse
and associated survival of hens and broods at the edge of their historic distribution. MS
thesis, South Dakota State University, Brookings.
Herman-Brunson, K. M., K. C. Jensen, N. W. Kaczor, C. C. Swanson, M. A. Rumble, and R. W.
Klaver. 2009. Nesting ecology of Greater Sage-Grouse Centrocercus urophasianus at the
eastern edge of their historic distribution. Wildlife Biology 15:237-246.
Kaczor, N. W., K. M. Herman-Brunson, K. C. Jensen, M. A. Rumble, R. W. Klaver, and C. C.
Swanson. 2011. Greater sage-grouse brood rearing resource selection in the Dakotas.
Studies in Avian Biology. In Press.
Lyon, A. G. and S. H. Anderson. 2003. Potential gas development impacts on sage-grouse nest
initiation and movement. Wildlife Society Bulletin 31:486-491.
Paige, C., and S. A. Ritter. 1999. Birds in a sagebrush sea: managing sagebrush habitats for bird
communities. Partners in Flight Western Working Group, Boise, Idaho.
Robel, R. J., J. N. Briggs, A. D. Dayton, and L. C. Hulbert. 1970. Relationships between visual
obstruction measurements and weight of grassland vegetation. Journal of Range
Management 23:295-298.
SAS Institute Inc. 2008. SAS version 9.2, Cary, NC, USA.
Schroeder, M. A., C. L. Aldridge, A. D. Apa, J. R. Bohne, C. E. Braun, S. D. Bunnell, J. W.
Connelly, P. A. Deibert, S. C. Gardner, M. A. Hillard, G. D. Kobriger, C. W. McCarthy,
J. J. McCarthy, D. L. Mitchell, E. V. Rickerson, and S. J. Stiver. 2004. Distribution of
Sage-Grouse in North America. Condor 106:363-367.
Smith, J. T., L. D. Flake, K. F. Higgins, G. D. Kobriger, and C. G. Homer. 2004. History of
Greater sage-grouse in the Dakotas: distribution and population trends. Prairie Naturalist
36: 213-230.
Swanson, C. C. 2009. Ecology of Greater sage-grouse in the Dakotas. PhD thesis. South Dakota
State University, Brookings.
Walker, B. L., D. E. Naugle, and K. E. Doherty. 2007. Greater Sage-grouse population response
to energy development and habitat loss. Journal of Wildlife Management: 71:2644-2654.
Wrobleski, D. W., and J. B. Kauffman. 2003. Initial effects of prescribed Fire on morphology,
abundance, and phenology of Forbs in big sagebrush communities in southeastern
Oregon. Restoration Ecology 11(1):82-90.
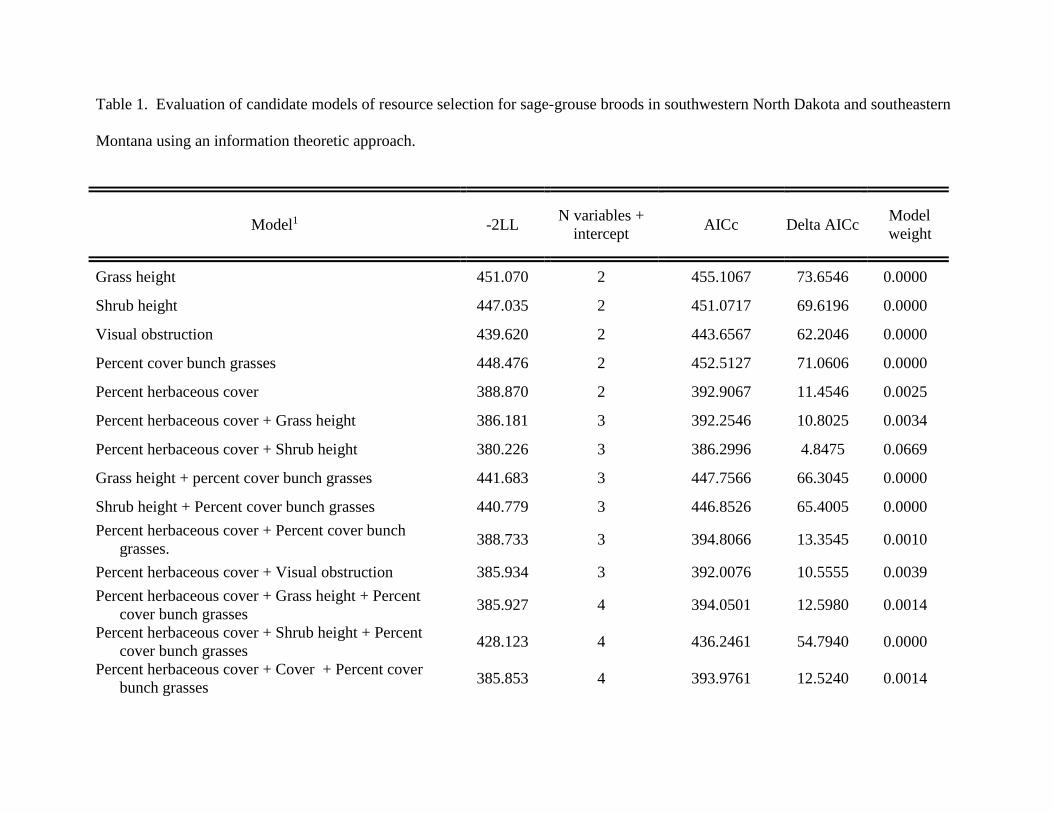
Table 1. Evaluation of candidate models of resource selection for sage-grouse broods in southwestern North Dakota and southeastern
Montana using an information theoretic approach.
Model1 -2LL N variables +
intercept AICc Delta AICc
Model
weight
Grass height 451.070 2 455.1067 73.6546 0.0000
Shrub height 447.035 2 451.0717 69.6196 0.0000
Visual obstruction 439.620 2 443.6567 62.2046 0.0000
Percent cover bunch grasses 448.476 2 452.5127 71.0606 0.0000
Percent herbaceous cover 388.870 2 392.9067 11.4546 0.0025
Percent herbaceous cover + Grass height 386.181 3 392.2546 10.8025 0.0034
Percent herbaceous cover + Shrub height 380.226 3 386.2996 4.8475 0.0669
Grass height + percent cover bunch grasses 441.683 3 447.7566 66.3045 0.0000
Shrub height + Percent cover bunch grasses 440.779 3 446.8526 65.4005 0.0000
Percent herbaceous cover + Percent cover bunch
grasses. 388.733 3 394.8066 13.3545 0.0010
Percent herbaceous cover + Visual obstruction 385.934 3 392.0076 10.5555 0.0039
Percent herbaceous cover + Grass height + Percent
cover bunch grasses 385.927 4 394.0501 12.5980 0.0014
Percent herbaceous cover + Shrub height + Percent
cover bunch grasses 428.123 4 436.2461 54.7940 0.0000
Percent herbaceous cover + Cover + Percent cover
bunch grasses 385.853 4 393.9761 12.5240 0.0014

Percent herbaceous cover + Grass height + Shrub
height 373.329 4 381.4521 0.0000 0.7557
Percent herbaceous cover + Visual obstruction + Shrub
height 376.387 4 384.5101 3.0580 0.1638
1 Visual obstruction, percent cover bunch grasses, percent herbaceous cover, visual obstruction, and shrub height with 0 if absent were
all pseudo threshold transformation of the variable; grass height was an exponential transformation of the variable.
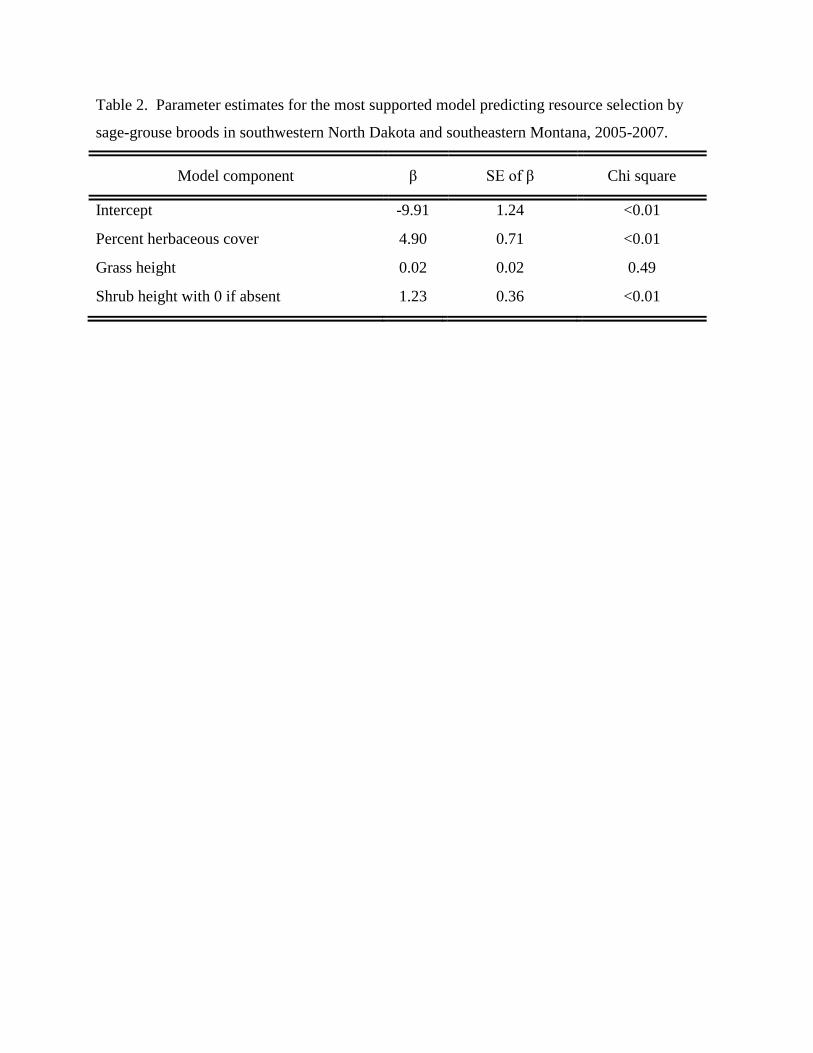
Table 2. Parameter estimates for the most supported model predicting resource selection by
sage-grouse broods in southwestern North Dakota and southeastern Montana, 2005-2007.
Model component β SE of β Chi square
Intercept -9.91 1.24 <0.01
Percent herbaceous cover 4.90 0.71 <0.01
Grass height 0.02 0.02 0.49
Shrub height with 0 if absent 1.23 0.36 <0.01
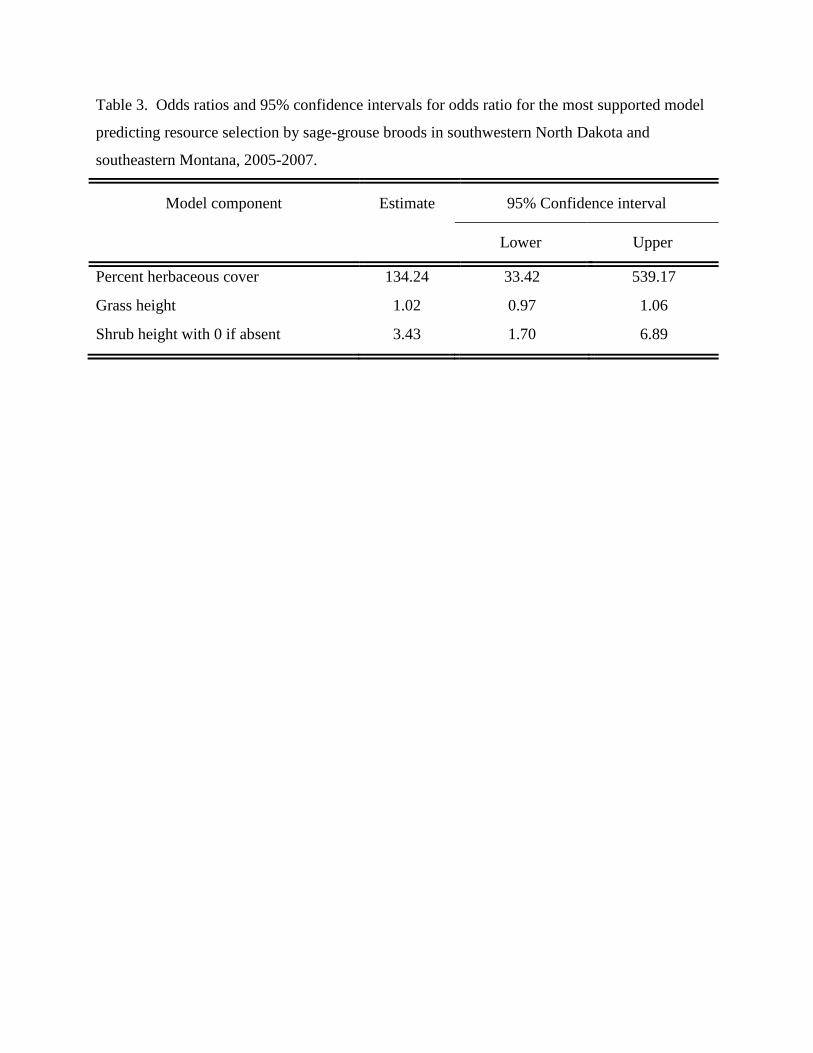
Table 3. Odds ratios and 95% confidence intervals for odds ratio for the most supported model
predicting resource selection by sage-grouse broods in southwestern North Dakota and
southeastern Montana, 2005-2007.
Model component Estimate 95% Confidence interval
Lower Upper
Percent herbaceous cover 134.24 33.42 539.17
Grass height 1.02 0.97 1.06
Shrub height with 0 if absent 3.43 1.70 6.89

Table 4. Summary statistics of predicted habitat suitability for sage-grouse broods of 46 random
sites in the Cedar Creek Anticline using logistic regression model developed southwestern North
Dakota and southeastern Montana.
Habitat suitability estimate Classified as used Classified as unused
Average probability 0.29 0.71
Proportion classified 0.26 0.74
Largest probability in category 0.80 0.96

Figure 1. Map of depicting sage-grouse locations and roads and oil pads in North Dakota and
Montana associated with the Cedar Creek Anticline.
Legend
Roads
Oil wells Bowman county ND & Fallon county MT
Sage-grouse locations
TextText
Montana
North Dakota
South Dakota

0
5
10
15
20
25
30
35
Suitable
>0.7
Likely
0.7-0.6
Marginal 0.6
-0.4
Not Likely
0.4-0.3
Unsuitable
<0.3
Probability of use categories
Figure 2. Number of oil random sites with posterior classification probabilities depicted in categories.

Figure 3. Boundary of the Cedar Creek Anticline with sage-grouse locations and coordinates of
45 oil random sites classified as used or unused by resource selection funtion.