habitat priority planner - noaa office for coastal management · 2016-03-21 · habitat priority...
TRANSCRIPT

Quick Reference for the Habitat Priority Planner
Version 3.0
Habitat Priority Planner
Office for Coastal Management | Digital Coast
Quick Reference

HPPModule 1 Habitat
Classification
Module 2 Habitat Analysis
Module 3 Data
Explorer
INPUTS
Patch File
Patch File +
Analysis
Selected Patches
Patch File
OUTPUTS
Patch File +
Analysis
Raster VectorOR
Point, Line, or Polygon Layers
All Vector
Habitat Priority Planner
Quick Reference – HPP Process Schematic
Office for Coastal Management | Digital Coast
Quick Reference

Habitat Priority Planner
Quick Reference – Module 1, Analysis Extent
Current map extent
Extent = Area in current map view
May be hard to duplicate; use
bookmarks to preserve extent
Same as base dataset
Extent = Entire base dataset layer
May be large area (for example, C‐CAP is
entire coastal extent of state)
May be appropriate for small, high‐resolution areas
Larger geographic areas take more time to run
Map layer
Extent = Clipped portion of base dataset inside a polygon
May not contain donuts (holes in analysis area)
May not contain islands (areas
outside main polygon)
Office for Coastal Management | Digital Coast
Quick Reference

Habitat Priority Planner
Quick Reference – Classify Habitats, Defining Your Classification Scheme
Unique
Most complex (visually and spatially)
Preserves selected classes identical to base data
Allows the user to leave classes out of analysis
Performs similar to a select by attribute, but in a user‐friendly
wizard
Grouped
Allows the user to designate functional groups
(such as wetland, forest, or developed)
Appropriate functional groups may be application
specific and depend on user knowledge
Performs region‐group for raster inputs and a dissolve for
vector inputs
Simple
Least complex
Good for either a single class or a single group of classes
Good for large area analysis
Areas in white were not selected for analysis
Reported as habitat in the attribute table
Performs region‐group for raster inputs and a dissolve for
vector inputs
The output from all three classification methods is a vector file (the “patch” file).
Office for Coastal Management | Digital Coast
Quick Reference

Habitat Priority Planner
Quick Reference – Classify Habitats, Attribute Table Results
HPP Module 1 Attribute Table Result Fields and their DescriptionsThese values are reported for each patch that met your classification criteria.
Border Patch Figure The yellow line represents the border of your
analysis extent. The blue outlined area is an example of a
patch of interest that falls on a border (the attribute table lists true). If you have border patches, it is recommended
that you increase your analysis area to obtain full statistics for those patches.
Field Name Definition
HPP_Area_Size Patch area in original units.
For example, if your base dataset was in meters, the area size will be represented in square meters.
HPP_Area_Acre Patch area in acres.
HPP_Area_Hect Patch area in hectares.
HPP_Cls_Value Numeric value field of the original base dataset.
HPP_Cls_Name: Name of new description field (depends on type of classification selected.
HPP_PatchID Unique ID field.
HPP_Is_Border_Patch True/false value that determines whether or not a patch falls on the edge of the analysis extent (see figure).
Office for Coastal Management | Digital Coast
Quick Reference

Habitat Priority Planner
Quick Reference – Module 2, Landscape Analysis
Landscape Analysis Definition
Landscape Analysis analyses analyze the characteristics of individual patches and theirrelationship to other patches of the same habitat type.
Habitat Quality Analysis measures characteristics internal to each habitat patch, while HabitatConnectivity Analysis measures between habitat patches of the same type.
All analyses are optional: Users may skip Landscape Analysis and perform a Custom Analysisonly (or vice versa).
Refer to the HPP Help Document Landscape Analysis Appendix for specific calculationparameters related to each analysis.
Office for Coastal Management | Digital Coast
Quick Reference

NOAA Coastal Services Center
Habitat Priority Planner
Quick Reference – Module 2, Landscape Analysis
Appendix 1 – HPP Quick Reference
Analysis Ecological Importance
Habitat Quality
Perimeter‐to‐Area Ratio Reflects both the area and shape of a patch. This ratiois a strong predictor of both individual species presence and overall species richness. Larger ratio values denote more edge habitat and less interior habitat.
Core Area Calculates the size of the core area, which is the area remaining after the internal buffer is applied. The core area provides information about patch shape and the amount of patch edge to internal area. A patch may have a substantial size, but no significant core area (e.g., a patch shape that is long and narrow).
Size (from Module 1) Calculates the size of a contiguous habitat patch. Size helps determine the contribution of the patch to overall ecosystem and species health: The larger the area of continuous habitat, the better the habitat quality.
Habitat Connectivity
Proximity Assesses the quantity of like‐typed habitats within a user‐defined buffer distance from the patch of interest. Proximity is one measure of landscape configuration—in this case, how dispersed or clumped patches are on the landscape.
Nearest Neighbor Answers the question: “How close is the nearest habitat of the same type as the focal patch?” The nearest neighbor is the neighbor with the least physical separation by a straight‐line distance.
Office for Coastal Management | Digital Coast
Quick Reference

Habitat Priority Planner
Quick Reference – Module 2, Custom Analysis
Custom Analysis definition
Custom Analysis allows the user to examine relationships between habitat patches andadditional site‐specific data that provide more information about the area. Examples of site‐specific data include nesting sites, proposed development, and hazardous waste areas.
Custom analyses can be created using any information that can be represented as point, line,or polygon files within ArcGIS.
Custom analyses help the user quantify the association between supporting data and thehabitats (or sites) of interest.
These analyses are optional.
There is no limit to the number of custom analyses that the user may add.
Refer to the HPP Help Document Landscape Analysis Appendix for specific calculationparameters.
These analyses are always operationally conducted from your classified habitat patches to the point, line, or polygon data.
Office for Coastal Management | Digital Coast
Quick Reference

Habitat Priority Planner
Quick Reference – Module 2, Custom Analysis
Custom Analysis definitions
Analysis File Type
Definition
Count Point Number of points (from the user‐defined point layer) that fall within the patch.
Distance to Feature
PointLinePolygon
Linear distance from the edge of the patch to the nearest designated feature (point, line, or polygon). HPP reports the distance and identifies the patch that meets these requirements (designated in the attribute table with a label of _OID).
Presence/ Absence
PointLinePolygon
Indication of whether a user‐defined point feature is present within the boundary of the patch. Values can be reported as true/false or 1 (true)/0 (false). Users can determine preference, as both types are reported.
LinearDistance Within
Line Summation of the length of a user‐defined linear feature that falls entirely within the patch. The value can be in feet or meters.
Polygon Overlay
Polygon Summation of the area (and percentage) of overlap between the patch and a user‐defined polygon file. Thearea can be in acres or hectares.
Office for Coastal Management | Digital Coast
Quick Reference

NOAA Coastal Services Center
Habitat Priority Planner
Quick Reference – Habitat Analysis, Attribute Table Results
Note: Your field names may differ if you’ve edited them; however, for each analysis type you should see some version of these designations.
Appendix 1 – HPP Quick Reference
Field Name Definition
Landscape Analysis (measure between habitat patches)
HPP_Perimeter_Area_Ratio Numeric value representing the ratio for this field. Larger ratio values denote more edge habitat and less interior habitat.
HPP_Nearest_Neighbor Distance to the nearest patch of the same class type. (User selects units in the wizard.)
HPP_Nearest_Neighbor_ID Identity of the patch that is the nearest neighbor.
HPP_Core_Area Area of the patch remaining after an internal , user‐selected buffer is applied. (User selects units in the wizard.)
HPP_Proximity Amount of area of the same habitat type within a user‐defined buffer.
Custom Analysis (measure from a habitat patch to a point, line, or polygon feature)
HPP_Count Number of point features that occur within each habitat patch.
HPP_Distance_To Distance from the habitat patch to the closest point, line, or polygon feature. (User selects units in the wizard.)
HPP_Distance_To_OID Identity of the closest feature that is used for each patch’s Distance To calculation. (User selects units in the wizard.)
HPP_Linear_Distance_Within Distance that a linear feature intersects a patch. For example, how much road length runs through a patch. (User selects units in the wizard.)
HPP_Presence_Absence True/false value that determines whether or not the feature is present within a patch.
HPP_Presence_Absence_01 Secondary, numeric value for Presence/Absence ( 1 = true, 0= false).
HPP_Polygon_Overlay Area of overlap of the patch with another polygon type of interest. (User selects units in the wizard.)
HPP_Polygon_Overlay_Pct Percentage of overlap of the patch with another polygon type of interest.
Office for Coastal Management | Digital Coast
Quick Reference

Habitat Priority Planner
Quick Reference – HPP Report Contents
In all three modules of the Habitat Priority Planner, users have the option to create a which can be useful for documenting your work in a concise and complete manner. The report is created in an easy‐to‐share .pdf format that includes:
Project (file) name
Location of saved settings and layers
Land cover used for analysis
Classification type, names, and values
Landscape analyses run (with their corresponding buffer distances)
Custom analyses run (with type of analysis and layer used)
Basic statistics for each land cover class
Number of features in each class
Office for Coastal Management | Digital Coast
Quick Reference

Office for Coastal Management | Digital Coast
Habitat Priority Planner
Quick Reference – Module 3, Data Exploration
Step 1: Select a map layer
Step 2: Select a field
Step 3: Select data using criteria. Drag across the histogram or enter numbers into the Minimum and Maximum boxes
Step 4: Build query using AND or OR statements
Quick Reference

Habitat Priority Planner
Quick Reference – Module 3, Query Building
Exclusionary queries
To reduce the number of patches as you add criteria, insert AND statements betweeneach selection criteria
The end result will have habitat patches that fit every single criteria in the query.
For example, if our two criteria are freshwater wetland habitats and the presence ofwells. If we insert an AND statement between the selection criteria, the final resultwill be only polygons that represent freshwater wetland habitat that also containdrinking water wells
Office for Coastal Management | Digital Coast
Quick Reference
Habitat Priority Planner
Quick Reference – Module 3, Query Building
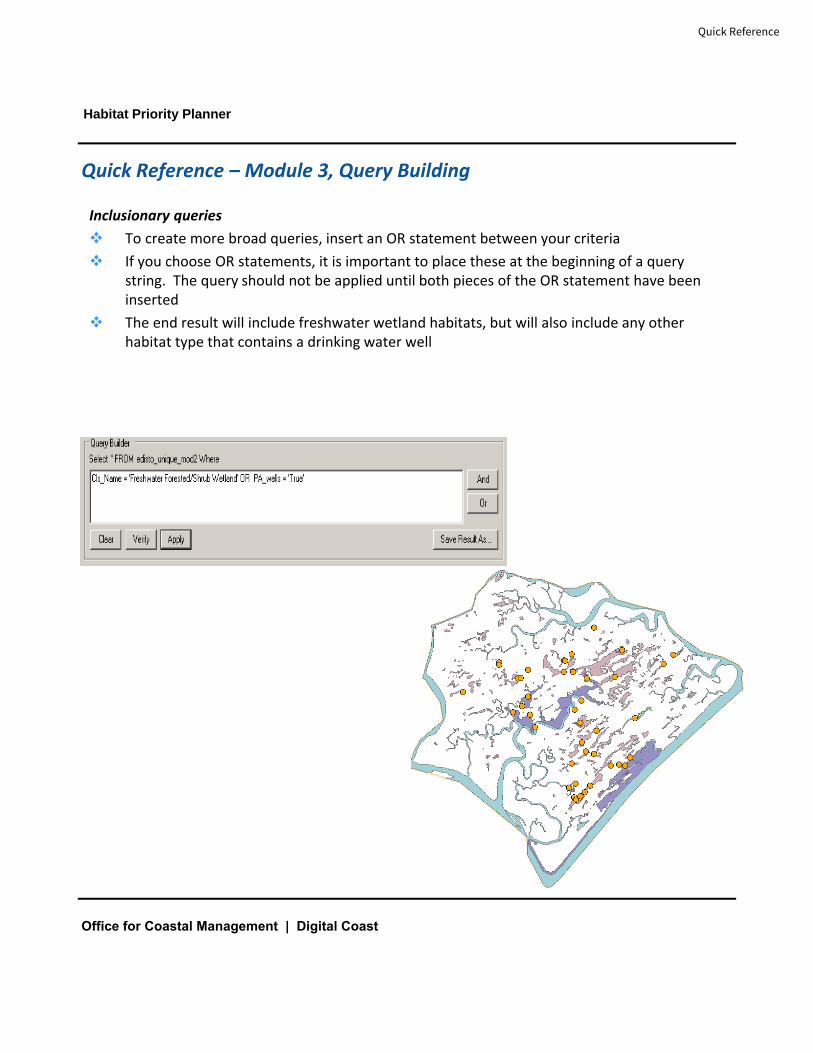
Inclusionary queries
To create more broad queries, insert an OR statement between your criteria
If you choose OR statements, it is important to place these at the beginning of a querystring. The query should not be applied until both pieces of the OR statement have beeninserted
The end result will include freshwater wetland habitats, but will also include any otherhabitat type that contains a drinking water well
Office for Coastal Management | Digital Coast
Quick Reference

Habitat Priority Planner
Quick Reference – Module 3, Stakeholder engagement tips
Goal Technique ExampleEnsure your comfort with group facilitation using the Data Explorer
Practice the steps and ensureyour comfort level prior to group engagement
Conduct a practice run with the data you plan to use in an engagement activity with your peers
Orient Stakeholders to thearea of interest
Revisit goals and analysis Before opening any maprevisit the session goals
Start with lowest technology common to participants
Use paper maps first if the participants have never seen GIS
Use orienting data Include a roads layer, county names, etc. to orient the group (even if you don’t use these in the analysis)
Orient Stakeholders to the Data Explorer
Demonstrate data explorer features to the group before using for analysis
Demonstrate key features (histogram, map highlighting selections, statistics)
Empower stakeholder to make decisions facilitated by Data Explorer
Take your time, ensure everyone is on the same page at each step
Check in with your stakeholders often to ensure they are following
Turn on/off each supporting data set as you need it (don’t clutter the map)
If you use a stream layer show the occurrence, then conduct selections
Show the map, and the highlighted features in between selection steps
Show the selection on the map following each histogram selection, show each applied selection as well
Office for Coastal Management | Digital Coast
Quick Reference