habitat monitoring on great duck island robert szewczyk joe polastre alan mainwaring john anderson...
Post on 19-Dec-2015
215 views
TRANSCRIPT
Habitat monitoring on Great Duck Island
Robert SzewczykJoe Polastre
Alan MainwaringJohn Anderson
David CullerUniversity of California, Berkeley
June 3, 2004
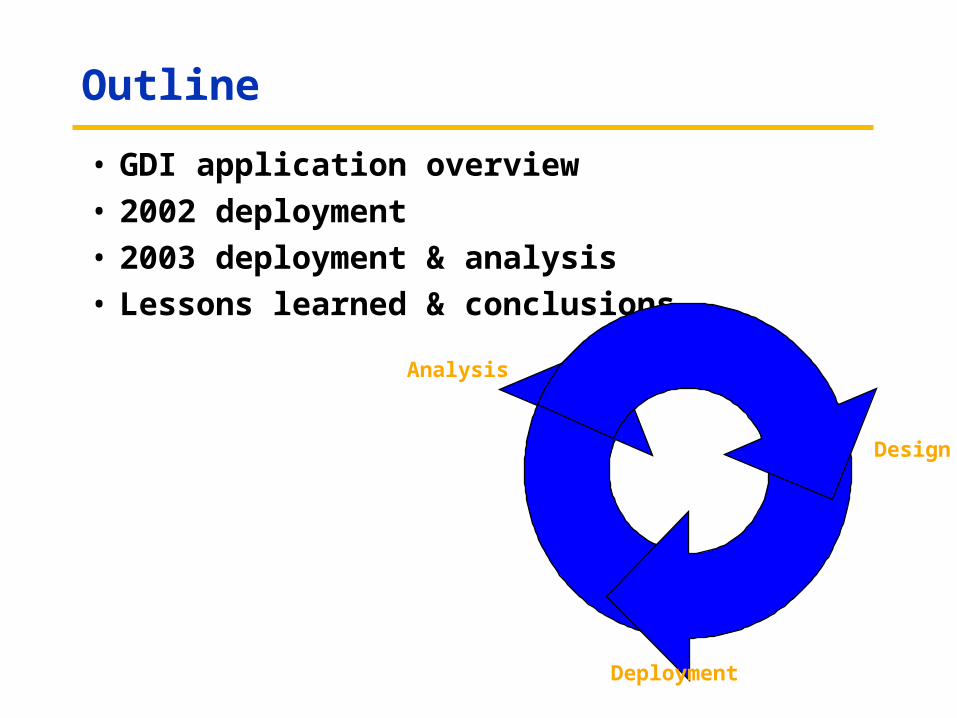
Outline
• GDI application overview
• 2002 deployment
• 2003 deployment & analysis
• Lessons learned & conclusions
Design
Deployment
Analysis

Scientific motivation: Leach’s Storm Petrel• Questions
– What environmental factors make for a good nest? How much can they vary?
– What are the occupancy patterns during incubation?
– What environmental changes occurs in the burrows and their vicinity during the breeding season?
• Methodology – Characterize the climate inside and outsize the
burrow– Collect detailed occupancy data from a number
of occupied and empty nest– Spatial sampling of habitat – sampling rate
driven by biologically interesting phenomena, non-uniform patches
– Validate a sample of sensor data with a different sensing modality
– Augmented the sensor data with deployment notes (e.g. burrow depth, soil consistency, vegetation data)
– Try to answer the questions based on analysis of the entire data set

Computer science research
• Focus on problems that matter to users of the system!– Network architecture
» Can this application be easily recast in other scenarios– Long-distance management
• Node design tradeoffs– Mechanical – expose sensors, while protecting the electronics– Low power hardware vs. high quality sensing– Size matters!
• Real world testbed– How do the simulation and lab results translate into the deployed application– What are common failure modes?– What factors impact the the functionality and performance of the sensor
network? – How do they vary across different deployments?
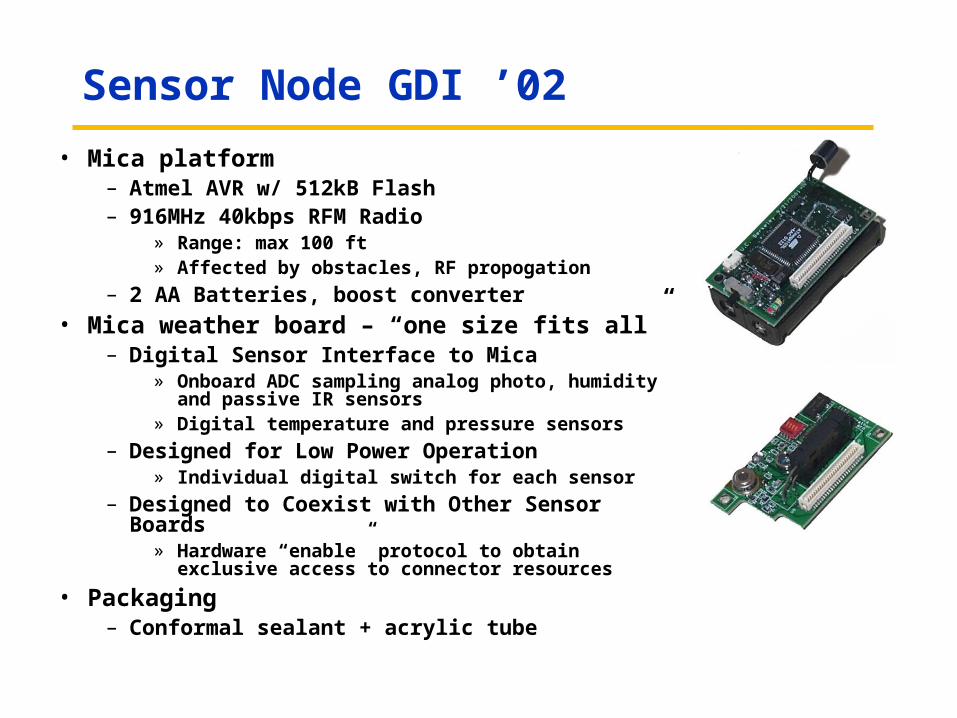
Sensor Node GDI ’02
• Mica platform– Atmel AVR w/ 512kB Flash– 916MHz 40kbps RFM Radio
» Range: max 100 ft» Affected by obstacles, RF propogation
– 2 AA Batteries, boost converter
• Mica weather board – “one size fits all”– Digital Sensor Interface to Mica
» Onboard ADC sampling analog photo, humidity and passive IR sensors
» Digital temperature and pressure sensors
– Designed for Low Power Operation» Individual digital switch for each sensor
– Designed to Coexist with Other Sensor Boards» Hardware “enable” protocol to obtain exclusive access
to connector resources
• Packaging– Conformal sealant + acrylic tube
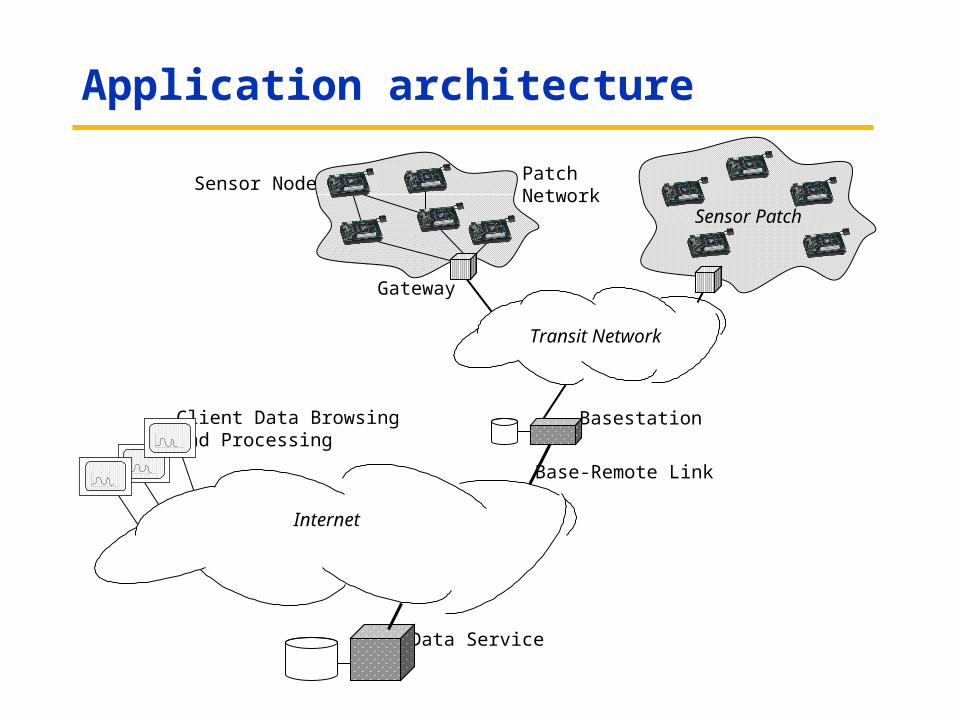
Application architecture
Base-Remote Link
Data Service
Internet
Client Data Browsingand Processing
Transit Network
Basestation
Gateway
Sensor Patch
Patch Network
Sensor Node
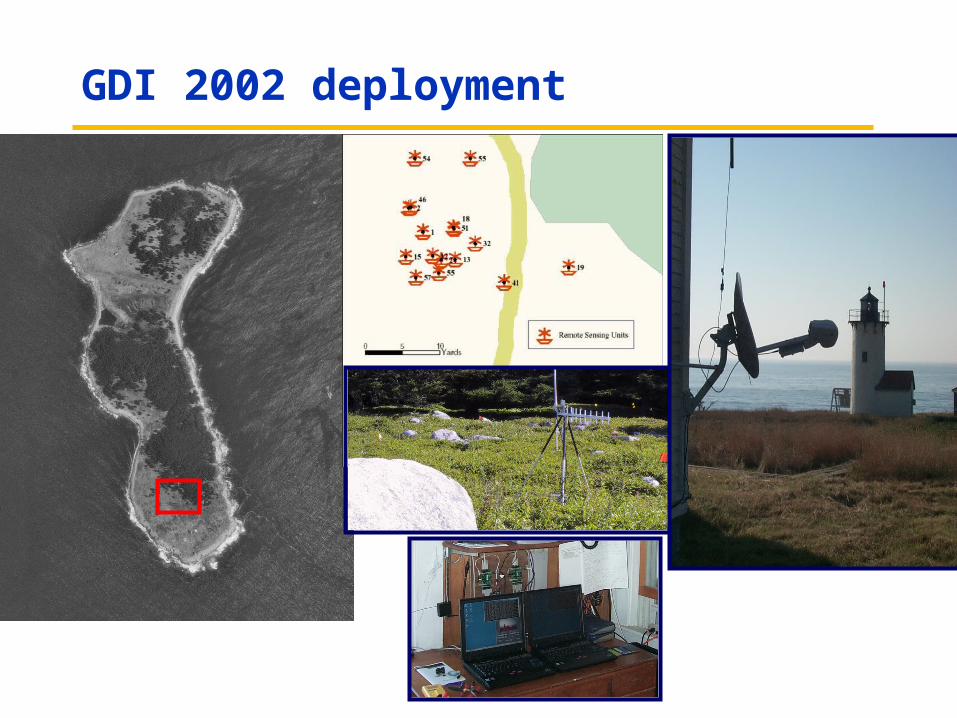
GDI 2002 deployment
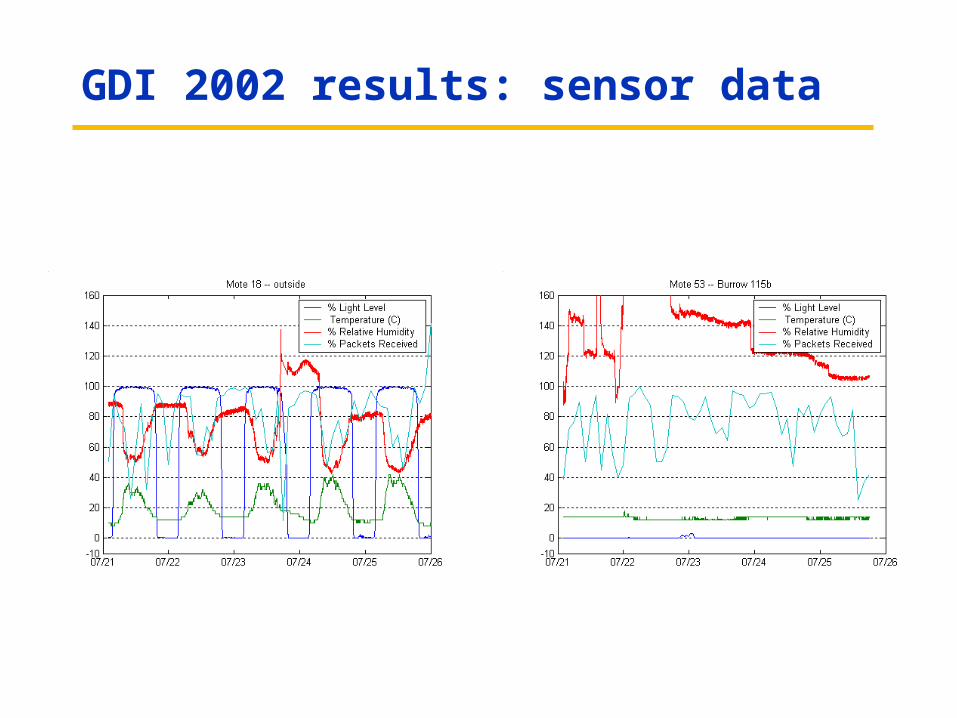
GDI 2002 results: sensor data
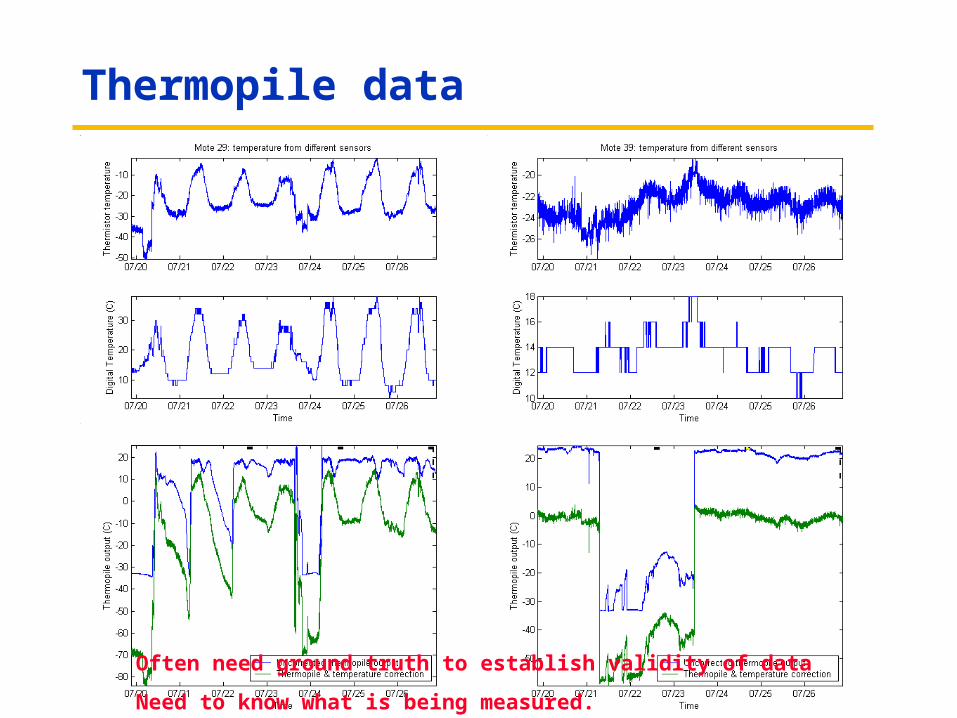
Thermopile data
Often need ground truth to establish validity of data
Need to know what is being measured.

GDI ’02 population
• 43 distinct nodes reporting data between July 13 and November 18
• Heavy daily losses– Between 3 and 5% daily
Redesign directions
• Node-level issues that need resolving– Size – motes were too large to fit in many burrows
– Packaging – did not provide adequate protection for electronics or proper conditions for sensors
– Node reliability
– Power consumption
– Data interpretation challenges
» Sensor calibration
» Occupancy data interpretation – need more sophisticated processing of sensor data and/or ground truth data
» Better metadata – sensor location & conditions
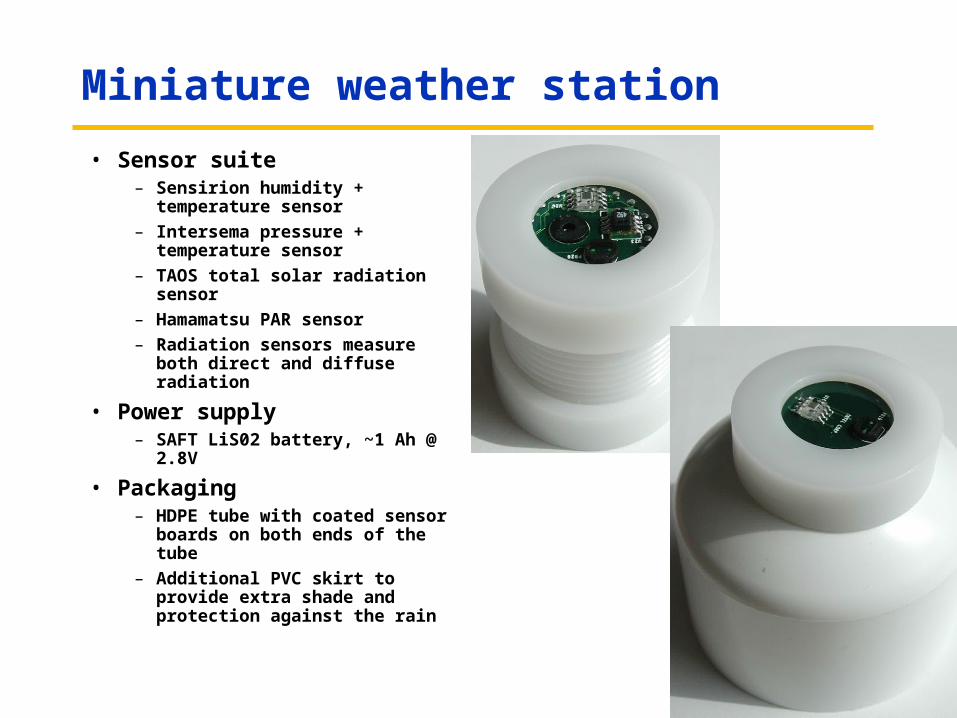
Miniature weather station
• Sensor suite– Sensirion humidity + temperature
sensor
– Intersema pressure + temperature sensor
– TAOS total solar radiation sensor
– Hamamatsu PAR sensor
– Radiation sensors measure both direct and diffuse radiation
• Power supply– SAFT LiS02 battery, ~1 Ah @
2.8V
• Packaging– HDPE tube with coated sensor
boards on both ends of the tube
– Additional PVC skirt to provide extra shade and protection against the rain
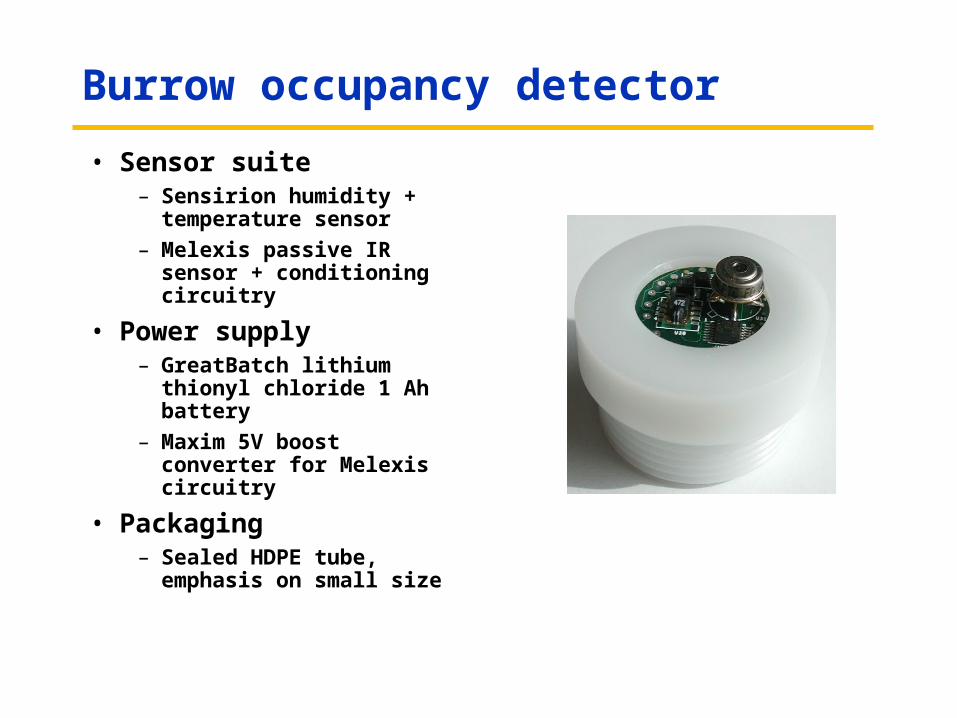
Burrow occupancy detector
• Sensor suite– Sensirion humidity +
temperature sensor
– Melexis passive IR sensor + conditioning circuitry
• Power supply– GreatBatch lithium thionyl
chloride 1 Ah battery
– Maxim 5V boost converter for Melexis circuitry
• Packaging– Sealed HDPE tube, emphasis
on small size
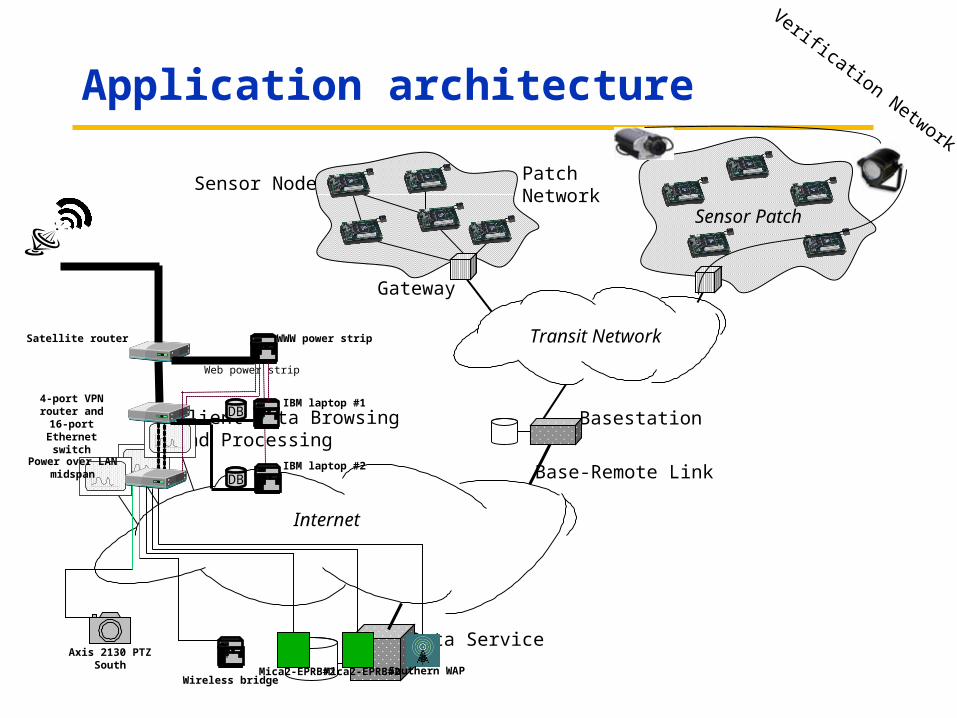
Application architecture
Base-Remote Link
Data Service
Internet
Client Data Browsingand Processing
Transit Network
Basestation
Gateway
Sensor Patch
Patch Network
Sensor Node
Verification Network
Mica2-EPRB#2
IBM laptop #1DB
Web power strip
Axis 2130 PTZ South
Wireless bridge
4-port VPN router and
16-port Ethernet switch
Power over LAN midspan DB
IBM laptop #2
Mica2-EPRB#2
WWW power strip
Southern WAP
Satellite router
GDI ’03 patch network
• Single hop network deployed mid-June– Rationale: Build a simple, reliable network that allows
» HW platform evaluation» Low power system evaluation» Comparisons with the GDI ’02 deployment
– A set of readings from every mote every 5 minutes– 23 weather station motes, 26 burrow motes– Placement for connectivity– Network diameter 70 meters– Asymmetric, bi-directional communication with low power
listening – send data packets with short preambles, receive packets with long preambles
– Expected life time – 4+ months» Weather stations perform considerably better than
burrow motes – their battery rated for a higher discharge current
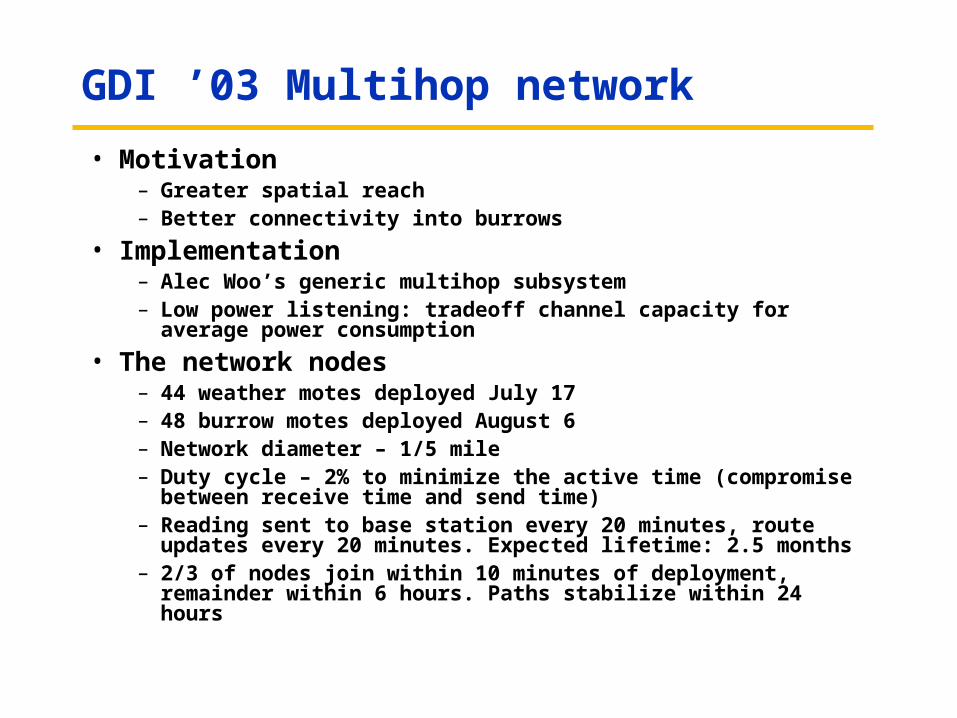
GDI ’03 Multihop network
• Motivation – Greater spatial reach– Better connectivity into burrows
• Implementation– Alec Woo’s generic multihop subsystem– Low power listening: tradeoff channel capacity for average power
consumption
• The network nodes– 44 weather motes deployed July 17– 48 burrow motes deployed August 6– Network diameter – 1/5 mile– Duty cycle – 2% to minimize the active time (compromise between
receive time and send time)– Reading sent to base station every 20 minutes, route updates every
20 minutes. Expected lifetime: 2.5 months– 2/3 of nodes join within 10 minutes of deployment, remainder within 6
hours. Paths stabilize within 24 hours
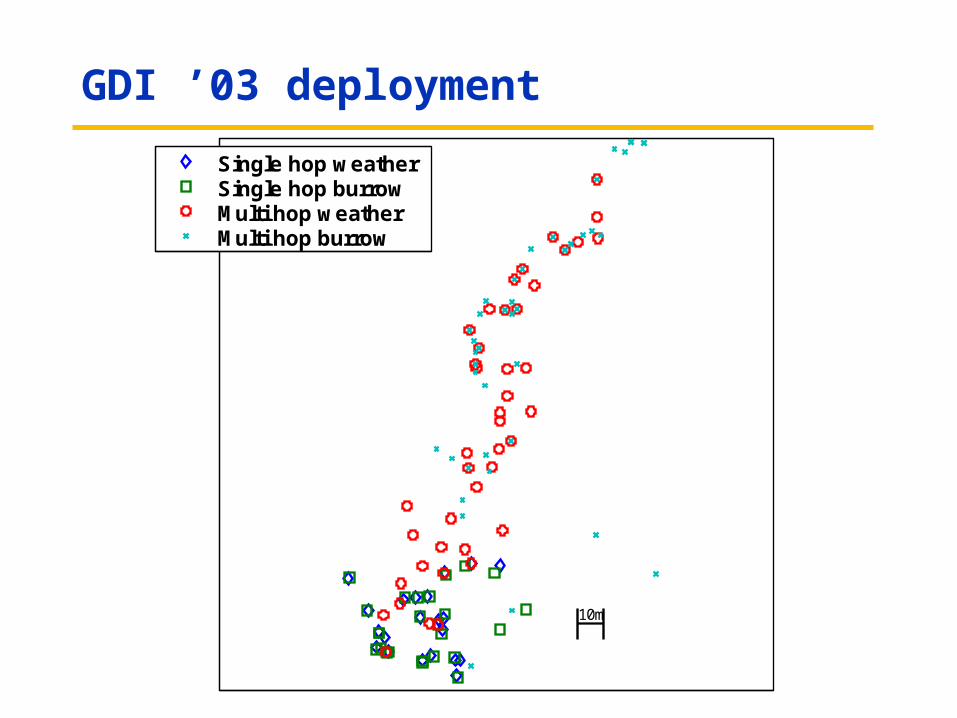
GDI ’03 deployment
10m
Single hop weatherSingle hop burrowMulti hop weatherMulti hop burrow
Multihop network over time
07/06 07/13 07/20 07/27 08/03 08/10 08/17 08/24 08/31 09/07 09/14 09/21 09/28 10/05 10/12 10/19 10/260
50
100Time-series characteristics of the mutlihop network
07/06 07/13 07/20 07/27 08/03 08/10 08/17 08/24 08/31 09/07 09/14 09/21 09/28 10/05 10/12 10/19 10/260
0.5
1
1.5
2
07/06 07/13 07/20 07/27 08/03 08/10 08/17 08/24 08/31 09/07 09/14 09/21 09/28 10/05 10/12 10/19 10/260
0.5
1
1.5PC uptime fraction
Parent change-network size ratio
Active nodesParent changes
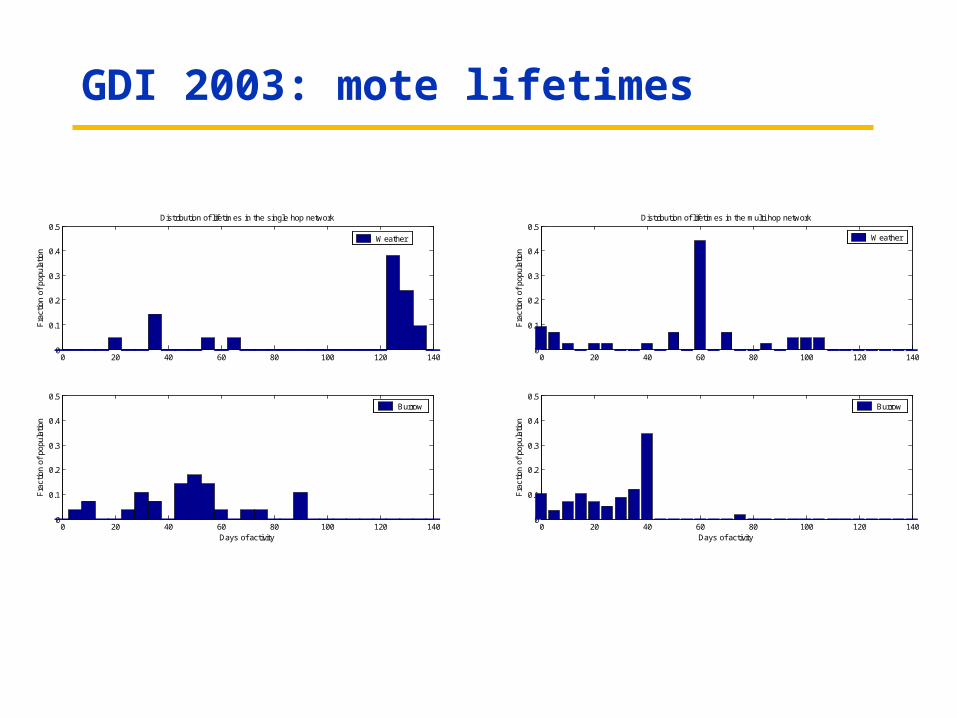
GDI 2003: mote lifetimes
0 20 40 60 80 100 120 1400
0.1
0.2
0.3
0.4
0.5
Fra
ctio
n of
pop
ulat
ion
Distribution of lifetimes in the multi hop network
0 20 40 60 80 100 120 1400
0.1
0.2
0.3
0.4
0.5
Fra
ctio
n of
pop
ulat
ion
Days of activity
Burrow
Weather
0 20 40 60 80 100 120 1400
0.1
0.2
0.3
0.4
0.5
Fra
ctio
n of
pop
ulat
ion
Distribution of lifetimes in the single hop network
0 20 40 60 80 100 120 1400
0.1
0.2
0.3
0.4
0.5
Fra
ctio
n of
pop
ulat
ion
Days of activity
Burrow
Weather
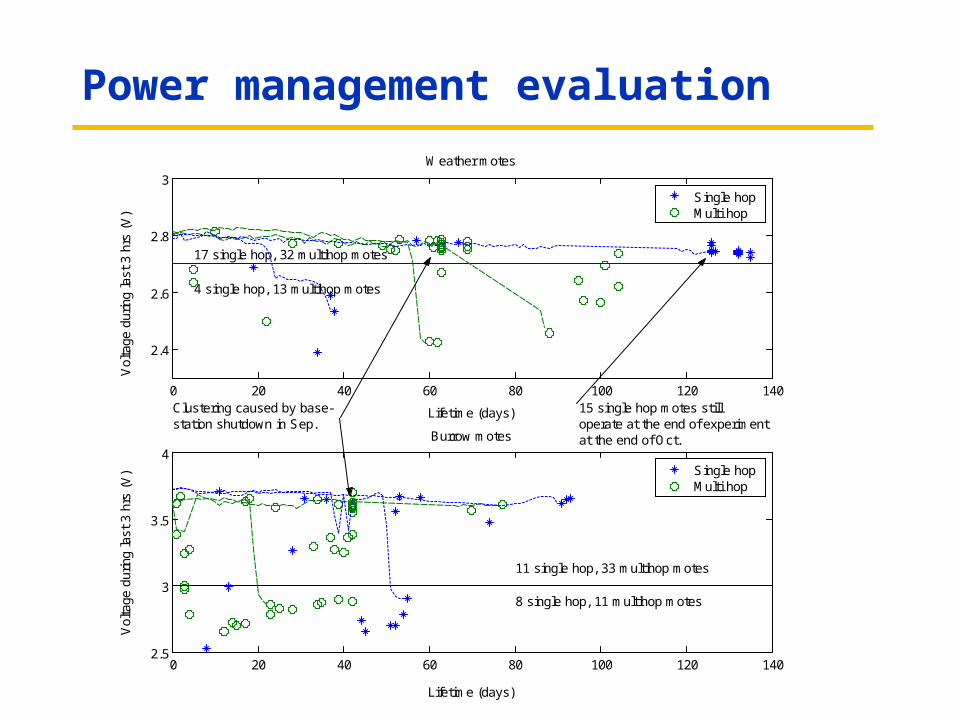
Power management evaluation
0 20 40 60 80 100 120 140
2.4
2.6
2.8
3
Lifetime (days)
Vol
tage
dur
ing
last
3 h
rs (
V)
Weather motes
4 single hop, 13 multihop motes
17 single hop, 32 multihop motes
Clustering caused by base-station shutdown in Sep.
15 single hop motes stilloperate at the end of experimentat the end of Oct.
0 20 40 60 80 100 120 1402.5
3
3.5
4
Lifetime (days)
Vol
tage
dur
ing
last
3 h
rs (
V)
Burrow motes
8 single hop, 11 multihop motes
11 single hop, 33 multihop motes
Single hopMulti hop
Single hopMulti hop
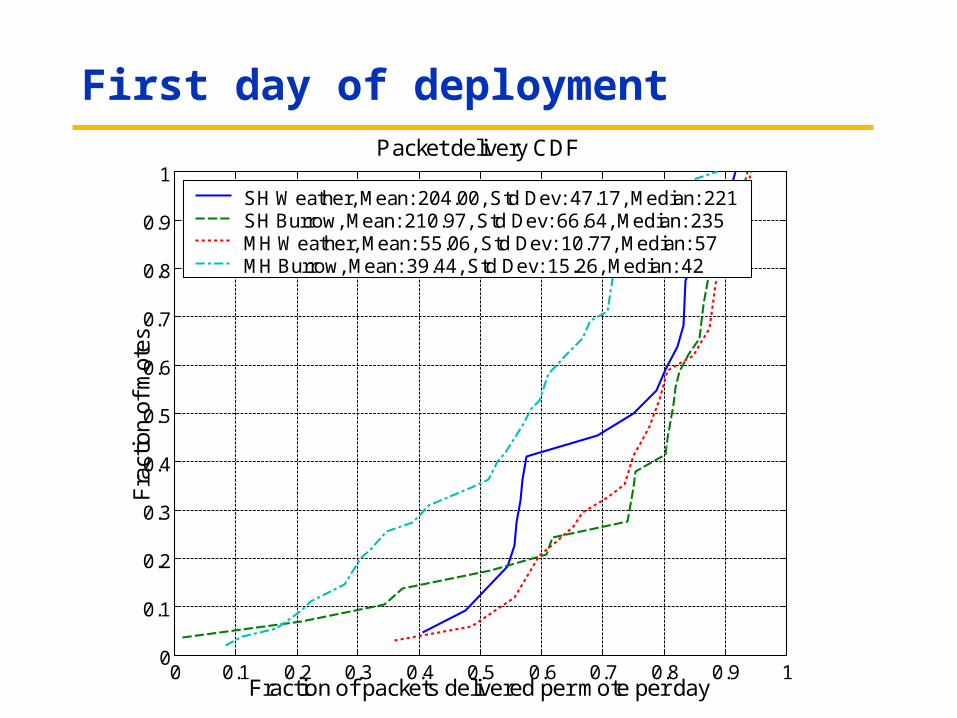
First day of deployment
0 0.1 0.2 0.3 0.4 0.5 0.6 0.7 0.8 0.9 10
0.1
0.2
0.3
0.4
0.5
0.6
0.7
0.8
0.9
1Packet delivery CDF
Fraction of packets delivered per mote per day
Fra
ctio
n of
mot
es
SH Weather, Mean: 204.00, Std Dev: 47.17, Median: 221SH Burrow, Mean: 210.97, Std Dev: 66.64, Median: 235MH Weather, Mean: 55.06, Std Dev: 10.77, Median: 57MH Burrow, Mean: 39.44, Std Dev: 15.26, Median: 42
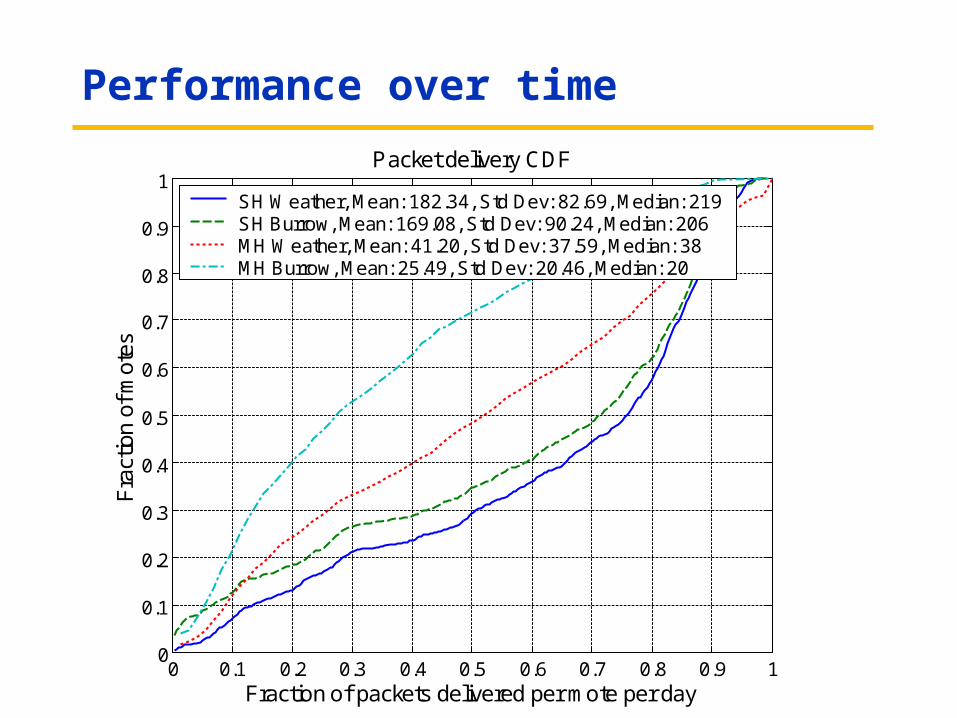
Performance over time
0 0.1 0.2 0.3 0.4 0.5 0.6 0.7 0.8 0.9 10
0.1
0.2
0.3
0.4
0.5
0.6
0.7
0.8
0.9
1Packet delivery CDF
Fraction of packets delivered per mote per day
Fra
ctio
n of
mot
es
SH Weather, Mean: 182.34, Std Dev: 82.69, Median: 219SH Burrow, Mean: 169.08, Std Dev: 90.24, Median: 206MH Weather, Mean: 41.20, Std Dev: 37.59, Median: 38MH Burrow, Mean: 25.49, Std Dev: 20.46, Median: 20
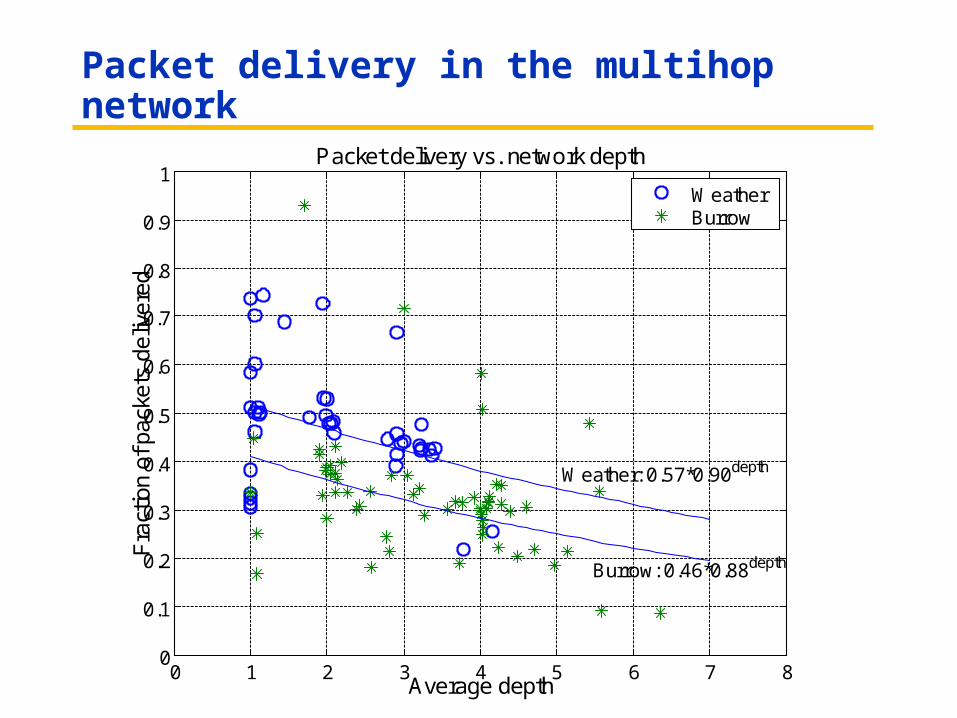
Packet delivery in the multihop network
0 1 2 3 4 5 6 7 80
0.1
0.2
0.3
0.4
0.5
0.6
0.7
0.8
0.9
1
Average depth
Packet delivery vs. network depthF
ract
ion
of p
acke
ts d
eliv
ered
Weather: 0.57*0.90depth
Burrow: 0.46*0.88depth
WeatherBurrow
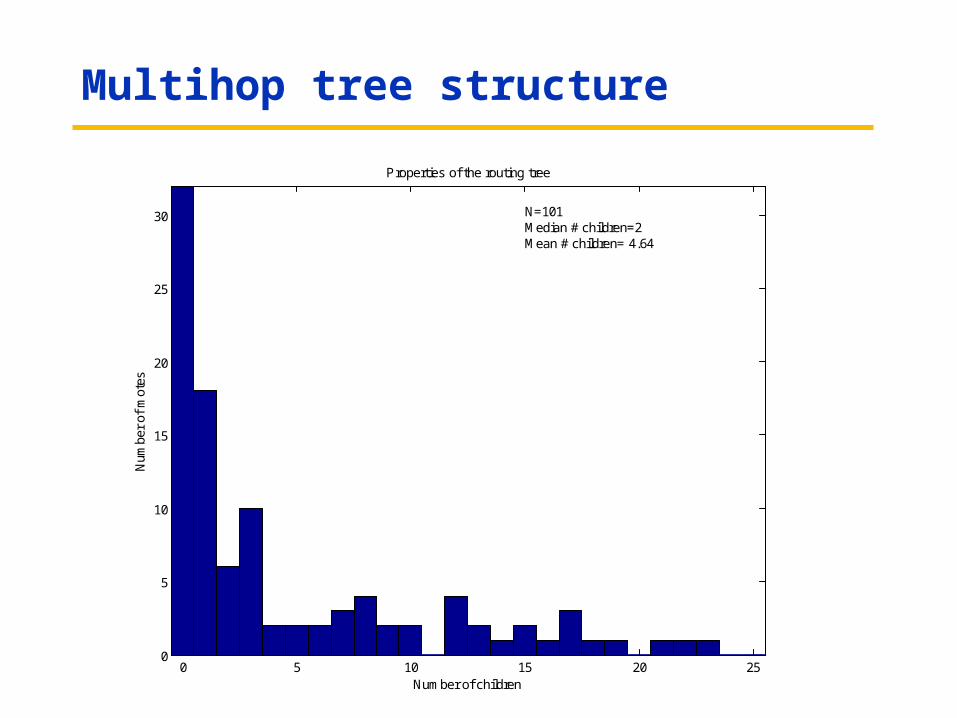
Multihop tree structure
0 5 10 15 20 250
5
10
15
20
25
30
Num
ber
of m
otes
Number of children
Properties of the routing tree
N=101 Median # children=2 Mean # children= 4.64
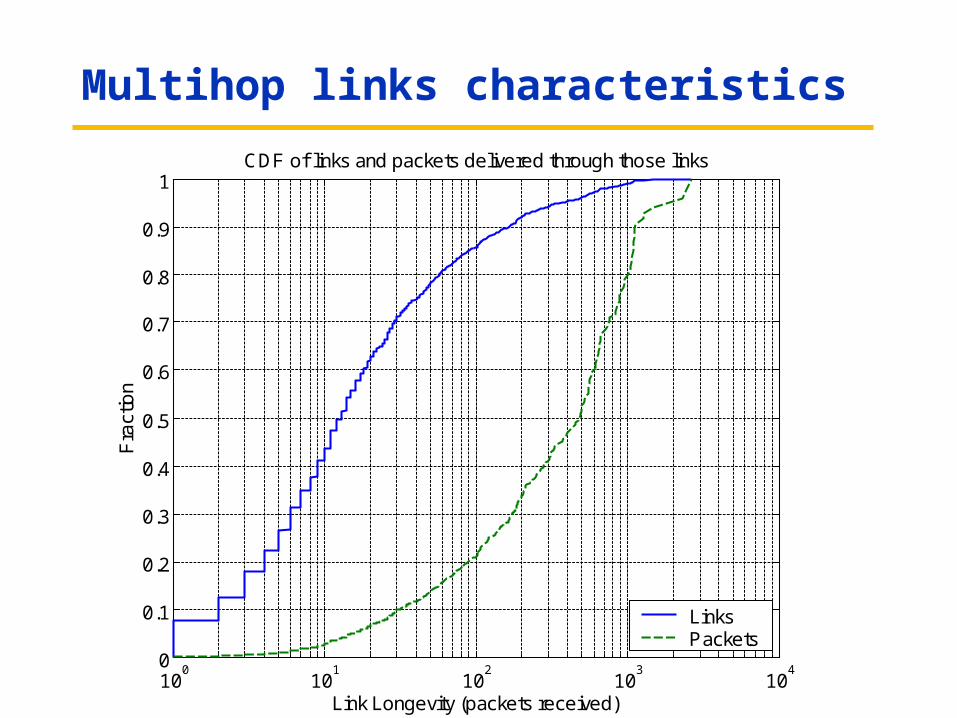
Multihop links characteristics
100
101
102
103
104
0
0.1
0.2
0.3
0.4
0.5
0.6
0.7
0.8
0.9
1CDF of links and packets delivered through those links
Link Longevity (packets received)
Fra
ctio
n
LinksPackets

Multihop network over time
07/06 07/13 07/20 07/27 08/03 08/10 08/17 08/24 08/31 09/07 09/14 09/21 09/28 10/05 10/12 10/19 10/260
50
100Time-series characteristics of the mutlihop network
07/06 07/13 07/20 07/27 08/03 08/10 08/17 08/24 08/31 09/07 09/14 09/21 09/28 10/05 10/12 10/19 10/260
0.5
1
1.5
2
07/06 07/13 07/20 07/27 08/03 08/10 08/17 08/24 08/31 09/07 09/14 09/21 09/28 10/05 10/12 10/19 10/260
0.5
1
1.5PC uptime fraction
Parent change-network size ratio
Active nodesParent changes

Multihop network dynamics
-0.5 0 0.5 1 1.5 2 2.50
0.1
0.2
0.3
0.4
0.5
0.6
0.7
Parent changes/network size
Fra
ctio
n o
f ti
me
inte
rval
s
Parent change rate distribution, weighted by network size, 6 hrs interval
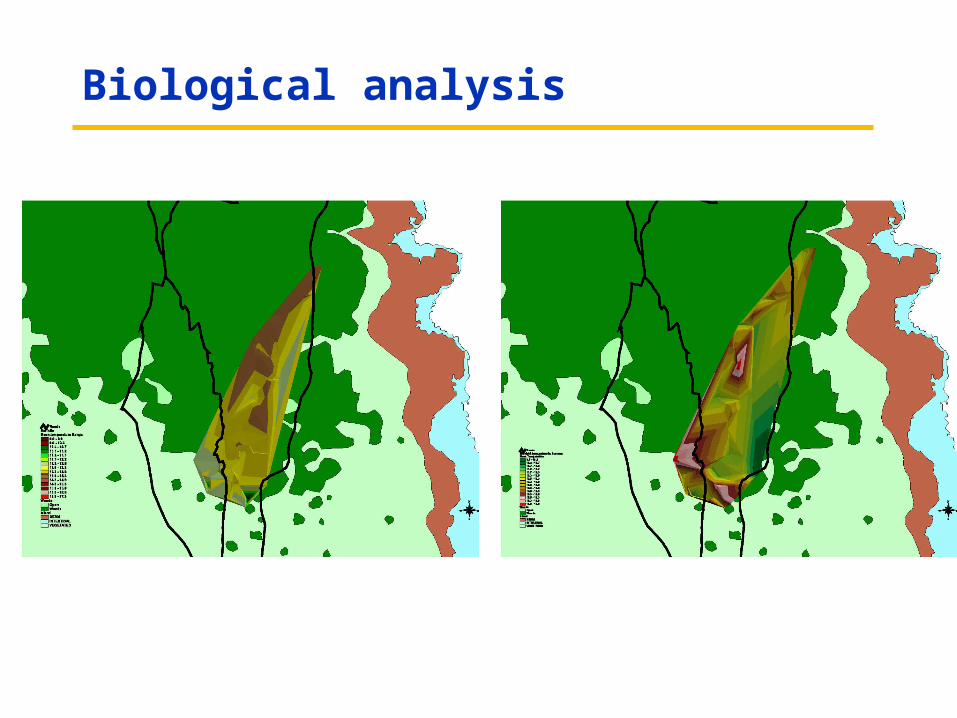
Biological analysis
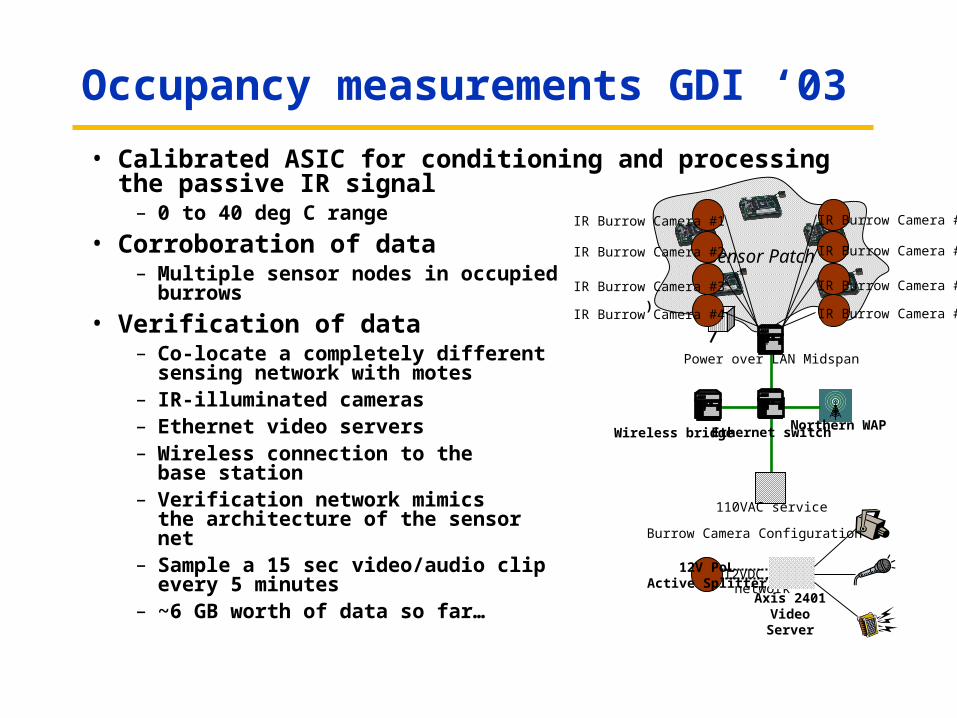
Occupancy measurements GDI ‘03
• Calibrated ASIC for conditioning and processing the passive IR signal
– 0 to 40 deg C range
• Corroboration of data– Multiple sensor nodes in occupied
burrows
• Verification of data– Co-locate a completely different
sensing network with motes– IR-illuminated cameras– Ethernet video servers– Wireless connection to the
base station– Verification network mimics
the architecture of the sensornet
– Sample a 15 sec video/audio clipevery 5 minutes
– ~6 GB worth of data so far…
Sensor Patch
Power over LAN Midspan
IR Burrow Camera #1
IR Burrow Camera #2
IR Burrow Camera #3
)IR Burrow Camera #4
IR Burrow Camera #5
IR Burrow Camera #6
IR Burrow Camera #7
IR Burrow Camera #8
Axis 2401 Video Server
12VDC, 0.9Anetwork
Burrow Camera Configuration
Northern WAPEthernet switchWireless bridge
12V PoLActive Splitter
110VAC service
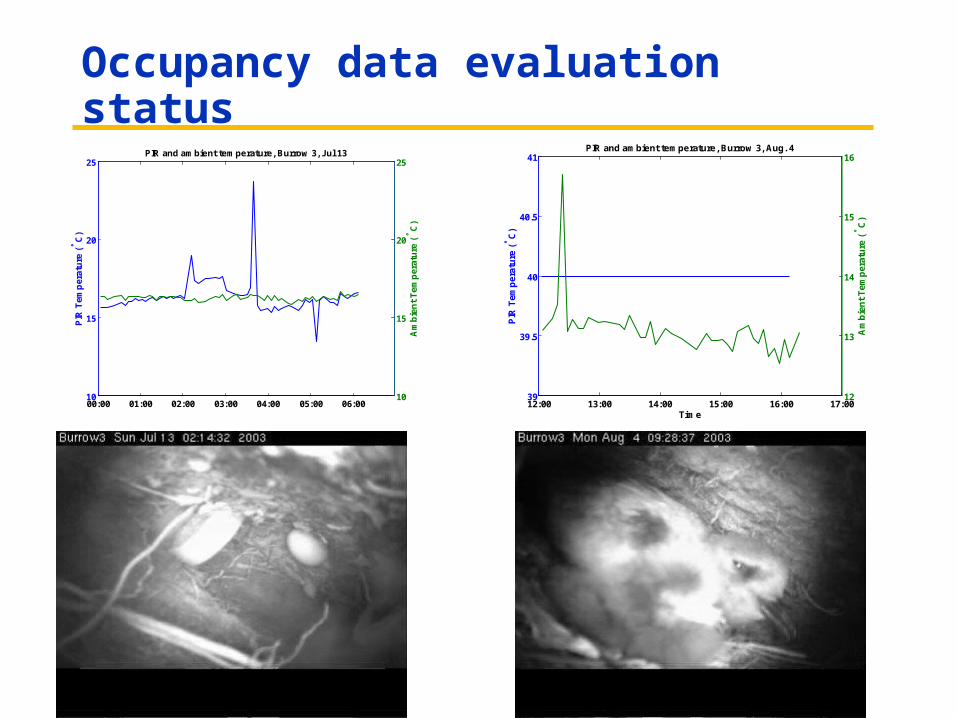
Occupancy data evaluation status
12:00 13:00 14:00 15:00 16:00 17:0039
39.5
40
40.5
41
Time
PIR
Tem
per
atu
re (
C)
PIR and ambient temperature, Burrow 3, Aug. 4
12
13
14
15
16
Am
bie
nt
Tem
per
atu
re (
C)
00:00 01:00 02:00 03:00 04:00 05:00 06:0010
15
20
25PIR and ambient temperature, Burrow 3, Jul 13
PIR
Tem
per
atu
re (
C)
10
15
20
25
Am
bie
nt
Tem
per
atu
re (
C)
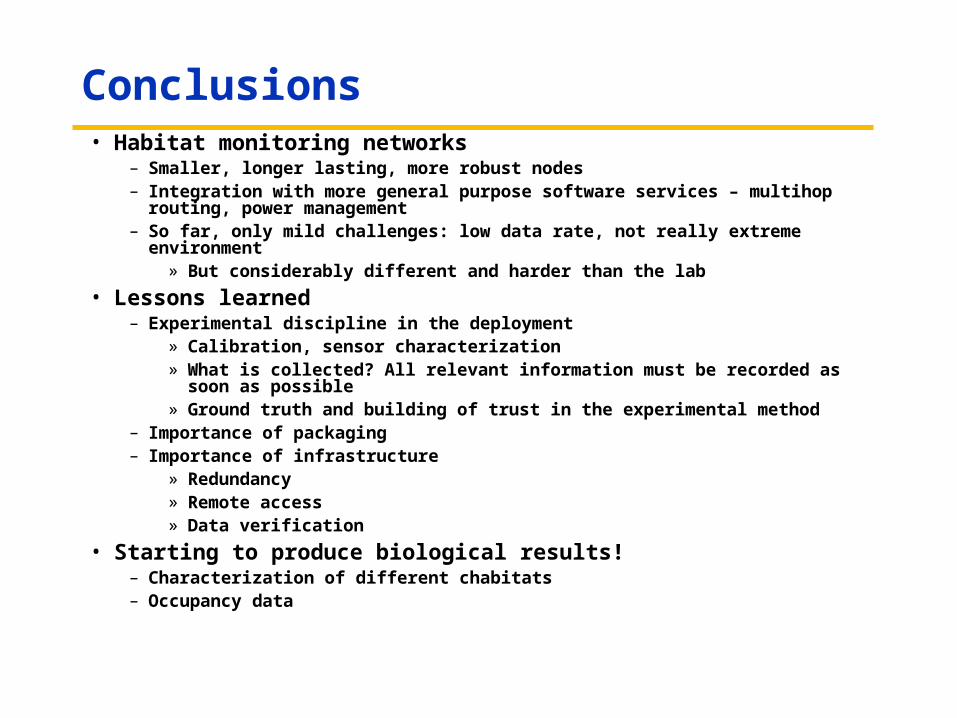
Conclusions• Habitat monitoring networks
– Smaller, longer lasting, more robust nodes– Integration with more general purpose software services – multihop routing,
power management– So far, only mild challenges: low data rate, not really extreme environment
» But considerably different and harder than the lab
• Lessons learned– Experimental discipline in the deployment
» Calibration, sensor characterization» What is collected? All relevant information must be recorded as soon as
possible» Ground truth and building of trust in the experimental method
– Importance of packaging– Importance of infrastructure
» Redundancy» Remote access» Data verification
• Starting to produce biological results!– Characterization of different chabitats– Occupancy data
Thank you!
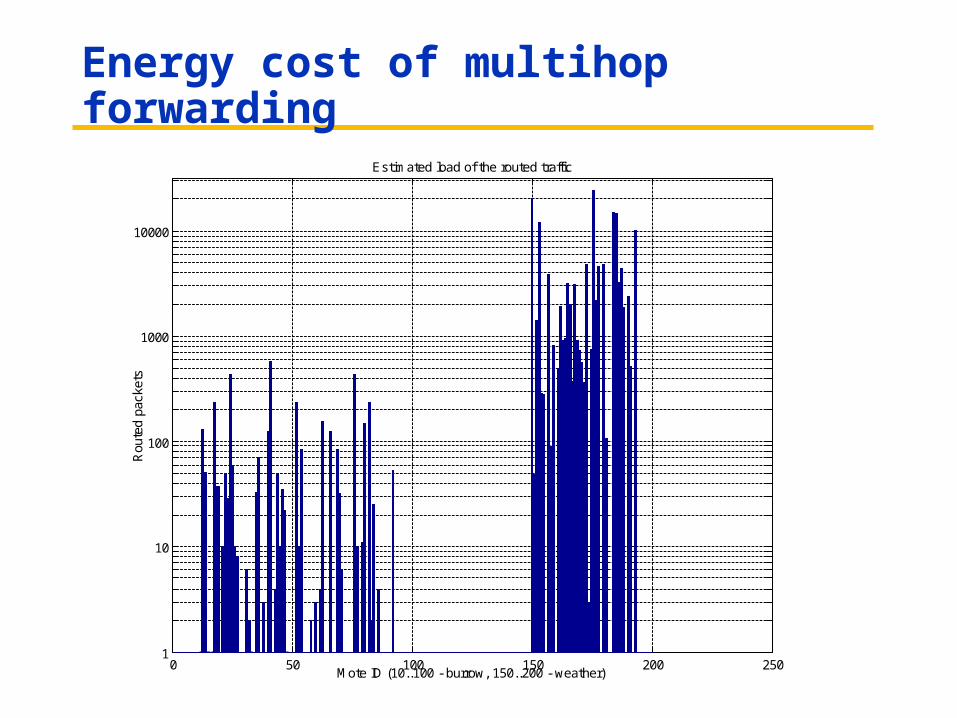
Energy cost of multihop forwarding
0 50 100 150 200 2501
10
100
1000
10000
Estimated load of the routed traffic
Mote ID (10..100 - burrow, 150..200 - weather)
Rou
ted
pack
ets
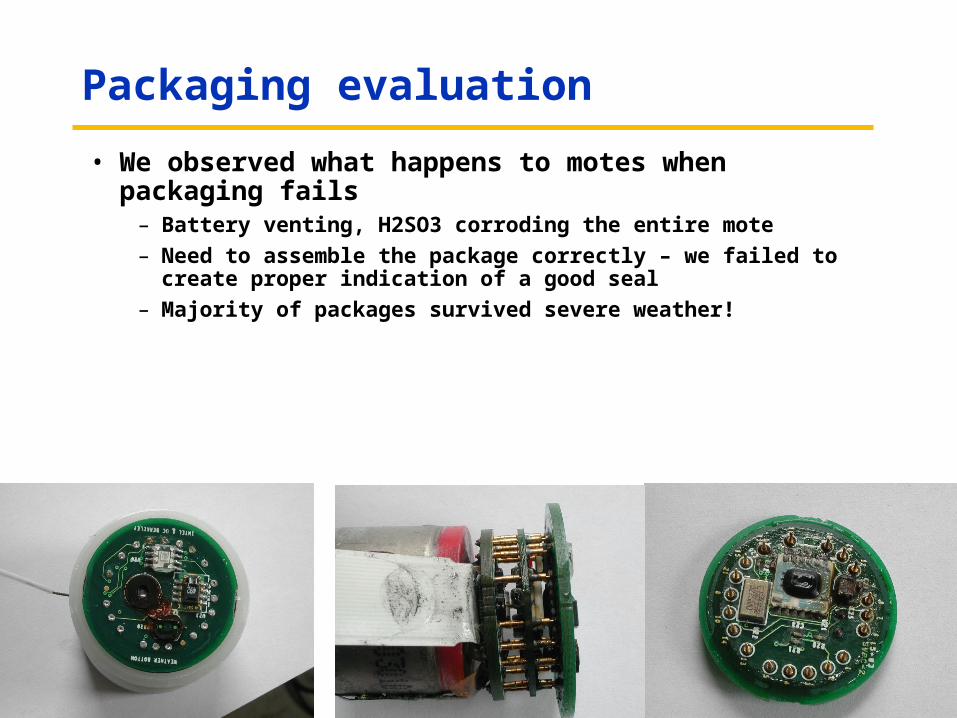
Packaging evaluation
• We observed what happens to motes when packaging fails– Battery venting, H2SO3 corroding the entire mote
– Need to assemble the package correctly – we failed to create proper indication of a good seal
– Majority of packages survived severe weather!
Ecological Conclusions to date
• Microhabitat variations exist, are measurable, and may not be fully captured by Macrohabitat classification schemes
• Burrows play a dramatic role in buffering occupants from variation in temperature and humidity
• There is no evidence that presence of motes per se constitutes a disturbance, but frequent visitation for maintenance may have been responsible for some abandonment
• Temperature and humidity sensors appear robust and give results within expected values and trends
• Some evidence for presence based on ambient temperature measurements, but needs verification with video and/or playback
Conclusions to date,Ecological/Technical:
• Voltage filtering removes many but not all spurious signals
• High variability in mote “talkback” rates may make precise pairing of data points difficult
• We are over-sampling, but that is probably good