gdi 2003: status report robert szewczyk joe polastre alan mainwaring david culler nest retreat, jan...
Post on 19-Dec-2015
217 views
TRANSCRIPT

GDI 2003: status report
Robert SzewczykJoe Polastre
Alan Mainwaring David Culler
NEST Retreat, Jan 15, 2004

Outline
• GDI
• Mote design
• Networking improvements
• Infrastructure redesign
• Conclusions
Design
Deployment
Analysis

Scientific motivation: Leach’s Storm Petrel• Questions
– What environmental factors make for a good nest? How much can they vary?
– What are the occupancy patterns during incubation?
– What environmental changes occurs in the burrows and their vicinity during the breeding season?
• Methodology – Characterize the climate inside and outsize the
burrow– Collect detailed occupancy data from a number
of occupied and empty nest– Spatial sampling of habitat – sampling rate
driven by biologically interesting phenomena, non-uniform patches
– Validate a sample of sensor data with a different sensing modality
– Augmented the sensor data with deployment notes (e.g. burrow depth, soil consistency, vegetation data)
– Try to answer the questions based on analysis of the entire data set

Application architecture
Base-Remote Link
Data Service
Internet
Client Data Browsingand Processing
Transit Network
Basestation
Gateway
Sensor Patch
Patch Network
Sensor Node

Sensor node evolution
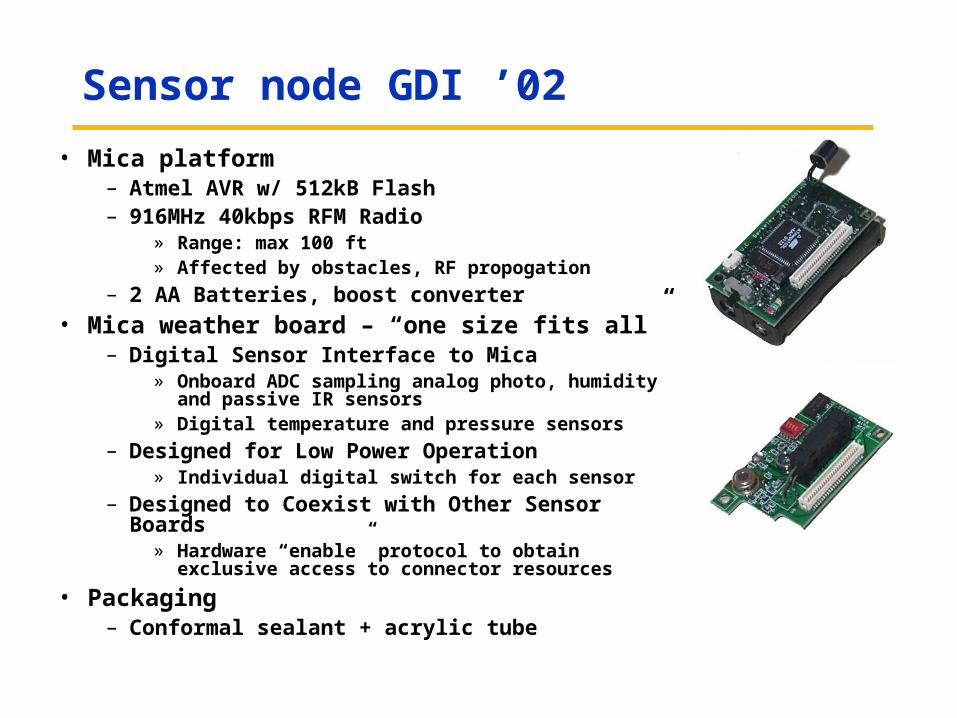
Sensor node GDI ’02
• Mica platform– Atmel AVR w/ 512kB Flash– 916MHz 40kbps RFM Radio
» Range: max 100 ft» Affected by obstacles, RF propogation
– 2 AA Batteries, boost converter
• Mica weather board – “one size fits all”– Digital Sensor Interface to Mica
» Onboard ADC sampling analog photo, humidity and passive IR sensors
» Digital temperature and pressure sensors
– Designed for Low Power Operation» Individual digital switch for each sensor
– Designed to Coexist with Other Sensor Boards» Hardware “enable” protocol to obtain exclusive access
to connector resources
• Packaging– Conformal sealant + acrylic tube

GDI ’02 population
• 43 distinct nodes reporting data between July 13 and November 18
• Heavy daily losses– Between 3 and 5% daily

Redesign directions
• Node-level issues that need resolving– Size – motes were too large to fit in many burrows
» Application specific packaging; minimize size of burrow package, base the system around mica2dot
– Packaging – did not provide adequate protection for electronics or proper conditions for sensors
» Waterproof plastic packaging to protect electronics» Design to provide both shielding and exposure to sensors
– Node reliability– Power consumption – boost converter not particularly useful
» Eliminate boost whenever possible, use stable voltage lithium cells
– Data interpretation challenges» Sensor calibration » Occupancy data interpretation – need more sophisticated
processing of sensor data and/or ground truth data» Better metadata – sensor location & conditions

Miniature weather station
• Sensor suite– Sensirion humidity + temperature
sensor
– Intersema pressure + temperature sensor
– TAOS total solar radiation sensor
– Hamamatsu PAR sensor
– Radiation sensors measure both direct and diffuse radiation
• Power supply– SAFT LiS02 battery, ~1 Ah @
2.8V
• Packaging– HDPE tube with coated sensor
boards on both ends of the tube
– Additional PVC skirt to provide extra shade and protection against the rain

Burrow occupancy detector
• Sensor suite– Sensirion humidity +
temperature sensor
– Melexis passive IR sensor + conditioning circuitry
• Power supply– GreatBatch lithium thionyl
chloride 1 Ah battery
– Maxim 5V boost converter for Melexis circuitry
• Packaging– Sealed HDPE tube, emphasis
on small size
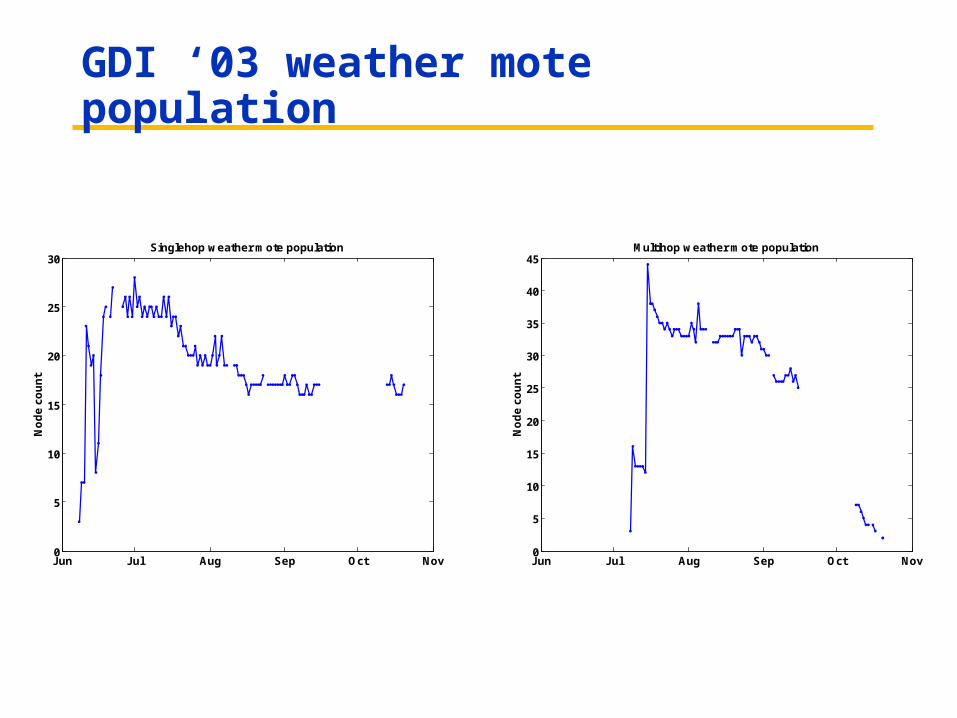
GDI ‘03 weather mote population
Jun Jul Aug Sep Oct Nov0
5
10
15
20
25
30
35
40
45
No
de
cou
nt
Multihop weather mote population
Jun Jul Aug Sep Oct Nov0
5
10
15
20
25
30
No
de
cou
nt
Singlehop weather mote population

GDI ‘03 burrow mote population
Jun Jul Aug Sep Oct Nov0
5
10
15
20
25
30
No
de
cou
nt
Single hop burrow mote population
Jun Jul Aug Sep Oct Nov0
10
20
30
40
50
60
70Multihop burrow mote population
No
de
cou
nt

Patch network GDI ‘02
• Single hop transmit-only network– 43 nodes, about 25 above ground, the rest in burrows– Repeater network – add an extra hop to improve connectivity
into burrows» Ran out of energy before it made any difference
– Sampling rates: 1 set of samples from every node every 70 seconds
» A compromise between response time (and ease of deployment) and expected power management behavior
– Application logic: sense (fix time), send, sleeep(fix time)» Expected that CSMA MAC backoff will effectively
desynchronize all nodes
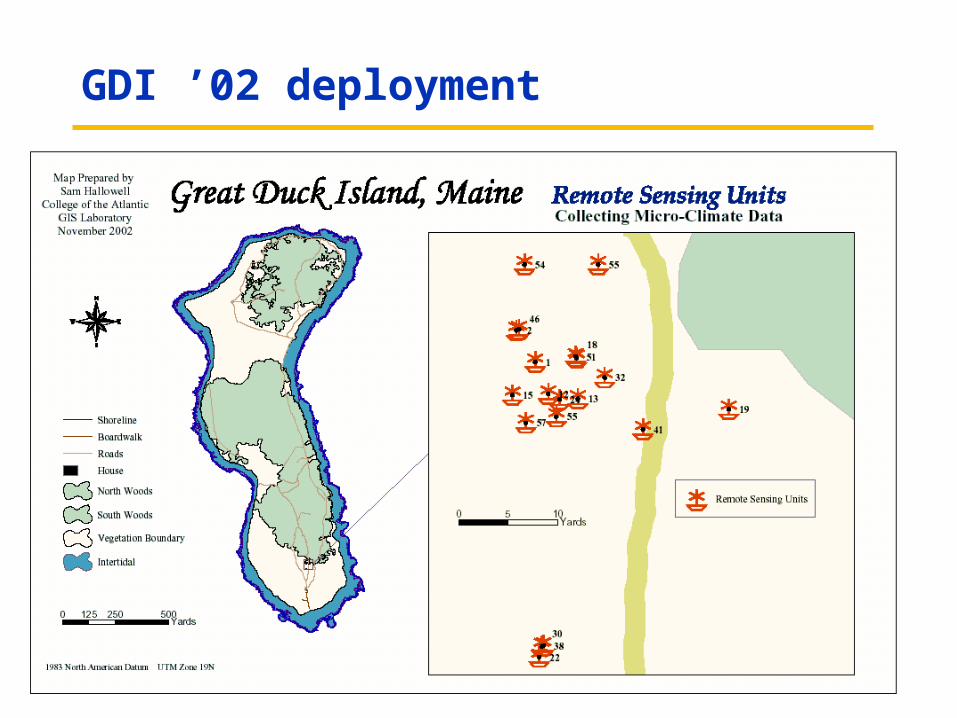
GDI ’02 deployment

Software architecture advances
• Bi-directional communication with low-power listenting
– 1% duty cycle
• Parameter adjustment and query– Sample rate changes, sensor status queries
• Improved power management scheme– Fine granularity through StdControl interface
– 10 uA sleep mode, 30 uA with running Timer.
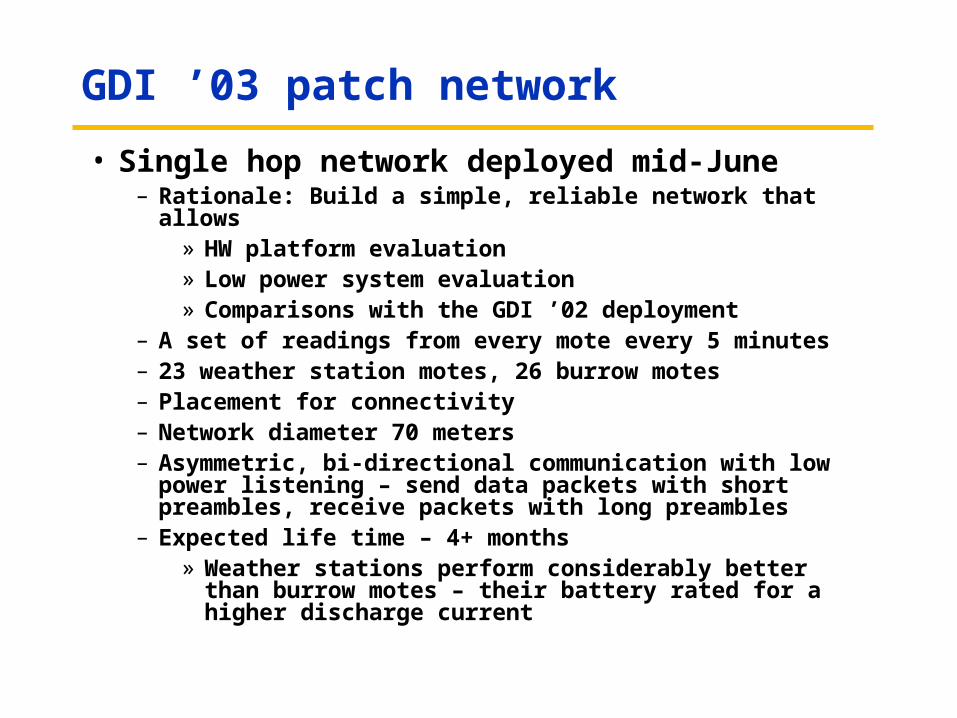
GDI ’03 patch network
• Single hop network deployed mid-June– Rationale: Build a simple, reliable network that allows
» HW platform evaluation» Low power system evaluation» Comparisons with the GDI ’02 deployment
– A set of readings from every mote every 5 minutes– 23 weather station motes, 26 burrow motes– Placement for connectivity– Network diameter 70 meters– Asymmetric, bi-directional communication with low power
listening – send data packets with short preambles, receive packets with long preambles
– Expected life time – 4+ months» Weather stations perform considerably better than
burrow motes – their battery rated for a higher discharge current

Packet yields
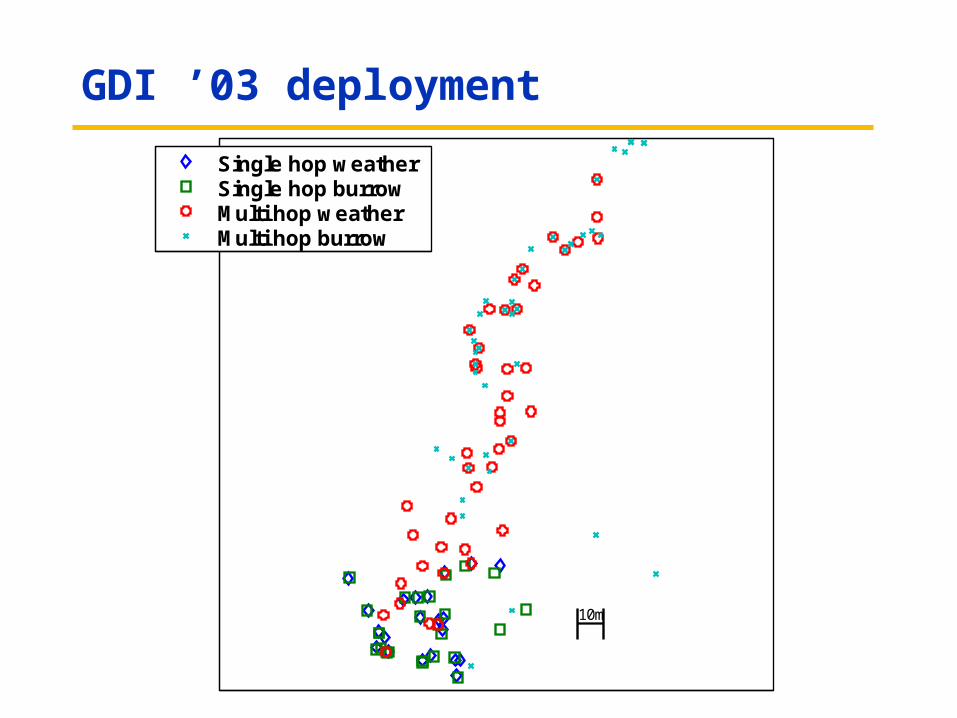
GDI ’03 deployment
10m
Single hop weatherSingle hop burrowMulti hop weatherMulti hop burrow
GDI ’03 Multihop network
• Motivation – Greater spatial reach– Better connectivity into burrows
• Implementation– Alec Woo’s generic multihop subsystem– Low power listening: tradeoff channel capacity for average power
consumption– Contrast with TASK approach: Alec’s multihop component but with
duty cycling on a loosely synchronized network
• The network nodes– 44 weather motes deployed July 17– 48 burrow motes deployed August 6– Network diameter – 1/5 mile– Duty cycle – 2% to minimize the active time (compromise between
receive time and send time)– Reading sent to base station every 20 minutes, route updates every 20
minutes. Expected lifetime: 2.5 months– 2/3 of nodes join within 10 minutes of deployment, remainder within 6
hours. Paths stabilize within 24 hours

Packet Yield

Topology stability
0 20 40 60 80 100 1200
500
1000
1500
2000
2500
3000
3500
Mote ID, ordered by number of received packets
Pac
ket
s re
ceiv
ed f
rom
a m
ote
Distribution of received packets. Color patches correspond to a particular parent.
Average messages per mote: 1055Average number of parents: 6.7

Parent-child link distribution
-0.2 0 0.2 0.4 0.6 0.8 1 1.20
0.1
0.2
0.3
0.4
0.5
0.6
0.7Distribution of parent-child relationship
Relationship fraction
Example of relationship fraction:
10% of packets from mote X have been
delivered through mote Y
Fra
ctio
n o
f lin
ks

Parent-child link longevity distribution
0 50 100 150 200 250 300 350 400 450 5000
0.05
0.1
0.15
0.2
0.25
0.3
0.35
0.4
0.45
0.5
Fra
ctio
n o
f lin
ks
Messages delivered over the link
Average messages delivered over a link: 158
Link longetivity distribution
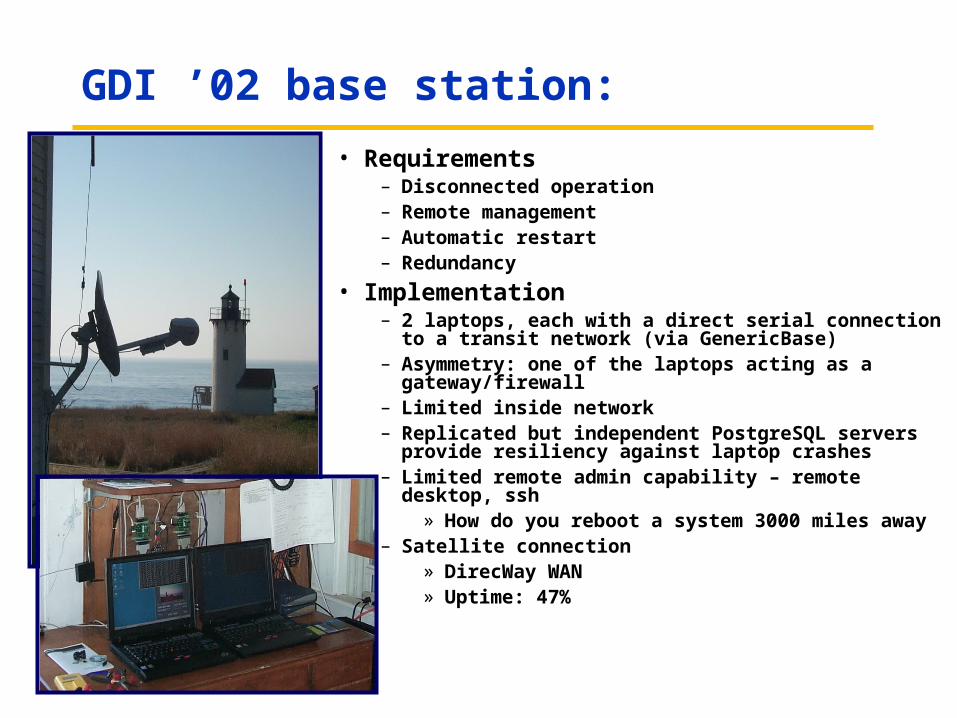
GDI ’02 base station:
• Requirements– Disconnected operation– Remote management– Automatic restart– Redundancy
• Implementation– 2 laptops, each with a direct serial connection to a
transit network (via GenericBase) – Asymmetry: one of the laptops acting as a
gateway/firewall– Limited inside network– Replicated but independent PostgreSQL servers
provide resiliency against laptop crashes– Limited remote admin capability – remote desktop, ssh
» How do you reboot a system 3000 miles away– Satellite connection
» DirecWay WAN» Uptime: 47%

GDI ’03 Base Station
• More sophisticated networking structure– Dual laptops with PostgreSQL– Dual base stations (Mica2 + EPRB)
» But one logs single hop the other logs multihop
– Cross logging of the data
• Vastly improved remote access– Remote wakeonlan– Web enabled power strip– Ubiquitous POE– VPN for direct access from authorized networks
• Extensible schema to accommodate new sensor modalities and query types, compatibility with TASK
• Main stumbling block– Power, power, power– Lack of redundancy on the transit net– Minor HW issues – outdoors is harshMica2-EPRB#2
IBM laptop #1DB
Web power strip
Axis 2130 PTZ South
Wireless bridge
4-port VPN router and
16-port Ethernet switch
Power over LAN midspan DB
IBM laptop #2
Mica2-EPRB#2
WWW power strip
Southern WAP
Satellite router
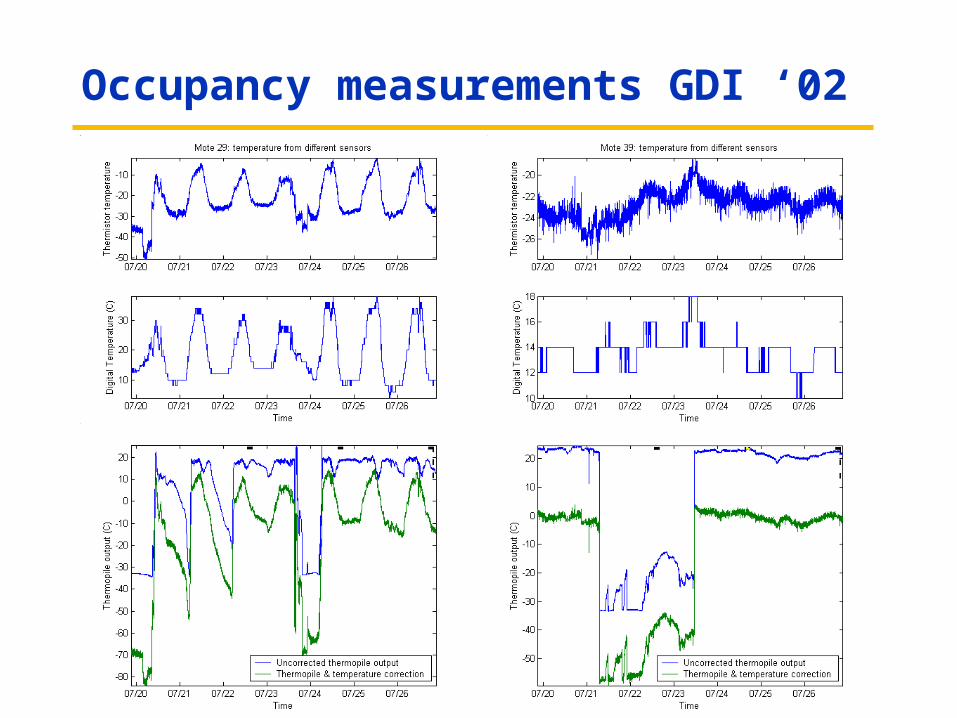
Occupancy measurements GDI ‘02

Occupancy measurements GDI ‘03
• Calibrated ASIC for conditioning and processing the passive IR signal
– 0 to 40 deg C range
• Corroboration of data– Multiple sensor nodes in occupied
burrows
• Verification of data– Co-locate a completely different
sensing network with motes– IR-illuminated cameras– Ethernet video servers– Wireless connection to the
base station– Verification network mimics
the architecture of the sensornet
– Sample a 15 sec video/audio clipevery 5 minutes
– ~6 GB worth of data so far…
Sensor Patch
Power over LAN Midspan
IR Burrow Camera #1
IR Burrow Camera #2
IR Burrow Camera #3
)IR Burrow Camera #4
IR Burrow Camera #5
IR Burrow Camera #6
IR Burrow Camera #7
IR Burrow Camera #8
Axis 2401 Video Server
12VDC, 0.9Anetwork
Burrow Camera Configuration
Northern WAPEthernet switchWireless bridge
12V PoLActive Splitter
110VAC service

Occupancy data evaluation status
• PIR data from website used for finding occupied burrows
• Saturated sensor outputs
• Video data analysis underway
– Entry/exit events
– Automatic video analysis
12:00 13:00 14:00 15:00 16:00 17:0039
39.5
40
40.5
41
Time
PIR
Tem
per
atu
re (
C)
PIR and ambient temperature, Burrow 3, Aug. 4
12
13
14
15
16
Am
bie
nt
Tem
per
atu
re (
C)
00:00 01:00 02:00 03:00 04:00 05:00 06:0010
15
20
25PIR and ambient temperature, Burrow 3, Jul 13
PIR
Tem
per
atu
re (
C)
10
15
20
25
Am
bie
nt
Tem
per
atu
re (
C)
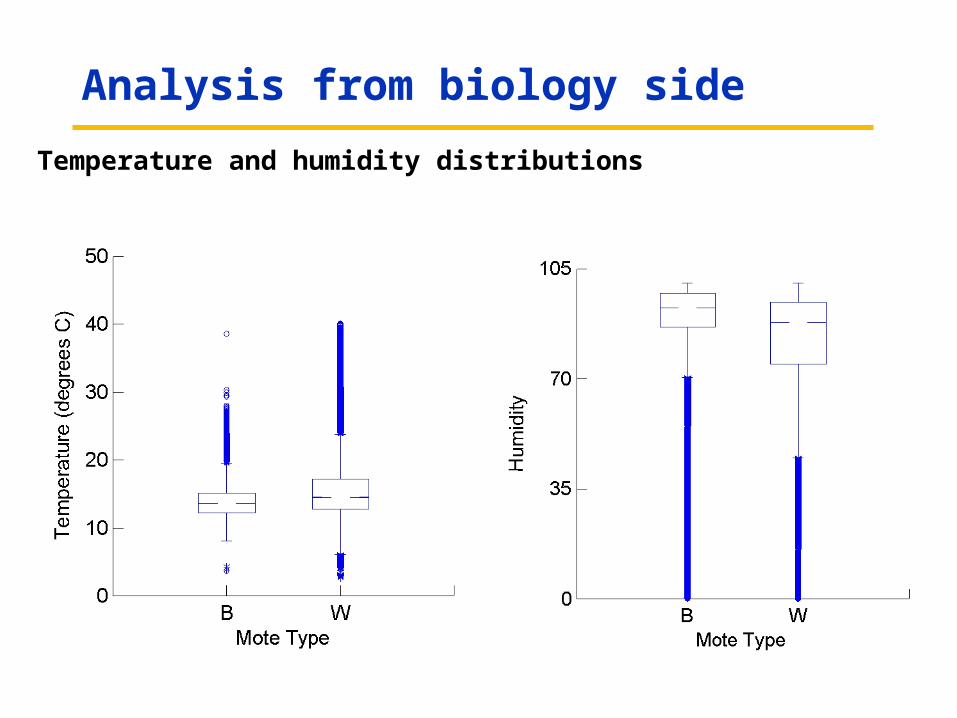
Analysis from biology side
Temperature and humidity distributions

Temperature and humidity in different habitats
M E WHabitat
0
7
14
21
28
35
Mea
n Te
mpe
ratu
re (
d egr
ees
C)
M E WHabitat
0
7
14
21
28
35
Mea
n Te
mpe
rat u
re (d
egre
es C
)
Weather stations Burrow motes

165 184 203 222 241 260Day of Year
0
10
20
30
Mea
n Te
mpe
rat u
re (
d egr
ees
C)
Climate data
165 184 203 222 241 260Day of Year
0
10
20
30
Mea
n Te
mpe
rat u
re (
d egr
ees
C)
Weather stations Burrow motes

Climate data: day-to-day variations,meadow
160170180190200210220230240250260Day of Year
0
10
20
30
Mea
n Te
mpe
ratu
re (
degr
ees
C)
140 160 180 200 220 240 260Day of Year
0
10
20
30
Mea
n Te
mpe
rat u
re (
d egr
ees
C)
Weather stations Burrow motes

Conclusions
• Another iteration on the design, deploy, analyze cycle
– 50+ node single hop network, 100+ node multi hop network– 4.5 months of operation – June 8 – October 20– 436 thousands weather station observations– 234 thousands burrow mote observations
• Improvements in the network quality– Longevity, reliability, features, power management, data
quality– Room for much more improvement – ease of packaging,
robustness
• Data analysis– Biologists are engaged– Video analysis for occupancy corroboration under way

Q&A
Thank You!
http://www.greatduckisland.net
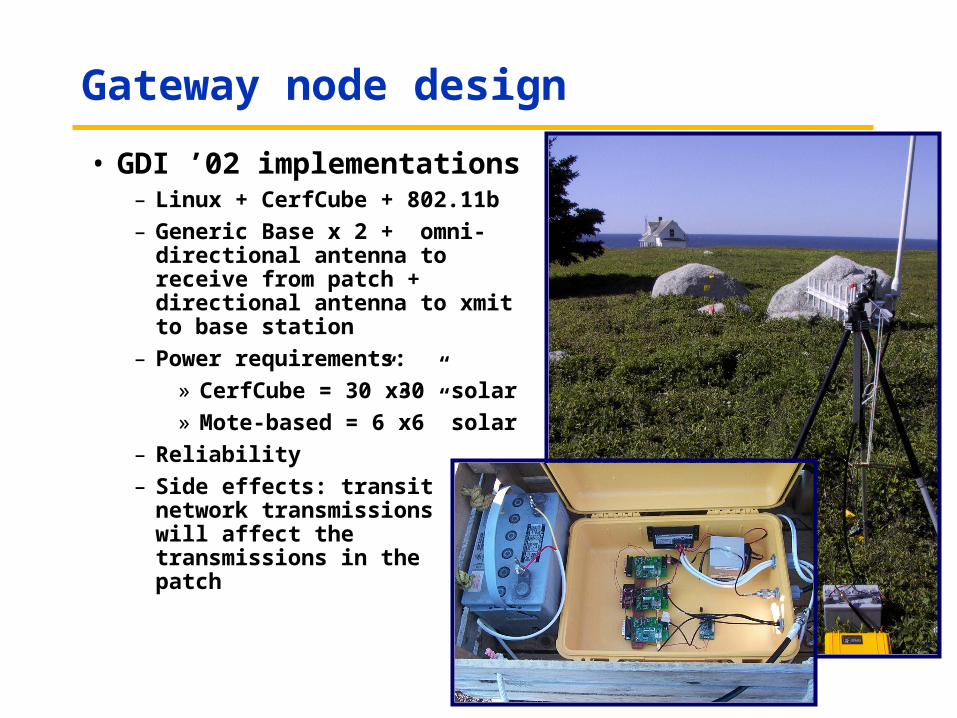
Gateway node design
• GDI ’02 implementations– Linux + CerfCube + 802.11b
– Generic Base x 2 + omni-directional antenna to receive from patch + directional antenna to xmit to base station
– Power requirements:
» CerfCube = 30”x30” solar
» Mote-based = 6”x6” solar
– Reliability
– Side effects: transit network transmissions will affect the transmissions in the patch

Gateway node design
• GDI ’03 design – keep elements that worked– Keep a mote-based system– Use different frequencies on patch and transit networks to
eliminate interference; different frequencies for single and multihop networks
– Asymmetrical bi-directional communication on single hop network – exploit low power listening & always-on gateways
– Symmetrical bi-directional communication in the multihop network
• Storage and processing– Keep it simple – No storage, processing, aggregation, etc.– Big disadvantages – removes a layer that could buffer
packets in case of transient failure elsewhere in the system (e.g. base station down)