habit-change climate change adapted management plan for
TRANSCRIPT
[Tastaţi text]
HABIT-CHANGE
Climate change adapted management plan for
Danube Delta Biosphere Reserve 23.1.2013
This project is implemented through the CENTRAL EUROPE Programme
co-financed by the ERDF

[Tastaţi text]
2
Output Number: 5.3.1 C Date: 23.1.2013
Title: Climate change adapted management plan for Danube Delta Biosphere
Reserve
Authors: Mihai Doroftei
Contribution of: Marian Mierlă, Silviu Covaliov, Cristina Nanu, Gabriel
Lupu (DDNI)
Project: HABIT-CHANGE – Adaptive management of climate-induced changes of
habitat diversity in protected areas
Programme: CENTRAL EUROPE Project
Number:
2CE168P3
Start date: 3/2010 End date: 2/2013
Lead Partner: Leibniz Institute of Ecological and Regional Development (IOER),
Germany
Project Partner: � University of Vienna, Austria
� National Academy of Sciences, Scientific Centre for Aerospace
Research of the Earth, Ukraine
� Thuringian State Institute for Forestry, Game and Fishery, Germany
� Potsdam Institute for Climate Impact Research, Germany
� Technische Universität Berlin, Germany
� Balaton Uplands National Park Directorate, Hungary
� Szent Istvan University, Hungary
� Biebrza National Park, Poland
� Environmental Protection Institute, Poland
� Triglav National Park, Slovenia
� University of Bucharest, Romania
� Central Institute for Meteorology and Geodynamics, Austria
� Danube Delta National Institute for Research and Development,
Romania
� SOLINE Pridelava soli d.o.o., Slovenia
� University of Maribor, Slovenia
� European Academy Bolzano, Italy
Contact: Marco Neubert, [email protected], +49 351 4679-274
Sven Rannow, [email protected], +49 351 4679-274
Further
information
www.habit-change.eu
3
CONTENT
1 Objectives of the climate-change adapted management plan (CAMP) 4
1.1 Purpose and goals of the CAMP 5 1.2 Introduction of an adaptive management concept 5 2. General site description 6
2.1 Basic information about CAMP area 6 2.2 Ecological and social situation 8 3. Habitat types Annex I in CAMP area 15
3.1 Description of habitat-types (Annex I) 15 3.2 Evaluation of conservation status 23 4. Habitats under climate change: Exposure, Sensitivity and potential impacts 32
4.1 Current climate and expected changes in climate data 32 4.2 Sensitivity of protected habitats 44 4.3 Expected impacts of climate change on protected habitats 48 5. Existing and expected pressures on habitats 56
5.1 Identification and evaluation of stakeholder dialogue 56 5.2 Description of expected land-use changes and resulting pressures on habitats 52 5.3 Interaction of climate and non-climate induced pressures 71 6. Management objectives and monitoring 77
6.1 Conservation and restoration goals specific for each habitat type 77 6.2 Monitoring of progress in obtaining objectives indicators for development of
conservation status 106
6.3 Monitoring of success of management actions indicators for evaluation of management measures
109
7. Climate Change Adapted Management 112
7.1 Description of adapted management strategies new and adapted strategies for CAMP area of whole investigation area
112
7.2 Time-frame and concept of stakeholder involvement during CAMP implementation 115

4
1. Objectives of the climate-change adapted management plan (CAMP)
The climate-change adapted management plan (CAMP) is a management plan that answers the urgent
question: How can protected area management respond to climate change and its impacts on protected
habitats? This CAMP in hand provides all information necessary to manage protected habitats towards a
Favourable Conservation Status even under changing climatic conditions. This CAMP is a result of the
revision of existing management plans, management practices and monitoring activities. It is designed to
help enhancing today’s management with regard to the best available knowledge about climate change
and its impacts on protected areas. In order to reduce existing uncertainties about climate change and its
impacts, the CAMP promotes a new management strategy called “adaptive management”.
The CAMP is a result of in-depths analyses and assessments that were carried out within the “HABIT-
CHANGE” Project as part of the ERDF-funded EU Central Europe Programme. A total of 17 partners and 24
associated institutions from 8 Central-European countries worked together to elaborate state of the art
information about projected climate changes, the assessment of potential impacts on protected habitats
and appropriate management options.
The CAMP is the basis for a management that is prepared for climate change. It gives detailed advice and
concrete recommendations for decision making under conditions of climate change. It supports all
management and adaptation processes in protected areas relevant for habitat management. It contains
target- and threshold-values that indicate when specific management actions should be taken to mitigate
the effects of climate change.
The objective of the climate-change adapted management plan (CAMP) is to enable protected area
managers to manage protected areas with habitats according to Annex 1 of the Habitats-Directive under
conditions of climate change. It is primarily meant as a supporting document for managers of protected
areas.
The CAMP provides information about:
1. How climate might change in the region of the protected area,
2. How sensitive protected habitats are to these changes in climate,
3. What impacts climate change might have on protected habitats and
4. How to manage protected habitats and obtain a favourable conservation status under expected and
already observed climatic conditions.

5
1.1. Purpose and goals of the CAMP
The impacts of climate change on protected areas call for the adaptation of management practices,
strategies and measures as they are found in management plans for protected areas. This CAMP is the
result of a revision of existing management plans, its goals, strategies and measures and the evaluation of
their suitability for changing climates. The purpose of the CAMP is to transfer scientific knowledge about
climate change and its impacts into practical on-site management actions in protected areas.
The CAMP has a special focus on Natura 2000 areas, since most of the studied habitats fall under the
habitat directive (Council Directive 92/43/EEC on the Conservation of natural habitats and of wild fauna
and flora). The main objective of adapting habitat management in HABIT-CHANGE investigation areas is to
maintain or obtain a “Favourable Conservation Status” of protected habitats (FCS) even under the
conditions of climate change. The CAMP exemplifies strategies and measures to obtain this objective. It
provides rules for decision making, supports all management processes in protected areas and specifies
advice on how to implement the concept of “active adapted management” in the protected areas,
including frequent monitoring of the achievement of objectives and adaptation of measures and strategies.
The main aims of the CAMP are:
• To analyse and evaluate advanced information about existing as well as expected pressures on
protected habitats and about existing as well as projected climatic conditions in the investigation
area;
• To assess impacts on habitats and to identify areas and habitats which need immediate and
adapted management;
• To enhance existing management plans to make them suitable to address new challenges posed by
climate change related-impacts;
• To introduce the concept of an adaptive management that consists of a choice of simultaneously
implemented alternative management measures, a monitoring programme to evaluate
management effectiveness and to track changes in natural resources and an intensified
stakeholder involvement;
• To provide recommendations for communication with relevant stakeholders and their participation
in an adapted management of the area.
1.2 Introduction of an adaptive management concept
Management of protected habitats should be based on a profound knowledge about the functional and
structural components and the conservation status of the habitat types. It should also be based on
knowledge about the effectiveness and efficiency of different management options and their impacts on

6
the conservation status. Unfortunately, the knowledge about complex natural systems like habitats, about
the impacts of climate change on these natural systems and about the effectiveness of different
management activities is still insufficient. But the lack of knowledge and understanding and the
uncertainties in projected climatic changes and responses to that change must not be an excuse for
inaction. Instead of hesitating with adaption, a concept of simultaneously managing and learning about
natural systems should be introduced in protected area management: adaptive management.
The introduction of an adaptive management is an answer to existing uncertainties and the lack of
knowledge about functions and processes in complex natural systems like habitats. The impacts of future
changes as well as possible management measures have to be monitored and evaluated within the
management process in order to learn about the managed resource and improve management decisions.
Adaptive management is one of the most recommended strategies to deal with climate change. It “allows
managers to determine systematically whether management activities are succeeding or failing to achieve
objectives.” (Williams et al. 2009, 57)
Main feature of an active adaptive management is the implementation of different alternative
management options at the same time and the systematic monitoring of the effectiveness and efficiency of
those options. In that way managers can reduce the uncertainty about possible system responses and gain
knowledge about processes and functioning of habitats and ecosystems. Basis for an adaptive management
is an intensive stakeholder involvement, the precise definition of (measurable) management objectives and
the identification of different management responses that shall be tested regarding their effectiveness.
The CAMP contains the basic elements and content necessary for the implementation of an adapted
management in the protected area, including frequent monitoring of status and management-
effectiveness indicators. The CAMP is designed to be the central information source and working basis for
protected area managers (regarding climate change adaptation).
2. General site description
2.1. Basic information about CAMP area
The Danube Delta is situated in the eastern part of Europe and lies at the intersection of 45oN (latitude)
with 29oE (longitude) - 45o24`30``N (latitude) and 28o10`50``E (longitude) on Cotul Pisicii, 45o9`30``N
(latitude) 29o42`45``E (longitude) on east of Sulina locality, 44o20`40``N (latitude) and 28o41`30``E
(longitude) on Capul Midia, 45o27`20``N (latitude) and 29o19`20``E (longitude) on Chilia Veche (fig.1)
(Gâștescu and Știucă, 2008).

7
Fig. 1 Location of DDBR in Europe
Danube Delta Biosphere Reserve (DDBR) was founded by Government Decision No. 983/1990 and by the
Law No. 82/1993. DDBR area includes two bioregions steppe and pontic (Doniță et al., 2005). The Danube
Delta Biosphere Reserve area is estimated at 580,000 ha (table 1). The actual delta, displayed between
Chilia, Sulina and Sf. Gheorghe branches, covers 2, 491 km2 with 29 types of natural or partly man-induced
habitats (Natura 2000 habitats classification). Inside this territory, the Danube Delta Biosphere Reserve has
structured the following areas: strictly protected areas – 20 (54337 ha); buffer areas (2,230 km2) situated
around the strictly protected zones in order to gradually reduce human pressure and transitional zones
enclosing all rural and urban settlements. Referred to the Black Sea ”0” level, 20,5 % of the Delta area lies
below this point and 79,5 % above it. The greatest extension (54,5 %) has the territory comprised between
0 and 1 meter high. The few marine levees – Letea, Caraorman and Sărăturile, or what has been left of the
Bugeac Plain in the south of Basarabia, that is, Chilia and Stipoc which rise up to 1 - 13 m, represent a small
percentage of the Danube Delta area (Posea et al., 2005; Gâștescu and Știucă, 2008). The biosphere reserve
concept does not exclude human activity provided it is integrated with environment, so that economic
actions fall in line with conservation and protection measures. Due to its international importance, the
Danube Delta was listed (1990) among the world network of biosphere reserves under the „Man and
Biosphere Programme (MAB)”. Under the RAMSAR Convention, to which Romania is a party since 1991, the
DDBR was singled out as wetland of international value, and major water bird habitat. Since the Danube
Delta and the Biosphere Reserve (covering over 50% of its surface area) belong to the world heritage, the
area was placed (1990) on the List of the World Cultural and Natural Heritage (Gâștescu and Știucă, 2008).
Table 1 General description of the CAMP area
Area 580,000 ha Population: rural/urban 9694 inhabitants (26 villages)/4601 inhabitants (1 town) with an annual average
decreasing of 2,5 ‰.
Administrative structure 8 administrative areas and local councils (Maliuc, Crișan, Clilia Veche, Sfântu Gheorghe, Ceatalchioi, C.A.Rosetti, Sulina and Pardina) (fig. 2)
Land transformation rate The current status of land transformation is moderate. The rate is increasing. From the total area involved (580,000 ha) 58.2 % of the area is in a natural state (river and marine levees with forests and pastures, canals, lakes, swamps - part

8
of them protected) and 41.8 % agricultural polders (400 km2), fish ponds (365
km2), forest plantations (64 km
2).
Arable lands The total area is 45773,7 ha. Most of the agricultural lands are unsustainable.
Forest rate The total area of natural forest is 5262,286 ha. Mostly riparian and sand dunes forests.
Protected area 20 protected areas representing 9.36% (54337 ha) from the total area of DDBR. Roșca-Buhaiova, Letea Forest, Răducu Lake, Nebunu Lake, Vătafu-Lunguleț, Caraorman Forest, Sărături Murighiol, Arinișul Erenciuc, Popina Island, Sacalin-Zătoane, Periteașca-Leahova, Doloșman Cape, Grindul Lupilor, Istria-Sinoe, Grindul Chituc, Rotundu Lake, Belciug Lake, Prundu cu Păsări Island, Ceaplace Island.
Main land use types Fish polders, agricultural polders, forest plantations and pastures.
Potentially hazardous
events
Water shortages, unexpected variations in temperature and precipitations for the same season, increasing presence of invasive species
Waste water treatment Existing drinking water supply classic solution (filtration & treatment) in Sulina, Maliuc and Chilia Veche. Partially drinking water supply in Pardina and Mila 23. Proposed drinking water supply in Plauru, Sălceni, Tudor Vladimirescu, Ilganii de Sus, Ilganii de Jos, Băltenii de Jos, Uzlina and Periprava.
Waste management There is no a sustainable waste management activity.
Main economic sectors Fishing, wood and reed exploitation, tourism, navigation,
Fig. 2 Population and settlements from the CAMP (DDBR) area
2.2. Ecological and social situation
2.2.1. Land use
The administration and management of DDBR is a complex process but linked to local government
structures that operate within the reserve. They comprise DDBR lands under national control, lands under
local government control, and lands privately owned, distributed among seven local councils and the town
of Sulina (fig.3). According to Law No. 69/1991, the local councils include elected bodies that make all

9
decisions relating to land under their control, including development planning and control, public works,
conservation of historical monuments, recreation facilities and protection and improvement of the
environment in order to better the quality of life. The next level of government is Tulcea County Council,
which coordinates various communal services on behalf of the local councils, and takes responsibility for
land under its own control, town planning, maintaining and improving the infrastructure (roads and water
supply). Within the DDBR, the Tulcea County Council controls fish areas, agricultural polders and forest
plantations (about 860 km2) used by companies in which the state holds a majority share (Gâștescu and
Știucă, 2008).
Fig. 3 Land use map of the Danube Delta Biosphere Reserve – Romania
The Danube Delta land-use structure is the following: 58.2 % of the area is in a natural state (river and
marine levees with forests and pastures, canals, lakes, swamps - part of them protected) and 41.8 %
agricultural polders, fish ponds, forest plantations. Noteworthy, the Danube Delta is to undergo some
ecological management. Since ancient times, fishing has been the main occupation of the Danube Delta
inhabitants and although today the supply of fish has diminished and changed in quality, it continues to be
basic trade. A second major occupation has been (and still is) sheep and cattle breeding. Traditional
agriculture has been practiced successfully by the inhabitants of the settlements situated on the fluvial

10
levees at low risk from flooding. After 1960, these traditional occupations were drastically modified by the
extension of reed exploitation (later abandoned), fish ponds, large agricultural polders (also partly
abandoned) and forest plantations. The fishing includes the netting and trapping of freshwater fish, netting
of migratory fish (like sturgeons, Danube herring and Black Sea salmon) and netting or line fishing of fish in
the Black Sea. Catches of fish have declined from around, 15,000 tonnes (10 – 20,000) in the 1960s, to 5 –
6,000 tonnes by 1994 (Posea et al., 2005). The construction of polders in the late 1950s and 60s, to create
farm and forest areas, reduced the area of the „Danube meadow” available in the flood season for
spawning by carp and other commercially valuable species. Fishing activities are therefore zoned to enable
some areas to remain unexploited. These efforts need to be combined with effective controls of poaching
and overfishing.
2.2.2. Stakeholder structure
Danube Delta Biosphere Reserve Administration (DDBRA), Romanian National Forests Administration,
(ROMSILVA), State Estates Administration, Romanian Waters Administration (ANAR), National Agency of
Land Improvement (ANIF), Maritime Danube Ports Administration (APDM), River Administration of the
Lower Danube (AFDJ) and Sulina Free Zone Administration (AZL) are national estates of public interest.
Other stakeholders are the Tulcea County Council which is an estate of public interest at regional level,
local communities and private companies (table 2).
The role of the Danube Delta Biosphere Reserve Administration (DDBRA) is to administer the management
and protection of the delta’s natural and human resources – an important socio-economic and not just a
regulatory role. The rangers carry out observations and they help to monitor activities. They also act as the
local representatives of the administration and they are called on to provide advice to local people as well
as visitors.
Tabel 2 Stakeholder structure
Total surface of Danube Delta Biosphere Reserve 580,000 ha
Marine buffer area managed by DDBRA 103, 000 ha
Continental area of DDBR 477,000 ha
Continental area of DDBR 477,000 ha
1. Estates of national public interest
Danube Delta Biosphere Reserve Administration (DDBRA) 345,420 ha
Natural patrimony (Danube River, branches, channels, lakes, swamps, reed areas, renaturated areas, strictly
protected and buffer areas
Romanian National Forests Administration, (ROMSILVA) 6,442 ha
Natural forests, forest plantations
State Estates Administration 4,500 ha
Experimental fields (Rusca, Maliuc, Uzlina + Fish Polder Caraorman), agricultural areas
Other stakeholders
ANAR (flooding defence dikes), ANIF (suction basins, irrigation systems, hydro-technical constructions,
channel II și channel V), APDM (maritime ports of the Danube), AFDJ (hydro-technical construction on Sulina

11
channel), AZL (Sulina Free Zone Administration)
2. Estates of county public interest
Tulcea County Council 71,292 ha
Agricultural Polders, Fish Polders
3. Estates of local public interest
Local Council communities 12585 ha
Agricultural Polders, Fish Polders, Administrative areas
4. Estates of private interest
Tourist resorts, fisheries and land owners
Effective management is based on well-informed decisions and data that enable value judgments to be
made – not just subjectively, but on sound and reliable data. The DDBRA also needs to have the
information available to it, so it can propose proven and necessary changes in legislation, where these
affect the DDBR.
2.2.3 Morphohydrographic units
The main morphohydrographic categories are predeltaic territories, river and marine sand banks, the
network of river channels and canals, lakes and swamps. Predeltaic territories are located in the Bugeac
area to the north of the Chilia branch of the river. They account for 2.4 % of the delta’s area. Sea currents
are primarily responsible for the way in which marine sandbanks are formed and they tend to lie parallel to
the line of the coast. The initial banks were formed in the Letea, Caraorman and Crasnicol areas (Posea et
al., 2005). The network of rivers, side channels and canals determines the way in which water is able to
move through and around the delta. Dredging of the main channels, including some of the smaller ones
that are used by commercial fishermen and tourists, maintain water flow. The lakes in the delta are
arguably the most important morphohydrographic category, in that some are now strictly protected areas.
Swamps lie between – 0.5 to 1 metre above water level and they surround lakes in the depression zones
within the delta. They tend to be inundated during early summer, when melt waters from the mountains
swell the volume of the Danube as it runs into the delta. Marsh or swamp vegetation still covers 143,500 ha
or 43 % of the delta’s area (Gâștescu and Știucă, 2008).
2.2.4 Hypsometry
The Danube Delta is a very low flat plain, lying 0.52 m above Mean Black Sea Level (MBSL) with a general
gradient of 0,006 m/km. Situated close to the Black Sea level, in the case of the Danube Delta, the
hypsometry is limited to very narrow range of value. The maximum difference in altitude is 15 m and is
given by the highest point (+12,4 m) of the Letea dunes and the lowest lake bottom (-3 m) from the marine
part of the delta. Compared to the Black Sea level, only 20.5 % of the delta area is below 0 m. The rest (79.5
%) is above 0m the most of which (54.6 %) is in the range 0 – 1 m above MBSL. If, the 1 – 2 range (18.2 %)
and that of below 0 m are added to this range, more than 93 % of the delta area is within the 3 m range of
hypsometry (Gâștescu and Știucă, 2008).
12
2.2.5 Vegetation units
The main types of vegetation are marshy, aquatic, beach and sea dunes, forests flood lands, steppe and
forest dunes (fig.4) (Hanganu et al., 2002). The static freshwater ecosystems provide the base for the food
chain in much of the delta. Terrestrial ecosystems have suffered less than aquatic ones, because they are
less easy to pollute and over use. Exploitation by grazing, arable cropping, forestry, reed cutting is limited
to areas where this is possible and in much of the delta these potentially damaging activities are impossible
(Gâștescu and Știucă, 2008). 29 habitat types, identified in Danube Delta are included in Habitat Directive
and represents 39,59 % from total area of Danube Delta Biosphere Reserve.
Fig. 4 Vegetation units of DDBR
2.2.6 Soils
The soils found in the delta are largely of riverine origin (fig.5). Alluvial soils are typically young soils that
make up the sandbanks in the delta and which receive fresh alluvia during times of flood. These soils are
important in farming districts, but they tend to break down to form dusts – leading to the formation of
surface crusts (Munteanu and Curelariu, 1996). Limnosols (LM) include lake and lagoon deposits. They
consist of fine sediments, organic material and calcium carbonate deposited during the summer. Gleyed
soils (GC) are the most important component within the soil cover of land between 0 – 0.5 metres. Most
develop on alluvial soils but they have also formed on loess deposits. Psamosols (PS) or sandy soils are

13
associated with sandbanks and dunes in the marine sectors of the delta. They are ecologically very
important, because of the plant communities they support. Soloneac (SC) soils occur in zones typified by
salty groundwater and they are particularly well developed in dune slacks in areas. Solonet (SA) soils are
very restricted in distribution to areas in the eastern part of Câmpul Chiliei (Munteanu and Curelariu,
1996). These loess-based soils are better drained than soloneac soils, in that salty water lies at 2 – 2-5
metres and not at or just below the soil surface. Grey soils (GA) characteristic calcium-rich steppe soils that
have developed within dry continental climate areas. They are well drained and the highest areas are used
for arable cultivation, whereas those closer to the water table are used for grazing. Chernozems (CZ) are
spread on thick deposits of loess in the southern Câmpul Chiliei and Stipoc dune areas. They tend to be
gleyed and the land they overly is used mainly for grazing (Gâștescu and Știucă, 2008). Histosoils (HS) are
the most abundant in the delta and they tend to have depths of more than 0.5 metres of organic material,
usually unhumified. They are formed when undecomposed roots, rhizomes, stems and leaves of sedges,
reeds and reed-mace build up under anaerobic conditions. Anthroposoils (AN) are primarily those that owe
their location to mans’ activities, like the creation of soil banks during dredging operations. They consist
mostly of alluvial deposits, mixed with organic material and plant remains (Munteanu and Curelariu, 1996;
Gâștescu and Știucă, 2008).
Fig. 5 Texture and type of soils in DDBR
2.2.7 Hydrology
The hydrological regime basically the water circulation represents the vital component of the very
existence of the delta space (fig.6) (Driga, 2004; Posea et al., 2005). Since the water volume transported by
the Danube to Ceatal Chilia is 205 km3/year at a multiannual mean of 6,515 m3/sec (1921 – 2000) and with

14
it a quantity of alluvia of 58.75 million t/year (the average for the same period), and 90 million tons of
salts/year corresponding to a mineralisation of 350 mg/l and 2,576.1 * 1012 Kcal. This sub-system is
undoubtedly playing a basic role within the configuration and evolution of the delta space. Of the matter
and energy transported by the Danube, 95 % reaches the three arms and flows into the sea, and only 5 % is
taken over by the network of backwaters and canals. Characteristic flow values: mean discharge 6,515
m3/sec; maximum discharge 15,500 m3/sec (June, 1970), and minimum discharge 1,350 m3/sec (October,
1921) (Driga, 2004). The yearly Danube flow variations registered at Ceatal Chilia record a winter minimum
and maximum, a spring-summer maximum and a much higher minimum in autumn, the cycle ending in a
low autumn maximum. The highest discharge was registered in May (11.46 % of the annual value) with
lowest rates in October (5.51 %); it can be estimated that nearly 33 % of the annual discharge takes place in
the April-June interval, while September – November is left with only 17 – 18 %. The distribution of
discharge on the main Danube arms (Chilia and Tulcea, the latter branching out into Sulina and Sfântu
Gheorghe) is uneven, with more or less significant variations over the last 150 years (Driga, 2004). The
water balance of one lake alone, considering its perimeter to stretch as far as the reed plots or floating
reed isles on the edge of the lake, has but a theoretical relevance for practical purposes, the water balance
should be estimated for the whole depression, which contains several lakes, that is a lake complex
(Gâștescu and Știucă, 2008).
Fig.6 Hydrology system of the CAMP area

15
3. Habitat types Annex I in CAMP area
3.1. Description of habitat-types
The description of the habitats types was made in accordance with Doniță et al. (2005) and Gafta and
Mountford (2008) as follows:
1. 1110 Sandbanks which are slightly covered by sea water all the time
Sandbanks are topographical shapes, elevated, elongated, round or irregular, permanently submerse and
predominantly surrounded by deeper waters. Over a sandbank, the depth of water rarely exceeds 20m
below the hydrographical level zero. Nevertheless, sandbanks can extend deeper than 20m below the
hydro graphic level zero.
In DDBR, the sector of the Black Sea area this habitat is present as follows:
• Medium sands under the shape of submarine dunes, with medium-sized druses which, under the
action of strong currents and waves, make submerse banks (hydraulic dunes) parallel with the shore.
Through the accumulation of sand in time, these banks may become sunk, thus becoming moving
islands or permanent sand strips (e.g. Sacalin Island in front of the mouth of Sf. Gheorghe).
• Shallow-water soft sands, mixed with remains of shells and pebbles, displayed from the shore to the 3-
4 m isobaths. This type is present from the mouths of The Danube to Constanta, sheltering soft-sands
community with Lentidium mediterraneum.
• „Camca” from the mouths of The Danube is seen in shallow-watered sheltered areas, on the Danube
Delta shore. “Camca” is a dense vegetal-detritus suspension of continental origin, especially made of
broken-up reed remains (Phragmites sp.). Due to stagnancy and decomposition, either hypoxic or
anoxic conditions determine the installation of crustaceous, polychetes worms and nematodes fauna.
Vegetation: Zosteretum marinae Borgesen ex van Goor 1921; Zosteretum noltii Harmsen 1936.
Presence in CAMP area: sea side area
2. 1130 Estuaries
The downstream area of a river, exposed to tides and extending from the brackish waters limit; Rivers’
estuaries are coast’s inlets where, unlike the habitat 1160 (sea branches and shallow-watered big bays),
there is generally a substantial influence of fresh waters. The mix of fresh water with sea water and the
reduced flows of currents within the estuary shelter lead to the deposit of fine sediments, often forming
intertidal sand-and-mud deposits. In the places where the currents are stronger than the flow, the most of
sediments are deposited and form a delta at the estuary’s mouth.
Such processes occur at The Danube’s flowing gates and in the Musura and Sacalin’s Bay (at the connection
with The Black Sea’s waters, from the front of them to the 20 m isobaths), where habitats and physical –
chemical parameters are features of estuary waters.
Presence in CAMP area: Musura and Sacalin’s Bay
3. 1140 Mudflats and sand flats not covered by seawater at low tide
Sand flats and mudflats on connected seas’ coasts and related lagoons, not covered by the sea water at
ebb time, lacking in vascular plants, usually covered by blue algae and diatoms.

16
Medio-littoral sands, which occupy the shore sand strip where waves are broken. At The Black Sea, this
strip is however limited (from +0,5 to -0,5 m), due to insignificant amplitude of tides. The characteristic
species for the Romanian southern-littoral beaches bivalve Donacilla cornea, while for the Danube Delta’s
beaches, the amphipod species Pontogammarus maeoticus.
Presence in CAMP area: sea side area
4. 1150* Coastal lagoons
Lagoons are extents of coastal salty water, shallow-watered, with variable salinity and water volume, either
totally or partially separated from the sea through sandbanks or gravel or, more rarely, rocks. Salinity may
vary from brackish to hyper-alkaline, depending on the amount of precipitations, evaporation intensity,
fresh sea water during storms and the temporary flooding with sea water during winter or flux.
Vegetation: Ruppietum maritimae (Hacquette 1927) Iversen 1934.
Because of the impact caused by hydro-technical work, the typical lagoon conditions are met especially in
Sinoe Lagoon. Here, the salinity is very variable, the border line between fresh and salty waters being able
to move hundred metres more times a day under the wind influence, thus simulating the conditions of a
lagoon with tide. The fauna comprises characteristic fish species (Percarina demidoffi, Pelecus cultratus,
Mugil sp., Liza sp., Alosa sp.) and reptiles (Emys orbicularis, Natrix tesselata).
Presence in CAMP area: On the Romanian territory of The Black Sea, this habitat is represented by the
lagoon complex of Razelm – Sinoe and Zăton Lake.
5. 1160 Large shallow inlets and bays
These shallow-watered surfaces are generally sheltered from wave’s action and comprise a large diversity
of sediments and sub-layers, with well-outlined areas of benthic communities. These communities
generally have a large biodiversity. The limit of the shallow water is sometimes marked by the distribution
of plant communities of Zosteretea and Potametea.
Vegetation: Najadetum marinae Fukarek 1961.
Along the Romanian coasts of The Black Sea, this type of habitat is represented by: Musura Bay and Sacalin
Bay. On the muddy sands situated within the sheltered shallow areas, a flora and fauna with marine and
brackish elements are developing.
Presence in CAMP area: coastal areas of DDBR
6. 1210 Annual vegetation of drift lines
Annual or both annual and perennial plant formations, occupying deposits of coarse material brought by
marine currents and gravels rich in nitrate organic matter (Cakiletea maritimae p.p.).
Vegetation: Atripliceto hastatae-Cakiletum euxinae Sanda et Popescu 1999; Argusietum (Tournefortietum)
sibiricae Popescu et Sanda 1975; Salsolo-Euphorbietum paralias Pignatti 1952 salsoletosum ruthenicae Pop
1985; Lactuco tataricae-Glaucietum flavae Dihoru et Negrean 1976.
Presence in CAMP area: coastal areas of DDBR from Musura Island (north) to Midia Cape (south)
7. 1310 Salicornia and other annuals colonizing mud and sand

17
Formations especially or predominantly made up of annual species, particularly of Chenopodiaceae, genus
Salicornia sp. or grass species, which colonizes the muddy or sandy areas, periodically flooded, of marine or
interior salty swamps.
Vegetation: Salicornietum prostratae Soó (1947) 1964; Suaedo-Salicornietum patulae (Brullo et Furnari
1976) Géhu 1984; Acorelletum pannonici Soó 1939; Hordeetum maritime Șerbănescu 1965; Suaedetum
maritimae Soó 1927; Suaedo-Kochietum hirsutae (Br.-Bl. 1928) Țopa 1939; Salsoletum sodae Slavnic (1939)
1948.
Presence in CAMP area: marine sand dunes on Letea, Caraorman, Cardon, Grindul Lupilor, Grindul Saele,
Istria, Portița and Sf.Gheorghe.
8. 1410 Mediterranean salt meadows (Juncetalia maritimi)
Diverse Mediterranean and west-pontic communities (The Black Sea) of Juncetalia maritimi.
Vegetation: Juncetum littoralis-maritimi Sanda et al. 1998; Juncetum littoralis Popescu et al. 1992;
Juncetum maritimi (Rübel 1930) Pignatti 1953;
Presence in CAMP area: marine sand dunes and sea side areas on C.A. Rosetti, Letea, Sf.Gheorghe, Câșla
Vădanei and Caraorman.
9. 1530* Pannonic salt steppes and salt marshes
Steppes, depressions, superficial lakes and Pannonic and Ponto-Sarmatic salt marshes, with extreme
temperatures and aestival aridity; the soil enrichment with salts is due to intense fresh water evaporation
during summer. These types of habitats partially have natural origin and partially determined by the
distinct influence of bovine grazing. Halophytic vegetation consists of plant communities in dry salty
depressions and steppes, wet salty meadows and annual plant communities win salty lakes periodically
flooded.
Vegetation: Limonio-Aeluropetum littoralis Sanda et Popescu 1992; Trifolio fragiferi-Cynodontetum Br.Bl. et
Balas 1958; Halimionetum (Obionetum) verruciferae (Keller 1923) Topa 1939; Plantaginetum maritimae
Rapaics 1927; Hordeetum hystricis (Soó 1933) Wendelberger 1943; Limonio bellidifolii-Puccinellietum
convolutae Stefan et al. 2001, Taraxaco bessarabici-Caricetum distantis Sanda et Popescu 1978; Caricetum
distantis Rapaics 1927;
Presence in CAMP area: Sărăturile Murighiol, Caraorman, C.A.Rosetti, Sfiștofca, Sf.Gheorghe, Grindul
Lupilor, Grindul Chituc and Sinoe.
10. 2110 Embryonic shifting dunes
Coastal formations representing the first stages of dune shaping consisted of wavy or elevated sand areas
of the superior beach, or by a rim situated towards the sea at the tall dunes’ foot.
Vegetation: Elymetum gigantei Morariu 1957; Artemisietum tschernievianae (arenariae) Popescu et Sanda
1977; Secali sylvestris-Alyssetum borzeani (Borza 1931) Morariu 1959; Aperetum maritimae Popescu et al.
1980; Brometum tectorum Bojko 1934; Crambetum maritimae (Șerbănescu 1965) Popescu et al. 1980;
Secali sylvestris-Brometum tectorum Hargitai 1940.

18
Presence in CAMP area: marine sand dunes and sea side areas on Sacalin Island, between Sulina and Sf.
Gheorghe.
11. 2130* Fixed coastal dunes with herbaceous vegetation ("grey dunes")
Fixed Pontic dunes – fixed dunes on The Black Sea coasts; the vegetation may be represented by enclosed
meadows, open meadows made up of annual species or may be dominated by moss and lichens.
Vegetation: Koelerio glaucae-Stipetum borysthenicae Popescu et Sanda 1987; Scabioso argenteae-
Caricetum colchicae (Simon 1960) Krausch 1965 (including subas. ephedretosum Sanda et al. 1999);
Scabioso argenteae-Artemisietum campestris Popescu et Sanda 1987; Holoschoeno-Calamagrostietum
epigeji Popescu et Sanda 1978; Plantaginetum arenariae (Buia et al. 1960) Popescu et Sanda 1987; Argusio-
Petasitetum spuriae (Borza 1931 n.n.) Dihoru et Negrean 1976.
Presence in CAMP area: sand dunes Letea, Caraorman, Cardon and Sf. Gheorghe.- Câșla Vădanei.
12. 2160 Dunes with Hippophaë rhamnoides
These habitats are formations of white underbrush which is a precursory stage of forest colonization within
sand dune depressions, both dry and wet.
Vegetation: Calamagrostio epigeji-Hippophaëtum rhamnoidis Popescu et al. 1986.
Presence in CAMP area: Sf.Gheorghe, Letea and Caraorman.
13. 2190 Humid dune slacks
The habitats are represented by wet depressions of dune systems. The wet sand dune depressions are
specialized habitats rich in species, being threatened by the decrease of surface underground water level.
Meadows between sand dunes: humid meadows and bulrush thickets of between sand dunes depressions
often with Salix rosmarinifolia.
Vegetation: Salici rosmarinifoliae-Holoschoenetum vulgaris Mitetelu et al. 1973; Orchio-Schoenetum
nigricantis Oberd. 1957 subas. plantaginetosum cornuti Stefan et al. 2001.
Presence in CAMP area: Caraorman, Letea, Portița and Sulina.
14. 3130 Oligotrophic to mesotrophic standing waters with vegetation of the Littorelletea uniflorae and/or
Isoëto-Nanojuncetea
The habitat is stand for perennial short vegetation, aquatic to amphibian, oligotrophic to mesotrophic, of
lakes, ponds and fens close to the shore and ecotone area belonging to order Littorelletalia uniflorae. This
type of habitat might develop in humid areas between sand dunes.
Presence in CAMP area: Portița, Perișor, Sulina, Leahova, Grindul Chituc and Grindul Lupilor.
15. 3140 Hard oligomesotrophic waters with benthic vegetation of Chara spp.
The habitat is found in lakes and fens with very clear blue-green water and poor nutrient content, rich in bases (pH often >7.5). The bottom of these unpolluted waters is covered with charophytes Chara sp. and
Nitella sp., carpets of algae. This type of habitat includes small peaty lakes, oligomesotropjic, rich in calcium with dense Chara sp. carpet, often bordered by eutrophic swamps and peats (Phragmites australis - stands).
19
Vegetation: Charetum asperae Corill. 57, Charetum fragilis Fijalk. 60, Nitellopsidetum obtusae Dambska 61,
Charetum vulgaris Krause 69, Nitelletum gracilis Corill. 57, Moreover are represented by Potamogeto-
Najadetum marinae Horv.
Presence in CAMP area: Most of the type 3 lakes (small size – clear waters) from the CAMP area – Nebunu,
Răducu, Gherasim, La amiază, Chiril, Potcoava Lake, Lunguleț, Porcului, Pojarnia, Bondarului and Rotund
from Gorgova-Uzlina lake establishment.
16. 3150 Natural eutrophic lakes with Magnopotamion or Hydrocharition - type vegetation
These habitats correspond to lakes and ponds with dark-grey to blue-greenish waters, more or less unclear,
especially rich in dissolved bases with communities of Hydrocharition which freely float on the surface or,
in deep waters, open, with associations of Magnopotamion.
Vegetation: Lemnetum minoris Soó 1927; Lemnetum gibbae Miyawaki et Tüxen 1960; Lemnetum trisulcae
Knapp et Stoffers 1962; Lemno-Spirodeletum Koch 1954; Spirodelo-Salvinietum natantis Slavnic 1965;
Lemno-Azolletum carolinianae Nedelcu 1967; Stratiotetum aloidis Nowinski 1930 (syn.: Hydrocharitetum
morsus-ranae van Langendonck 1935); Lemno-Utricularietum vulgaris Soó (1928) 1947; Potamogetonetum
perfoliati Koch 1926; Potamo-Ceratophylletum submersi Pop 1962; Potamogetonetum pectinati Carstensen
1955; Spirodeletum polyrhizae Koch 1941; Lemno-Salvinietum natantis Miyawaki et Tüxen 1960; Lemno-
Hydrocharitetum morsus-ranae (Oberd.) Passarge 1978; Potamogetonetum crispi Soó 1927;
Ceratophylletum demersii Hild 1956.
Presence in CAMP area: most of the lakes type 1 (large size) and 2 (medium size) from Danube Delta.
17. 3160 Natural dystrophic lakes and ponds
The natural lakes and ponds vegetation with brown water due to peat and humic acids, generally on peaty
soils in swamps are similar to description of this habitat type.
Vegetation: Myriophyllo verticillati-Nupharetum luteae Koch 1926; Nymphaeetum albae Vollmar 1947;
Nymphoidetum peltatae (Allorge 1922) Bellot 1951; Trapetum natantis Kárpati 1963; Potametum natantis
Soó 1927; Trapo-Nymphoidetum Oberd. 1957.
Presence in CAMP area: fish ponds, channels and lakes (type 2) from Danube Delta.
18. 3260 Water courses of plain to mountain levels with the Ranunculion fluitantis and Callitricho-
Batrachion vegetation
Water courses in the field area up to the mountain floor, with submerse or floating vegetation of
Ranunculion fluitantis and Callitricho-Batrachion (low level of water during summer). This habitat is
sometimes associated with communities of Butomus umbellatus on banks. It is important to take into
account this aspect in the process of the selection of significant sites.
Vegetation: Ranunculetum aquatilis (Sauer 1947) Géhu 1961; Hottonietum palustris Tüxen 1937.
Presence in CAMP area: Erenciuc, Dunăvăț-Dranov and Șontea-Fortuna lake establishments.
19. 3270 Rivers with muddy banks with Chenopodion rubri p.p. and Bidention p.p. vegetation

20
Muddy river banks in the field area up to the sub-mountain floor, with annual nitrophytic pioneer
vegetation of the alliances Chenopodion rubri p.p. and Bidention p.p. In spring and early summer, this
habitat presents no vegetation (it develops later during the year.
Vegetation: Bidenti-Polygonetum hydropiperis Lohm. in Tüxen 1950; Polygono lapathifolii-Bidentetum Klika
1935; Xanthio strumarii-Bidentetum tripartitae Timár 1947.
Presence in CAMP area: Șontea-Fortuna, Dunăvăț-Dranov, Gorgova-Uzlina and Roșu-Puiu lake establishments.
20. 62C0* Ponto-Sarmatic steppes
Steppes, plateaus and hills situated west of The Black Sea, sometimes, in association with habitats 40C0
Ponto-Sarmatic deciduous thickets and 91AA Eastern white oak woods.
Vegetation: Chrysopogono-Caricetum humilis Zólyomi (1950) 1958; Stipo ucrainicae- Festucetum valesiacae
Dihoru 1970; Artemisio austriacae-Poëtum bulbosae Pop 1970; Cynodonto-Poëtum angustifoliae (Rapaics
1926) Soó 1957; Koelerio-Artemisietum lerchianae Dihoru 1970; Agropyro-Kochietum prostratae Zólyomi
(1957) 1958; Agropyretum pectiniformis (Prodan 1939) Dihoru 1970; Taraxaco serotini-Bothriochloëtum
ischaemi (Burduja et al. 1956) Sârbu et al. 1999.
Presence in CAMP area: Popina Island, Doloșman Cape, Iancina Cape and Tașburun Cape.
21. 6430 Hydrophilous tall-herb fringe communities of plains and of the montane to alpine levels
Hydrophilous and nitrophilous communities with tall herb vegetation along the water courses and forest fringes. Vegetation: Schoenetum nigricantis (All. 1922) Koch 1926. Presence in CAMP area: Grindul Lupilor and Grindul Sărăturile.
22. 6440 Alluvial meadows of river valleys of the Cnidion dubii
These habitats are alluvial meadows with natural flooding regime belonging to the alliance Cnidion dubii,
under continental to sub-continental climatic conditions. This is a transit habitat between hygrophytes and
xerophytes meadows that cover limited areas. This aspect should be taken into account in the process of
site selection.
Vegetation: Ranunculo repentis-Alopecuretum pratensis Ellmauer 1933; Agrostietum stoloniferae (Ujvárosi
1941) Burduja et al. 1956.
Presence in CAMP area: Pardina Polder, Mahmudia, Tătaru, Ceatalchioi and Sireasa.
23. 7210* Calcareous fens with Cladium mariscus and species of the Caricion davallianae
Dense communities of de Cladium mariscus in frequently flooded areas colonized by plants, in abandoned
plots (not cropped) or wet meadows in successive stages subsequent extensive exploitation, in contact
with types of vegetation of Caricion davallianae or other species of Phragmition. This habitat may be met in
contact with alkaline fens (7230), and with acid swamps, extensively exploited wet meadows and other
reeds and tall sedges as well.
Vegetation: Cladietum marisci Allorge 1922 ex Zobrist 1935.
Presence in CAMP area: Dunăvățu de Jos, Periprava and Caraorman.
24. 7230 Alkaline fens

21
Short sedges and other Cyperaceae usually dominate the swamps communities that belong to Caricion
davallianae. Dense communities of tall sedges (Magnocaricion), reed formations (Phragmition), dense
clusters of Cladium mariscus (Cladietum marisci) may be part of the swamp complex, with communities
connected to transition swamps and amphibious or aquatic vegetation or hygrophytes communities that
develop within depressions.
Vegetation: Carici flavae-Eriophoretum latifolii Soó 1944; Carici flavae-Blysmetum compressi Coldea 1997; Caricetum davallianae Dutoit 1924. Presence in CAMP area: Crișan, Gârla Macovei, Fish Polder Agighiol, Gârla Iacub, Litkov-Împuțita and Sf.Gheorghe.
25. 91AA Eastern white oak woods
These habitats are represented by forests dominated by pubescent oaks, with sub-Mediterranean flora,
occupying warmer enclaves within sub-continental areas of Quercion frainetto.
Vegetation: Galio dasypodi-Quercetum pubescentis Doniţă 1970; Tilio tomentosae-Quercetum
pedunculiflorae Doniţă 1968.
Presence in CAMP area: Băltenii de Jos.
26. 91E0* Alluvial forests with Alnus glutinosa and Fraxinus excelsior (Alno-Padion, Alnion incanae,
Salicion albae)
Riparian forests of Fraxinus excelsior and Alnus glutinosa water courses in field area. Dendritic galleries
formed of tall individuals of Salix alba, S. fragilis and Populus nigra along medio – European rivers. All the
types occur on heavy soils (generally rich in alluvial deposits), periodically flooded by the increase of the
river (or brook) level, at least once a year, but well drained and aired during the period when the water
flow is low. Salicetum fragilis corresponds to both pure and dominated by exploding cucumber willow
communities (without white willow), along which the black alder may frequently occur (Alnus glutinosa).
Salicetum albae comprises white willow communities, pure or mixed in different proportions with Salix
fragilis and/or Populus nigra. While the former association develops on alluvial soils more evolved, the
latter has a more pioneer character due to more intense and frequent floods.
Vegetation: Stellario nemorum-Alnetum glutinosae (Kästner 1938) Lohmeyer 1957; Salicetum fragilis
Passarge 1957; Salicetum albae Issler 1924.
Presence in CAMP area: Gârla Turcească, Erenciuc, on the right side of the Sf.Gheorghe branch close to
locality.
27. 91F0 Riparian mixed forests of Quercus robur, Ulmus laevis and Ulmus minor, Fraxinus excelsior
or Fraxinus angustifolia, along the great rivers (Ulmenion minoris)
Forests of species with hard-essence wood situated in the major bed of rivers, egularly exposed to floods
during the increase in the water level, or in low areas, exposed to floods caused by water elevation. These
forests develop on recent alluvial deposits. The soil may be well drained between floods or may stay wet.
Vegetation: Quercetum roboris-pedunculiflorae Simon 1960; Fraxino pallisae-Quercetum pedunculiflorae
(Popescu et al. 1979) Oprea 1997; Fraxinetum pallisae (Simon 1960) Krausch 1965.
Presence in CAMP area: Letea and Caraorman.
22
28. 92A0 Salix alba and Populus alba galleries
Riparian forests (riverside coppices) in the Mediterranean and The Black Sea catchment dominated by Salix
alba, S. fragilis or other willow species related to them. Types 91E0 and 92A0 partially overlap, due to the
mention of white willow communities in the definition of both habitats. In order to avoid confusion, only
white poplar forests have been included in this habitat, pure or mixed with white willow, which develop on
alluvial soils.
Vegetation: Salici-Populetum Meijer-Drees 1936.
Presence in CAMP area: in Șontea-Fortuna and Gorgova-Uzlina lake establishment, on Sf.Gheorghe and
Chilia Branches, Maliuc, Crișan and Mila 23.
29. 92D0 Southern riparian galleries and thickets (Nerio-Tamaricetea and Securinegion tinctoriae)
Riparian galleries and red sea buckthorn shrubberies, oleander and chaste tree, as well as shorter ligneous
formations situated along permanent or temporary fresh waters and wet areas too.
Vegetation: Calamagrostio-Tamaricetum ramosissimae Simon et Dihoru (1962) 1963.
Presence in CAMP area: Crișan channel, Gârla Iacub, Busurca channel and Tătaru channel.

23
Fig.7 Natura 2000 habitats in Danube Delta Biosphere Reserve
3.2. Evaluation of conservation status: criteria, parameter, existing monitoring
activities, indicators and reporting
One of the objectives is to identify the endangered habitats affected by climate change effects. According to Romanian classification system (Doniță et al., 2005; Gafta and Mountford, 2008), out of the 49 habitats

24
identified (Romanian classification system) in DDBR, so far, 29 habitats have an important status in terms of Habitats Directive 92/43.EEC. Concerning the Natura 2000 habitats with conservation value 71.74% from the total area, should be included in CAMP process (fig. 7). From the latter, 18 habitats are found within strictly protected areas. In order to highlight the climate change impact on protected habitats, which is enhanced by human activities as well, we have measured the areas (table 3). Furthermore, thematic maps representing the vulnerability for flooding and invasive species were designed in the following chapters. Therefore, to assess the impact of climate change, we have chosen to start from the indicator species to the habitats which include these species. The important issue was to select those habitats that are most vulnerable, occupy small surfaces, and are included in strictly protected areas. These types of habitats are represented by coastal formations, sand dune forest, and salt marshes.
Fig. 8 Areas including Natura 2000 habitats which should be managed from CAMP perspective
All these habitats are theoretically belonging to at least two bio-geographical zones as follows: Steppe
bioregion and Pontic bioregion (Doniță et al. 2005). The characteristic of the Steppe region lies in that
there are few precipitations and the mean temperature is higher than in the other bioregions. The
Pontic region has the temperature gap lower than the other bioregions.

25
Table 3 The Natura 2000 habitat types identified in DDBR
Natura
2000
code Natura 2000 habitat name
Estimated
area (ha)
1110 Sandbanks which are slightly covered by sea water all the time 3
1130 Estuaries 4
1140 Mudflats and sand flats not covered by seawater at low tide 3
1150* Coastal lagoons 1
1160 Large shallow inlets and bays 30
1210 Annual vegetation of drift lines 1,968.70
1310 Salicornia and other annuals colonizing mud and sand 8,001.59
1410 Mediterranean salt meadows (Juncetalia maritimi) 10
1530* Pannonic salt steppes and salt marshes 22,293.82
2110 Embryonic shifting dunes 11,403.19
2130* Fixed coastal dunes with herbaceous vegetation ("grey dunes") 3,508.39
2160 Dunes with Hippophaë rhamnoides 1,018.20
2190 Humid dune slacks 3
3130 Oligotrophic to mesotrophic standing waters with vegetation of the Littorelletea uniflorae
and/or Isoëto-Nanojuncetea 10
3140 Hard oligomesotrophic waters with benthic vegetation of Chara spp. 97,876.34
3150 Natural eutrophic lakes with Magnopotamion or Hydrocharition - type vegetation 29,398.12
3160 Natural dystrophic lakes and ponds 8,079.18
3260 Water courses of plain to mountain levels with the Ranunculion fluitantis and Callitricho-
Batrachion vegetation 4
3270 Rivers with muddy banks with Chenopodion rubri p.p. and Bidention p.p. vegetation 30
62C0* Ponto-Sarmatic steppes 298.92
6430 Hydrophilous tall-herb fringe communities of plains and of the montane to alpine levels 10
6440 Alluvial meadows of river valleys of the Cnidion dubii 60
7210* Calcareous fens with Cladium mariscus and species of the Caricion davallianae 2
7230 Alkaline fens 179,000
91AA Eastern white oak woods 10
91E0* Alluvial forests with Alnus glutinosa and Fraxinus excelsior (Alno-Padion, Alnion incanae,
Salicion albae) 80
91F0 Riparian mixed forests of Quercus robur, Ulmus laevis and Ulmus minor, Fraxinus excelsior or Fraxinus angustifolia, along the great rivers (Ulmenion minoris)
5,127.74
92A0 Salix alba and Populus alba galleries 12,500.49
92D0 Southern riparian galleries and thickets (Nerio-Tamaricetea and Securinegion tinctoriae) 179.35
Total area of habitats protected by the Habitats-Directive 92/42 380914.09
Considering the Habitats Directive as basis for our goal, namely the entire diversity of the Danube Delta
Biosphere Reserve (DDBR), the polygons have been separated into two main categories: protected and
unprotected.

26
As it may be seen in figure 10, 71.74% of DDBR studied territory is covered by habitats included in the
Habitat Directive. Only 28.26% represents habitats not stipulated in this Directive. Furthermore, details are
revealed in the surfaces occupied by various habitat types expressed in percentage units. It can be seen
that more than half of the surface of the DDBR is covered by aquatic and water-based habitats (3110, 3130,
3140, 3150 and 7210*), About 3.24 % of DDBR surface is occupied by dunes and in between dunes habitats,
fact that reveals the common influence of the sea in the way of Danube Delta forming process. The forest
habitats have a low representation In DDBR surface (3.22%).
Fig.9 The percentage of Habitats within Strictly Protected Areas in DDBR
(Marian Mierlă – DDNI intern report)
The DDBR habitats within protected areas and their surface percentage (figure 9): 1110 - 1.46%; 1210 –
1.21% 1310 - 1.65%; 1410 - 0.32; 1530* - 4.34%; 2110 - 1.55%; 2130* - 0.62%; 2160 - 0.22%; 2190 - 0.85%;
3130 - 17.72%; 3140 - 5.37%; 3150 - 19.74%; 3160 - 0.85%; 6120 - 0.20%; 62C0* - 0.01%; 7210* - 13.64%;
91F0 - 0.75%; 92A0 - 2.45%; 92D0 - 0.02%; Unprotected - 27.04% (the area is included for other purposes –
example: bird nesting, feeding grounds).
The codes for the habitats may be understood as follows: 1110 for Sandbanks which are slightly covered by
sea water all the time; 1210 Annual vegetation of drift lines; 1310 Salicornia and other annuals colonizing
mud and sand; 1410 Mediterranean salt meadows (Juncetalia maritimi); 1530* Pannonic salt steppes and
salt marshes; 2110 Embryonic shifting dunes; 2130* Fixed coastal dunes with herbaceous vegetation (grey

27
dunes); 2160 Dunes with Hippophae rhamnoides; 2190 Humid dune slacks; 3130 Oligotrophic to
mesotrophic standing waters with vegetation of Littorelletea uniflorae and/or Isoeto-Nanojuncetea; 3140
Hard oligo-mesotrophic waters with benthic vegetation of Chara spp.; 3150 Natural eutrophic lakes with
Magnopotamion or Hydrocharition - vegetation type; 3160 Natural dystrophic lakes and ponds; 6120* Xeric
sand calcareous grasslands; 62C0* Ponto-Sarmatic steppes; 7210* Calcareous fens with Cladium mariscus
and species of Caricion davallianae; 91F0 Riparian mixed forests of Quercus robur, Ulmus laevis and Ulmus
minor, Fraxinus excelsior or Fraxinus angustifolia along the great rivers (Ulmenion minoris); 92A0 Salix alba
and Populus alba galleries; 92D0 Southern riparian galleries and thickets (Nerio-Tamaricetea and
Securinegion tinctoriae). Corresponding numbers for strictly protected areas are as follows: 1 Roșca –
Buhaiova; 2 Letea; 3 Răducu; 4 Nebunu; 5 Lacul Rotund; 6 Potcoava, 7 Vătafu – Lunguleț; 8 Caraorman, 9
Sărăturile Murighiol, 10 Erenciuc; 11 Insula Popina; 12 Lacul Belciug; 13 Sacalin – Zatoane; 14 Periteasca –
Leahova; 15 Capul Dolosman; 16 Grindul Lupilor; 17 Grindul Chituc; 18 Istria Sinoe. It should be mentioned
that only 18 from 20 strictly protected areas were selected for this monitoring. The reason for the other
two protected areas is the recently inclusion in the conservation management plan and the lack of
monitoring data.
Vegetations units have supported the map elaboration for the habitats included in Habitats Directive
92/43/EEC. This allowed the map elaboration for Natura 2000 habitats both included and not included in
Habitats Directive, thus being established the surfaces for each category. For a better research of these
habitats, considering an adequate management, the map for the habitats within strictly protected areas
has been developed by means of the method of intersection in the GIS software. Then the data referring to
those habitats have been processed in the table calculating program in order to establish the percentages
within the strictly protected areas.
The results are covering information useful in the mitigation process to global changes in general and
climate changes in particular. These results offer information about the status of the habitats and also
information about the vulnerability of the Danube Delta Biosphere Reserve territory to some consequences
of climate changes. From all the consequences of climate changes there have been taken into account the
floods and the occurrence of alien invasive species (namely plant species). The number of the climatic
changes influence is relatively high and the domains are diverse, but for Danube Delta case the flooding
and the invasive plant species are relevant and the present data should support the next adaptation
measures to climate change effects.
Table 4 The key data for habitats and species evaluation
Natura
2000
code
Monitoring activities Plant species indicators Reporting
1110 No monitoring activities. Zostera sp., Potamogeton spp., Ruppia spp.,
Zannichellia spp.,
No reports
1130 Data collection, Direct analysis of
the species population, Yearly
monitoring
Communities of benthic species Summary reports

28
1140 No monitoring activities. Zostera marina, Zostera noltii No reports
1150* Data collection (aquatic plants,
chemical data, water
parameters). Seasonally
monitoring.
Chara canescens, Eleocharis parvula,
Potamogeton pectinatus, Ruppia maritime,
Lemna trisulca, Najas marina, Phragmites
australis, Potamogeton spp., Stratiotes
aloides, Typha spp.
Data analysis and
reports related with
WFD.
Statistical
comparison in the
last 10 years
Scientific articles
1160 Data collection, Direct analysis of
the species population, Yearly
monitoring
Zostera spp., Ruppia maritima, Potamogeton
spp. (ex., P. pectinatus), Najas marina,
benthic algae.
Summary reports
1210 Data collection, Direct analysis at
the level of species. Yearly
monitoring of geomorphologic
parameters (erosion, dunes are
shifting – Musura Island) and
anthropogenic pressures
Cakile maritima, Salsola kali, Atriplex spp.,
Polygonum spp., Euphorbia peplis, Elymus
repens, Glaucium flavum, Euphorbia paralias,
Eryngium maritimum. Argusia sibirica.
Statistical
comparison of the
data in the last 10
years.
Reports on habitat
due to regression of
surfaces and species
decreasing
population.
1310 Direct and indirect (satellite
images and ortho-photo)
monitoring. Occasionally
included in other monitoring
plans for different reasons
(anthropogenic pressure,
fluctuation of ground water
level)
Salicornia spp., Suaeda maritima Summary reports on
species and habitats.
In some areas there
were reported
fragmentation of the
habitats.
1410 Direct and indirect (satellite
images and ortho-photo)
monitoring. Important habitat
for Vipera ursinii. Frequently
monitored due strong influence
of anthropogenic pressure.
Juncus maritimus, J. acutus, Carex extensa,
Aster tripolium, Plantago cornuti, Scorzonera
parviflora, Taraxacum bessarabicum,
Samolus valerandi H. maritimum, Orchis
coriophora subsp. fragrans
Reports on habitats,
statistical data and
comparison in the
last 5 years.
1530* Direct and indirect (satellite
images and ortho-photo)
monitoring. Occasionally
included in other monitoring
Artemisia santonicum, Aster tripolium,
Salicornia prostrata, Juncus gerardii,
Plantago maritima, Cyperus pannonicus,
Achillea collina, Artemisia pontica, Puccinellia
Summary reports on
habitats in regards
with status of the
pastures for local

29
plans for different reasons
(anthropogenic pressure,
fluctuation of ground water
level)
limosa, Scorzonera cana, Halocnemum
strobilaceum, Frankenia hirsuta, Aeluropus
littoralis, Limonium meyeri, L. gmelini, Carex
distans, C. divisa, Taraxacum bessarabicum,
Halimione verrucifera, Hordeum hystrix
communities. The
last report was in
2006.
2110 Indirect (satellite images and
ortho-photo) monitoring.
Occasionally direct monitoring
when is included in other
monitoring plans for different
reasons (touristic activity and
development).
Elymus farctus, Leymus sabulosus, Euphorbia
peplis, Medicago marina, Eryngium
maritimum.
Summary reports on
species status
2130* No monitoring activities in the
present.
Bromus hordeaceus, Carex colchica,
Cerastium spp., Galium verum, Koeleria spp.,
Silene conica, S. otites.
The last monitoring
plan in 2006.
2160 No monitoring activities in the
present.
Hippophaë rhamnoides The last monitoring
plan was in 2002.
2190 Direct monitoring of species
population and data collection
(aquatic plants, chemical data,
and water parameters).
Seasonally monitoring
Chara tomentosa, Elodea canadensis,
Hippuris vulgaris, Hottonia palustris,
Potamogeton pectinatus, Juncus bufonius
Data analysis and
reports related with
WFD.
Statistical
comparison in the
last 10 years
Scientific articles
3130 Indirect (satellite images and
ortho-photo) monitoring.
Occasionally direct monitoring
when is included in other
monitoring plans for different
reasons
Littorella uniflora, Juncus bulbosus,
Eleocharis acicularis, Cyperus fuscus, C.
flavescens, Centaurium pulchellum.
Summary reports on
species status
3140 Occasionally direct monitoring
when is included in other
monitoring plans for different
reasons.
Chara spp. and Nitella spp. Summary reports on
habitat status.
3150 Direct monitoring of species
population and data collection
(aquatic plants, chemical data,
and water parameters).
Spirodela spp., Wolffia spp., Hydrocharis
morsus-ranae, Stratiotes aloides, Utricularia
australis, U. vulgaris, Aldrovanda vesiculosa,
Azolla filiculiodes, Potamogeton lucens, P.
Data analysis and
reports related with
WFD.

30
Seasonally monitoring perfoliatus. Statistical
comparison in the
last 10 years
Scientific articles
3160 Occasionally direct monitoring
when is included in other
monitoring plans for different
reasons.
Utricularia spp, Nuphar lutea, Nymphaea
candida.
Summary reports on
habitat status.
3260 Occasionally direct monitoring
when is included in other
monitoring plans for different
reasons.
Ranunculus aquatilis, Myriophyllum spp.,
Callitriche spp., Berula erecta, Zannichellia
palustris, Potamogeton spp.,
Summary reports on
habitat status.
3270 Direct monitoring activities.
Occasionally included in other
monitoring plans for different
reasons (overgrazing).
Chenopodium rubrum, Bidens tripartita,
Xanthium sp., Polygonum lapathifolium.
Summary reports on
habitats in regards
with status of the
pastures for local
communities. The
last report was in
2006.
62C0* Direct monitoring activities in
Popina Island (Razelm Lake).
Occasionally included in other
monitoring plans for different
reasons (overgrazing). Usually
the data collection is made in
spring (for the insects) summer
season (for the vegetation).
Festuca valesiaca, Chrysopogon gryllus,
Alyssum saxatile, Agropyron pectiniforme,
Koeleria macrantha, Dichanthium
ischaemum, Stipa capillata, S. ucrainica,
Elymus hispidus;
Summary reports on
habitats and some
rare and endemic
species.
6430 Direct monitoring activities.
Occasionally included in other
monitoring plans for different
reasons.
Glechoma hederacea, Epilobium hirsutum,
Aegopodium podagraria, Alliaria petiolata,
Lysimachia numularia, Lythrum salicaria.
Summary reports on
habitats.
6440 No monitoring activities in the
present.
Alopecurus pratensis, Agrostis stolonifera,
Lythrum virgatum
Summary reports on
habitats in regards
with status of the
pastures for local
communities. The
last report was in
2006.
31
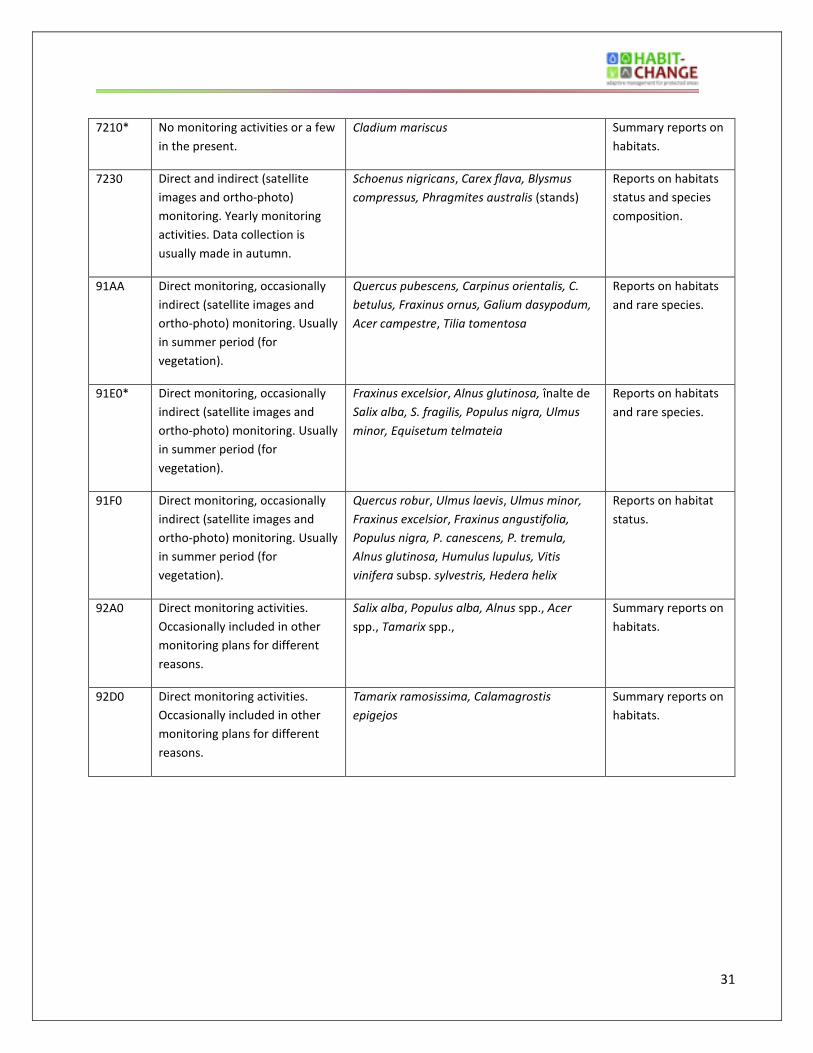
7210* No monitoring activities or a few
in the present.
Cladium mariscus Summary reports on
habitats.
7230 Direct and indirect (satellite
images and ortho-photo)
monitoring. Yearly monitoring
activities. Data collection is
usually made in autumn.
Schoenus nigricans, Carex flava, Blysmus
compressus, Phragmites australis (stands)
Reports on habitats
status and species
composition.
91AA Direct monitoring, occasionally
indirect (satellite images and
ortho-photo) monitoring. Usually
in summer period (for
vegetation).
Quercus pubescens, Carpinus orientalis, C.
betulus, Fraxinus ornus, Galium dasypodum,
Acer campestre, Tilia tomentosa
Reports on habitats
and rare species.
91E0* Direct monitoring, occasionally
indirect (satellite images and
ortho-photo) monitoring. Usually
in summer period (for
vegetation).
Fraxinus excelsior, Alnus glutinosa, înalte de
Salix alba, S. fragilis, Populus nigra, Ulmus
minor, Equisetum telmateia
Reports on habitats
and rare species.
91F0 Direct monitoring, occasionally
indirect (satellite images and
ortho-photo) monitoring. Usually
in summer period (for
vegetation).
Quercus robur, Ulmus laevis, Ulmus minor,
Fraxinus excelsior, Fraxinus angustifolia,
Populus nigra, P. canescens, P. tremula,
Alnus glutinosa, Humulus lupulus, Vitis
vinifera subsp. sylvestris, Hedera helix
Reports on habitat
status.
92A0 Direct monitoring activities.
Occasionally included in other
monitoring plans for different
reasons.
Salix alba, Populus alba, Alnus spp., Acer
spp., Tamarix spp.,
Summary reports on
habitats.
92D0 Direct monitoring activities.
Occasionally included in other
monitoring plans for different
reasons.
Tamarix ramosissima, Calamagrostis
epigejos
Summary reports on
habitats.

32
4. Habitats under climate change: Exposure, Sensitivity and Potential impacts
4.1. Current climate and expected changes in climate
According to various authors (Blaikie et al. 1994; Kasperson, et al., 2002; Watson et al. 1996; 1998) we have
identified, within Danube Delta Biosphere Reserve, as hazards, the flooding, drought, global solar radiation,
heat wave, virus and pest, changing the temperature and precipitation, frost, climatic water balance,
climate balance on forest vegetation and sand dunes areas and invasive species (table 5).
Table 5. Possible changes of hydrometeorological conditions in the DDBR
Parameter/indicator Period (years)
Comments 2011-2030 2031-2050
Average annual air temperature
+0.5°- 0,7С ↑
1.0-1.5°С↑ Average land layer air temperature will increase. In DDBR such temperatures seem to be higher due to aridisation, which is expected to be intensive
Maximum annual temperature
+0.8°С ↑ +2.0°-2,2С ↑ Greater absolute temperature maximum
Minimum annual temperature +0.6°С ↑ +1.5°С ↑ Minimum temperature will grow in the coastal areas, while in the advanced delta it may remain at the current level
Summer months temperature +0.5°С ↑ +1.3°С – 1,5↑
Mainly due to July – August
Winter months temperature +0.5°С ↑ +1.2°С ↑ Mainly due to January – February
Number of frosty days ↓ ↓
Less. It is expected that in DDBR 2011-2030 till 10 days more. Forecast for 2031-2050 seems to be less developed, but one could assume 12-15 days more (without frosts).
Warm period duration ↑ ↑ Faster change of year seasons is possible
Number of days with snow cover
↓ ↓ Less
Total annual precipitation ↑ +3% ↑ +6%
General growth of average annual precipitation, but significant redistribution of precipitation during within seasons is predicted. Growth of precipitations seems to be unclear. One could expect 5-7% more during winter time, but during summer 3-5% less.
Extreme precipitation, rainstorms, squalls, thunderstorms, hail
↑ ↑
Higher air temperature will be accompanied by higher moisture content in the lower layers of troposphere. It will lead to greater instability of the atmosphere during warm season of the year and higher number and intensity of convective weather events: rainstorms, hail, squalls and thunderstorms
Moisture deficit (droughts) ↑ ↑
Due to general warming and higher absolute temperature maximum. Possibly, due to annual redistribution of temperatures. Moisture deficit will grow in DDBR
Soil heating ↑ ↑ Due to general warming and higher absolute temperature maximum.
Evaporation, transpiration ↑ ↑ Increase due to higher temperatures
Flooding connected with local ↑ ↑ Increase due to raised frequency and intensity of

33
runoff rainstorms
Intensity and flooding height in the Danube
↑ ↑ Calculated hydrological characteristics will change, particularly those of runoff and water level of 1% probability
Minimum runoff of the Danube
↓ ↓ Less because of higher temperatures in low-water period
Sediment runoff in the Danube
↑ ↑ Stabilization or slight increase due to greater rainfalls in the Middle and Lower Danube. Possible increase of the maximum runoff of sediments
Sea level rise ↑
↑ favourable –by 0,15m, unfavourable – 0,5m
Increase of the sea level of the Black Sea; possible retreat of inland Danube Delta
Flooding at the seaside, partial flooding and under flooding of territories
↑ ↑ Increase due to higher sea level and more frequent wind-caused water level fluctuations because of greater number of squalls and tornadoes
Water temperature in delta channels and closed water bodies
+0.7↑ +1.5↑ Increase in all water bodies of the DDBR
Water temperature in lakes in summer
+1.0↑ +2.0↑ Increase substantially in all Danube lakes
Water quality ↓ ↓
Deteriorates due to lower dissolved О2 concentrations. Worse water exchange and eutrophication of the basins. Increasing of TDS for 5-10%
Ice events ↓ ↓ Decreased frequency and intensity of ice events
Repeatability of years with low water level in lakes
↑ ↑ Due to lower water levels along the Chilia Branch and possible reduction of the minimum runoff
Water exchange processes in lakes
↓ ↓ Due to lower water levels along the Chilia Branch and lowering of the minimum levels
4.1.1. Flooding
Giving the fact that we are discussing about a wetland area were floods are normal events we will present
the phenomena from the both sides, as an extreme related with human activities and, as annual cycle
normal event.
In extreme conditions, flooding is an environmental stress in many natural and manmade ecosystems
worldwide (Bailey-Serres and Voesenek, 2008). Temporary floods differ in seasonal timing and with much
variation in durations, depths and frequencies (Vervuren et al. 2003). In DDBR, the most important element
is the hydrological system (branches, channels and lakes). Fundamentally, this means water circulation and
distribution that is to say, the core of this wetland (Driga, 2004). In 1910 - 1911 I. Vidrașcu created the first
map of flooding potential by hydro-grades values; currently, this map does not apply because of manmade
and natural reshaping. Nowadays, the protection dams ensure security for specific areas, prevent the
material losses with important expenses for rehabilitation and prevent human life loss. The liability to
flooding of the deltaic space, as a complex hydrologic process, is very important in the evolutionary
dynamic of all the natural system's elements. A good way to estimate these hydrological events was to
34
build up a hazard map, taking into account the maximum and minimum to have a picture of the extremes.
This hazard maps, combined with the socio-economical component of the studied area, could give some
data regarding risks in the area. The risk is a function that takes into account the hazard component and
the vulnerability component from a system. The main premises that condition the process of liability to
flooding delta are its hypsometric particularities, amplitude and periodicity of the maximum levels of
Danube. To these, the reduction of the surfaces liable to flooding is added at present, as a result of
embanking certain areas.
In the present analysis of liability to flooding the deltaic territory, the fact that it is complicating a lot should
be taken into consideration, as approx. 30% of Danube Delta surface (namely 1,000 km2) is embanked, not
being subject of liability to flooding (Gâștescu and Știucă, 2008).The value of one hydrograde (1 hg) at a
certain point represents 1/10 of the amplitude value of that point during the entire period of observations.
In the differentiate estimation of a hydrograde value, the maximum levels have been taken into
consideration ratified at present at various hydrometric stations towards "0" surveyor's rod reported to
The Black Sea level - r. M.N. (Driga, 2004). Frequent for DDBR, hydrograde 7 – 7.5 corresponds to the
medium of large waters maximum (350 - 375 cm r.M.N. at Tulcea); reaching and exceeding these values
mark the beginning of the flooding process in the surface on the entire delta territory. When reaching
hydrograde 10, delta surface is flooded in proportion of 93.4 % (3,094.7 km2), the volume of accumulated
water being estimated at 6.2 billion m time, having a larger capacity of water retention. As for fluvial-
maritime habitats, the most recent observations showed that bushes such as Tamarix ramosissima,
Amorpha fruticosa, Elaeagnus angustifolia, Lycium barbarum cannot resist more than three months under
water (Doroftei et al. 2011).
During the spring time, in normal conditions, flooding is a normal event within the delta’s annual cycle and
floods normally occur between Aprils – June, when 33 % of the Danube’s annual flow may pour into the
delta. Before polders were constructed and damming work was carried out within the delta from 1956,
flooding of the interior of system would start when the water level in the main Danube at Tulcea reached
around 1.5 metres (3 hydro degrees) above the level of the Black Sea (Driga, 2004). Inundation of around
1,000 km2 (31.2 % of the delta) is now prevented by the construction and maintenance of dams and
polders. This has a „pour-on” effect on those areas that are able flood, because the water that cannot flood
out over about a third of the delta is either contained within the main channels, or it discharges into the
remaining two thirds of the delta’s area. It has been calculated that 2752.65 km2 are inundated when the
depth of water reaches 6 hydro degrees (3 metres above Black Sea level). This represents 83 % of the delta
that has not been dammed or made into polders. Some of the higher features within the delta, like the
Letea, Caraorman, Stipoc dune systems do not flood, whereas Sărăturile and Câmpul Chilia dunes flood
occasionally (Posea et al., 2005). The floodwater that inundates such large areas brings huge quantities of
organic matter, silt and natural mineral salts. They also provide some nitrates and phosphates from
agriculture and treatment of domestic effluents. The net effect is to raise the fertility of the areas that are
inundated. This boosts vegetation growth in waters and soils. The huge and complex ecosystems of the
delta are the main beneficiary, but growth rates in grazing and cropped areas are also enhanced (Gâștescu
and Știucă, 2008).
35
4.1.2. Global solar radiation
Global solar radiation, as a main genetic factor of climate, reaches on DDBR territory, the highest annual
average values in Romania; they increase from west (cca 130 kcal.cm2), to east (over 135 kcal.cm2) under the
influence of The Black Sea. Its values depend on both total nebulosity and shining duration of the Sun. Total
nebulosity has an annual medium which gradually decreases from west (>5, 6 tens) towards east (<5, 2
tens) where the lowest value was registered.
The annual average number of days with clear sky increases from west to east (Tulcea 66 days, Jurilovca
69,4 days, Sfântu Gheorghe 80,1 days), on the other hand, the annual average number of days with cloudy
sky decreases (Tulcea and Jurilovca 99 days, Sfântu Gheorghe 90 days), at the same time with nebulosity
decrease (Posea et al., 2005).
The annual shining duration of the Sun records a reverse territorial variation towards nebulosity. Its values
increase from west to east: Tulcea 2 260 insolation hours, Gorgova and Jurilovca 2 325 hours, Sfântu
Gheorghe 2 502 hours, the last being the highest value; it is slightly diminished on the surface of The Black
Sea’s coast waters, in Sulina (2 475 hours of insolation), where foggy air and fog are a little more frequent.
During the hot semester of the year (interval IV – IX), the effective shining duration of the Sun represents
cca 2/3 of the annual average value and it increases towards the same direction, from west to east, reaching
the highest values (1 705 hours of insolation) in Sfântu Gheorghe, namely with cca 200 hours more than in
Tulcea (1 513 hours).
4.1.3 Changing temperature and precipitation
According to exterior influences, air temperature reaches moderate values, being though, in seashore area,
among the highest in the country.
The annual average values gradually increase from west to east, at the same time with both the decrease
of land influence and the increase of sea influence: Tulcea and Jurilovca 11,0º C, Gorgova 11,2º C, Sfântu
Gheorghe and Gura Portiţei 11,4º C, Sulina-dam (situated over the territorial waters, at cca 6 km at sea)
11,6º C (figure 10) and Platform Gloria (situated at cca. 30 km at sea, next to marine littoral between Sulina
and Sfântu Gheorghe) 12º C, as a result of less deep waters which play the part of a thermal reservoir (10 –
20 m) on the continental platform (Bogdan and Niculescu, 1999). The annual average temperature reached
non – periodic variations, positive or negative, relatively low, of 1, 5 – 2º C. In the hottest years, it exceeded
12º C (12, 5º C in195 in Tulcea and 12, 7º C in1966 in Sulina), while in the coldest years, it dropped below
10º C (9, 5º C in Tulcea and 9, 7º C in Sulina in 1942).
Absolute extreme temperatures best reflect the three exterior influences which interfere on DDBR territory
(continental, maritime and of air in advection). Thus, under the influence of marine aquatory, polar or
arctic cold air masses suffer a slight heating up and, therefore, absolute minimum temperatures increase
from west to east: Tulcea –27,2º C (18.I.1963), Gorgova –26,2º C (18.I.1963), Sulina-town –25,6º C
(9.II.1929), Jurilovca –23,5ºC (10.I.1940) and Sfântu Gheorghe –21,5º C (12.I.1950).
Also, the continental tropical hot air masses suffer a slight amelioration under the influence of sea waters
and consequently, absolute maximum temperatures increase more and more towards a reverse direction,

36
from east to west: Sfântu Gheorghe 36, 3º C (9.VII.1968), Sulina-town 37, 5ºC (20.VIII.1946), Jurilovca 38, 0º
C (8.VII.1968), Gorgova 38, 2º C (18.VII.1951) and Tulcea 39, 7º C (20.VIII.1945) (figure 10).
Under the influence of adjacent land and of The Black Sea, atmospheric precipitations gradually diminish
from west to east: Within deltaic space: Tulcea 438,4 mm, Gorgova 406,9 mm, Sfântu Gheorghe 403,6 mm,
Sulina-dam 330,5 mm; Within The lake complex of Razim-Sinoie: Jurilovca 386,6 mm, Dranov 356,5 mm
and Gura Portiţei 327,2 mm.
On Caraorman and Sărăturile Sandunes, they exceed 400 mm (Sfântu Gheorghe 403, 6 mm); as a result of
local convect rainfalls (figure 11).
Fig.10 The annual average values in Danube Delta, the arrow indicates the direction of temperature abatement
(Posea et al., 2005)

37
Fig.11 Changing temperature and precipitation in Danube Delta (Ivonne Anders, ZAMG – 2011)
The amount of absolute maximum precipitations within 24 hours were, in all the cases, higher than 90 mm,
exceeding a lot more the average value of the months when they were produced, July – August; they also
represented ½ up to ⅓ from the annual average amount from the respective station. The highest maximum
amount within 24 hours was produced on 29.VIII.1924, in C.A.Rosetti, summing up 530, 6 mm which
completed with the rainfall from the previous day 30.VIII was of 690, 6 mm, representing 1 720 %
compared to the medium of August; on the same day, 29.VIII, in Sulina 219, 2 mm were registered,
representing 2/3 of the annual amount at the same station, produced within a single day.
The annual average number of days with precipitations (≥0, 1 mm) gradually decreases from west to east:
Tulcea 104, 1 mm, Gorgova 96, 4 mm, Jurilovca 90, 4 mm, Sfântu Gheorghe 88, 0 mm and Sulina 87, 3 mm.
These quantitative indices of complex topo-climates (table 6) reflect the three exterior influences that
exert on DDBR territory, namely continental, marine and of air in advection.
Spatial distribution of dryness index „Emm de Mortonne” shows the fact that dryness degree increases
from west (>21) to east (<15). In seashore area and above coast waters on the continental platform, where
annual precipitations are the lowest (cca 330 mm), and the annual average temperatures are the highest
on the entire Romanian littoral of The Black Sea (11,4 – 11,6o C), the dryness index has the lowest value (15
– 19), which indicates that here is the highest degree of dryness.
Table 6 Quantitative indices of complex topo-climates (Bogdan, 2001)
Climatic parameters Fluvial delta Fluvial-marine
delta
Razim-Sinoie
Annual average duration of shining of the Sun (hours)
2 300-2 400 2 400-2 450 2 300-2 350
Annual average global solar radiation (Kcal. cm
2)
125,0-132,5 132,5->135,0 130,0-135,0

38
Annual average temperature (oC) 11,0-11,2 11,2-11,6 10,9-11,4
Average temperature of January (oC) -1,5...-1,4 -1,4...-0,2 -1,4...-0,3
Annual average temperature of July (
oC)
22,5-23,0 23,0-23,5 22,6-23,0
Annual average amplitude (oC) 24,2-24,5 23,0-24,0 23,0-24,0
Absolute minimum temperature (oC) -27,2 T; -26,2 G -21,.5 Sf.Gh.; -25,6
S -23,5 J
Absolute temperature (oC) 39,7 T; 38,2 G 36,3 Sf.Gh.; 37,5 S 38,0 J
Annual average number of winter days cca 20 cca. 15 cca 20
Annual average number of frost days cca 85 < 70 cca 75
Average number of summer days 85-80 70-80 cca 70
Annual average number of tropical days cca 20 < 1 cca 5
Annual average relative humidity (%) 76-80 80-84 80-82
Annual average nebulosity (tens) 5,6-5,2 5,2-5,4 5,2-5,4
Annual average amount of precipitations (mm)
450-400 400-350 385-325
Main pluviometric maximum (mm) VI (52,9 T; 48,4 G)
VI(46,2 Sf.Gh.; 36,2 S)
VI (46,2 J)
Secondary pluviometric maximum (mm) XII (36,4 T; 34,0 G)
XI(39,9 Sf.Gh.; 33,1 S)
XI (35,5 J)
Maximum amount of maximum precipitations within 24 hours (mm)
125,4 T; 108,4 G
101,0 Sf.Gh.; 219,2 S
130,2 J
Prevailing winds NV; N N; NV; NE; S N
Calm frequency (%) 23,0 T; 10,5 G 15,9 Sf.Gh.; 1,8 S 21,0 J
Annual average wind speed (m/s) 2,8... >3,0 3 – >7 4 – 4,5... 6
Average wind energetic speed (m/s) 3,5-4,0 4,6-7,6 4,6-5,0
Annual average wind duration with v>3m/s (hours)
4 000-5 000 7 000-8 000 4 000-5 000
Average date of the first autumn frost 31.X- 1.XI 6 -12.XI 5-12.XI
Average date of the last spring frost 1-2.IV 27-28.III 28-30.III
Average duration of the interval without frost (days)
210-220 223-228 218
Average duration of the interval with frost (days)
145-155 135-145 145
Dry months (according to Péguy climograms)
1-3 (VII, VIII, IX) 4 (VI, VII, VIII, IX) 3 (VII, VIII, IX)
Months with dryness phenomena (according to Walter-Lieth cyclograms)
6 (V,VI,VII, VIII, IX, X)
6,5 (V, VI,VII, VIII, IX, X)
6,5 (IV,V,VI, VII, VIII, IX)
Months with drought phenomena (according to Walter-Lieth cyclograms)
2 (VII, VIII) >5 (V, VI, VII, VIII, IX)
>3 (VII, VIII, IX)
Analyzing these indices from the table 6, it was observed that, on DDBR territory, in the complex topo-
climate of fluvial-maritime delta, special values of certain climate parameters are met, with aspect of
„climatic record” for entire Romania, such as: the lowest nebulosity (cca 5 tens), the longest insolation
duration (>2 500 hours of insolation), the highest amount of global solar radiation (>125 kcal/cm2
horizontal surface) and, consequently, the highest insolation fraction favorable to heliotherapy and
balneotherapy (>85 % of the possible duration), in the seashore area; the highest temperatures in Romania

39
(11,0 – 12,0º C), the longest annual average interval with daily average temperatures >0º C (325 days) and
the longest annual average interval without frost (225 days); the lowest annual amounts of precipitations
(330 – 350 mm), and the highest absolute maximum amounts within 24 hours (530,6 mm); the longest
dryness periods (6 – 7 consecutive months) and drought (3 – 4 consecutive months) (Bogdan,2001).
4.1.4 Frost
The average date of the first autumn frost is later and later from west (Tulcea 31.X) to east (Sulina-dig,
12.XI), as the sea influence increases and from south (Jurilovca 5.XI), to north (Sfântu Gheorghe 6.XI, Sulina-
dam 12.XI), as a result of the station position at 6 km at sea, surrounded by waters. The average date of the
last spring frost is later and later in a reverse direction, from east (Sulina 28.III) to east (Tulcea 2.IV) and
from north (Sulina 28.III) to south (Jurilovca 30.III) from the same reasons. The average duration of the
interval without frost increases from west (Tulcea 211 days) to east (Sulina 228 days – this being the
longest in Romania) and from south (Jurilovca 219 days) to north (Sfântu Gheorghe 223 days, Sulina 228
days), at the same time with the increase of the sea influence. In a reverse direction, from east, where it is
the shortest (Sulina 137 days) to west, where, because of the continental influence, frost lasts longer
(Tulcea 154 days) and from north (Sulina 137 days) to south (Sfântu Gheorghe 142 days, Jurilovca 146
days).
The earliest autumn frost took place within the whole reserve at the same date (Sulina Tulcea, 4.X
annually), as the latest spring frost (Sfântu Gheorghe and Tulcea 27.IV annually), due to obstacles absence,
being with cca one month earlier and respectively later compared to the average dates. The possible
maximum duration of the interval with frost decreases from the west (Tulcea 206 days) to east (Sulina 197
days), while the possible minimum duration without frost increases from west (Tulcea 159 days) to east
(Sulina-dam 168 days).
4.1.5 Climatic water balance
The most influenced by climatic water balance are:
• Abandoned branches topoclimates, streamlets with stagnant water, with a little higher
temperature, depending on the degree of eutrophication and alluvial deposits;
• Those of the large deltaic lakes, with more intense temperature inversions within the central
section, where, due to better insolation and wind, evaporation processes are more intense, unlike
the marginal concentric areas protected by reed „green shores”, which are heated up at the wrong
moment; those of small lakes with advanced eutrophication process and, consequently, with low
albedo and high temperatures;
Therefore, during the day, when insolation is high, part of the solar radiation is reflected and another is
absorbed and stored as heat beneath the lake; due to the water, maximum and minimum temperatures
are unwedged; temperatures are moderate, evaporation is high (>1 mm/1h during the day) and therefore,
the relative humidity is high (>80 – 90 %).
Recent observations confirm that the global mean temperature has increased by 0.8 °C compared with
pre-industrial times for land and oceans, and by 1.0 °C for land alone. The rate of global warming has
increased to 0.17±0.05 °C per decade (IPCC, 2001). This value will probably exceed any 100-year rate of
warming during the past 1 000 years. From 1990 to 2100, the global average temperature is projected to

40
increase by 1.4–5.8 °C and 2°C –6.3°C for Europe (EEA, 2004). For habitat biodiversity, climate change is an
additional stress factor. Biodiversity is also affected by factors such as land use changes, overexploitation of
natural resources, invasive alien species, and air pollution. However, the role of climate change is expected
to become more dominant in the next decades, in particular if the magnitude and rate of climate change is
at the higher end of the projected range (IPCC 2001a, b; EEA 2004). As the change in air temperature is
generally more pronounced at higher latitudes, the air temperature over Europe has already increased
more than the global average for Europe: 1.0 (land and oceans) and 1.2 °C (land alone), especially in the
south-west and the north-east of Central Europe as well as in mountain areas (EEA 2004; IPCC 2001).
Already observed trends of climate change in the investigation areas in terms of temperature, precipitation
and the climatic water balance are shown in figure 12. To display observed trends in hydro-climatic
conditions two periods of 15 years (Period 1: 1960-1974 and Period 2: 1987-2001) have been evaluated. An
important phenomenon is that the increase in winter temperature in Europe was higher than the one in
summer (EEA, 2004). These trends are visible in all investigations areas particularly in higher average
temperatures for January and February. There are also apparent regional differences, especially the
southern parts of Central Europe and mountainous areas, show lower increases in temperature than e.g.
northern parts Central Europe. In addition, for most areas a temperature rise is clearly visibly for July and
August. A general pattern is that the (observed) higher temperatures stimulate the global hydrological
cycle. More evapotranspiration leads to more water vapour in the atmosphere and to more intensification
of the water cycle. On the other hand, precipitation has a higher regional variability than temperature,
because it depends more on regional circulation patterns and local orography. Therefore, trends in
precipitation are more heterogeneous.
The observed precipitation trends for the period from 1900 to 2000 show a contrasting picture between
increase in northern Europe by 10–40 %, and decrease in some regions of southern Europe, especially in
the winter season (IPCC 2007; Klein Tank et al.2002). Across the European continent seasonal precipitation
patterns show even more distinct trends than the average annual values. In the winter season many parts
of north Central Europe became wetter, and regions in southern Central Europe drier. The changes in
winter precipitation can partly be explained by stronger western winds over northern Europe, bringing
more clouds (EEA, 2004). The Climatic Water Balance is defined as the amount of precipitation minus the
potential evapotranspiration. It indicates the extent of the water yield in an area and provides an indication
for the vegetation on-site. If the potential evapotranspiration is higher as the amount of precipitation the
climatic water balance turns out to be negative and there is a climatic water deficit. A positive water
balance indicates a climatic water surplus the area. On many sites not only warmer conditions are
projected, in addition, drier weather conditions could occur especially in the summer season. For wetlands,
the reduction of the Climatic Water Balance in summer is crucial for the evaluation of habitat exposure
(and finally its vulnerability) to climate change (figure 12). Findings about future impacts of climate change
on the water balance relay mainly on future trends in precipitation (regional and seasonal distribution). The
other component of the Climatic Water Balance, the potential evapotranspiration, is defined as the release
of water vapor from the earth’s surface to atmosphere by evaporation and plant transpiration. Generally,
potential evapotranspiration demand increases due to climate warming. Thus a temperature driven

41
increase in evaporative demand, especially in combination with decreasing precipitation, leads to a
decrease of the Climatic Water Balance.
Fig.12 Climatic water balance of Danube Delta (Ivonne Anders, ZAMG – 2011)
In summer a decrease of the Climatic Water Balance can be expected overall, which can lead to seasonal
water stress. The highest sensitivity for water stress arises for areas which have already an unfavourable
Climatic Water Balance at presence. The region is characterised by a moderate – continental climate with
pontic influences.
4.1.6 Climate balance on forest vegetation and sand dunes area (bare areas) For the forest, the most important disturbing human factors for local climate balance are clear cuttings and grazing. Therefore, a high shading degree is noticed underneath them, which determines a reduced evapotranspiration (cca 0, 2 mm/1h). Normally, the air humidity is high (>80 %). That leads to moderate temperatures, reduced thermal amplitudes (<10o C), temperature inversions or isothermal units, atmospheric calm, greenhouse effect. When the human interventions and low ground water level take effect, some of the ligneous species (especially Alder tree) are disappearing. As a result, thermal convection, ascendant air currents, air turbulence strongly develop themselves during
the day; heating processes prevail according to insolation type, while during the night, strong radiation of
the active surface, descendent air currents, stable thermal stratification with temperature inversions take
place. Consequently, vertical thermal gradients are high during the day (15 – 20o C) and lower during the
night (<1o C). Temperature may reach high values at ground level during the day (>50 – 60 o C) and low

42
at night (<20 o C); thermal contrasts are present between day and night, that is why thermal amplitudes
are higher (>25o C in the air and over 75o C at ground level); evapotranspiration is high (>1 mm/1h), while
humidity is relatively reduced (<25 – 30 %).
4.1.7 Invasive plants species
Growing number of naturalized alien species is seen as indicator of uniform vegetation. Al the level of
Danube Delta Biosphere Reserve, there was elaborated a list of 128 alien plant species (Doroftei &
Covaliov, 2009). From this list, 116 species (65 ligneous species, most of them being cultivated in localities)
were identified recently in the field (Doroftei and Covaliov, 2009).
Table 7 Establishment site potential of invasive species in DDBR habitats according to G.P.S. points (Doroftei et al.,
2011)
Later on there were inventoried 169 alien plant species in a different projects (CNCSIS PNII-IDEI 273/2007
and CNCSIS PNII-IDEI 611/2008) which represents 30% from total 671 alien plant species inventoried at the
national level (Anastasiu and Negrean, 2005; Sârbu and Oprea, 2011). Some of the plants included in this
list present a higher frequency, being widespread both in natural habitats, and in those controlled by man.
From the list of the alien plants identified in the Danube Delta, the species with the highest impact index
(competitive ability index) have been extracted on the basis of ecological features (table 4). Species such as
Ailanthus altissima [1], Amorpha fruticosa [2], Conyza canadensis [3], Elodea canadensis [4], Fraxinus
pennsylvanica [5], Gleditsia triacanthos [6], Morus alba [7] and Robinia pseudoacacia [8] are considered the

43
most widespread invasive plant species from DDBR. Furthermore, other species (Acer negundo [9], Azolla
filiculoides [10], Lycium barbarum [11] and Vallisneria spiralis [12]) that until now were not considered a
threat are observed in new habitats (table 4).
However, the presence of a high number alien species and then expansion of invasive species is a clear
indicator of climate change that allowed the emergence of both new species and associations, non-specific
to deltaic territory so far (table 8).
Table 8 Invasive ligneous species presence in DDBR (Doroftei and Covaliov, 2009)
Invasive species DDBR presence
Elaeagnus angustifolia L. Species introduced in forest cultures from the coastline cordon area and on sand banks in order to fix sand. It has been identified predominantly in the fluvial-maritime delta, in all the localities of the Danube Delta as well as in the fluvial delta, with a reduced frequency though. It is also present on Popina Island, Capul Doloşman, Iancina and Taşburun. Nowadays, it is considered sub spontaneous species. We consider that it has spreading potential and it may eliminate Hippophaë rhamnoides species.
Amorpha fruticosa L. Shrub cultivated in the past along the modified/dragged channels in the Danube Delta. Nowadays, it is considered sub-spontaneous with an invasive character. It is a very frequent species present within all types of habitats, especially within the fluvial delta sector. In the poplar forest plantations, it develops very well, occupying the shrub layer and thus causing damage to these cultures. The actual exploitation management of poplar forest plantations is favouring the development of the Amorpha fruticosa shrub layer. Maintaining a high water level within these enclosures during a longer period can be a solution for eliminating the species Amorpha fruticosa.
Robinia pseudoacacia L. Tree cultivated in forest plantations. It is frequently present in the localities within the Danube Delta. It dominates the landscape in localities such as Pardina and Periprava. Species considered sub-spontaneous with invasive character within the most of habitat types in the Delta Danube.
Morus alba L. Species cultivated in forest plantations and localities from where it became spontaneous within the entire territory of the Delta Danube. The species is considered sub-spontaneous, being susceptible to be invasive.
Fraxinus pennsylvanica Marsh. Tree frequently cultivated in forest plantations in order to replace the Amorpha fruticosa species. It is frequently present in the localities within the Delta Danube. Nowadays, it is considered sub-spontaneous and it is spread in the flooding areas. We recommend the species to be observed regularly considering its invasive character.
Ailanthus altissima (Mill.) Swingle
Cultivated frequently in the most of the localities. It is considered sub-spontaneous species, being present around localities, in forest plantations, on Popina Island, Doloşman Cape, Iancina, Taşburun and sometimes along channels. We consider it is a species to be observed regularly because of its easy spread character. Nowadays, it is catalogued as invasive species.
Gleditsia triacanthos L.
Ornamentally cultivated species in Mila 23, Sulina, Chilia, Gorgova, Sf. Gheorghe, Pardina and Periprava. It is also cultivated in forest plantations from where it has been sub-spontaneously spread within

44
drained areas.
Acer negundo L.
Ornamentally cultivated in localities and around these. The species is also cultivated in forest plantations from where it has spread in the rest of the Danube Delta channels, too.
Lycium barbarum L. Species used in the past to strengthen the soil. Nowadays, it has been observed on the territory of the Danube Delta in spontaneous around Sulina, Sf. Gheorghe, Maliuc, Crişan, Gorgova, Caraorman, Letea and Chilia localities. The species has been encountered during the study are in other locations such: Portiţa, Grindul Lupilor, Taşburun and Periteaşca.
4.2. Sensitivity of protected habitats
In order to evaluate the impact/effects of climate changes it has been carried out an analysis of the land on
the basis of the digital vegetation map after Hanganu et al., 2002; the interpretation has been carried out
with the help of ARCview 9.0 software. The vulnerability maps on flooding for natural and man-made
habitats have been elaborated at the DDBR habitat level taking into account the DDBR ecosystems maps
elaborated in 1998. All these maps have the Double Stereographic (1970) projection and coordinate
system. Concerning habitat loss indicators, we have focused on existing field data regarding hydrological
features and vegetation coverage. Both features have been monitored on the basis of quantitative and
qualitative indices for three years (2009, 2010 and 2011). On the basis of all these indicators, we have
carried out thematic maps on the entire territory of Danube Delta in order to spotlight the vulnerability
level of habitats depending on: regional drivers (economic activities described in the chapter 4); flooding;
habitat status (invasive plant species, biological indicators) and land use/cover (figure 4).
With a view to develop flooding vulnerability maps, grades have been ascribed to ecosystems from 0 to 9,
directly proportional with their vulnerability to flooding, on account of research carried out on prevailing
species within. Thus 0 stands for minimum while 9 stands for maximum. When grading, limit preferences of
plant species to extreme conditions have been considered. Habitats have been divided into man-induced
and natural ones with the purpose to employ specific approaches for each type separately.
Elaborating the map for DDBR habitats’ vulnerability to invasive species imposed the taking into account of
the scores (Braun-Blanquet) ascribed to invasive species having been identified in field within the studied
habitats. The grading scale has been translated to the types of ecosystems investigated in field. Thus the
value “-“ stands for the absence of an invasive species, therefore a minimum vulnerability, while the value
4 represents high abundance of invasive species, therefore it determines a high vulnerability of the
ecosystems where they are present.
Taking into account all the habitats from the Danube Delta Biosphere Reserve, having as basis the map of
vegetation unit, the map of habitat status relying on the Habitats Directive could be made up. This map
shows the percentage and the distribution of the habitats according to the European Directive
abovementioned and the other habitats as well. The other areas mainly consist of: localities, manmade
habitats for aquaculture, Populus sp., Salix sp. and Robinia pseudoacacia plantations on floodplain,
unclassified Natura 2000 habitats (bushes, reed beds, reed mace and sedges).
45
As it is stipulated in the concept of the Biosphere Reserve, the Danube Delta BR has some strictly protected
areas. The same exercise has also been done for these areas and the results can be seen in figure 13.
Fig. 13 DDBR vulnerability to flooding (Marian Mierlă in press data)
At this hydrograde, the highest areas on Letea, Caraorman, Stipoc sand dunes remain un-flooded, except
Saraturile and Chilia Plain; it has to be mentioned that in Dranov unit only 0.3 % (namely 961 ha) remained
uncovered by waters (Driga, 2004).
Strictly Protected Areas have various percentages for surfaces occupied by habitats excluded of Habitats
Directive. Thus there are some of them with percentages higher than 28% (Sacalin – Zatoane 41,37%,
Periteasca – Leahova 44,64% and Grindul Lupilor 42,38%). The increased percentage is given by wide
habitat surfaces populated with reed. On the other hand, there are lower percentages (e.g. Raducu
26,29%, Grindul Chituc 15,06%, Lacul Nebunu 4,93%);some of the Strictly Protected Areas only comprise
habitats included in the Directive (Letea, Lacul Rotund, Vatafu – Lunculet etc.). The influence of maritim -
featured habitats may be observed within SPA as well, thus Caraorman has 46,78%, Letea 47,24%, Grindul
Lupilor 38,94%, Grindul Chituc 73,27, Istria – Sinoe 91,56%.
The habitats most affected by flood events are those which are not protected by Habitats Directive
(manmade habitats for agriculture, localities etc.). Among the protected ones, forest habitats can be

46
counted as having low tolerance to water excess. Among the strictly protected areas with high vulnerability
there are Letea and Caraorman, the reason being that they include forest habitats. The habitats not being
vulnerable or having low vulnerability to flooding reveal higher vulnerability to drought. Drought within
DDBR is caused by the low level of Danube waters and implicitly of channels, streamlets and lakes, being
known the fact that the hydric balance is poor (precipitations are lower than evapo-transpiration). Some
authors emphasize that arid habitats, which occupy about 30% of Danube Delta area, are the most
sensitive with regard to increase of atmospheric CO2 and associated with global climate change. Increased
concentration of CO2 stimulates succession and dominance in plant communities of annual grasses. Shift in
favour of annual grasses, determined by global warming, can accelerate fire cycles, reduce biodiversity and
affect the functioning of ecosystems. There is no doubt that the dominance of annual adventives grasses in
arid ecosystems can be regarded as an indicator for the steppe habitats of the Danube Delta area.
As people alter the environment through activities like development, construction of dams, flood control
structures, and diversions of water, we change the volume and rate that water runs off the landscape, into
the ground, and into streams. Increased runoff can result in erosion and sedimentation.
Another consequence of climate changes with long-term effects is produced by the penetration and
development of invasive species either animal or plant. The present paper discusses invasive plant species
development. Vulnerability to invasive plant species within DDBR is represented in figure 14.
Taking into account the habitats that populate the DDBR surface, the map of vulnerability of DDBR has
been completed, as it was mentioned in the specific chapter.
Changing climatic conditions influence three essential elements of invasion: the source location, the
pathway and the destination (Dangles et al., 2008). Also, it could determine shifting species habitats and
species migration (to higher/lower elevations, to more friendly habitats etc.).
The native species that will not be able to migrate can disappear. Some studies have shown that short-term
changing climatic conditions may facilitate the long-term establishment of invasive alien plants (Dragotă et
al., 2011). The habitats with highest vulnerability towards invasive plant species are manmade habitats and
the neighbouring ones.

47
Fig. 14 DDBR vulnerability RBDD towards invasive plant species
(Marian Mierlă in press data)
Among these, agricultural arrangements and other arrangement types, localities etc. can be mentioned. As
far as habitats within strictly protected areas are concerned their vulnerability proves to be low. This may
be due to the isolation degree in each area. Invasive plants, by definition, have the ability to produce large
numbers of viable offspring at considerable distances from parent plants, thus having the potential to
spread quickly over large areas (Richardson et al., 2000). Non-native invasive plants may therefore be pre-
selected to take advantage of a changing climate because they have the potential to respond to shifting
niches more rapidly than natives (Dukes and Mooney, 1999). Furthermore, opportunities for exotic plants
in the alien habitat will differ from those in their native habitat because of the lack of competitors,
predators, or pathogens that constrained their native ranges. In Danube Delta the identified invasive plant
species are found on channels, canals and ponds’ banks, localities and riparian forests (Anastasiu et al.,
2007), have a preference for gleysols 68 %, alluvial soils 11 %, shifting sand dunes 8 % (Munteanu and
Curelariu, 1996); they also require a poor and moderate-drained soil (Gregory and James, 2003), but they

48
can grow in conditions of a poor soil, and they stand even the floods in the Danube Delta. Although their
development needs well-drained soils, they can resist in draught conditions like Gleditsia triacanthos and
can also tolerate strong winds (Crossman et al., 2011; Huxley, 1992), but cannot adapt on optimum
conditions to the coast area (Ailanthus altissima, Amorpha fruticosa, Fraxinus pennsylvanica) because of
the winds from the sea (Binggeli, 1996), except Elaeagnus angustifolia and Lycium barbarum. Also the
actual frequency of the species is not entirely based on natural spreading knowing that in the past most of
the alien species were massively planted. Nowadays, the human interventions in wetlands can haste the
spreading of the alien species. On the other hand, the natural vectors of spreading, in the new habitats, are
not entirely known. As a natural vector of distribution the studied alien plants are hydrochore and
zoochore, the only species mentioned as anemochore plant is Fraxinus pennsylvanica (Crossman et al.,
2011). Data related to the distribution of species based on natural vectors presents the hydrochoric and
zoochoric species that have a much higher distribution (Crossman et al., 2011; Harold et al., 2005;
Williamson and Fitter, 1996). In wetlands, the alien species, apart from their capacity to spread through
natural and disturbance regime of the habitats, have the dissemination potential in other areas less
favourable such as dry areas. It is certain that in such conditions, the species have a lower frequency and
they are less competitive compared to the indigene species. This fact is due to: the conditions of high
drainage of the soil; the high temperature at soil level; insolation; the distribution way of the plant species
in the arboreal floor.
4.3. Expected impacts of climate change on protected habitats
The climate of the land that surrounds the Danube Delta is continental, with hot dry summers and cold
winters. Clear-sky days average 66 days/annum in Tulcea, while Sfântu Gheorghe enjoys an average of 80
such days each year. Tulcea has some 2,260 hours of sunshine and Sfântu Gheorghe averages 2,502 hours
of sunshine each year. The influence of cyclonic weather from the Mediterranean tends to result in sudden
changes in weather and intensive rainfall, especially in summer. Temperatures can go below - 27˚C, though
close proximity to the Black Sea reduces the chill factor. The average annual temperature in Tulcea is 11˚C,
max 39.7˚C min – 27˚C. Similar measurements for Sfântu Gheorghe show an average of 11.4˚C, with
maxima of 36.3˚C and minima or –21.5˚C. The first date for autumn freezing in Tulcea is around the 31st
October, while Sfântu Gheorghe remains frost free until about the 12th November. Average rainfall is
higher in Tulcea, with 438.4 mm whereas Sfântu Gheorghe receives 403.6 mm. Average humidity is higher
in Sfântu Gheorghe at 86 % compared to Tulcea’s 80 %. The Biosphere Reserve is one of the windiest zones
in Romania.
Key climate
variables What is already happening What could happen
Global
temperature (C)
Three independent long records of global average (land and ocean) annual temperature show that the decade between 2002 and 2011 was 0.77 °C to 0.80 °C warmer than the pre-industrial average (end of 19
th century).
The Arctic has warmed significantly more than the globe as a whole.
The further rise in global average temperature is projected to be between 1.1–6.4 °C by 2100 taking climate model uncertainties into account. The EU target of limiting global average temperature increase to 2 °C above pre-industrial levels is projected to be

49
exceeded during the second half of this century and likely around 2050 for scenarios that assume no global mitigation policy. The Arctic is projected to warm more than the globe.
European
temperature (C)
The average temperature for the European land area for the last decade (2002–2011) is 1.3 °C above the pre-industrial level, which makes it the warmest decade on record. Heat waves have increased in frequency and length.
Land temperature in Europe is projected to increase between 2.5 °C and 4.0 °C by 2071–2100. The largest temperature increases during the 21st century are projected over eastern and northern Europe in winter and over southern Europe in summer. Heat waves are projected to become more frequent and last longer across Europe over the 21st century.
Regional
temperature (C)
The average annual air temperature increased by 0.5
оС in Tulcea and by 0.8
oC in Sfântu Gheorghe.
The amplitude is increased by 0.9OC in the last 30
years.
DCA: 2021-50, summer T – by 1.8-2.1°C, winter T - 1.4-1.5°C. DCA: 2071-2100: an increase of 3°C for all seasons and especially for summer an increase of about 4.1-4.5°C is simulated In 2021-50 periods the prediction’s scenarios shows an increasing of air temperature by 1.1
oC average. The
amplitude and abrupt changes in seasonal temperatures are predicted with an increase of 1.1
OC.
Precipitation (C) The average annual precipitation slightly decreased in the last 30 years. Moreover, the rainfall abundance (water quantity) increased.
DCA: 2021-2050: 5-15% decrease in annual precipitation, less summer rainfall and unchanged or slightly increased winter precipitation. In 2021-50 periods the prediction’s scenarios shows a decreasing of annual average precipitation by 5-10%.
Evaporation In the last decade it has been observed an increase of the average annual evaporation. The assumptions are based on less precipitation combined with an increased air and water temperature.
DCA: Modeling predicts 4% decrease of total evaporation. Present scenarios predict a slightly increase of the evaporation process.
Storms (C) Between 1990 and 2011 it has been recorded an increasing in intensity and frequency of the storms, especially in the coastal area.
Available climate change projections show no clear consensus in either the direction of movement or the intensity of storm activity. The expectations are unclear. No sufficient data to have a close prediction on storms frequencies and intensities.
Snow cover (C) In the last decade the snow cover slightly decreased in frequency, duration and quantity.
Model simulations project widespread reductions in the extent and duration of snow cover in Europe over the 21st century. Earlier snowmelt conditions;

50
slower/later build up of snow coverage and faster/earlier melting Reduction of the frequency, duration and amount of snow cover.
Runoff Water runoff during summer months decreased to a certain degree (from 26.9 to 25.6 % of annual discharge), while the total water content of the river increased. It has been observed a slightly decrease in summer period.
DCA: decrease of -5 to -20% until 2020 or rather a decrease of 0 to -23% until 2020 and -6 to -36% until 2070 Decrease by 5-15% in the next 30 years.
Water
temperature
Average annual temperature of water in the delta arms during 1961 – 2010 increased by 1
oС, and
maximum annual T – by 1,90С; in the Black Sea
northwards of 400 N, water T increased by 1.500C
and even more in coastal shallows, bays, gulfs, deltas, especially in summer time.
DCA: Increase in water temperature of all aquatic systems (rivers, lakes, groundwater bodies); less freezing periods in winter and less ice cover on lakes and rivers Considerable increase of the average annual water temperature mainly in the small lakes with insufficient water circulation.
Water flow The water flow is related with Danube River connectivity and Danube Delta hydrological inner system. However, water flow is interrelated also with total amount of precipitations from the Danube basin. In the last decade it has been observed a water shortages process.
Irretrievable water consumption will become greater due to higher irrigation needs. Models predictions shows an average annual low water table in the channels and very low water level/or no water in medium or small size lakes.
Drought In the most dry area of Romania (Dobrogea-Danube Delta) there were recorded slightly increases of drought periods.
Occurrence of droughts, water scarcity, heat waves and dry periods may increase by 10-20% in the period 2020-2025. Increase of drought periods by 10% in the next 30 years.
Wild fires Frequency of fires is increasing due to increasing intensities of droughts and heat in the Delta; at some parts of the delta fires became common in last years No records of wild fires. Only seasonal, mainly in autumn, man-caused fires on dry reed beds in order to gain large pasture area in the spring time.
Increase of risk of ignition of wild fires due to natural reasons as well as area of spreading of man-caused fires due to intensification of droughts. Possible wild fires in if the conditions are appropriate such as high temperature, long drought period, dry flammable vegetation and wind.
Sea level rise On the entire coast line the average the rate of sea level rise is 0,25 cm/average. The correlation is made with erosion and sand deposition process.
DCA: Increase of the sea level of the Black Sea; Possible retreat of inland Danube Delta. Black Sea water level increase rate: 0.25 cm/year (long term).
Flood In recent decades, due to earlier snowmelt in the Danube basin, the spring–summer flood peak begins 10–15 days (on the average) earlier than in previous years
1.
In the last decade more extreme flood phenomena has been recorded with high water table in all hydrological system of the Danube Delta. Already,
Frequency and intensity of floods, caused by local runoff will increase due to higher share of rainstorms in the total precipitation. Intensity and amplitudes of the Danube floods will increase. Role of liquid precipitation in forming of the flood conditions will increase.

51
in some parts, the system dykes fail. Floods in the coastal area will increase due to the rise of the sea level as well as due to increase of frequency and intensity of wind-caused water level fluctuations. Risk of failure of dykes along the Danube as well as dams on the small rivers. Increasing of frequency and intensity of floods. High risk of settlements to be flooded.
Lake and river
ice cover
In the last 10 years the frequency of ice cover on the lakes and Danube River decreased.
Frequency and intensity of ice conditions on all water bodies will decrease. Decreasing of ice cover in intensity and frequency.
Hypoxia Increasing frequency of hypoxia in the bottom layers of the sea caused by sharply pronounced thermo cline.
Frequency of hypoxia in the bottom layers of the sea will further increase. Content of dissolved oxygen will decrease in all water bodies, especially during the summer months. Amplitudes of daily fluctuations of O2-CO2 balance will increase. Decreasing of content dissolved oxygen in most of the lakes with low transparency and no water circulation or connectivity.
Coastal erosion As the World Ocean level rises, a threat of sand coast erosion increases, e.g. of Razelm and Sinoe lagoons in Romania. The delta ecosystems become very susceptible to the higher sea level.
Further rise of the Ocean and the sea levels will increase coastal erosion. Salt sea water will intrude further upstream into the Danube river and wetlands suppressing freshwater fauna and flora. Future climate change, in particular rising sea levels, is expected to accelerate coastal erosion.
Eutrophication Higher water temperature in summer months is leading to longer periods of algae blooms in lakes and wetlands. Water blooming in the sea surface appeared recently as a phenomenon. RO: Loss of breeding areas and eutrophication are two of the factors that have led to a decline in common carp. Tench have also increased, but these are a valuable species. A general increase in turbidity has led to a reduction in macrophytes, leading to changes in primary production.
Frequency and intensity of water blooming will increase. Share of toxic algae will increase Increasing of algal blooming in frequency because of hypoxia, low water table and high temperature.
Physical damage
to habitats
The increased frequency and intensity of extreme weather events led to more damage to vegetation
The risk of larger scale damage to biotopes will increase due to more intense flash floods, wildfires, storms etc.

52
Loss of
biodiversity and
mosaic wetlands
Field observations revealed some changes in vegetation structure and distribution such as forest species started to dry (Alnus glutinosa) ; in aquatic vegetation certain species, more adapted to the new conditions dominate the lake.
In the central and southern parts of the seaside in DBBR, the delta will grow intensively and fresh-water vegetation will develop here. However, the speed of vegetation formation is very high even now and in future, given the decay rate of the northern channels of the Kiliya arm, it will be still higher. Overgrowing of water basins will take place so that certain stages of the vegetation formation process drop out. This fact will result in degradation of higher water vegetation and appearance and increase of the share of inferior (algae) and adventives plant species. If no hydro land reclaiming works are started, this process will still enhance. Degradation of phyto- and biodiversity which commenced in the 80’s will be on-going.
Disappearing
rare species on
floodplains
Rare species of plants on floodplain ecosystems of the Danube delta are disappearing. Another example is about badgers and European mink that are very rare in this territory. The red list of DDBR contains a number of 382 species. More than 40% are species critically endangered.
Reduction of the Danube runoff accompanied with a temperature rise and more contrast weather events will worsen the water exchange and flushing of the flood plains. The water ecosystem will suffer secondary pollution with organic debris and it will intensify degradation of the floodplain ecosystem. Vegetation will become simpler; communities will fragment so that the share of the higher water vegetation diminishes. Changing the condition of the wetland will led to species disappearing.
Change of
vegetation on
islands
The changes of marine islands in the delta may be analyzed on Musura Island. Taking into account current considerable erosion process and sea currents.
Temperature rise and less runoff will cause more frequent arid periods, in that way increasing probability of fires on the islands. The higher Black Sea level will not, practically, take a toll on the island flora but, should the salt wedge rise above the island level. The share of plants with of higher capacity of nitrogen fixation (bladderwort) and other kinds of water plants resistant to a considerable eutrophication (meakin and myriad-leaf) will increase.

53
Declining ground
water and plant
diversity at sand
dunes and ridges
In Danube Delta Biosphere Reserve 128 alien plant species were identified (Doroftei & Covaliov, 2009). Most affected natural floodplain forest, meadows and beach sand dunes.
Further lowering of the ground water level due to less runoff in the Danube and increase of water temperature will increase probability of fires on the ridge.
Change in
dominant
communities
Share of reed communities in the delta is slightly declining especially at natural wetland areas. Low water level condition, especially in summer time, due to these “obstacles”, some channels and lakes get disconnected from their supply channels and can even become dry. This results in a significant modification of flora and fauna species behaviour, mostly negatively impacted from biodiversity point of view.
Higher water level will result in diminishing area of reed communities and more favourable conditions for Mace and Bulrush community in the lower parts of the Delta. An increase of the Black Sea level and more frequent wind-induced events will lead to formation of salt marshes and marsh/grassland communities.
Increase in fire
frequencies
Higher frequency of fires stimulates change in vegetation with more of marsh-and-grassland type and a greater share of meadow herbs and lower share of reeds.
This process of “meadowing” will continue in the future as fires become more frequent. A change of the reed wall structure will be the other negative consequence of fires as the ash elements accumulating in soil will make stems weaker, which reduces commercial quality of reed.
Longer growing
season
Reed growth and development period is changing, particularly its transition to winter stage. During the last 3-4 years, particularly in winter of 2011, leaf fall stage hardly occurred, and the time of starting commercial reed harvesting was delayed.
The temperature increase by 1.5-2.0 ºС will further lead to changes of the reed development period, particularly its transition to winter stage, which will substantially violate the timing of commercial reed mowing for export.
Salt water
intrusion
Increasing level of Black Sea that results in deeper penetration of salt water into the delta fosters development of commercial quality reed communities along the sea front of the delta.
Mineralization of the ecosystem will increase because of the rise of the Black Sea level. Reeds are sufficiently resistant to slight salting of water and soil, and it will lead to an increase of reed-dominated communities and salt-loving species. Besides, the reeds growing in subsaline habitats ripen quicker and its offshoots are much stronger and viscous which improves its roofing quality.
Phenology and
lifecycle
Changes in the life cycle and phenology of birds and fish will result in shift of migration timing including important commercial game species. Projections of the phenological responses of individual species are not available, but phenological changes are expected to

54
continue with projected further climate change.
Invasive species Number of alien species is growing in terrestrial ecosystems: Most of terrestrial and freshwater alien species are found on disturbed or altered wetlands or polders. The presence of a high number alien species and then expansion of invasive species resulted in emergence of both new species and associations, non-specific to deltaic territory so far. The introduction and spread of non-native species has also put pressure on less adaptable fish. Crucian carp have expanded their range since 1970 and the impact of the grass carp or silver carp is being monitored. Muskrat was introduced from North America in 1954 and it has established itself as one of the delta’s most plentiful mammals.
Non-native invasive plants may be better adapted and take advantage of a changing climate (Dukes and Mooney, 1999). Nowadays, the human interventions in wetlands can foster the spreading of the alien species. On the other hand, the natural factors of spreading in the new habitats are not entirely known. All this will further increase habitat fragmentation in the delta, decline of biodiversity and increase vulnerability of delta ecosystems to changing climate conditions.
Fish lifecycle The construction of polders in the late 1950s and 60s, to create farm and forest areas, reduced the area of the „Danube meadow” available in the flood season for spawning by carp and other commercially valuable species.
Increase of water temperature in the river and lakes will result in earlier spawning, fasters development of food supply and prolongation of the feeding period. Future climate changes will not trigger a considerable reduction in catches, though their qualitative composition may deteriorate. Fish production in the Danube Lakes can reduce due to worsening of water exchange and lower water quality. In summer greater fish mortality can be expected due to algae blooms.
Agriculture Overgrazing has been a problem and general spread of weeds has resulted. Grazing meadows vary according to soil conditions, with alluvial material providing the best land, salt flats and dune grasslands being the least productive. Grazing is important, however, because it helps to limit the spread of scrub over ecologically interesting grasslands. In the last decade the arable lands surfaces decreased, therefore the production decrease drastically.
Without any doubt, the longer vegetation period will make it possible to grow this crop within optimal period and reduce the harvest losses caused by its late harvesting. Increased risk of loss of winter crops due to less snow cover. Increased risk of physical damage to crops caused by events of extreme temperature contrast, fires, flash floods. Washing-out of nutrients from arable lands, intense soil erosion due to increased frequency of rainstorms.
Growing season
for agricultural
crops
Present conditions for seasonal crops are suitable from the duration perspective and improper from the humidity and water supply.
There will be some changes in crop species in order to increase the productivity of some adapted species.
Water-limited
crop productivity No efficiency of irrigation system because
of the water shortages. Irrigation water
requirement
In some areas will increase the water salinity because of the soil texture and low water table. Irrigation water system will fail.
Forestry and Forestry within the delta has enjoyed a rather There will be changes in forest structure

55
forest fires chequered history, mainly due to the use of inappropriate species to create plantations. Natural woodlands do not tend to suffer from the same problems, since they have evolved in balance with nature. Natural forests of willow, oak, ash, white poplar and aspen cover 8,000 ha of the territory. Plantation forests cover 5,400 ha, but this area is set to decline as the trees are cropped and natural forests are encouraged to regenerate for ecological reasons.
and species composition. More adapted species to climate change pressures will be present.
Energy Some villages (e.g. Gorgova) have no electricity
Need for diversification of energy sources. Better conditions for wind and solar energy production. Increased energy consumption for air conditioning/heating. Increased risk of physical damage to energy infrastructure.
Tourism In Romanian part of the delta tourism sector is highly developed, while Ukrainian part is still unlikely destination. However, there is a great potential for developing environmental tourism provided sufficient investment can be found for renovating and bringing existing facilities up to modern standards. In the context of the regional expansion of tourism, it sheds light on how a local family adapts to new economic conditions. The local family’s life revolves around tourism during the peak season, and unlike other tourist destinations, the members of the family, are the first to benefit from this business.
Even though tourism seems to be an important source of income, this type of activity is close connected to the main subsistence strategy, which is fishing. Furthermore, the tourist season only lasts for two months and so does this particularly work division and organization in the family.
Transport In most of the areas the terrestrial transport network is improper or inexistent. On the channel system is appropriate in medium or high water table conditions. The transport links to and from the Tulcea to inner delta have been improved in the last decade.
The channel system will remain the main connection transport within DDBR. For the terrestrial transport development there is necessary immense cost. However, the system will enhance the pressure on natural areas.
Fisheries and
aquaculture
Anadromous migratory fish are important to the delta fishery and three species of sturgeon and Danube herrings are netted as they move upstream from the Black Sea to spawn in freshwaters. The herring is caught between April – June and catches vary from season to season. The fluctuation may vary between 200 – 2,400 tonnes per annum. Sturgeons are declining in numbers and catches of 300 tonnes in 1960 had fallen to 6 tonnes in 1994. There is no doubt that the construction of dams; Iron Gates in 1970 and Ostrovul Mare in 1984, near Drobeta-Turnu Severin interrupted the upstream migration of sturgeons. But they are able to reproduce below these dams
Decreasing of sturgeons population because of climate changes and human pressure. The diversity and structure of the fish community varied among lakes and can be regarded as a good indicator of ecological state of lakes. The diversity of fish fauna is explained by changing in hydrology and water quality with effects on fish community distribution.

56
as well, and a programme of breeding and re-introduction is being carried out to boost their numbers. These efforts need to be combined with effective controls of poaching and overfishing.
Floods and
health
Risk of spread of infectious diseases increased due to inundation of drinking water pumping station in Reni in 2005 and 2011, caused by flash floods. In the last decade there were recorded several infectious diseases with high infecting potential on humans. Most of the viruses are related with wetland conditions and certain host species.
Greater health risks connected with extreme floods (injuries, drowning, heart attacks, consumption of low-quality drinking water etc. ) Increased risk of failure of dams on the small rivers may lead to big number of victims in case of severe rainstorm-caused flash floods. Increasing of pandemic frequencies and more resistance or large host’s spectrum of the viruses.
Drinking water Water supply system is inappropriate in some settlements. Most of the consumption is sustained by bottled water broth from outside of the Danube Delta.
There is already a deficit of water supply. Climate change effects will increase the pressure at regional level. The increased water consumption will generate extra costs.
Vector-borne
diseases
West Nile virus and other diseases are recorded as present in Danube Delta. According to 2003/99/EC Directive zoonosis is “any disease and / or infection which is naturally transmissible directly or indirectly between animals and humans” and zoonotic agent is “any virus, bacterium, fungus, parasite or other biological entity which is likely to cause a zoonosis”. A few decades ago, the reported incidences of human diseases associated with fish pathogens were rare and limited to certain countries, mainly due to their habits and lifestyle and thus little attention was paid to fish pathogens.
Increasing frequency and resistance of the viruses to the wetland conditions.
5. Existing and expected pressures on habitats
5.1. Identification and evaluation of stakeholder dialogue
Relatively low income of local population and living standards (especially in rural areas), high level
of latent unemployment and lack of opportunities for employment on the local level make the region
crucially vulnerable to climate change and its possible social and economic consequences. At the same,
time poor living conditions and significant dependence on natural resources and own labour can
characterize local people as more flexible to changing conditions. Most skills of local residents (especially in
rural areas) are closely linked to various types of use of natural resources. This can become crucial in the
context of adaptation to the climate change in case of severe alterations of availability of these resources.
The region is characterized with relatively medium level of education (22,6 % no education or primary
education; 51,5% of people have full secondary education and 25,9% – high education).

57
As vulnerable groups in DDBR it is considered anthropogenic activities: Fish-farms (45.232 ha, 7, 65 %) of
which 12.500 ha (2, 11 %) are abandoned, Agricultural (52.945 ha, 8, 95 %) of which 16.065 ha (2, 72 %) are
abandoned (arable land, pastures, vineyards and orchards) and forest arrangements 22.520 ha (plantations
and natural) (table 9).
1 Table 9. Vulnerability of major groups
Exposure unit Threat (adverse effect) Location scale Notes
Local population
Farmers
Water scarcity results in reduced crop yields and less employment opportunities
All settlements of the Danube Delta region
Lack of precipitation during vegetation period
Damage of crops due to cold spells Physical damage to crops caused by
extreme weather events and natural disasters
Damage of crops due to flash floods
Damage of crops due to fires
Low productivity because of pests and invasive species
More chemical substances (pesticides, insecticides etc.) are necessary in order to sustain the production.
Fishermen
More frequent droughts events lead to more fish mortality
Danube Drop in the water level in the Danube, sometimes causing a delayed spawning
Increasing temperature leads to less fish breeding places
Danube lakes Reducing the depth of the lakes due to increased evaporation, lack of oxygen
Increasing water temperature leads to more frequent fish kills
Danube River, Danube Lakes, small inner water bodies
Lack of dissolved oxygen
Fish mortality in hibernation pits Advanced Danube Delta and its small water bodies
Salinization of water due to sea level rise and sea water intrusion
Low water table The hydrological system of DDBR
Changes of vegetation structure and species composition. Limited fish resource and high pressure on spawning areas.
Local residents
Extreme heat waves lead to mortality and diseases
All settlements of the Danube Delta region
Possible of the growth of cardio-vascular and respiratory diseases because of more days with extreme temperatures
Increased costs for household maintenance
Increased costs for air conditioning, heating, increased water consumption due to temperature changes
Injuries, deaths Harm caused by extreme weather events and natural disasters
Further decrease of living standards
Decreased local availability of natural resources. Low

58
diversification of main economic sectors.
Diseases, deaths Riverside settlements Harm caused by consuming of water contaminated during toxic algae bloom
Dykes failure
All settlements and economic areas of the Danube Delta region
Physical damage to crops caused by extreme floods events
Owners of
buildings in
potentially
flooded area
Damage to/ destruction of buildings, infrastructure
Banks of all water bodies; areas under risk of flash floods
Authorities, management bodies and businesses
Management
bodies Damage of infrastructure
Whole Danube Delta Region
Damage caused by extreme weather events together with the increased resources and energy consumption.
Reed harvesting
businesses
Decrease of reed yields due to sea water level rise and intrusion of sea water
Area of Sf.Georghe and Sulina
Increased salinization may lead to lower productivity of reed-beds and lower commercial value of harvested reed
DDBR
management
Unsuitable management plans in accordance with climate changes effects
Entire area of the Danube Delta
Low efficiency of applied measures will conduct to the more economic loses.
Navigation Low water table
All navigable branches and channels of Danube Delta
Reduce traffic of large ships will result a negative impact on the economy.
Forestry
managers
Low wood production due to water shortages
All forested areas of Danube Delta
Additional pressure on natural forested areas.
Increasing of invasive species All forested areas of Danube Delta
Additional pressure on forested areas and pastures.
Tourist operators
Additional dependable and facilities in order to maintain visitors
All settlements of the Danube Delta region
Extra costs for tourism development and expensive services.
The Danube Delta Biosphere Reserve Administration, Romanian National Forests Administration, Romanian
Waters Administration (Apele Române), Fishing and Hunting Administration, Tulcea County Council and
local communities are land users/stakeholders of this area. Also private landowners who restrict access on
their land are stakeholders.
The stakeholders express difficulties due to climate change, but there is no real awareness or
considerations of the future. The Romanian Waters Administration (Apele Române) sees difficulties due to
droughts. The channels are inaccessible because of sedimentation or low water levels. There are concerns
by the reserve administration due to the decrease of reed beds. According to the new measurements a

59
slightly decrease of average biomass with 0.25% is registered, especially in the eastern fluvial part of the
wetland. Management practices such as burning and cutting can be favourable for reed development in
short periods, two or three years. As for the reed on compact floating islet the buoyancy is increasing due
to reed dominance and rhizome volume in opposition to other species. For sustainability, economic and
biodiversity purpose, it appears that is better to apply the system of crop rotation used on agricultural
fields (Covaliov et al., 2010). In forest areas dying trees are reported (especially alder and oak trees).
Changes in groundwater levels, especially in spring have negative effects on humid to dry vegetation. The
spreading of alien species causes difficulties, too. In fishery and hunting the decrease of species for hunting
and fishing is a problem, but the possible reasons for the decline aren’t known yet. The communes are
concerned about ineffective agriculture and the spread of diseases and pest on crops.
Statistically the main problem for biodiversity in the Danube Delta is the loss of habitats triggered by the
spreading of invasive species, forest clearing, dredging, over-grazing, and ditching of marshes for mosquito
control (isolate areas), mowing and erosion control activities. In present conditions, natural disturbances,
such as fires, floods, bank-slides and tree falls also have impact on the protected habitats. In general, it is
unknown if climate change effects or anthropogenic pressures are necessary to reduce by actions in order
to protect the habitats. Additionally there are concerns about flood management under the pressure of
climate change. The changing weather conditions may provoke hydrological alterations within the waters
that affect its ecological and chemical status negatively.
On the one hand droughts lead to a decrease in water flow, a disconnection of wetlands and floodplains,
changes in sediment transport, an increase in local pollution and insufficient groundwater recharge. The
drought could also lead to difficulties in water supply for various sectors. On the other hand flood events
increase the mobilization of pollutants, affect the basic physical and chemical conditions and amplify land
erosion with negative effects on aquatic organisms. Salt water intrusion in coastal areas may occur because
of sea level rise and/or the lowering of river levels.
The endangered species are subject to protection by special enforcement rules, zones with special
restrictions for fishery (saving zones), and strictly protected areas. Fishermen welcomed some protection
measures (e.g. the increase in mesh size), but they did not agree with the establishment of some protected
areas in the productive fishing zones. The fishermen often disobeyed the latter measure.
One of the main conflicts is the competition between fishermen and fish-eating birds, especially
cormorants. They are saying that approximate 30.000 cormorants catch 7 000 tons of fish per year, thereby
exceeding fishermen’s catches.

60
Fig. 15 Conflicts and perspectives (Staraș, 2001)
The actions promoted by DDBRA to protect some endangered species (e.g. sturgeons) are not welcomed by
local communities, as long as the protection regime does not cover the whole migration route upstream of
the Delta. There is a general awareness that the actions to reduce the local pollution and to participate in
regional programmes are pleading for the conservation of biodiversity and for the local economy. There is
only insignificant opposition to limiting the use of chemical substances in the Delta’s agriculture. The main
pollution sources are located upstream of the Delta. So the conflicts between economic development and
environmental protection need to be solved at the national and international level.
Table 10 Stakeholders and groups of interest in DDBR
Type of stakeholders or interest groups Name of the stakeholder
Administration (stakeholders) Danube Delta Biosphere Reserve Administration, Romanian National Forests Administration, Romanian Waters Administration, Fishing and Hunting Administration, Tulcea County Council, Local Councils from DDBR (C.A.Rosetii, Chilia, Crişan Maliuc, Sf. Gheorghe and Sulina) ANAR (flooding defence dikes), ANIF (suction basins, irrigation systems, hydro-technical constructions, channel II și channel V), APDM (maritime ports of the Danube), AFDJ (hydro-technical construction on Sulina channel), AZL (Sulina Free Zone Administration)
Nature conservation – NGOs (groups of interest) There are several of national, regional and local NGOs as group of interest for nature protection but they are not involved in the management and decision process. WWF-Romania, SOR, ECOS, Salvați Dunărea și Delta, Mare Nostrum.
Economic interest group (cession contract with DDBRA) Private companies for resources exploitation Tourism agencies and private tourism facilities
Users (interest groups) Different private land owners that restrict the access on

61
their propriety
Fig.16 Problems of nature conservation reported from DDBR
Table 11 Identified problems within DDBR according to the main stakeholders
Problems
Problems related to nature protection (ecological):
- Degradation of the grasslands areas (overgrazing and damages due to tourism) - Soil erosion and degradation - Noise - Visitors’ behaviour: Lighting fire in forbidden areas, throwing garbage, use of ATVs (all terrain vehicles) and SUV (sport-utility vehicles), illegal logging, poaching, park regulations are not respected - Massive garbage problem: visitors throw garbage everywhere, also lack of garbage collection - Lack of environmental awareness of visitors - Construction: tendency to extend the ski area, uncontrolled constructions in the parks’ surroundings Managers have to foreseen some activity adaptations due to climate change adopt action plans and present them to land users in the area.
Problems related to social/economic interests/factors:
- Little involvement of local communities in the management of the area - Lack of camping grounds - Chaotic economic exploitation of the area - Heavy rainfalls cause damage of access roads of the park - Political will and commitment depends on economical situation - Local inhabitants are a weak stakeholder group (not interested in participation) - Private interest is often put prior to public interest
Impacts of climate change
Romanian Waters Administration:
- Droughts - Inaccessible channels due to sedimentation or low water level because of too little rain

62
Danube Delta Biosphere Reserve Administration: - Reed bed die-back Romanian National Forests Administration:
- Forest drying, especially alder and oak trees - Changes of type of vegetation from humid to dry because of less available groundwater in spring periods - Increase of existent invasive species or appearance of new invasive species Fishing and Hunting Administration:
- Less species for hunting and fishing Local councils:
- Ineffective agriculture and more diseases or pests on crops (cereals) - Extreme rainfall rates and temporary lack of rain cause either surface runoff or drought - Climate change might cause expansion of invasive species - Occurrence of stronger winds, increased winter and summer temperatures and droughts makes wetlands more sensitive and vulnerable, their area will decrease
Awareness
Low awareness, no planned adaptation to climate change.
Low awareness, there is little knowledge and no regular conversation about climate change. Adaptation is not planned; stakeholders just react to present problems. Positive process: water management authority started to approach inundations of fields by retaining water on the grasslands instead of draining fields (benefits wetlands and microclimate). So far no actions involving climate-change scenarios have been taken. Climate-change scenarios can be the crucial aspects of management plans. However, with no statements and analysis done in this matter, none of the impacts and factors can be analysed so far. As there is no general strategy, most of the conflicts are trying to be solved locally and individually. Some awareness of owners, very low awareness of tourists, lack of knowledge and information, no adaptation to climate change yet. Owners have started to take action such as sowing of ski lawns, torrents control, controlled cutting down of trees, making ecological paths in tourist areas, teaching tourists how important environmental protection is.
Table 12 Stakeholder dialogue and communication
Communication structures
Legal dispute: between DDBR Administration and town halls of the settlements from the Danube Delta concerning land use and settlements expanding in natural areas (habitat fragmentation); Between County Council, DDBR Administration and private land owners concerning land use and access
Conflicts (communication)
Romanian National Forests Administration (ROMSILVA) and the inhabitants: poaching and habitat fragmentation (illegal deforestation); DDBR Administration and inhabitants: poaching (fishing and hunting in protected areas) and illegal reed burning in large areas that affects the biodiversity; Property rights in Romania are very strong and the state institutions don’t have the authority to interfere in land owners activities Forestry: forest calamities (bark beetles on spruce) are accepted in core area of the biosphere reserve, which pressures neighbouring spruce sites Conflicts between forestry and tourism concerning use of forest roads Regeneration of forests with native tree species is difficult due to raised deer population Natural forest rejuvenation with deciduous trees and rare species is threatened by excessive game population that causes damages (stakeholders: hunters, tourists with interests in animal observation), natural rejuvenation makes effective hunting more difficult due to rich forest structure (hunting is limited by topical hunting laws) Forestry-nature conservation: Use of tree species that are considered highly productive and adapted to climate

63
change (neophytes) may conflict nature conservation goals. - Citizens’ initiative/local administrations/tourists: tourist use of landscape (walking and hiking trails, rehabilitation of wetlands) - Conflicts concerning tree preservation byelaws between landowners and local nature conservation authority - Farmers/landowners: permissions under building and nature conservation law (building in the landscape, installation of biomass systems, tree protection byelaws) - Fishery and anglers organisation: use of lakes, river systems - Forestry: forest transformation without forestry use, afforestation in sensitive ecosystems
Adaptation of communication strategies under climate change
Climate change is not yet a topic of communication. Starting a dialogue is quite a challenge, because a minimum agreement about economic interests and nature protection objectives is needed in order to achieve something. Regarding the protected areas, the inhabitants are mostly poor or land owners are politically sustained, the state institutions are struggling to maintain, monitor and control the biodiversity and climate change effects in protected areas that are privately owned. Stakeholders show some awareness but little knowledge about climate change and its impacts. The communication structures seem to be weak. Project on measures and strategies to cope with climate change since 2007, activities: Several studies were carried out for regional appraisal of climate change and the development of climate protection and adaptation strategies in the Danube Delta Biosphere Reserve information events with presentation of the study (target group: local stakeholders) Environmental education: information events about climate change, promotion of renewable energy, renewable biomass for municipalities, citizens, local stakeholders and pupils, demonstration of sustainable cropping methods in cooperation with the agronomic research institutes (demonstration of field tests, lectures, guided tours, target group: local farmers) Round tables: (target group: local entrepreneurs, politicians, municipality representatives); support of best practice projects (bio energy, renewable energy); Organization of workshops on agriculture and mobility, climate tour, exchange of information and experience, target group: local stakeholders. The purpose is to raise the public awareness. We are searching for new ways for stakeholder dialogues, to involve them and to initiate projects. There is need to expand communication because of low awareness. Stakeholders are involved in the planning process for protected areas (Natura 2000 sites) (working-groups, information events), adaption is not the main topic. Conflicting stakeholders are members of Nature park management board; the majority of members come from agriculture: farmers and land users may have strong influence on Nature Park Law and management plan.
5.2. Description of expected land-use changes and resulting pressures on habitats
Land cover as indicator presents further information about different levels of occupation from the survey
units’ point of view. However, it can suggest a reduced amount of information about the dynamic process
that establishes the decline/degradation of the habitats from the area. The coverage represents the
projection of the above ground of the vegetation, water surface, bare areas and settlements on the
analyzed surface.
From the analysis perspective the land cover as indicator presents further information about different
levels of occupation from the survey units’ point of view. However, it can suggest a reduced amount of
information about the dynamic process that establishes the decline/degradation of the habitats from the
area.
The coverage represents the projection of the above ground of the vegetation, water surface, bare areas
and settlements on the analyzed surface. From side to side, its values can quantify the degree of human
land use (HLU) and natural land coverage (NLC). Therefore, these areas can be core spots that can highlight
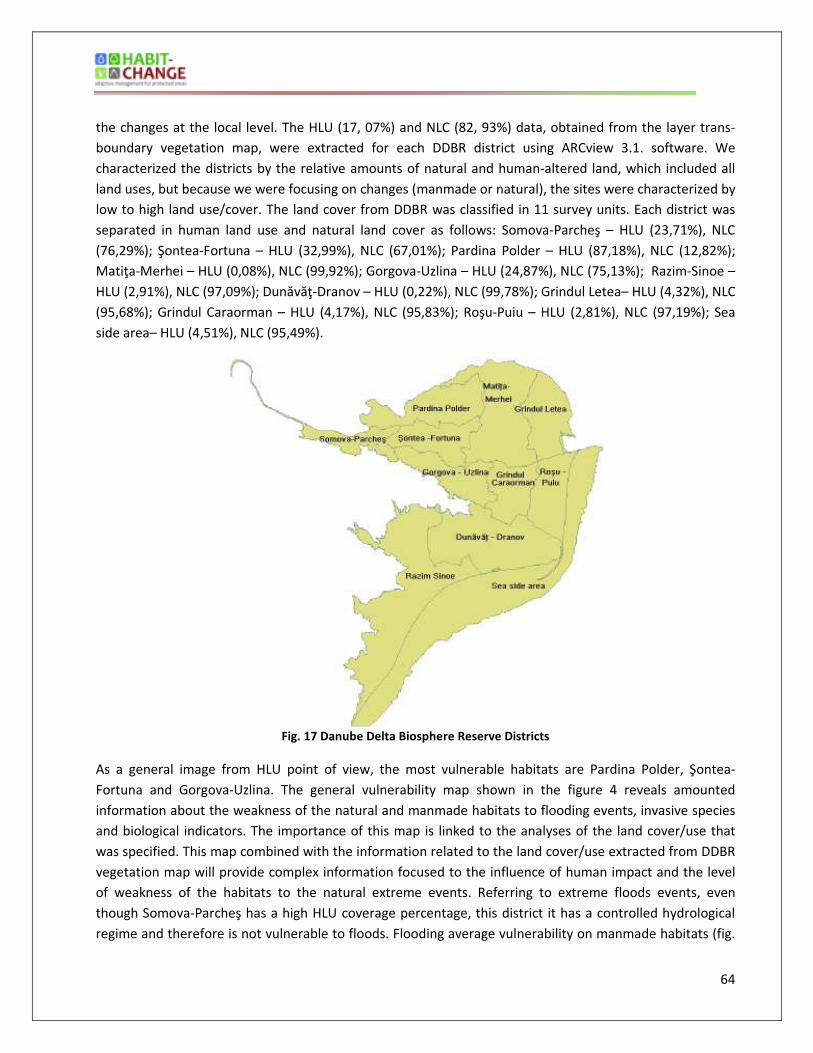
64
the changes at the local level. The HLU (17, 07%) and NLC (82, 93%) data, obtained from the layer trans-
boundary vegetation map, were extracted for each DDBR district using ARCview 3.1. software. We
characterized the districts by the relative amounts of natural and human-altered land, which included all
land uses, but because we were focusing on changes (manmade or natural), the sites were characterized by
low to high land use/cover. The land cover from DDBR was classified in 11 survey units. Each district was
separated in human land use and natural land cover as follows: Somova-Parcheş – HLU (23,71%), NLC
(76,29%); Şontea-Fortuna – HLU (32,99%), NLC (67,01%); Pardina Polder – HLU (87,18%), NLC (12,82%);
Matiţa-Merhei – HLU (0,08%), NLC (99,92%); Gorgova-Uzlina – HLU (24,87%), NLC (75,13%); Razim-Sinoe –
HLU (2,91%), NLC (97,09%); Dunăvăţ-Dranov – HLU (0,22%), NLC (99,78%); Grindul Letea– HLU (4,32%), NLC
(95,68%); Grindul Caraorman – HLU (4,17%), NLC (95,83%); Roşu-Puiu – HLU (2,81%), NLC (97,19%); Sea
side area– HLU (4,51%), NLC (95,49%).
Fig. 17 Danube Delta Biosphere Reserve Districts
As a general image from HLU point of view, the most vulnerable habitats are Pardina Polder, Şontea-
Fortuna and Gorgova-Uzlina. The general vulnerability map shown in the figure 4 reveals amounted
information about the weakness of the natural and manmade habitats to flooding events, invasive species
and biological indicators. The importance of this map is linked to the analyses of the land cover/use that
was specified. This map combined with the information related to the land cover/use extracted from DDBR
vegetation map will provide complex information focused to the influence of human impact and the level
of weakness of the habitats to the natural extreme events. Referring to extreme floods events, even
though Somova-Parcheş has a high HLU coverage percentage, this district it has a controlled hydrological
regime and therefore is not vulnerable to floods. Flooding average vulnerability on manmade habitats (fig.

65
1) is higher in and around the settlements, in arable lands and plantations in districts such as: Pardina
Polder; Roşu-Puiu (east part), Şontea-Fortuna (west part), Gorgova-Uzlina (east and south part) and Grindul
Letea (south part). As for average flooding vulnerability in natural habitats we can say is lower in central
part of DDBR, and higher in north at Tatanir and Tătaru area; in south at Grindul Lupilor and Grindul Istria;
in east at Canalul Sondei area. Vulnerability to drought is considered to be higher in districts with
agriculture areas and settlements (if we take in account the households) such as: Pardina Polder, Somova-
Parcheş and east parts of Şontea–Fortuna and Gorgova-Uzlina. Concerning the spreading of invasive plants,
we highlight the most exposed areas in and around the settlements, arable lands and plantations. In the
same category we can include also branches and channels, which are frequently dredged.
Table 13 Land use/cover units in DDBR
Survey units
DDBR district
So
mo
va
-Pa
rch
eş
Şo
nte
a -
Fo
rtu
na
Pa
rdin
a P
old
er
Ma
tiţa
-M
erh
ei
Go
rgo
va
- U
zlin
a
Ra
zim
Sin
oe
Du
nă
vă
ţ -
Dra
no
v
Gri
nd
ul
Lete
a
Gri
nd
ul
Ca
rao
rma
n
Ro
şu -
Pu
iu
Se
a s
ide
are
a
Human land use %
Settlements 18,94 1,97 0,56 - 1,02 - - 4,17 2,97 0,21 -
Fish ponds - 1,20 1,56 0,01 8,25 2,91 0,22 - 0,24 2,09 -
Agriculture areas - 20,35 83,52 - 6,84 - - 0,15 - 0,51 -
Planted flood plain forest
4,77 9,47 1,54 0,07 8,76 - - - 0,96 4,51
Natural land cover %
Natural flood plain forest
4,42 15,78 2,63 1,02 5,61 - 0,31 - 0,78 0,04 -
Natural dune forest
- - - - - - - 9,32 5,62 - -
Marshy vegetation 54,79 33,88 5,04 76,42 41,73 2,31 74,05 55,43 51,06 22,47 8,5
Lakes 15,58 13,20 0,93 21 20,28 94,66 21,73 3,15 0,07 73,93 1,39
Sea dunes - - - - - - 0,92 15,51 6,57 0,16 85,6
Steppe/dry areas - - - - - 0,12 0,14 11,54 31,57 0,24 -
Grasslands 1,5 4,15 4,22 1,48 7,51 - 2,63 0,73 0,16 0,35 -
The Danube Delta land-use structure is the following: 58.2 % of the area is in a natural state (river
and marine levees with forests and pastures, canals, lakes, swamps - part of them protected) and 41.8 %
agricultural polders, fish ponds, forest plantations. Noteworthy, the Danube Delta is to undergo some
ecological management. Since ancient times, fishing has been the main occupation of the Danube Delta
inhabitants and although today the supply of fish has diminished and changed in quality, it continues to be
basic trade. A second major occupation has been (and still is) sheep, cattle and, after 1990, horse breeding.
Traditional agriculture has been practiced successfully by the inhabitants of the settlements situated on the
riverine levees at low risk from flooding. After 1960, these traditional occupations were drastically modified

66
by the extension of reed exploitation (later abandoned, presently small areas are exploited), fish ponds
(abandoned after 1990), large agricultural polders (also partly abandoned) and forest plantations (still
active).
The fisheries were the most important natural resource of DDBR and comprise all the areas covered with
water temporarily or permanently.
Fig.18 Land fragmentation in CAMP area
The construction of polders in the late 1950s and 60s, to create farm and forest areas, reduced the area of
the „Danube meadow” available in the flood season for spawning by carp and other commercially valuable
species. Presently, most of the areas are abandoned, because of economic fish stock regress, and
developing of exotic fish species less valuable. Catches of fish have declined from around, 15,000 tonnes
(10 – 20,000) in the 1960s, to 5 – 6,000 tonnes by 1994. Presently there is no clear evidence in fish catches
in Danube Delta. The official reports of the Danube Delta Biosphere Reserve Administration and National
Agency for Fishing and Aquaculture (NAFA) mention in 2011 - 2100 tonnes and in 2012 - 1800 tonnes. It
can be assumed, according to the general tendencies, the fish catch is still decreasing for a several reasons:
• due to no input of fish offspring in natural system from fish farms;
• the fish exploitation is increased;
• the poaching with illegal methods increased (electric, carbide);
• the authorities (DDBRA and NAFA) are not receiving, intentionally, the clear status of the catches
from the private companies.
The inhabitants that are still using the traditional fishing methods are complaining about reduced
catches too from qualitative (small individuals, less species, less valuable) and quantitative point of view.
Traditional fishing includes the netting and trapping of freshwater fish, netting of migratory fish (like

67
sturgeons – prohibited, legally, until 2016 by CITES, Danube herring and Black Sea salmon) and netting or
line fishing of fish in the Black Sea. The fisherman from the Black Sea area (Sulina and Sf. Gheorghe
localities), additionally, reported in the last years more and more dolphins (mainly Tursiops truncatus)
caught in the nets. The main issue is the fish resource, either the dolphins get closer to the shore for
feeding areas either the fisherman goes further (up to 30-40 km) in the sea. As we may see from the
description of the fishing tools and techniques, it is obvious that there is a strong relationship between the
fishermen and the nature. First of all they had to know the nature very well so that they can dominate it
and use its resources for their life necessities. Also the fishermen of the village have always been aware of
the sustainable use of the natural resources. The fishermen had to acquire knowledge not only about the
fishing tools that they used but also of the fish species and of the environment where fish species live or
migrate. And as we have seen they have to know where they can find the fishes and they have also to know
how they can fish them combining environment knowledge with the practical fishing techniques.
Agricultural activities are the split responsibility of the County of Tulcea, town councils and the Central
Board of Agriculture, while the ARBDD monitors effects of farming activities on ecosystems. This is not an
efficient administrative system and much land has been abandoned by former tenants of the County.
Agricultural arrangements started in 1895 and ended in 1898. In 1964 there were 661 lakes of over 1 ha,
summing up 31.493 ha (9.49 % of the delta area), in the present there are 479 lakes and 25.794 ha, that is
8, 06 % of the delta area because of drainage and desiccation activities for creation of agriculture lands.
Presently, most of the areas are abandoned because of lack of man power, soil salinization, reduction of
organic carbon and the input (chemical substances, combustible, fertilizers) larger then output
(production). The active agriculture areas are ineffective, because of abundance of alien and anthropogenic
species such as Amaranthus sp., Xanthium sp. etc.
The natural meadows within the delta cover some 22,500 ha and most of these are „common” grazing, on
which local people can graze their animals under licence. Overgrazing has been a problem and general
spread of weeds has resulted. Grazing meadows vary according to soil conditions, with alluvial material
providing the best land, salt flats and dune grasslands being the least productive.
Grazing is important, however, because it helps to limit the spread of scrub over ecologically interesting
grasslands. Statistics on the number of domestic animals kept in the delta are interesting, but rather
academic – given the general decline in farming activities within the territory. The number of cattle
reached 8,000 head some years ago, of which fewer than 30 % were used for milk production. Local breeds
of beef cattle have been bred to provide adaptability to the difficult conditions found within the main
delta. Around 60,500 sheep are kept, mainly for milk production. Most are concentrated on the continental
sandbanks of Chilia and Stipoc, where of loess type soils tend to be well drained. Other areas were the
domestic animals are grazing, are within strictly protected areas of Letea forest and sand dunes (91F0,
92D0 habitat types), Sacalin Island (1210, 1310, 1410, 2110 habitat types) and Caraorman forest and sand
dunes (91F0, 92D0, 2130*, 2190, 1310, 1410 habitat types). Although the activity is prohibited, it seems an
overwhelming situation for the authorities (DDBRA, ROMSILVA).

68
The reason for this conflict is the low quality and reduces areas of meadows in comparison with real
number of domestic animals. In these conditions, the new measures for climate change adaptation can be
difficult to apply these areas designed only for biodiversity protection.
Fig. 19.Meadows categories in DDBR
Reeds (Phragmites australis) are ecologically and economically very important in the delta. Seasonally
(winter and early spring) can provide a source of income for the inhabitants. Reeds are still cut on a
commercial basis and there is now a strong export trade. Locally, they are used for roof making, fencing,
matting and wall lining. Reeds were cut for the manufacture of cellulose in the 1960s, but as explained
earlier in this synopsis, the machinery used to harvest the reeds damaged or destroyed some of the reed
beds (Gâștescu & Știucă, 2008). Presently there is no private local association of reed harvesters; the
inhabitants are employed and very poor compensated by outside the DDBR private companies.
Ecologically, they provide a vital habitat for invertebrates, amphibian, fish, birds and mammals whilst
acting as natural water filters.
The average biomass of Danube Delta reed beds at the beginning of the ’90 (Chifu et al., 1993) was 1.53
Kg/m2, nowadays following the results of each reed complex area, the average biomass is 1.25 Kg/m2. New
measurements show that it is a slight decline of the reed bed areas of an average of 0.25 % with a
particularly high rate in the eastern fluvial part of the delta. An increase in reed area of 0.4 % was observed

69
only in reed complexes with psamosoils and salinised organic soils, during the 2002-2010 periods. Such an
average rate, even though it leads to a 50 % disappearance of the reed bed in a 250 year period (Covaliov
et al., 2010). Most major changes observed were related to deep water lakes and floating reed beds. At the
edge of the lakes we observed decline but no re-colonization within the study period. Most edges of reed
beds around those large lakes are sharp erosion edges rather than colonization margins. We observed that
the thickest reed beds with the highest reed dominance and rhizome volumes had been burnt rather
recently (burned stumps). Fire seems to favor reed at the expense of other species and particularly willows
(Salix cinerea) and ferns, both species causing decrease in buoyancy (Nevel et al., 1997). On the short time
scale, fire does probably block the colonization by non reed species, favor buoyancy and strengthen
floating reed beds. Reed harvesting, when it was done on ice and at a large scale, probably had similar
effect. The use of fire as a management tool to block succession would probably decrease this decline. In
any case, a monitoring of fires set by local inhabitants would be of prime importance (Covaliov et al., 2010).
Taking into consideration the exceptional conditions of the water level, field information have been
corroborated with previous year’s reference for closer-to-reality estimations. This fact is necessary being
given that many fields suffer from flooding with negative or positive influence upon vegetal species
development depending on their preference for the hydrological factor (favoring the mezohigrophyte and
hydrophyte species, disfavoring the mezoxerophyte and xerophyte species) and for the nutrient amount.
At the same time, flooding some field for long periods influences competitive effects between particular
species such as the competition reed-bulrush or reed reed-mace (Covaliov et al., 2010).
Sustainable management of reed dominated wetlands requires the conservation of the components of the
ecosystem and their characteristics as far as the present climatic and geomorphic conditions are kept.
Spatial and temporal fluctuations are part of the characteristics of reed stands, particularly in the
temperate zone. So, in order to decide if a management practice must be implemented in a reed
dominated wetland, at local scale, it must be defined if the observed characteristics are part of their
seasonal and inter-annual fluctuations or are part of a trend which indicates that a degradation process is
taking place (Covaliov et al., 2010). The changes in the characteristics of a reed wetland may be artificially
induced. Man-made disturbance is the most frequent cause of loss or expansion of common reed stands.
The die-back process is responsible for loss of more than 50% of the common reed habitat in many places
in north and central Europe (Ostendorp, 1989). However, it has been a common fact also that expansion of
the common reed stand in many south Europe wetlands took place mostly because of man regulation,
mostly temporal homogenization, of water flow and level.
It may be a general trend of changes of the spatial distribution of habitats in a territory, including
expansion or reduction of the common reed beds. Phragmites australis is a salt tolerant species which may
grow in soils where the salt concentration of the interstitial water reaches 50 psu (Hellings & Gallagher,
1992). The common reed beds become more homogeneous and plant growth may recover if exposure to
brackish conditions is short (a few weeks) and flushing with freshwater proceeds later.
Economically, that is why the most appreciated eco-type of reed is on slightly salinised psamosoils or
salinised organic soils, which is very compact and thin comparing with the other. Naturally, it is a more
sustainable strategy to let the habitat distribution of the territory to evolve under the climatic and
geomorphic forces, not directly induced by anthropogenic activities, than try to maintain a constant spatial

70
distribution of habitats. On the contrary, yearly burning of the same areas can be considered a non-
sustainable practice on a 20 years management plan, because it contributes to green-house gas increase in
the atmosphere (Brix et al., 2001), and also can contribute to biodiversity reduction, in time. Another
aspect of this practice management show, according to literature data, that in the spring period there were
identified several bird species nesting on the ground. It appears in some cases that the burning process
during the winter, when the soil is frozen can be an advantage in spring time for certain birds species that
are usually nest on the ground or in shallow waters (Covaliov, 2003-2007) However, reed beds surfaces
design to be harvested in every reed complex can be rotated similar to the crop rotation for common land
agriculture. For example, the reed surface designed to be burnt this winter will be the harvest area for the
next year, and then it should be cast off for another year in biodiversity purpose.
Fig. 20 The habitat state in accordance with human interventions (after Staraș, 2001)
71
The forest arrangements, apart from 5.075 ha (Letea and Caraorman forests) the rest of the areas are
plantations or controlled. In 1975 the forest arrangements where constituted from natural forests,
presently, most of the areas are economically (profit) directed. The hybrid poplar plantations, black locust
(Robinia pseudoacacia) and green ash (Fraxinus pennsylvanica) plantations are the most disturbing areas
for natural surroundings. The black locust and green ash are alien plant species present in entire delta. The
indigo bush (Amorpha fruticosa), which is another alien plant species; it develops in shrub layer of polar
plantation and from here its spread in natural habitats. From management perspective, this species
generate economic losses. The exploitation process is longer, more difficult and expensive; in order to
extract the wood (eg. Populus canadensis), first, it’s necessary to clear/cut the unwanted shrub layer of
Amorpha fruticosa. Forestry within the delta has enjoyed a rather chequered history, mainly due to the use
of inappropriate species to create plantations. Natural woodlands (forest, bushes and glades areas) do not
tend to suffer from the same problems or the process is slower, since they have evolved naturally. Natural
forests of willow, oak, ash, white poplar and aspen cover 8,000 ha of the territory. Plantation forests cover
5,400 ha, but this area is set to decline as the trees are cropped and natural forests are encouraged to
regenerate for ecological reasons.
5.3. Interaction of climate and non-climate induced pressures
The natural designated area Danube Delta Biosphere Reserve, also classified as Ramsar, starting from 1990,
and Natura 2000 site (SCI and SPA) has been established in order to reduce the loss of biodiversity by
providing and conserving habitat space for important or sensitive species. The worldwide concern has
acknowledged that the effects of climate change can disturb habitat diversity by degradation, space
reduction and species competition (UNFCCC, 2007), made either by invasive to native species or native to
native (Westbrooks, 2001). On the other hand, the human settlements, like everywhere else, confront with
economic loss that cannot be coped with. It is worldwide considered that anthropogenic activity is the
main issue for on-going habitat loss, thus generating additional pressure on environment and at the same
time on humans back again. Throughout Europe, in both rural and urban areas, there is a growing need to
manage water, in terms of flood-risk, water supply and water quality. For example, repeated drying and
flooding can be highly destructive to habitats, human settlements and their resources. At regional scale,
there is a lack of knowledge with regard to policies and management practices adapted to climate change
effects. At site level, not all the water-based ecosystems are translated into Natura 2000 habitat maps
(Doroftei et al. 2011). Alongside a latitudinal gradient, habitats have to cope with gradually changing
climatic conditions in the amount of precipitation, flooding and temperature and contrasts between
seasons (Clevering, 2001). On the other hand, the pressure types of different land-use policies, which
changed the Danube Delta natural hydro-morphological features, had consequences on the natural
habitats (Staras, 2001). The more key habitats are involved in the evaluation process, the more accurate
and objective are the results. Habitats have a much greater buffering and are able to mitigate the effects of
many changes (Richardson, 2000). Therefore, to assess the impact of climate change, we have chosen to
start from the indicator species to the habitats which include these species. The important issue was to
select those habitats that are most vulnerable, occupy small surfaces, and are included in strictly protected
areas. These types of habitats are represented by coastal formations, sand dune forest, and salt marshes.

72
All these habitats are theoretically belonging to at least two bio-geographical zones as follows: Steppe
bioregion and Pontic bioregion (Doniță et al. 2005). The characteristic of the Steppe region lies in that there
are few precipitations and the mean temperature is higher than in the other bioregions. The Pontic region
has the temperature gap lower than the other bioregions. Research has been conducted in the entire area
covered by the Danube Delta Biosphere Reserve (Romania). Within this protected site, the Black Sea
coastline as well as the area between Chilia and Sf. Gheorghe branches has been studied so far. Special
focus was on hydrological changes in terms of amount of flooding and its residence, the drought and its
duration and temperature and its amplitude. In order to highlight the climate change effects on habitats
we have developed thematic maps representing the vulnerability for flooding and invasive species, all of
these worsened by human activities.
Table 14 List of climate and non-climate induced pressures (Doroftei and Mierlă, 2012)
Pressures Topic Climatic cause
Direct Indirect
Antagonism arising from introduction of species Climate/ land use x
Antagonism with domestic animals Management/ land use activities x
Artificial planting Land use x
Canalisation Infrastructure x
Dispersed habitation Land use/ land use structure x
Lack of precipitation/ Drought Climate x
Extreme temperature events Climate x
Erosion Climate x
Eutrophication Management/ land use activities x
Flooding Climate x
Grazing/ overgrazing Management/ land use activities x
Groundwater level (decline of) Management/ land use activities x
Habitats loss Land use/ natural development x
Management of aquatic and bank vegetation for drainage purposes
Land use x
Management of water levels Management/ land use activities x
Modification of hydrographic functioning, general Management/ land use activities x
Other leisure and tourism impacts not referred to above
Tourism, Sport x
Other natural processes Natural development x
Silting up Management/ land use activities x
Water level changes Climate x

73
Table 15. List of identified pressures on habitats (Doroftei and Mierlă, 2012) H
ab
ita
t ty
pe
De
scri
pti
on
of
the
ha
bit
at
Co
nse
rva
tio
n s
tatu
s
An
tag
on
ism
ari
sin
g f
rom
in
tro
du
ctio
n o
f
spe
cie
s
An
tag
on
ism
wit
h d
om
est
ic a
nim
als
Art
ific
ial
pla
nti
ng
Ca
na
lisa
tio
n
Dis
pe
rse
d h
ab
ita
tio
n
Lack
of
pre
cip
ita
tio
n/D
rou
gh
t
Ex
tre
me
te
mp
era
ture
ev
en
ts
Ero
sio
n
Eu
tro
ph
ica
tio
n
Flo
od
ing
Gra
zin
g/
ov
erg
razi
ng
Gro
un
dw
ate
r le
ve
l (d
ecl
ine
of)
Ha
bit
at
/sp
eci
es
loss
Ma
na
ge
me
nt
of
aq
ua
tic
an
d b
an
k
ve
ge
tati
on
fo
r d
rain
ag
e p
urp
ose
s
Ma
na
ge
me
nt
of
wa
ter
lev
els
Mo
dif
ica
tio
n o
f h
yd
rog
rap
hic
fu
nct
ion
ing
,
ge
ne
ral
Oth
er
leis
ure
an
d t
ou
rism
im
pa
cts
no
t
refe
rre
d t
o a
bo
ve
Oth
er
na
tura
l p
roce
sse
s
Sil
tin
g u
p
Wa
ter
lev
el
cha
ng
es
1110 Sand banks which are slightly covered by sea water all the time
B x x
1130 Estuaries B x x x
1140 Mudflats and sandflats not covered by seawater at low tide
B x x x
1150* Coastal lagoons B x x x x x
1160 Large shallow inlets and bays
B x x
1210 Annual vegetation of drift lines
B x x x x x x x x
1310 Salicornia and other annuals colonizing mud and sand
B x x x x x
1410 Mediterranean A x x x x x x x x

74
salt meadows (Juncetalia
maritimi)
1530* Pannonic salt steppes and salt marshes
B x x x x x
2110 Embryonic shifting dunes
B x x x x x
2130* Fixed coastal dunes with herbaceous vegetation ("grey dunes")
A x x x x x x
2160 Dunes with Hippophaë rhamnoides
A x x x
2190 Humid dune slack A x x x x
3130 Oligotrophic to mesotrophic standing waters with vegetation of the Littorelletea uniflorae and/or of the Isoëto Nanojuncetea
A x x x x x x x x
3140 Hard oligo-mesotrophic waters with benthic vegetation of Chara spp.
B x x x x
3150 Natural eutrophic lakes with Magnopotamion or Hydrocharition
A x x x x x x x x x

75
- type vegetation
3160 Natural dystrophic lakes and ponds
B x x x x x
3260 Water courses of plain to mountain levels with the Ranunculion
fluitantis and Callitricho-
Batrachion vegetation
B x x x x x
3270 Rivers with muddy banks with Chenopodion
rubri p.p. and Bidention p.p. vegetation
B x x x x
62C0* Ponto-Sarmatic steppes
A x x x x
6430 Hydrophilous tall-
herb fringe
communities of
plains and of the
montane to
alpine levels
B x x x x
6440 Alluvial meadows of river valleys of the Cnidion dubii
A x x x x
7210* Calcareous fens with Cladium
mariscus and species of the Caricion
davallianae
B x x x x

76
7230 Alkaline fens B x x x
91AA Eastern white oak woods
A x x x x x
91E0* Alluvial forests with Alnus
glutinosa and Fraxinus excelsior
(Alno-Padion,
Alnion incanae,
Salicion albae)
A x x x x x
91F0 Riparian mixed forests of Quercus robur, Ulmus laevis and Ulmus minor, Fraxinus excelsior or Fraxinus angustifolia, along the great rivers (Ulmenion minoris)
A x x x x x x x x x
92A0 Salix alba and Populus alba galleries
A x x x x x x x
92D0 Southern riparian galleries and thickets (Nerio-Tamaricetea and Securinegion tinctoriae)
B x x x x x x x

77
6. Management objectives and monitoring
6.1. Conservation and restoration goals specific for each habitat type
1110 Sandbanks which are slightly covered by sea water all the time
Conservation value: 5 (1-5 scale); small areas in DDBR marine perimeter. Unfortunately, there are not
yearly monitored. The eutrophication phenomenon probably is caused by the strong upwelling current
that contain nutrients favourable for a certain type algae development in conditions of abnormal
temperature at the sea water surface. The phenomenon is taking place in calm sea water periods near
to mouth of Sulina channel. The colour is given by the dominant species (Phyllophora sp. and Cystosteira
sp.) that bloom due to temperature and phosphorus surplus. This surplus is considered a type of
pollution of the Black Sea that produce fish mass mortality. In the last period the algal blooming
diminished as frequency and intensity. In 2003 there were observed only increasing of numerical
abundance of some species. Also the number of the phytoplankton species with massive development
decreased from 106 species in 1991-2000, to 64 species 2001-2003. If we compare these data (64
species) with the year 1960 (38 species registered) the number of phytoplankton species is still high.
Tabel 16. Conservation and restoration goals for habitat 1110
Issue to solve Required measure Actions to apply Goals and objectives
Eutrophication Decrease of using
chemical
substances in
agriculture
Promoting ecological
agriculture among local
communities
Prohibit in any circumstances
the use of fertilizers and
insecticides by showing the
negative effects (e.g. fish
mortality, touristic activity
regress)
Projection of scenarios are
relevant by matching with the
predicted results; Absence of
the phenomenon in the
expected period.
The aquatic plant species
frequency and abundance was
constant in the last 5 years
1130 Estuaries
Conservation value: 3 (1-5 scale); the overall modification of hydro-graphic functioning is the most
threatening pressure for this type of habitat.
Tabel 17. Conservation and restoration goals for habitat 1130
Issue to solve Required measure Actions to apply Goals and objectives
Habitat loss Habitat
protection
Reduce the silting up process by
creating new discharge water
ways for spring period deepen
the present ones
The reduction of silting up
process by maintaining the
habitat area and species
78
1140 Mudflats and sand flats not covered by seawater at low tide
Conservation value: 2 (1-5 scale); this type of habitat is important for aquatic birds species from the
feeding point of view. There is no presence of vascular plants; the dominant species are yellow-brown
algae (diatoms) and blue-green algae. The changes of water level and the silting up process are the main
threats for this habitat.
Tabel 18. Conservation and restoration goals for habitat 1140
Issue to solve Required measure Actions to apply Goals and objectives
Dispersed habitation Finding new areas
for habitat
development or
create green
corridors
Map all the artificial areas that
can sustain or re-connect the
habitat patches and apply the
rehabilitation works
New areas or good state of
1140 habitat
Silting up Maintain the
habitats by
reducing the
sedimentation
process
Control the silting up process by
de-clogging work at the mouths
of the discharging channels.
Indicator species that show
stability of the habitat
The spawning grounds for
some fish species are still
active
1150* Coastal lagoons
Conservation value: 4 (1-5 scale); Because of the impact produced by hydro-technical works, the
characteristic lagoon conditions are modified (salinity, transparency and sedimentation). The salinity
(“demarcation line” between fresh and salt water) can fluctuate daily due to wind conditions, which is
similar to lagoon tide. The changing conditions between brackish to fresh and back again shift
distribution of the species. Modification of hydro-graphic functioning enhanced the silting up process, also the
temperature correlated with low water level and phosphorus create conditions for eutrophication.
Tabel 19. Conservation and restoration goals for habitat 1150*
Issue to solve Required measure Actions to apply Goals and objectives
Eutrophication Reduce the
frequency of
eutrophication
phenomenon
Hydro-technical works at the
mouths of the channels that
discharge fresh water in the
lagoon.
Frequency and intensity of the
phenomenon is significantly
reduced.
The aquatic plant species
frequency and abundance was
constant in the last 5 years
Prohibit chemical
substances use in
agriculture and
Promoting ecological
agriculture among local
Projection of scenarios are
relevant by matching with the

79
develop scenarios
by predicting
negative and
positive impacts
communities
Prohibit in any circumstances
the use of fertilizers and
insecticides by showing the
negative effects (e.g. fish
mortality, touristic activity
regress)
predicted positive results;
Absence of the phenomenon
in the expected period.
Habitat /species loss Maintain the
habitat integrity
Monitor the species frequency
and abundance and identify the
vulnerable ones
Control the silting up process by
de-clogging work
Data which confirm the
species composition stability
and distribution
1160 Large shallow inlets and bays
Conservation value: 4 (1-5 scale); this habitat is very abundant in species. Due to habitat position in
Danube Delta (at the mouths of the Danube) the alluvial sedimentation is the main process.
Tabel 20. Conservation and restoration goals for habitat 1160
Issue to solve Required measure Actions to apply Goals and objectives
Silting up Maintain the
habitats by
reducing the
sedimentation
process
Control the silting up process by
de-clogging work at the mouths
of the discharging channels.
Indicator species that show
stability of the habitat
The spawning grounds for
some fish species are still
active
1210 Annual vegetation of drift lines
Conservation value: 4 (1-5 scale); this type of habitat is continue diminished by the erosion of sea waves. In the last decades, on the sea side area it was observed an intensified erosion process, enhanced also by the sand deficit. The intensity of the erosion process was analyzed at the interface sea-land area during the measurements made in 1980 – 2003 period. In DDBR sea side area it was determined the most aggressive regression/erosion of the littoral, 4-7 m/year in aprox. 10 - 15 km (Sud Sulina - north Sf. Gheorghe, Insula Sahalin, Zaton, north Portita - lighthouse Portita, north Grindul Chituc); Antagonism
arising from introduction of species, antagonism with domestic animals and tourism impacts are the anthropogenic threats for this type of habitat.
Tabel 21. Conservation and restoration goals for habitat 1210
Issue to solve Required measure Actions to apply Goals and objectives
Erosion Reduce the Build up in the sea at several
km. staphilopods (concrete)
New monitoring data show
habitat some stability in

80
erosion process barriers.
Develop a monitoring plan of
the habitat surfaces for the next
5 years
vegetation structure and
surface
Habitat /species loss Habitat protection Identify new areas were the
erosion process is reduced or
inexistent in order to
shift/transfer the vulnerable
species by re-planting
Monitor the new areas for the
next 5 years
Prohibit animal grazing and
tourism development near or in
the areas that include this
vulnerable habitat
Species establishment in the
new areas
In 5 years the monitoring plan
shows that species
composition and structure in
the habitats is maintained
after grazing and tourism
activity exclusion
Antagonism arising
from introduction of
species,
Control or
eradicate the
anthropogenic
species
Enlist the anthropogenic plant
species that interact with key
species and elaborate
control/eradication measures
for each
Anthropogenic plant species
number and abundance are
reduced
1310 Salicornia and other annuals colonizing mud and sand
Conservation value: 4 (1-5 scale); in some areas, this habitat type is frequently flooded in spring, and in
relation to this phenomena the pristine conditions are changed. Certainly, salinity is changed and in this
way can appear the facultative resistant plant species. Usually this habitat, ecologically and spatially it
develops close to 1410 habitat. Ground water level plays an important role in its distribution. The 1310
habitat is present in small patches (1 to 5 ha) along with 1410 and 1530* in Letea area and in compact
large surfaces in Grindul Lupilor. The main species Salicornia europaea and Suaeda maritima tend to
disappear under the pressure of changing substrate moisture and salt content concentration. Antagonism
with domestic animals is one of the main anthropogenic threats for the habitat.
Tabel 22. Conservation and restoration goals for habitat 1310
Issue to solve Required measure Actions to apply Goals and objectives
Habitat /species loss Maintain the
habitat areas by
exclusion of all
anthropogenic
Find new areas for grazing in
order to reduce the access or
crossing these habitats.
Monitor the isolation of the
Species composition and
surfaces limits of the habitat
are preserved
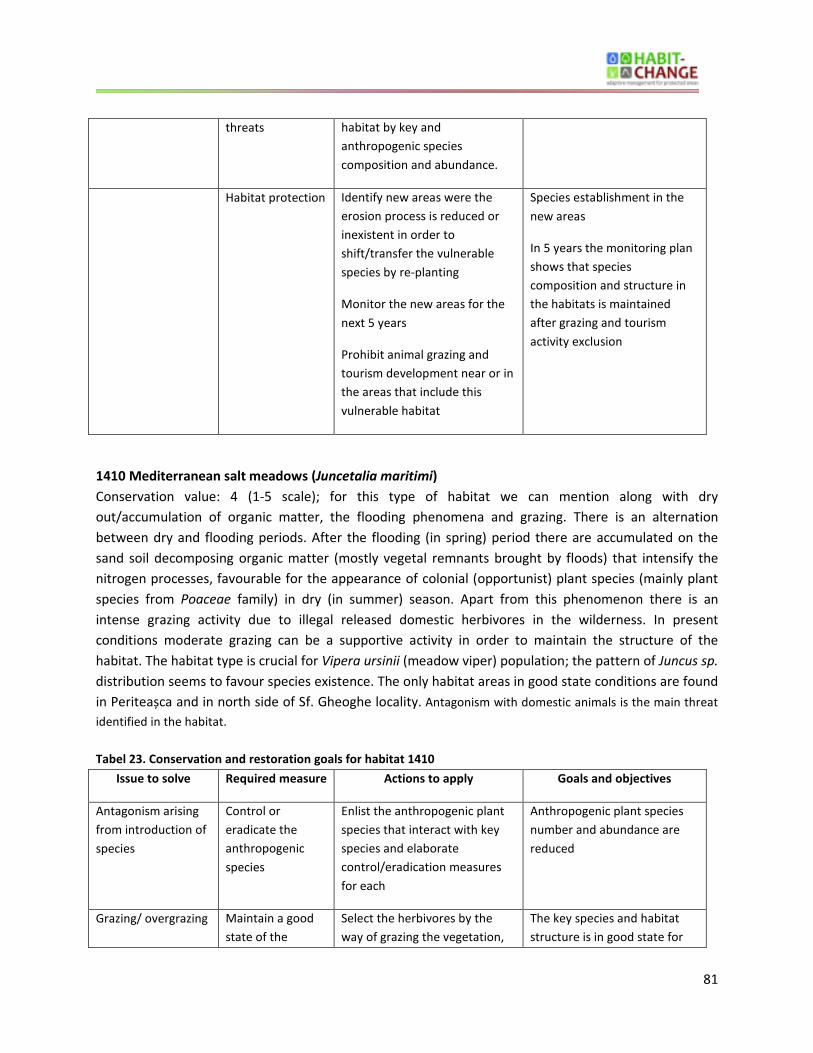
81
threats habitat by key and
anthropogenic species
composition and abundance.
Habitat protection Identify new areas were the
erosion process is reduced or
inexistent in order to
shift/transfer the vulnerable
species by re-planting
Monitor the new areas for the
next 5 years
Prohibit animal grazing and
tourism development near or in
the areas that include this
vulnerable habitat
Species establishment in the
new areas
In 5 years the monitoring plan
shows that species
composition and structure in
the habitats is maintained
after grazing and tourism
activity exclusion
1410 Mediterranean salt meadows (Juncetalia maritimi)
Conservation value: 4 (1-5 scale); for this type of habitat we can mention along with dry
out/accumulation of organic matter, the flooding phenomena and grazing. There is an alternation
between dry and flooding periods. After the flooding (in spring) period there are accumulated on the
sand soil decomposing organic matter (mostly vegetal remnants brought by floods) that intensify the
nitrogen processes, favourable for the appearance of colonial (opportunist) plant species (mainly plant
species from Poaceae family) in dry (in summer) season. Apart from this phenomenon there is an
intense grazing activity due to illegal released domestic herbivores in the wilderness. In present
conditions moderate grazing can be a supportive activity in order to maintain the structure of the
habitat. The habitat type is crucial for Vipera ursinii (meadow viper) population; the pattern of Juncus sp.
distribution seems to favour species existence. The only habitat areas in good state conditions are found
in Periteașca and in north side of Sf. Gheoghe locality. Antagonism with domestic animals is the main threat
identified in the habitat.
Tabel 23. Conservation and restoration goals for habitat 1410
Issue to solve Required measure Actions to apply Goals and objectives
Antagonism arising
from introduction of
species
Control or
eradicate the
anthropogenic
species
Enlist the anthropogenic plant
species that interact with key
species and elaborate
control/eradication measures
for each
Anthropogenic plant species
number and abundance are
reduced
Grazing/ overgrazing Maintain a good
state of the
Select the herbivores by the
way of grazing the vegetation,
The key species and habitat
structure is in good state for

82
habitat by
reducing the
number of
animals
spectrum and area that cover
during one day
Maintain a reduce number of
herbivores in order to keep the
habitat in good state for the
vipers population
viper population.
1530* Pannonic salt steppes and salt marshes
Conservation value: 3 (1-5 scale); Due to its pannonic climate with extreme temperatures and summer
aridity there is salts accumulation in soil favoured by intense dry out of the ground water during the
summer. Also, there is an intense grazing activity due to illegal released domestic herbivores in the
wilderness. Antagonism arising from introduction of species and overgrazing are the main anthropogenic threats.
Tabel 24. Conservation and restoration goals for habitat 1530*
Issue to solve Required measure Actions to apply Goals and objectives
Groundwater level
(decline of)
Maintain the
groundwater
stability
Provide
information for
improvements in
the planning,
policy and
management of
groundwater
resources.
Collect analyze the data as a
baseline for assessment of the
current state,
Anticipate changes and forecast
trends in groundwater state
due to natural processes and
human impacts in time and
space
Flood the neighbourhood areas
in order to recharge aquifer
Prohibit or reduce the grazing
activity in order to reduce the
soil compaction
Soil moisture is stable.
Monitored parameters shown
good state of the habitat
Structure and species
composition of the habitat are
the same during the
monitoring period
Grazing/ overgrazing Maintain a good
state of the
habitat by
reducing the
number of
animals
Select the herbivores by the
way of grazing the vegetation,
spectrum and area that cover
during one day
Maintain a reduce number of
herbivores and rotate the
grazed areas in order to keep
the habitat in a good state.
The monitored data had
shown a good state of the
habitat structure and key
species composition.
Antagonism arising Control or Enlist the anthropogenic plant Anthropogenic plant species
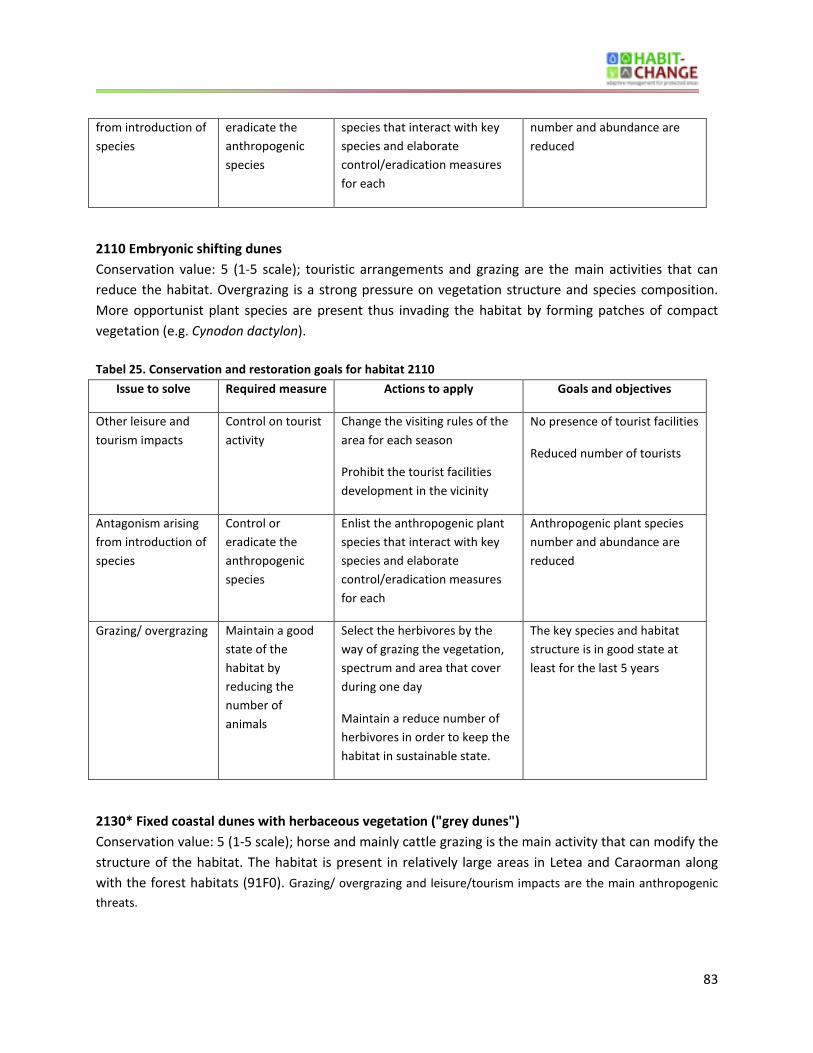
83
from introduction of
species
eradicate the
anthropogenic
species
species that interact with key
species and elaborate
control/eradication measures
for each
number and abundance are
reduced
2110 Embryonic shifting dunes
Conservation value: 5 (1-5 scale); touristic arrangements and grazing are the main activities that can
reduce the habitat. Overgrazing is a strong pressure on vegetation structure and species composition.
More opportunist plant species are present thus invading the habitat by forming patches of compact
vegetation (e.g. Cynodon dactylon).
Tabel 25. Conservation and restoration goals for habitat 2110
Issue to solve Required measure Actions to apply Goals and objectives
Other leisure and
tourism impacts
Control on tourist
activity
Change the visiting rules of the
area for each season
Prohibit the tourist facilities
development in the vicinity
No presence of tourist facilities
Reduced number of tourists
Antagonism arising
from introduction of
species
Control or
eradicate the
anthropogenic
species
Enlist the anthropogenic plant
species that interact with key
species and elaborate
control/eradication measures
for each
Anthropogenic plant species
number and abundance are
reduced
Grazing/ overgrazing Maintain a good
state of the
habitat by
reducing the
number of
animals
Select the herbivores by the
way of grazing the vegetation,
spectrum and area that cover
during one day
Maintain a reduce number of
herbivores in order to keep the
habitat in sustainable state.
The key species and habitat
structure is in good state at
least for the last 5 years
2130* Fixed coastal dunes with herbaceous vegetation ("grey dunes")
Conservation value: 5 (1-5 scale); horse and mainly cattle grazing is the main activity that can modify the
structure of the habitat. The habitat is present in relatively large areas in Letea and Caraorman along
with the forest habitats (91F0). Grazing/ overgrazing and leisure/tourism impacts are the main anthropogenic
threats.

84
Tabel 26. Conservation and restoration goals for habitat 2130*
Issue to solve Required measure Actions to apply Goals and objectives
Habitat /species loss Maintain the
habitat areas by
exclusion of all
anthropogenic
threats
Find new areas for grazing in
order to reduce the access or
crossing these habitats.
Monitor the isolation of the
habitat by key and
anthropogenic species
composition and abundance.
Species composition and
surfaces limits of the habitat
are preserved
Habitat protection Identify new areas were the
erosion process is reduced or
inexistent in order to
shift/transfer the vulnerable
species by re-planting
Monitor the new areas for the
next 5 years
Prohibit animal grazing and
tourism development near or in
the areas that include this
vulnerable habitat
Species establishment in the
new areas
In 5 years the monitoring plan
shows that species
composition and structure in
the habitats is maintained
after grazing and tourism
activity exclusion
Grazing/ overgrazing Maintain a good
state of the
habitat by
reducing the
number of
animals
Select the herbivores by the
way of grazing the vegetation,
spectrum and area that cover
during one day
Maintain a reduce number of
herbivores and rotate the
grazed areas in order to keep
the habitat in a good state.
The monitored data had
shown a good state of the
habitat structure and key
species composition.
2160 Dunes with Hippophaë rhamnoides
Conservation value: 4 (1-5 scale); Emerald habitats well represented in Romania. Grazing/ overgrazing is
the activity that should be kept in control.
Tabel 27. Conservation and restoration goals for habitat 2160
Issue to solve Required measure Actions to apply Goals and objectives
Groundwater level Maintain the
groundwater
Collect analyze the data as a
baseline for assessment of the
Soil moisture is stable.

85
(decline of) stability
Provide
information for
improvements in
the planning,
policy and
management of
groundwater
resources.
current state,
Anticipate changes and forecast
trends in groundwater state
due to natural processes and
human impacts in time and
space
Flood the neighbourhood areas
in order to recharge aquifer
Prohibit or reduce the grazing
activity in order to reduce the
soil compaction
Monitored parameters shown
good state of the habitat
Structure and species
composition of the habitat are
the same during the
monitoring period
Antagonism arising
from introduction of
species
Control or
eradicate the
anthropogenic
species
Enlist the anthropogenic plant
species that interact with key
species and elaborate
control/eradication measures
for each
Anthropogenic plant species
number and abundance are
reduced
Grazing/ overgrazing Maintain a good
state of the
habitat by
reducing the
number of
animals
Select the herbivores by the
way of grazing the vegetation,
spectrum and area that cover
during one day
Maintain a reduce number of
herbivores and rotate the
grazed areas in order to keep
the habitat in a good state.
The monitored data had
shown a good state of the
habitat structure and key
species composition.
2190 Humid dune slacks
Conservation value: 5 (1-5 scale); The habitat is affected mainly by reduction of ground water level and
domestic animals that should be excluded from these vulnerable habitats.
Tabel 28. Conservation and restoration goals for habitat 2190
Issue to solve Required measure Actions to apply Goals and objectives
Groundwater level
(decline of)
Maintain the
groundwater
stability
Provide
information for
improvements in
Collect analyze the data as a
baseline for assessment of the
current state,
Anticipate changes and forecast
trends in groundwater state
due to natural processes and
Soil moisture is stable.
Monitored parameters shown
good state of the habitat
Structure and species
composition of the habitat are
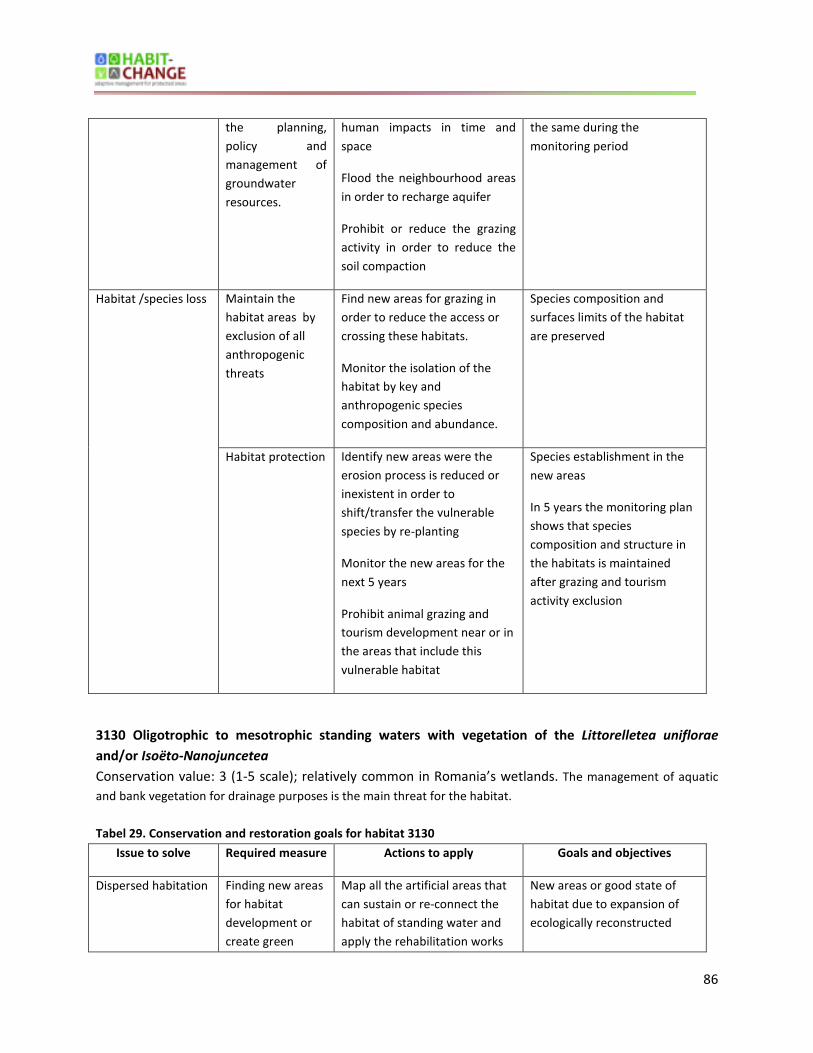
86
the planning,
policy and
management of
groundwater
resources.
human impacts in time and
space
Flood the neighbourhood areas
in order to recharge aquifer
Prohibit or reduce the grazing
activity in order to reduce the
soil compaction
the same during the
monitoring period
Habitat /species loss Maintain the
habitat areas by
exclusion of all
anthropogenic
threats
Find new areas for grazing in
order to reduce the access or
crossing these habitats.
Monitor the isolation of the
habitat by key and
anthropogenic species
composition and abundance.
Species composition and
surfaces limits of the habitat
are preserved
Habitat protection Identify new areas were the
erosion process is reduced or
inexistent in order to
shift/transfer the vulnerable
species by re-planting
Monitor the new areas for the
next 5 years
Prohibit animal grazing and
tourism development near or in
the areas that include this
vulnerable habitat
Species establishment in the
new areas
In 5 years the monitoring plan
shows that species
composition and structure in
the habitats is maintained
after grazing and tourism
activity exclusion
3130 Oligotrophic to mesotrophic standing waters with vegetation of the Littorelletea uniflorae
and/or Isoëto-Nanojuncetea
Conservation value: 3 (1-5 scale); relatively common in Romania’s wetlands. The management of aquatic
and bank vegetation for drainage purposes is the main threat for the habitat.
Tabel 29. Conservation and restoration goals for habitat 3130
Issue to solve Required measure Actions to apply Goals and objectives
Dispersed habitation Finding new areas
for habitat
development or
create green
Map all the artificial areas that
can sustain or re-connect the
habitat of standing water and
apply the rehabilitation works
New areas or good state of
habitat due to expansion of
ecologically reconstructed

87
corridors by flooding new areas
(abandoned agriculture sites)
areas
Habitat /species loss Maintain the
habitat areas by
exclusion of all
anthropogenic
threats
Find new areas for grazing in
order to reduce the access or
crossing these habitats.
Monitor the isolation of the
habitat by key and
anthropogenic species
composition and abundance.
Species composition and
surfaces limits of the habitat
are preserved
Habitat protection Identify new areas were the
erosion process is reduced or
inexistent in order to
shift/transfer the vulnerable
species by re-planting
Monitor the new areas for the
next 5 years
Prohibit animal grazing and
tourism development near or in
the areas that include this
vulnerable habitat
Species establishment in the
new areas
In 5 years the monitoring plan
shows that species
composition and structure in
the habitats is maintained
after grazing and tourism
activity exclusion
Silting up Maintain the
habitats by
reducing the
sedimentation
process
Control the silting up process by
de-clogging work at the mouths
of the discharging channels.
Indicator species that show
stability of the habitat
The spawning grounds for
some fish species are still
active
Water level changes Develop risk
scenarios
Develop tools for
stakeholders for
risk evaluation
Assess a series future water
supply scenarios in order to
develop a water regulation plan
Build up or raise the dykes and
channel de-clogging were the
scenarios shows high risks in
order to provide a better water
connectivity
Initiate a long-term monitoring
and modeling for direct needs
The habitats at risk will no
longer suffer changes in
structure and composition of
species after 5 years
montoring.
Ensuring sufficient and viable
stream flow at high and low
levels.
Develop and Pumping stations are currently By comparing monitored
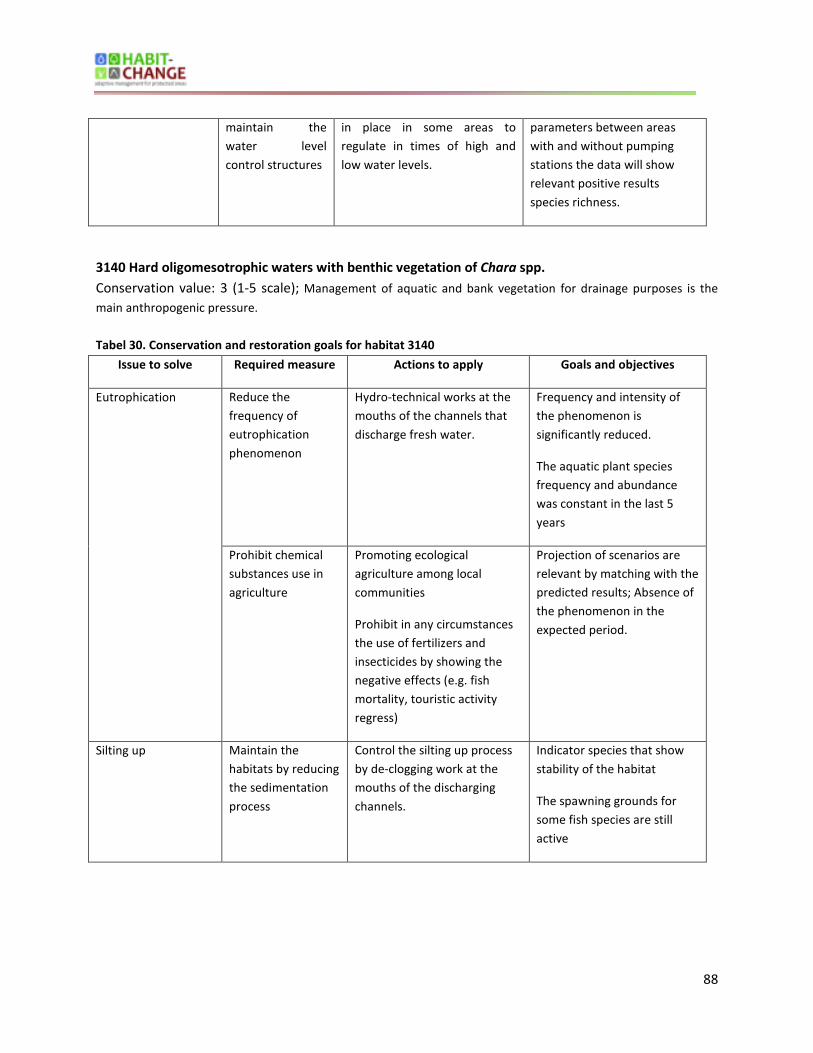
88
maintain the
water level
control structures
in place in some areas to
regulate in times of high and
low water levels.
parameters between areas
with and without pumping
stations the data will show
relevant positive results
species richness.
3140 Hard oligomesotrophic waters with benthic vegetation of Chara spp.
Conservation value: 3 (1-5 scale); Management of aquatic and bank vegetation for drainage purposes is the
main anthropogenic pressure.
Tabel 30. Conservation and restoration goals for habitat 3140
Issue to solve Required measure Actions to apply Goals and objectives
Eutrophication Reduce the
frequency of
eutrophication
phenomenon
Hydro-technical works at the
mouths of the channels that
discharge fresh water.
Frequency and intensity of
the phenomenon is
significantly reduced.
The aquatic plant species
frequency and abundance
was constant in the last 5
years
Prohibit chemical
substances use in
agriculture
Promoting ecological
agriculture among local
communities
Prohibit in any circumstances
the use of fertilizers and
insecticides by showing the
negative effects (e.g. fish
mortality, touristic activity
regress)
Projection of scenarios are
relevant by matching with the
predicted results; Absence of
the phenomenon in the
expected period.
Silting up Maintain the
habitats by reducing
the sedimentation
process
Control the silting up process
by de-clogging work at the
mouths of the discharging
channels.
Indicator species that show
stability of the habitat
The spawning grounds for
some fish species are still
active

89
3150 Natural eutrophic lakes with Magnopotamion or Hydrocharition - type vegetation
Conservation value: 5 (1-5 scale); existence of DH2 plant species. The habitat is the most present in the
large and medium lakes of DDBR. In some of the lakes the silting up process is evident therefore
hydrotechnical works are needed in order to maintain a good status.
Tabel 31. Conservation and restoration goals for habitat 3150
Issue to solve Required measure Actions to apply Goals and objectives
Eutrophication Reduce the
frequency of
eutrophication
phenomenon
Hydro-technical works at the
mouths of the channels that
discharge fresh water.
Frequency and intensity of
the phenomenon is
significantly reduced.
The aquatic plant species
frequency and abundance
was constant in the last 5
years
Prohibit chemical
substances use in
agriculture
Promoting ecological
agriculture among local
communities
Prohibit in any circumstances
the use of fertilizers and
insecticides by showing the
negative effects (e.g. fish
mortality, touristic activity
regress)
Projection of scenarios are
relevant by matching with the
predicted results;
Absence of the phenomenon
in the expected period.
Silting up Maintain the
habitats by reducing
the sedimentation
process
Control the silting up process
by de-clogging work at the
mouths of the discharging
channels.
Indicator species that show
stability of the habitat
The spawning grounds for
some fish species are still
active
Water level changes Develop risk
scenarios
Develop tools for
stakeholders for risk
evaluation
Assess a series future water
supply scenarios in order to
develop a water regulation
plan
Build up or raise the dykes and
channel de-clogging were the
scenarios shows high risks in
order to provide a better
water connectivity
The habitats at risk will no
longer suffer changes in
structure and composition of
species after 5 years
montoring.
Ensuring sufficient and viable
stream flow at high and low
levels.

90
Initiate a long-term
monitoring and modeling for
direct needs
Develop and
maintain the water
level control
structures
Pumping stations are currently
in place in some areas to
regulate in times of high and
low water levels.
By comparing monitored
parameters between areas
with and without pumping
stations the data will show
relevant positive results
species richness.
3160 Natural dystrophic lakes and ponds
Conservation value: 4 (1-5 scale); this type of habitat was diminished by the desiccation activities.
Tabel 32. Conservation and restoration goals for habitat 3160
Issue to solve Required measure Actions to apply Goals and objectives
Eutrophication Reduce the
frequency of
eutrophication
phenomenon
Hydro-technical works at the
mouths of the channels that
discharge fresh water.
Frequency and intensity of
the phenomenon is
significantly reduced.
The aquatic plant species
frequency and abundance
was constant in the last 5
years
Decrease of using
chemical substances
in agriculture
Promoting ecological
agriculture among local
communities
Prohibit in any circumstances
the use of fertilizers and
insecticides by showing the
negative effects (e.g. fish
mortality, touristic activity
regress)
Projection of scenarios are
relevant by matching with the
predicted results; Absence of
the phenomenon in the
expected period.
Water level changes Develop risk
scenarios
Develop tools for
stakeholders for risk
evaluation
Assess a series future water
supply scenarios in order to
develop a water regulation
plan
Build up or raise the dykes and
channel de-clogging were the
scenarios shows high risks in
The habitats at risk will no
longer suffer changes in
structure and composition of
species after 5 years
montoring.
Ensuring sufficient and viable
stream flow at high and low
91
order to provide a better
water connectivity
Initiate a long-term
monitoring and modeling for
direct needs
levels.
Develop and
maintain the water
level control
structures
Pumping stations are currently
in place in some areas to
regulate in times of high and
low water levels.
By comparing monitored
parameters between areas
with and without pumping
stations the data will show
relevant positive results
species richness.
3260 Water courses of plain to mountain levels with the Ranunculion fluitantis and Callitricho-
Batrachion vegetation
Conservation value: 4 (1-5 scale);
Tabel 33. Conservation and restoration goals for habitat 3260
Issue to solve Required measure Actions to apply Goals and objectives
Antagonism arising
from introduction of
species
Control or
eradicate the
anthropogenic
species
Enlist the anthropogenic plant
species that interact with key
species and elaborate
control/eradication measures
for each
Anthropogenic plant species
number and abundance are
reduced
Habitat /species loss Maintain the
habitat areas by
exclusion of all
anthropogenic
threats
Find new areas for grazing in
order to reduce the access or
crossing these habitats.
Monitor the isolation of the
habitat by key and
anthropogenic species
composition and abundance.
Species composition and
surfaces limits of the habitat
are preserved
Habitat protection Identify new areas were the
erosion process is reduced or
inexistent in order to
shift/transfer the vulnerable
species by re-planting
Monitor the new areas for the
next 5 years
Species establishment in the
new areas
In 5 years the monitoring plan
shows that species
composition and structure in
the habitats is maintained
after grazing and tourism

92
Prohibit animal grazing and
tourism development near or in
the areas that include this
vulnerable habitat
activity exclusion
3270 Rivers with muddy banks with Chenopodion rubri p.p. and Bidention p.p. vegetation
Conservation value: 2 (1-5 scale); pioneer vegetation with alien species Antagonism with domestic animals,
canalisation and grazing/ overgrazing are the main threats.
Tabel 34. Conservation and restoration goals for habitat 3270
Issue to solve Required measure Actions to apply Goals and objectives
Water level changes Develop risk
scenarios
Develop tools for
stakeholders for
risk evaluation
Assess a series future water
supply scenarios in order to
develop a water regulation plan
Build up or raise the dykes and
channel de-clogging were the
scenarios shows high risks in
order to provide a better water
connectivity
Initiate a long-term monitoring
and modeling for direct needs
The habitats at risk will no
longer suffer changes in
structure and composition of
species after 5 years
montoring.
Ensuring sufficient and viable
stream flow at high and low
levels.
Develop and
maintain the
water level
control structures
Pumping stations are currently
in place in some areas to
regulate in times of high and
low water levels.
By comparing monitored
parameters between areas
with and without pumping
stations the data will show
relevant positive results
species richness.
62C0* Ponto-Sarmatic steppes
Conservation value: 5 (1-5 scale); small areas in DDBR on Popina Island. Antagonism arising from
introduction of species and antagonism with domestic animals are pressures for the habitat on the island.
Tabel 35. Conservation and restoration goals for habitat 62C0*
Issue to solve Required measure Actions to apply Goals and objectives
Habitat /species loss Maintain the
habitat areas by
exclusion of all
anthropogenic
Find new areas for grazing in
order to reduce the access or
crossing these habitats.
Species composition and
surfaces limits of the habitat
are preserved
93
threats Monitor the isolation of the
habitat by key and
anthropogenic species
composition and abundance.
Habitat protection Identify new areas were the
erosion process is reduced or
inexistent in order to
shift/transfer the vulnerable
species by re-planting
Monitor the new areas for the
next 5 years
Prohibit animal grazing and
tourism development near or in
the areas that include this
vulnerable habitat
Species establishment in the
new areas
In 5 years the monitoring plan
shows that species
composition and structure in
the habitats is maintained
after grazing and tourism
activity exclusion
Other leisure and
tourism impacts
Control on tourist
activity
Change the visiting rules of the
area for each season
Prohibit the tourist facilities
development in the vicinity
No presence of tourist facilities
Reduced number of tourists
Antagonism with
domestic animals
Maintain a good
state of the
habitat by
prohibiting the
animals on the
grassland
Provide some alternatives (new
grazing areas, pastures) for the
animal breeders
Keep in control the strictly
protected area for several years
The key species and habitat
structure is in good state at
least for the last 5 years
6430 Hydrophilous tall-herb fringe communities of plains and of the montane to alpine levels
Conservation value: 3 (1-5 scale); Canalisation and management of water levels are the threats for the habitat.
Tabel 36. Conservation and restoration goals for habitat 6430
Issue to solve Required measure Actions to apply Goals and objectives
Habitat /species loss Maintain the
habitat areas by
exclusion of all
anthropogenic
threats
Find new areas for grazing in
order to reduce the access or
crossing these habitats.
Monitor the isolation of the
habitat by key and
anthropogenic species
Species composition and
surfaces limits of the habitat
are preserved

94
composition and abundance.
Habitat protection Identify new areas were the
erosion process is reduced or
inexistent in order to
shift/transfer the vulnerable
species by re-planting
Monitor the new areas for the
next 5 years
Prohibit animal grazing and
tourism development near or in
the areas that include this
vulnerable habitat
Species establishment in the
new areas
In 5 years the monitoring plan
shows that species
composition and structure in
the habitats is maintained
after grazing and tourism
activity exclusion
Water level changes Develop risk
scenarios
Develop tools for
stakeholders for
risk evaluation
Assess a series future water
supply scenarios in order to
develop a water regulation plan
Build up or raise the dykes and
channel de-clogging were the
scenarios shows high risks in
order to provide a better water
connectivity
Initiate a long-term monitoring
and modeling for direct needs
The habitats at risk will no
longer suffer changes in
structure and composition of
species after 5 years
montoring.
Ensuring sufficient and viable
stream flow at high and low
levels.
Develop and
maintain the
water level
control structures
Pumping stations are currently
in place in some areas to
regulate in times of high and
low water levels.
By comparing monitored
parameters between areas
with and without pumping
stations the data will show
relevant positive results
species richness.
6440 Alluvial meadows of river valleys of the Cnidion dubii
Conservation value: 3 (1-5 scale);
Tabel 37. Conservation and restoration goals for habitat 6440
Issue to solve Required measure Actions to apply Goals and objectives
Antagonism arising
from introduction of
species
Control or
eradicate the
anthropogenic
Enlist the anthropogenic plant
species that interact with key
species and elaborate
Anthropogenic plant species
number and abundance are
reduced
95
species control/eradication measures
for each
7210* Calcareous fens with Cladium mariscus and species of the Caricion davallianae
Conservation value: 4 (1-5 scale);
Tabel 38. Conservation and restoration goals for habitat 7210
Issue to solve Required measure Actions to apply Goals and objectives
Other leisure and
tourism impacts
Control on tourist
activity
Change the visiting rules of the
area for each season
Prohibit the tourist facilities
development in the vicinity
No presence of tourist facilities
Reduced number of tourists
Groundwater level
(decline of)
Maintain the
groundwater
stability
Provide
information for
improvements in
the planning,
policy and
management of
groundwater
resources.
Collect analyze the data as a
baseline for assessment of the
current state,
Anticipate changes and forecast
trends in groundwater state
due to natural processes and
human impacts in time and
space
Flood the neighbourhood areas
in order to recharge aquifer
Prohibit or reduce the grazing
activity in order to reduce the
soil compaction
Soil moisture is stable.
Monitored parameters shown
good state of the habitat
Structure and species
composition of the habitat are
the same during the
monitoring period
7230 Alkaline fens
Conservation value: 4 (1-5 scale); In some areas the habitat is strongly affected by groundwater level
decline. In these new conditions the key species tend to disappear.
Tabel 39. Conservation and restoration goals for habitat 7230
Issue to solve Required measure Actions to apply Goals and objectives
Groundwater level
(decline of)
Maintain the
groundwater
stability
Collect analyze the data as a
baseline for assessment of the
current state,
Soil moisture is stable.
Monitored parameters shown

96
Provide
information for
improvements in
the planning,
policy and
management of
groundwater
resources.
Anticipate changes and forecast
trends in groundwater state
due to natural processes and
human impacts in time and
space
Flood the neighbourhood areas
in order to recharge aquifer
Prohibit or reduce the grazing
activity in order to reduce the
soil compaction
good state of the habitat
Structure and species
composition of the habitat are
the same during the
monitoring period
Habitat /species loss Maintain the
habitat areas by
exclusion of all
anthropogenic
threats
Find new areas for grazing in
order to reduce the access or
crossing these habitats.
Monitor the isolation of the
habitat by key and
anthropogenic species
composition and abundance.
Species composition and
surfaces limits of the habitat
are preserved
Habitat protection Identify new areas were the
erosion process is reduced or
inexistent in order to
shift/transfer the vulnerable
species by re-planting
Monitor the new areas for the
next 5 years
Prohibit animal grazing and
tourism development near or in
the areas that include this
vulnerable habitat
Species establishment in the
new areas
In 5 years the monitoring plan
shows that species
composition and structure in
the habitats is maintained
after grazing and tourism
activity exclusion
Water level changes Develop risk
scenarios
Develop tools for
stakeholders for
risk evaluation
Assess a series future water
supply scenarios in order to
develop a water regulation plan
Build up or raise the dykes and
channel de-clogging were the
scenarios shows high risks in
order to provide a better water
connectivity
Initiate a long-term monitoring
The habitats at risk will no
longer suffer changes in
structure and composition of
species after 5 years
montoring.
Ensuring sufficient and viable
stream flow at high and low
levels.

97
and modeling for direct needs
Develop and
maintain the
water level
control structures
Pumping stations are currently
in place in some areas to
regulate in times of high and
low water levels.
By comparing monitored
parameters between areas
with and without pumping
stations the data will show
relevant positive results
species richness.
91AA Eastern white oak woods
Conservation value: 5 (1-5 scale); Tabel 40. Conservation and restoration goals for habitat 91AA
Issue to solve Required measure Actions to apply Goals and objectives
Other leisure and
tourism impacts
Control on tourist
activity
Change the visiting rules of the
area for each season
Prohibit the tourist facilities
development in the vicinity
No presence of tourist facilities
Reduced number of tourists
Groundwater level
(decline of)
Maintain the
groundwater
stability
Provide
information for
improvements in
the planning,
policy and
management of
groundwater
resources.
Control of the
shallow ground-
water level
Collect analyze the data as a
baseline for assessment of the
current state,
Anticipate changes and forecast
trends in groundwater state
due to natural processes and
human impacts in time and
space
Flood the neighbourhood areas
in order to recharge aquifer
Prohibit or reduce the grazing
activity in order to reduce the
soil compaction
Soil moisture is stable.
Monitored parameters shown
good state of the habitat
Structure and species
composition of the habitat are
the same during the
monitoring period
Antagonism with
domestic animals
Maintain a good
state of the
habitat by
prohibiting the
animals in the
forest
Provide some alternatives (new
grazing areas, pastures) for the
animal breeders
Keep in control the forest area
for several years
The key species and habitat
structure is in good state at
least for the last 5 years

98
91E0* Alluvial forests with Alnus glutinosa and Fraxinus excelsior (Alno-Padion, Alnion incanae,
Salicion albae)
Conservation value: 5 (1-5 scale); Modification of hydrographic functioning influence negatively the habitat
evolution. Alnus glutinosa species tend to disappear by drying out because of the groundwater decline.
Tabel 41. Conservation and restoration goals for habitat 91E0*
Issue to solve Required measure Actions to apply Goals and objectives
Antagonism arising
from introduction of
species
Control or
eradicate the
anthropogenic
species
Enlist the anthropogenic plant
species that interact with key
species and elaborate
control/eradication measures
for each
Anthropogenic plant species
number and abundance are
reduced
Antagonism with
domestic animals
Maintain a good
state of the
habitat by
prohibiting the
animals in the
forest
Provide some alternatives (new
grazing areas, pastures) for the
animal breeders
Keep in control the forest area
for several years
The key species and habitat
structure is in good state at
least for the last 5 years
Habitat /species loss Maintain the
habitat areas by
exclusion of all
anthropogenic
threats
Find new areas for grazing in
order to reduce the access or
crossing these habitats.
Monitor the isolation of the
habitat by key and
anthropogenic species
composition and abundance.
Species composition and
surfaces limits of the habitat
are preserved
Habitat protection Identify new areas were the
erosion process is reduced or
inexistent in order to
shift/transfer the vulnerable
species by re-planting
Monitor the new areas for the
next 5 years
Prohibit animal grazing and
tourism development near or in
the areas that include this
vulnerable habitat
Species establishment in the
new areas
In 5 years the monitoring plan
shows that species
composition and structure in
the habitats is maintained
after grazing and tourism
activity exclusion
Groundwater level Maintain the
groundwater
Collect analyze the data as a
baseline for assessment of the
Soil moisture is stable.
99
(decline of) stability
Provide
information for
improvements in
the planning,
policy and
management of
groundwater
resources.
current state,
Anticipate changes and forecast
trends in groundwater state
due to natural processes and
human impacts in time and
space
Flood the neighbourhood areas
in order to recharge aquifer
Prohibit or reduce the grazing
activity in order to reduce the
soil compaction
Monitored parameters shown
good state of the habitat
Structure and species
composition of the habitat are
the same during the
monitoring period
91F0 Riparian mixed forests of Quercus robur, Ulmus laevis and Ulmus minor, Fraxinus excelsior or
Fraxinus angustifolia, along the great rivers (Ulmenion minoris)
Conservation value: 5 (1-5 scale); drying out because of low level of ground water, presence of alien
ligneous species and horse grazing.
Tabel 42. Conservation and restoration goals for habitat 91F0
Issue to solve Required measure Actions to apply Goals and objectives
Groundwater level
(decline of)
Maintain the
groundwater
stability
Provide information
for improvements in
the planning, policy
and management of
groundwater
resources.
Control of the
shallow ground-
water level
Collect analyze the data as a
baseline for assessment of the
current state,
Anticipate changes and
forecast trends in
groundwater state due to
natural processes and human
impacts in time and space
Flood the neighbourhood
areas in order to recharge
aquifer
Prohibit or reduce the grazing
activity in order to reduce the
soil compaction
Soil moisture is stable.
Monitored parameters shown
good state of the habitat
Structure and species
composition of the habitat
are the same during the
monitoring period
Habitat /species loss Maintain the
habitat areas by
exclusion of all
anthropogenic
Find new areas for grazing in
order to reduce the access or
crossing these habitats.
Monitor the isolation of the
Species composition and
surfaces limits of the habitat
are preserved

100
threats habitat by key and
anthropogenic species
composition and abundance.
Habitat protection Identify new areas were the
erosion process is reduced or
inexistent in order to
shift/transfer the vulnerable
species by re-planting
Monitor the new areas for the
next 5 years
Prohibit animal grazing and
tourism development near or
in the areas that include this
vulnerable habitat
Species establishment in the
new areas
In 5 years the monitoring plan
shows that species
composition and structure in
the habitats is maintained
after grazing and tourism
activity exclusion
Water level changes Develop risk
scenarios
Develop tools for
stakeholders for risk
evaluation
Assess a series future water
supply scenarios in order to
develop a water regulation
plan
Build up or raise the dykes and
channel de-clogging were the
scenarios shows high risks in
order to provide a better
water connectivity
Initiate a long-term
monitoring and modeling for
direct needs
The habitats at risk will no
longer suffer changes in
structure and composition of
species after 5 years
montoring.
Ensuring sufficient and viable
stream flow at high and low
levels.
Develop and
maintain the water
level control
structures
Pumping stations are currently
in place in some areas to
regulate in times of high and
low water levels.
By comparing monitored
parameters between areas
with and without pumping
stations the data will show
relevant positive results
species richness.
Antagonism arising
from introduction of
species
Control or eradicate
the anthropogenic
species
Enlist the anthropogenic plant
species that interact with key
species and elaborate
control/eradication measures
for each
Anthropogenic plant species
number and abundance are
reduced
Antagonism with Maintain a good Provide some alternatives The key species and habitat

101
domestic animals state of the habitat
by prohibiting the
animals in the forest
(new grazing areas, pastures)
for the animal breeders
Keep in control the forest area
for several years
structure is in good state at
least for the last 5 years
Other leisure and
tourism impacts
Control on tourist
activity
Change the visiting rules of the
area for each season
Prohibit the tourist facilities
development in the vicinity
92A0 Salix alba and Populus alba galleries
Conservation value: 5 (1-5 scale); presence of alien species and illegal wood cutting activities. To estimate future water levels, we need to describe how water enters and leaves the interconnected set of lakes and channels. Water level projections are calculated using three key factors based on water inputs and outputs: evaporation off the lakes and evapo-transpiration from the land; precipitation onto the land and lakes and runoff from the land and channels into the lakes. Tabel 43. Conservation and restoration goals for habitat 92A0
Issue to solve Required measure Actions to apply Goals and objectives
Groundwater level
(decline of)
Maintain the
groundwater
stability
Provide information
for improvements in
the planning, policy
and management of
groundwater
resources.
Collect analyze the data as a
baseline for assessment of the
current state,
Anticipate changes and forecast
trends in groundwater state
due to natural processes and
human impacts in time and
space
Flood the neighbourhood areas
in order to recharge aquifer
Prohibit or reduce the grazing
activity in order to reduce the
soil compaction
Soil moisture is stable.
Monitored parameters shown
good state of the habitat
Structure and species
composition of the habitat are
the same during the
monitoring period
Habitat /species
loss
Maintain the habitat
areas by exclusion
of all anthropogenic
threats
Find new areas for grazing in
order to reduce the access or
crossing these habitats.
Monitor the isolation of the
habitat by key and
anthropogenic species
Species composition and
surfaces limits of the habitat
are preserved

102
composition and abundance.
Habitat protection Identify new areas were the
erosion process is reduced or
inexistent in order to
shift/transfer the vulnerable
species by re-planting
Monitor the new areas for the
next 5 years
Prohibit animal grazing and
tourism development near or in
the areas that include this
vulnerable habitat
Species establishment in the
new areas
In 5 years the monitoring plan
shows that species
composition and structure in
the habitats is maintained
after grazing and tourism
activity exclusion
Maintenance or
promotion of old
trees
Maintenance or
promotion of rare
tree and shrub
species
Map all the important species
and monitor the evolution
Water level
changes
Develop risk
scenarios
Develop tools for
stakeholders for risk
evaluation
Assess a series future water
supply scenarios in order to
develop a water regulation plan
Build up or raise the dykes and
channel de-clogging were the
scenarios shows high risks in
order to provide a better water
connectivity
Initiate a long-term monitoring
and modeling for direct needs
The habitats at risk will no
longer suffer changes in
structure and composition of
species after 5 years
montoring.
Ensuring sufficient and viable
stream flow at high and low
levels.
Develop and
maintain the water
level control
structures
Pumping stations are currently
in place in some areas to
regulate in times of high and
low water levels.
By comparing monitored
parameters between areas
with and without pumping
stations the data will show
relevant positive results
species richness.
Antagonism
arising from
Control or eradicate
the anthropogenic
Enlist the anthropogenic plant
species that interact with key
Anthropogenic plant species
number and abundance are

103
introduction of
species
species species and elaborate
control/eradication measures
for each
reduced
Antagonism with
domestic animals
Maintain a good
state of the habitat
by prohibiting the
animals in the forest
Provide some alternatives (new
grazing areas, pastures) for the
animal breeders
Keep in control the forest area
for several years
The key species and habitat
structure is in good state at
least for the last 5 years
92D0 Southern riparian galleries and thickets (Nerio-Tamaricetea and Securinegion tinctoriae)
Conservation value: 4 (1-5 scale); Emerald habitats relatively common in Romania’s wetlands. The
specific habitats are formed by pioneer, cosmopolite and some alien ligneous species. It is noticed that
wood exploited habitats are sparsely distributed and rich in alien plant species. Antagonism with domestic
animals and groundwater level decline are the main threats for the habitat.
Tabel 44. Conservation and restoration goals for habitat 92D0
Issue to solve Required measure Actions to apply Goals and objectives
Groundwater level
(decline of)
Maintain the
groundwater
stability
Provide information
for improvements in
the planning, policy
and management of
groundwater
resources.
Collect analyze the data as a
baseline for assessment of the
current state,
Anticipate changes and forecast
trends in groundwater state
due to natural processes and
human impacts in time and
space
Flood the neighbourhood areas
in order to recharge aquifer
Prohibit or reduce the grazing
activity in order to reduce the
soil compaction
Soil moisture is stable.
Monitored parameters shown
good state of the habitat
Structure and species
composition of the habitat are
the same during the
monitoring period
Antagonism
arising from
introduction of
species
Control or eradicate
the anthropogenic
species
Enlist the anthropogenic plant
species that interact with key
species and elaborate
control/eradication measures
for each
Anthropogenic plant species
number and abundance are
reduced
Repression of alien
species for the
Eradicate or isolate the
identified alien species

104
benefit of site or
natural landscape
native tree and
shrub species
through extracting
or early
underplanting (semi)
shady tree species to
darken the site
Antagonism with
domestic animals
Maintain a good
state of the habitat
by prohibiting the
animals in the forest
Provide some alternatives (new
grazing areas, pastures) for the
animal breeders
Keep in control the forest area
for several years
The key species and habitat
structure is in good state at
least for the last 5 years
6.2. Monitoring of progress in obtaining objectives indicators for development of conservation
Monitoring is the routine tracking of program progress using data that are collected on a regular basis to
show that activities are taking place as planned. Monitoring is the tracking system that program
managers use to understand how well programs are running on a daily, weekly, monthly or quarterly
basis, and where any bottlenecks may exist in overall implementation. Monitoring shows that the
program inputs are being used effectively and whether they are leading to expected program outputs.
For example, a program designed to raise awareness and reduce climate change effects in a certain area
will want to keep track of (or monitor) the level of inputs such as funding, staff time, and material
development as well as outputs such as how many times workers went out to speak at community
meetings. Changes detected in the expected performance levels in these inputs and outputs will alert
program managers to possible problems (USAID, 1996).
Tabel 45. Objectives indicators for development of conservation
Objectives and goals Indicators (habitat code)
Antagonism with domestic animals
The key species and habitat
structure is in good state at least for
the last 5 years
Species diversity: Festuca valesiaca, Chrysopogon gryllus, Alyssum
saxatile, Agropyron pectiniforme, Koeleria macrantha, Dichanthium
ischaemum, Stipa capillata, S. ucrainica, Elymus hispidus (62C0*);
Quercus pubescens, Carpinus orientalis, C. betulus, Fraxinus ornus,
Galium dasypodum, Acer campestre, Tilia tomentosa (91AA); Fraxinus
excelsior, Alnus glutinosa, Salix alba, S. fragilis, Populus nigra, Ulmus
minor, Equisetum telmateia (91E0*); Quercus robur, Ulmus laevis,
Ulmus minor, Fraxinus excelsior, Fraxinus angustifolia, Populus nigra, P.

105
canescens, Alnus glutinosa, Humulus lupulus, Vitis vinifera subsp.
sylvestris, Hedera helix (91F0); Salix alba, Populus alba, Alnus spp., Acer
spp., Tamarix spp. (92A0); Tamarix ramosissima, Calamagrostis
epigejos (92D0); Habitat fragmentation/patchiness; Total core area
(core area analysis)
Antagonism arising from introduction of species
Anthropogenic plant species number
and abundance are reduced
Species diversity: key species - Cakile maritima, Salsola kali, Atriplex
spp., Polygonum spp., Euphorbia peplis, Elymus repens, Glaucium
flavum, Euphorbia paralias, Eryngium maritimum. Argusia sibirica.
anthropogenic species – Cynodon dactylon, Amorpha fruticosa, Conyza
canadensis, Cuscuta campestris, Datura stramonium, Eclipta prostrata,
Elaeagnus angustifolia, Xanthium orientale, Xanthium spinosum (1210);
key species - Juncus maritimus, J. acutus, Carex extensa, Aster
tripolium, Plantago cornuti, Scorzonera parviflora, Taraxacum
bessarabicum, Samolus valerandi H. maritimum, Orchis coriophora
subsp. Fragrans anthropogenic species - Xanthium orientale, Xanthium
spinosum (1410); key species - Artemisia santonicum, Aster tripolium,
Salicornia prostrata, Juncus gerardii, Plantago maritima, Cyperus
pannonicus, Achillea collina, Artemisia pontica, Puccinellia limosa,
Scorzonera cana, Halocnemum strobilaceum, Frankenia hirsuta,
Aeluropus littoralis, Limonium meyeri, L. gmelini, Carex distans, C.
divisa, Taraxacum bessarabicum, Halimione verrucifera, Hordeum
hystrix; anthropogenic species - Chenopodium ambrosioides, Cynodon
dactylon, Amorpha fruticosa, Conyza canadensis (1530*); key species -
Elymus farctus, Leymus sabulosus, Euphorbia peplis, Medicago marina,
Eryngium maritimum; anthropogenic species - Cynodon dactylon,
Amorpha fruticosa, Conyza Canadensis, Iva xanthifolia, (2110); key
species - Hippophaë rhamnoides; anthropogenic species - Fraxinus
pennsylvanica, Lycium barbarum, Amorpha fruticosa (2160); key
species - Ranunculus aquatilis, Myriophyllum spp., Callitriche spp.,
Berula erecta, Zannichellia palustris, Potamogeton spp.; anthropogenic
species - Lemna minuta, Paspalum paspalodes, Elodea nuttallii (3260);
key species - Alopecurus pratensis, Agrostis stolonifera, Lythrum
virgatum; anthropogenic species - Xanthium orientale (6440); key
species - Fraxinus excelsior, Alnus glutinosa, Salix alba, S. fragilis,
Populus nigra, Ulmus minor, Equisetum telmateia; anthropogenic
species - Fraxinus pennsylvanica, Amorpha fruticosa (91E0*); key
species - Quercus robur, Ulmus laevis, Ulmus minor, Fraxinus excelsior,
Fraxinus angustifolia, Populus nigra, P. canescens, P. tremula, Alnus
glutinosa, Humulus lupulus, Vitis vinifera subsp. sylvestris, Hedera helix;
anthropogenic species - Fraxinus pennsylvanica, Amorpha fruticosa,
Lycium barbarum, Xanthium orientale, Conyza canadensis, Cuscuta
campestris (91F0); key species - Salix alba, Populus alba, Alnus spp.,

106
Acer spp., Tamarix spp.; anthropogenic species - Fraxinus
pennsylvanica, Amorpha fruticosa, Populus canadensis (92A0); key
species - Tamarix ramosissima, Calamagrostis epigejos; anthropogenic
species - Cynodon dactylon, Amorpha fruticosa, Conyza canadensis,
Cuscuta campestris, Datura stramonium, Eclipta prostrata, Elaeagnus
angustifolia (92D0); Total core area (core area analysis); Land cover
diversity indices - EVI - Enhanced Vegetation Index; Arrival of
termophilic/ invasive species
Groundwater level (decline of)
Soil moisture is stable. Soil based indicators; Presence of groundwater
Species diversity: Artemisia santonicum, Aster tripolium, Salicornia
prostrata, Juncus gerardii, Plantago maritima, Cyperus pannonicus,
Achillea collina, Artemisia pontica, Puccinellia limosa, Scorzonera cana,
Halocnemum strobilaceum, Frankenia hirsuta, Aeluropus littoralis,
Limonium meyeri, L. gmelini, Carex distans, C. divisa, Taraxacum
bessarabicum, Halimione verrucifera, Hordeum hystrix (1530*);
Hippophaë rhamnoides (2160); Chara tomentosa, Hippuris vulgaris,
Hottonia palustris, Potamogeton pectinatus, Juncus bufonius (2190);
Cladium mariscus (7210*); Schoenus nigricans, Carex flava, Blysmus
compressus, Phragmites australis (stands) (7230); Quercus pubescens,
Carpinus orientalis, C. betulus, Fraxinus ornus, Galium dasypodum, Acer
campestre, Tilia tomentosa (91AA); Fraxinus excelsior, Alnus glutinosa,
Salix alba, S. fragilis, Populus nigra, Ulmus minor, Equisetum telmateia
(91E0*); Quercus robur, Ulmus laevis, Ulmus minor, Fraxinus excelsior,
Fraxinus angustifolia, Populus nigra, P. canescens, Alnus glutinosa,
Humulus lupulus, Vitis vinifera subsp. sylvestris, Hedera helix (91F0);
Salix alba, Populus alba, Alnus spp., Acer spp., Tamarix spp. (91A0);
Tamarix ramosissima, Calamagrostis epigejos (92D0).
Monitored parameters shown good
state of the habitat
Structure and species composition
of the habitat are the same during
the monitoring period
Water level changes
The habitats at risk will no longer
suffer changes in structure and
composition of species after 5 years
montoring.
Species diversity: Littorella uniflora, Juncus bulbosus, Eleocharis
acicularis, Cyperus fuscus, C. flavescens, Centaurium pulchellum (3130);
Spirodela spp., Wolffia spp., Hydrocharis morsus-ranae, Stratiotes
aloides, Utricularia australis, U. vulgaris, Aldrovanda vesiculosa, Azolla
filiculiodes, Potamogeton lucens, P. perfoliatus (3150); Utricularia spp,
Nuphar lutea, Nymphaea candida (3160); Chenopodium rubrum, Bidens
tripartita, Xanthium sp., Polygonum lapathifolium (3270); Glechoma
hederacea, Epilobium hirsutum, Aegopodium podagraria, Alliaria
petiolata, Lysimachia numularia, Lythrum salicaria (6430); Schoenus
nigricans, Carex flava, Blysmus compressus, Phragmites australis
(stands) (7230); Quercus robur, Ulmus laevis, Ulmus minor, Fraxinus
excelsior, Fraxinus angustifolia, Populus nigra, P. canescens, Alnus

107
glutinosa, Humulus lupulus, Vitis vinifera subsp. sylvestris, Hedera helix
(91F0); Salix alba, Populus alba, Alnus spp., Acer spp., Tamarix spp.
(92A0); Presence of water
Ensuring sufficient and viable stream
flow at high and low levels.
Constant water connectivity or water circulation between lakes and
channels in areas with high risks. Parameter: water velocity, water
depth, aquatic vegetation presence.
Habitat /species loss
Species composition and surfaces
limits of the habitat are preserved
Species diversity: Cakile maritima, Salsola kali, Atriplex spp.,
Polygonum spp., Euphorbia peplis, Elymus repens, Glaucium flavum,
Euphorbia paralias, Eryngium maritimum. Argusia sibirica (1210);
Salicornia spp., Suaeda maritima (1310); Bromus hordeaceus, Carex
colchica, Cerastium spp., Galium verum, Koeleria spp., Silene conica, S.
otites (2130*); Chara tomentosa, Elodea canadensis, Hippuris vulgaris,
Hottonia palustris, Potamogeton pectinatus, Juncus bufonius (2190);
Littorella uniflora, Juncus bulbosus, Eleocharis acicularis, Cyperus
fuscus, C. flavescens, Centaurium pulchellum (3130); Ranunculus
aquatilis, Myriophyllum spp., Callitriche spp., Berula erecta, Zannichellia
palustris, Potamogeton spp. (3260); Festuca valesiaca, Chrysopogon
gryllus, Alyssum saxatile, Agropyron pectiniforme, Koeleria macrantha,
Dichanthium ischaemum, Stipa capillata, S. ucrainica, Elymus hispidus
(62C0*); Glechoma hederacea, Epilobium hirsutum, Aegopodium
podagraria, Alliaria petiolata, Lysimachia numularia, Lythrum salicaria
(6430); Schoenus nigricans, Carex flava, Blysmus compressus,
Phragmites australis (stands) (7230); Fraxinus excelsior, Alnus glutinosa,
Salix alba, S. fragilis, Populus nigra, Ulmus minor, Equisetum telmateia
(91E0*); Quercus robur, Ulmus laevis, Ulmus minor, Fraxinus excelsior,
Fraxinus angustifolia, Populus nigra, P. canescens, P. tremula, Alnus
glutinosa, Humulus lupulus, Vitis vinifera subsp. sylvestris, Hedera helix
(91F0); Salix alba, Populus alba, Alnus spp., Acer spp., Tamarix spp.
(92A0); Habitat fragmentation/patchiness; Total core area (core area
analysis); Land cover diversity indices - EVI - Enhanced Vegetation
Index; Species phenology, length of vegetation season
Species establishment in the new
areas
In 5 years the monitoring plan shows
that species composition and
structure in the habitats is
maintained after grazing and
tourism activity exclusion
The reduction of silting up process
by maintaining the habitat area and
species
Key benthic species frequency and abundance remained stable in 5
years monitoring (1130).
Data which confirm the species
composition stability and
distribution
Species diversity: Chara canescens, Eleocharis parvula, Potamogeton
pectinatus, Ruppia maritime, Lemna trisulca, Najas marina, Phragmites
australis, Potamogeton spp., Stratiotes aloides, Typha spp. (1150*);
Habitat fragmentation/patchiness

108
Other leisure and tourism impacts
No presence of tourist facilities Infrastructure data: ortho-plans images, satellite images, field data.
Habitat fragmentation/patchiness Reduced number of tourists
Eutrophication
Frequency and intensity of the
phenomenon is significantly
reduced.
Species diversity: phytoplankton community’s analysis by qualitative
and quantitative population indices. The results will indicate:
When increasing the numerical abundance is notified, lesser species
have the potential to develop. Number of the phytoplankton species
with massive development continues to decrease or remain stable.
Total core area (core area analysis)
Projection of scenarios are relevant
by matching with the predicted
results
Absence of the phenomenon in the
expected period
The aquatic plant species frequency
and abundance was constant in the
last 5 years
Species diversity: Zostera sp., Potamogeton spp., Ruppia spp.,
Zannichellia spp. (1110); Chara canescens, Eleocharis parvula,
Potamogeton pectinatus, Ruppia maritime, Lemna trisulca, Najas
marina, Phragmites australis, Potamogeton spp., Stratiotes aloides,
Typha spp. (1150*); Chara spp. and Nitella spp.(3140); Spirodela spp.,
Wolffia spp., Hydrocharis morsus-ranae, Stratiotes aloides, Utricularia
australis, U. vulgaris, Aldrovanda vesiculosa, Azolla filiculiodes,
Potamogeton lucens, P. perfoliatus (3150); Utricularia spp, Nuphar
lutea, Nymphaea candida (3160); Habitat fragmentation/patchiness
Silting up
Indicator species that show stability
of the habitat
Species diversity: Zostera marina, Zostera noltii (1140); Zostera spp.,
Ruppia maritima, Potamogeton spp. (ex., P. pectinatus), Najas marina,
benthic algae (1160); Littorella uniflora, Juncus bulbosus, Eleocharis
acicularis, Cyperus fuscus, C. flavescens, Centaurium pulchellum (3130);
Chara spp. and Nitella spp. (3140); Spirodela spp., Wolffia spp.,
Hydrocharis morsus-ranae, Stratiotes aloides, Utricularia australis, U.
vulgaris, Aldrovanda vesiculosa, Azolla filiculiodes, Potamogeton lucens,
P. perfoliatus (3150); Habitat fragmentation/patchiness; Presence of
water
The spawning grounds for some fish
species are still active
Dispersed habitation
New areas or good state of habitat
due to expansion of ecologically
reconstructed areas
Species diversity: Zostera marina, Zostera noltii (1140); Littorella
uniflora, Juncus bulbosus, Eleocharis acicularis, Cyperus fuscus, C.
flavescens, Centaurium pulchellum (3130); Habitat

109
fragmentation/patchiness
Grazing/ overgrazing
The monitored data had shown a
good state of the habitat structure
and key species composition.
Species diversity: Artemisia santonicum, Aster tripolium, Salicornia
prostrata, Juncus gerardii, Plantago maritima, Cyperus pannonicus,
Achillea collina, Artemisia pontica, Puccinellia limosa, Scorzonera cana,
Halocnemum strobilaceum, Frankenia hirsuta, Aeluropus littoralis,
Limonium meyeri, L. gmelini, Carex distans, C. divisa, Taraxacum
bessarabicum, Halimione verrucifera, Hordeum hystrix (1530*); Bromus
hordeaceus, Carex colchica, Cerastium spp., Galium verum, Koeleria
spp., Silene conica, S. otites (2130*); Hippophaë rhamnoides (2160);
Habitat fragmentation/patchiness; Total core area (core area
analysis); Land cover diversity indices - EVI - Enhanced Vegetation
Index
The key species and habitat
structure is in good state at least for
the last 5 years
Species diversity: Elymus farctus, Leymus sabulosus, Euphorbia peplis,
Medicago marina, Eryngium maritimum (2110); Total core area (core
area analysis)
The key species and habitat
structure is in good state for viper
population.
Species diversity: Vipera ursinii, Juncus maritimus, J. acutus, Carex
extensa, Aster tripolium, Plantago cornuti, Scorzonera parviflora,
Taraxacum bessarabicum, Samolus valerandi H. maritimum, Orchis
coriophora subsp. fragrans (1410)
Erosion
New monitoring data show habitat
some stability in vegetation
structure and surface
Species diversity: Cakile maritima, Salsola kali, Atriplex spp.,
Polygonum spp., Euphorbia peplis, Elymus repens, Glaucium flavum,
Euphorbia paralias, Eryngium maritimum. Argusia sibirica (1210);
Habitat fragmentation/patchiness; Total core area (core area analysis);
Wind and water erosion/ physical degradation of land
cover/denudation
6.3. Monitoring of success of management actions indicators for evaluation of management
Evaluation is used to demonstrate how effective programs have been in achieving their targets and
results. The data used for program evaluation will be drawn from a number of different sources, such as
program indicators, periodic data collection from surveys, or special studies. The information from
program evaluations can be used to revise program practices, to achieve better desired outcomes, as
well as to report to donors. Program evaluations require funding, planning and time (USAID, 1996).

110
Table 46. Indicators for evaluation of management
Natura 2000 code Type of
indicators
Monitoring and evaluation activities
1110, 1140, 1150*,
1160, 1210, 1310,
1410, 1530*, 2110,
2130*, 2160, 2190,
3130, 3140, 3150,
3160, 3260. 3270,
62C0*, 6430, 6440,
7210*, 7230, 91AA,
91E0*, 91F0, 92A0,
92D0
Species
diversity
Data collection, Direct analysis of the species population, Yearly
monitoring;
Data collection, Direct analysis at the level of species. Yearly
monitoring of geomorphologic parameters (erosion, dunes are
shifting – Musura Island) and anthropogenic pressures;
Direct and indirect (satellite images and ortho-photo) monitoring.
Important habitat for Vipera ursinii. Frequently monitored due
strong influence of anthropogenic pressure.
Direct and indirect (satellite images and ortho-photo) monitoring.
Occasionally included in other monitoring plans for different reasons
(anthropogenic pressure, fluctuation of ground water level)
Indirect (satellite images and ortho-photo) monitoring. Occasionally
direct monitoring when is included in other monitoring plans for
different reasons (touristic activity and development).
Direct monitoring of species population and data collection (aquatic
plants, chemical data, and water parameters). Seasonally monitoring
Indirect (satellite images and ortho-photo) monitoring.
Occasionally direct monitoring when is included in other monitoring
plans for different reasons
1130 Key benthic
species
frequency and
abundance
Data collection, Direct analysis of the species population, Yearly
monitoring
1140, 1150*, 1160,
1310, 1530*, 2130*,
2160, 2190, 3130,
3150, 3160, 3260,
62C0*, 6430, 91AA,
91E0*, 91F0, 92A0,
92D0
Habitat
fragmentation/
patchiness;
Data collection, Direct analysis at the level of species. Yearly
monitoring of geomorphologic parameters and anthropogenic
pressures.
Land cover analysis Remote sensing satellite imagery, aerial
photographs
Data collection, Direct analysis of the population, Yearly monitoring;
1140, 1160, 3130,
3140, 3150, 3270,
6430, 7230, 92A0
Presence of
water
Land cover analysis Remote sensing satellite imagery, aerial
photographs
Direct and indirect (satellite images and ortho-photo) monitoring.

111
Occasionally included in other monitoring plans for different reasons
(anthropogenic pressure, fluctuation of ground water level)
1210, 1310, 1410,
1530*, 2110, 2130*,
2160, 2190, 3130,
3260, 62C0*, 6430,
6440, 7230, 91AA,
91E0*, 91F0, 92A0,
92D0
Total core area
(core area
analysis)
Land cover analysis Remote sensing satellite imagery, aerial
photographs
Direct and indirect (satellite images and ortho-photo) monitoring.
Occasionally included in other monitoring plans for different reasons
(anthropogenic pressure, fluctuation of ground water level)
Data collection, Direct analysis of the population, Yearly monitoring;
1210 Wind and water
erosion/
physical
degradation of
land cover/
denudation
Land cover analysis Remote sensing satellite imagery, aerial
photographs
Direct and indirect (satellite images and ortho-photo) monitoring.
Shore line comparison between several years.
1310, 1410, 1530*,
2110, 2130*, 2160,
2190, 3130, 3260,
62C0*, 6430, 6440,
7230, 91E0*, 91F0,
92D0
Land cover
diversity indices
- EVI - Enhanced
Direct and indirect (satellite images and ortho-photo) monitoring.
Occasionally included in other monitoring plans for different reasons
(anthropogenic pressure, fluctuation of ground water level)
Direct monitoring activities in Popina Island (Razelm Lake).
Occasionally included in other monitoring plans for different reasons
(overgrazing). Usually the data collection is made in spring (for the
insects) summer season (for the vegetation).
Land cover analysis Remote sensing satellite imagery, aerial
photographs;
1310, 2130*, 2190,
3130, 3260, 62C0*,
6430, 6440, 7230,
91E0*, 91F0, 92D0
Vegetation
Index;
Species
phenology,
length of
vegetation
season
Direct and indirect (satellite images and ortho-photo) monitoring.
Yearly monitoring activities. Data collection is usually made in
autumn.
Direct monitoring, occasionally indirect (satellite images and ortho-
photo) monitoring. Usually in summer period (for vegetation).
Data collection, Direct analysis at the level of species.
1410, 1530*, 2110,
2160, 6440, 91E0*,
91F0, 92D0
Arrival of
termophilic/
invasive species
Occasionally included in other monitoring plans for different reasons
(overgrazing). Usually the data collection is made in late spring (for
the insects) summer season (for the vegetation).
Data collection, Direct analysis at the level of species.
1530*, 2160, 2190, Presence of Occasionally direct monitoring when is included in other monitoring

112
7210*, 7230, 91AA,
91E0*, 91F0, 92D0
groundwater plans for different reasons
Direct and indirect (satellite images and ortho-photo) monitoring.
Occasionally included in other monitoring plans for different reasons
(anthropogenic pressure, fluctuation of ground water level);
1530*, 2160, 2190,
7210*, 7230, 91AA,
91E0*, 91F0, 92D0
Soil based
indicators
Occasionally direct monitoring when is included in other monitoring
plans for different reasons
7. Climate Change Adapted Management
7.1. Description of adapted management strategies new and adapted strategies for
CAMP area of whole investigation area
The administration and management of DDBR is a complex process, distinct from, but linked to local
government structures that operate within the reserve. They comprise DDBR lands under national
control, lands under local government control, and lands privately owned, distributed among seven
communes and the town of Sulina. According to public local administration law (Law No. 69/1991), the
local communal councils include elected bodies that make all decisions relating to land under their
control, including development planning and control, public works, conservation of historical
monuments, recreation facilities and protection and improvement of the environment in order to better
the quality of life. The next level of government is Tulcea County, which coordinates various communal
services on behalf of the communal councils, and takes responsibility for land under its own control,
town planning, maintaining and improving the infrastructure (roads and water supply). Within the
DDBR, the county controls fish areas, agricultural polders and forest plantations (about 860 km2) used by
companies in which the state holds a majority share.
The permanent management objectives are:
• Shaping and improving of hydrological regime;
• Enhancing the knowledge of ecosystems’ functioning;
• Enhancing the knowledge of biodiversity;
• Surveillance of coastal morphologic processes;
• Sustainable use of renewable natural resources and regulation of the economic activities, especially the traditional ones;
• Reconstruction of damaged ecosystems;
• Evaluation and limitation of pollution phenomenon and natural and anthropogenic hazards;
• Development of a information system and a integrated monitoring;
• Information and environmental education of public and local population;
• Cooperation with national and international organizations;

113
It should be noted that there are three levels of priority:
a) Improving the institutional organization: these recommendations form the basis for improving
the DDBR's status by training the local authorities’ capacity to face the demands for respective
area.
b) Interventions in the infrastructure: many DDBR’s residents have no access to basic services,
including here drinking water, wastewater, etc. The improvement of the access to these basic
services is necessary for reducing poverty and to strengthen the human development.
c) Strategies for spreading the economic growth and the promotion of the social development.
The strategy is part of the management plan that deals with the problems of preparation, planning and
development of the operations set to achieve the proposed goals. For example: development strategies
for integrating the objectives of the biodiversity’s conservation with the implementation of the policies
regarding socio-economic systems (SES).
The Master Plan regards the integration of the actions for each problem identified in a global strategy
that ensure the synergic realization of all the actions to achieve the proposed objectives and goals. The
Master Plan’s measure of success is given by the implementation degree of the proposed actions. We
can, also, speak about a strategy of environment’s protection.
Investment works performed during the period 1990 – 2010 as ecological reconstruction:
• Improvements for ecological rehabilitation conditions in natural aquatic complexes from Danube Delta;
• Improvements for environment rehabilitation conditions in natural areas of reproduction for indigene fish species;
• Hydro technical works for improvement of water circulation;
• De-clogging works of the main fishing channels;
• Works for clogging prevention of the channels, streams and lakes in order to maintain an optimal hydrologic regime;
• Ecological reconstruction of abandoned agricultural and fishery polders.
General objectives are the extension of aquatic habitats for fish and birds by wetlands rehabilitation and
developing new strategies of ecological agriculture and sustainable grazing;
Subsidiary objectives: Protection of species population and habitats; Reintegration of former agricultural
and fish polders in the natural hydrological cycle; Specific function restoration of the wetlands;
Rehabilitation of hydrological and ecological equilibrium; Achievement of new habitats for fish and
birds; Restoration of traditional economic activities; Tourism development in accordance with E.U.
environmental legislation.
Actions:

114
1. Rehabilitation of channels network in order to improve the water circulation
Aims: Reactivation of water circulation in the channels network; Reshaping of the main (218 km) and
secondary (240 km) channels by dredging; Calibration of Uzlina and Caraorman channels; Banks
consolidation and fortification 7600 mp
2. Restoration of the areas used for agriculture and fisheries arrangements
Aims: Reactivation of the managed areas in economic purpose in the natural hydrological cycle; Opening
breaches in embankments of defences in fixed places for connecting hydraulic modelling of agricultural
and fish enclosures in the natural hydrological regime; The total surface is 15712 ha.

115
7.2. Time-frame and concept of stakeholder involvement during CAMP implementation
THEME: A. THE MANAGEMENT OF BIODIVERSITY CONSERVATION
OBJECTIVES: Implementation of the action plan for flora and fauna conservation
Integrated monitoring of D.D.B.R.
ACTIONS
LIMITS/
TARGET
PR
IOR
ITY
Half of the year; Activity with the priority PRIORITY 1 Assigned actions which MUST be developed in implementation period of the management plan: no excuse for the failure PRIORITY 2 Assigned actions which SHOULD BE finalized. There is flexibility, but must be sustained by a serious motivation if the actions will not be achieved. PRIORITY 3 Actions that will be carried out if there is sufficient time and resources after priority 1 and 2 finalization.
PARTNERS FOR
IMPLEMENTATION
NOTES/
BENEFICIARIES
2013 2014 2015 2016
II
I II I II I
A 1. Studies on flora and vegetation from D.D.B.R.
Inventory of all habitats and species existent in D.D.B.R. Comparative analysis of plants lists mentioned in literature
2
Research institutes, universities, NGOs, professional associations, specialized volunteers
All Natura 2000 habitats/DDBRA

116
Report on species diversity and ecological state of different habitats
A 2. Inventory and description of habitats from D.D.B.R.
Report on habitat types and their ecological state within D.D.B.R.. Drawing of the habitat conservation plan according to climate changes
1
Research institutes, universities, NGOs, professional associations, specialized volunteers
All Natura 2000 habitats/DDBRA
A 3.Studies on diversity and species population in concern with climate changes
Sensitive species inventory present D.D.B.R.. The comparative analysis of species list and extreme phenomena
2
Research institutes, universities, NGOs, professional associations, specialized volunteers All Natura
2000 habitats/DDBRA and National Agency of Forestry
A 4. Elaboration of habitat conservation plan with respect to climate changes by special protection measures
Report on habitats’ ecological state. The conservation of not-endangered and of conservative-interest populations
1
Research institutes, universities, NGOs, professional associations, specialized volunteers
All Natura 2000 habitats/DDBRA, Tulcea County Council and National Agency of Forestry
A 5. The monitoring of fauna The selection of 3 Research institutes, universities,
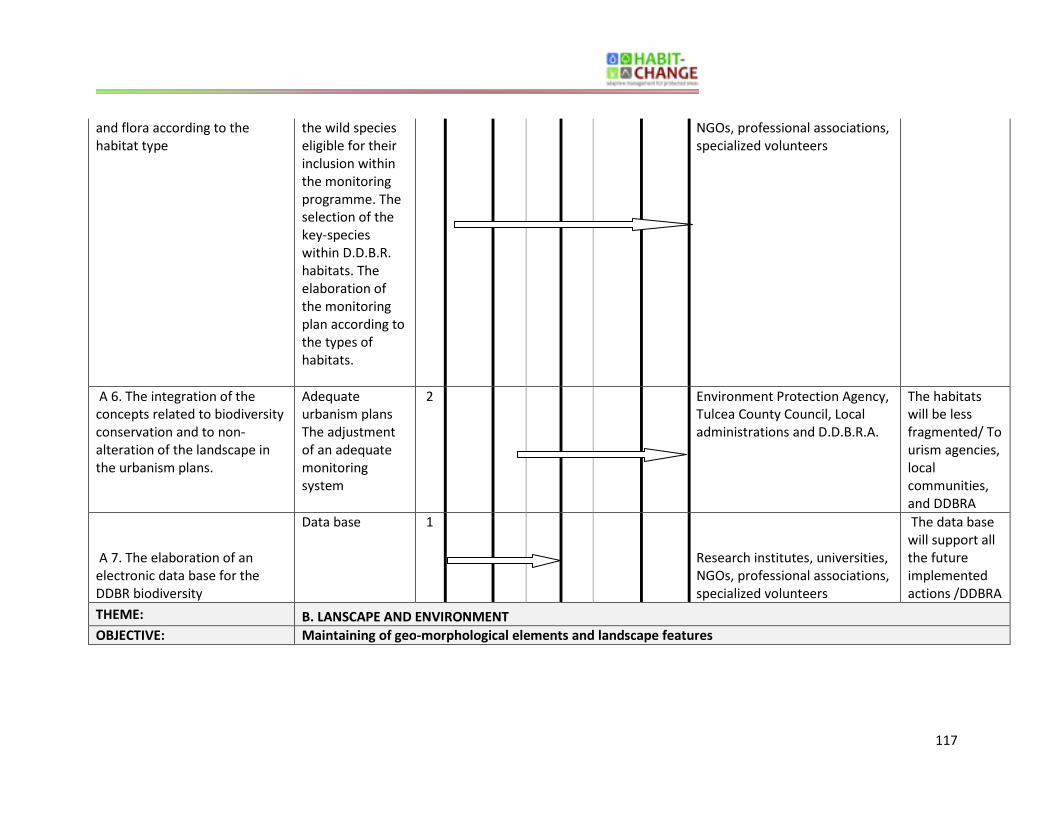
117
and flora according to the habitat type
the wild species eligible for their inclusion within the monitoring programme. The selection of the key-species within D.D.B.R. habitats. The elaboration of the monitoring plan according to the types of habitats.
NGOs, professional associations, specialized volunteers
A 6. The integration of the concepts related to biodiversity conservation and to non-alteration of the landscape in the urbanism plans.
Adequate urbanism plans The adjustment of an adequate monitoring system
2
Environment Protection Agency, Tulcea County Council, Local administrations and D.D.B.R.A.
The habitats will be less fragmented/ Tourism agencies, local communities, and DDBRA
A 7. The elaboration of an electronic data base for the DDBR biodiversity
Data base 1
Research institutes, universities, NGOs, professional associations, specialized volunteers
The data base will support all the future implemented actions /DDBRA
THEME: B. LANSCAPE AND ENVIRONMENT
OBJECTIVE: Maintaining of geo-morphological elements and landscape features

118
ACTIONS
LIMITS/
TARGET
PR
IOR
ITY
Half of the year; Activity with the priority PRIORITY 1 Assigned actions which MUST be developed in implementation period of the management plan: no excuse for the failure PRIORITY 2 Assigned actions which SHOULD BE finalized. There is flexibility, but must be sustained by a serious motivation if the actions will not be achieved. PRIORITY 3 Actions that will be carried out if there is sufficient time and resources after priority 1 and 2 finalization.
PARTNERS FOR
IMPLEMENTATION
NOTES/
BENEFICIARIES
2013 2014 2015 2016
II
I II I II I
B 1. The identification, mapping and recovery by means of ecological reconstruction of the degraded habitats
The evaluation of the dimension and frequency of the activities with impact on diversity
3
Research institutes, universities, D.D.B.R. Administration , Apele Române,
Habitats under climate change pressure/ DDBRA
B 2. Ecological reconstruction within the forest area
Foresting – completing Integral foresting The monitoring of the area
2
D.D.B.R. Administration, National Agency of Forestry
Habitats under climate change pressure/ DDBRA and National Agency Forestry

119
B 3. The detour of the tourist routes out of the sensitive areas with detritus, if possible, or the warning on the area’s sensitivity with respect to climate change pressure
Detoured or signaled routes.
2 D.D.B.R. Administration, RNP, Tulcea County Council
Better protection for some sensitive habitats/ Tourist agencies, DDBRA
B 4. The protection of fauna within not-arranged areas through limitation – non-promoting of tourist access, prohibition of fire and garbage deposits.
restricted access, clean areas
2 Research institutes, universities, D.D.B.R. Administration, National Agency of Forestry, Garbage collectors
DDBRA,
THEME: C. RESOURCES USE
OBJECTIVE: Maintaining and promotion of exploitable sustainable activities in designated areas
ACTIONS
LIMITS/
TARGET
PR
IOR
ITY
Half of the year; Activity with the priority PRIORITY 1 Assigned actions which MUST be developed in implementation period of the management plan: no excuse for the failure PRIORITY 2 Assigned actions which SHOULD BE finalized. There is flexibility, but must be sustained by a serious motivation if the actions will not be achieved. PRIORITY 3 Actions that will be carried out if there is sufficient time and resources after priority 1 and 2 finalization.
PARTNERS FOR
IMPLEMENTATION
NOTES/
BENEFICIARIE
S
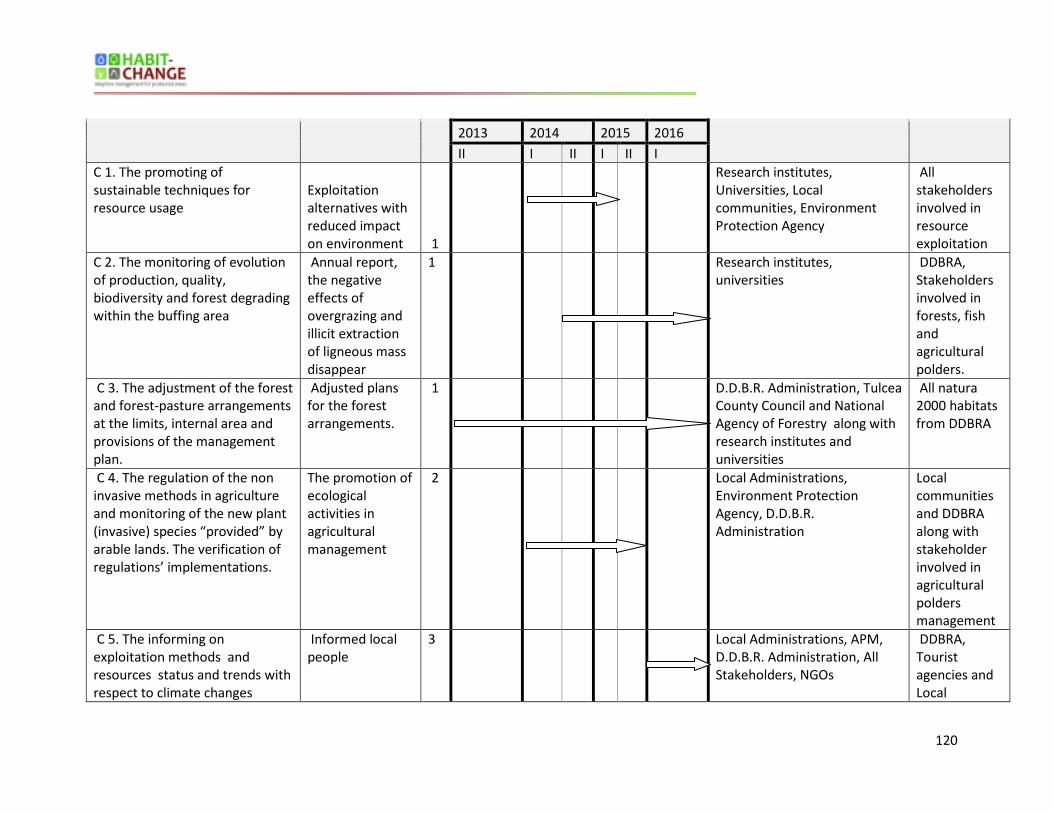
120
2013 2014 2015 2016
II I II I II I
C 1. The promoting of sustainable techniques for resource usage
Exploitation alternatives with reduced impact on environment 1
Research institutes, Universities, Local communities, Environment Protection Agency
All stakeholders involved in resource exploitation
C 2. The monitoring of evolution of production, quality, biodiversity and forest degrading within the buffing area
Annual report, the negative effects of overgrazing and illicit extraction of ligneous mass disappear
1 Research institutes, universities
DDBRA, Stakeholders involved in forests, fish and agricultural polders.
C 3. The adjustment of the forest and forest-pasture arrangements at the limits, internal area and provisions of the management plan.
Adjusted plans for the forest arrangements.
1 D.D.B.R. Administration, Tulcea County Council and National Agency of Forestry along with research institutes and universities
All natura 2000 habitats from DDBRA
C 4. The regulation of the non invasive methods in agriculture and monitoring of the new plant (invasive) species “provided” by arable lands. The verification of regulations’ implementations.
The promotion of ecological activities in agricultural management
2 Local Administrations, Environment Protection Agency, D.D.B.R. Administration
Local communities and DDBRA along with stakeholder involved in agricultural polders management
C 5. The informing on exploitation methods and resources status and trends with respect to climate changes
Informed local people
3 Local Administrations, APM, D.D.B.R. Administration, All Stakeholders, NGOs
DDBRA, Tourist agencies and Local

121
Administrations
THEME: D. LOCAL COMMUNITIES
OBJECTIVE: Participation of local communities in management objectives achievements
ACTIONS
LIMITS/
TARGET
PR
IOR
ITY
Half of the year; Activity with the priority PRIORITY 1 Assigned actions which MUST be developed in implementation period of the management plan: no excuse for the failure PRIORITY 2 Assigned actions which SHOULD BE finalized. There is flexibility, but must be sustained by a serious motivation if the actions will not be achieved. PRIORITY 3 Actions that will be carried out if there is sufficient time and resources after priority 1 and 2 finalization.
PARTNERS FOR
IMPLEMENTATION
NOTES/
BENEFICIARIE
S
2013 2014 2015 2016
II I II I II I
D 1. The organizing and promoting by special events the climate change effects and necessary management for mitigation
Area promotion on short term
1
Local Administrations, D.D.B.R. Administration, Research institutes, universities, NGOs, volunteers specialized on biodiversity
Can be used the celebrating days related with environment/ local communities, schools, private

122
THEME E. TOURISM
OBJECTIVE Elaboration of strategic plan for the touristic development
ACTIONS
LIMITS/
TARGET
PR
IOR
ITY
Half of the year; Activity with the priority PRIORITY 1 Assigned actions which MUST be developed in implementation period of the management plan: no excuse for
PARTNERS FOR
IMPLEMENTATION
NOTES/
BENEFICIARIE
S
companies and resource stakeholders
D 2. The providing in some information points different materials, documentary and other products related with climate change and importance of biodiversity conservation along with traditional products
Visiting centres, information centres, events
1
Local Administrations, D.D.B.R. Administration, tourist agencies and NGOs
Tourist agencies
D 3. The integration of both local communities’ values, natural ones within the strategy for climate change effects mitigation
The strategy for climate change management promotion
1
NGOs, D.D.B.R. Administration, Mass media, Tulcea County Council
DDBRA, Local Administrations
D 4. The encouragement of keeping good management practices and developing in partnership with local communities new ones in accordance with European directives for biodiversity conservation
The elaboration of CC mitigation measures
3
Local Administrations, D.D.B.R. Administration, Mass media, Tulcea County Council DDBRA

123
the failure PRIORITY 2 Assigned actions which SHOULD BE finalized. There is flexibility, but must be sustained by a serious motivation if the actions will not be achieved. PRIORITY 3 Actions that will be carried out if there is sufficient time and resources after priority 1 and 2 finalization
2013 2014 2015 2016 II I II I II I
E 1. The directing of the tourist access into the protected area depending on the conservation interests and the limitation of accident risk with respect to climate change pressures
The map with the modifications of the tourist route network
1 D.D.B.R. Administration, NGOs Tourist agencies, local communities, DDBRA
E 2. The materialization in the field of tourist routes depending on the new tourist zoning and potential risk of climate change effects on habitats
Appropriately marked routes, barriers, the reduction of the potential accidents, the conservation state
1 NGOs, volunteers, communities, schools, local administrations
DDBRA, tourist agencies
E 3. Rehabilitation actions with the view to reduce the negative impact of climate change effects on tourist objectives and habitats in general
Partnerships with NGOs, schools, local involved communities
2
NGOs, volunteers, communities, schools, Local Administrations , DDBRA and other stakeholder involved in management of protected areas
Tourist agencies, National Agency of Forestry, DDBRA

124
E 4. The providing of an appropriate tourist infrastructure (visiting centres and information points, routes, refuges)
Visiting centres and information points, routes, refuges
1 Local Administrations, National Agency of Forestry, D.D.B.R Administration, Tulcea County Council
DDBRA, local Administrations and local communities
E 5. The establishment and arrangement of camping areas, car DDBRs in order to preserve the habitats and species
Camping areas, car DDBRs
2 Local Administrations, D.D.B.R Administration
Tourist agencies, DDBRA, Apele Romane
E 6. The setting-up of climate change educational routes
Routes 3 D.D.B.R Administration NGOs
schools
E 7. The organization of a specialized tourism on various fields (ornithologic, botanical, forest, geological etc.)
Specialised tourist agency
2 Volunteers specialized in biodiversity conservation, NGOs, tourist agencies and DDBRA
All Natura 2000 habitats/ DDBRA, local communities
E 8. The tourism monitoring and pressure on climate change sensitive habitats
Adapted data, maps
2 Local Administrations, D.D.B.R Administration
All Natura 2000 habitats/ DDBRA
8.
THEME: F. EDUCATION AND PUBLIC AWARENESS
OBJECTIVE: Improving attitudes of local communities and stakeholders with respect to public awareness and consultation
ACTIONS
LIMITS/
TARGET
PR
IOR
ITY
Half of the year; Activity with the priority PRIORITY 1 Assigned actions which MUST be developed in implementation period of the management plan: no excuse for the failure PRIORITY 2 Assigned actions which SHOULD BE finalized. There is flexibility, but must be sustained by a serious motivation if the
PARTNERS FOR
IMPLEMENTATION
NOTES/
BENEFICIARI
ES

125
actions will not be achieved. PRIORITY 3 Actions that will be carried out if there is sufficient time and resources after priority 1 and 2 finalization.
2013 2014 2015 2016
II I II I II I
F 1. The identification of the present educational activities
Report on drawbacks in this field
1 Research Institutes , universities and schools along with D.D.B.R. Administration
Local communities, schools, private companies
F 2. The elaboration of an action plan
Partners for future activities Recommendations for public awareness and ecological education
1 Research Institutes D.D.B.R. Administration
DDBRA and all stakeholders
F 3. The arrangement of visiting centres and information points
Visiting centres and information points
1 Local Administrations, D.D.B.R.’s Administration, Tulcea County Council, Interior Design Companies DDBRA
F 4. The emplacement of educational and informative boards in the field and maintenance
Boards, information
1 NGO, volunteers, Local Administration , DDBR Administration
DDBRA, Tourist agencies, all stakeholders
F 5. The editing of educational Brochures, Specialized companies, NGOs, Local

126
and informative materials about climate changes
leaflets, maps, postcards, posters and other informative materials regarding climate changes
DDBR Administration communities, tourist agencies, schools, DDBRA
F 6. The elaboration and updating of a DDBRA WEB page
The number of visitors of the WEB page and questionnaire for climate change
1 IT Specialist, NGO
DDBRA
F 7. Actions which offer people the opportunity to take part to the DDBR activities
Programmes with NGOs, schools
2 Schools NGO Volunteers
Local communities, DDBRA
F 8. The promotion of the DDBRA image through the participation to national and international manifestations, mass – media
The number of articles, reports, informative materials
2 Schools NGO Mass media
DDBRA
F 9. The monitoring of the awareness process impact
Questionnaires, less waste
3 NGO Mass media D.D.B.R. Administration
DDBRA and all stakeholders

127
THEME: G. MANAGEMENT AND ADMINISTRATION
OBJECTIVE: Elaboration of the plan for promotion activities that generate incomes
ACTIONS
LIMITS/
TARGET
PR
IOR
ITY
Half of the year; Activity with the priority PRIORITY 1 Assigned actions which MUST be developed in implementation period of the management plan: no excuse for the failure PRIORITY 2 Assigned actions which SHOULD BE finalized. There is flexibility, but must be sustained by a serious motivation if the actions will not be achieved. PRIORITY 3 Actions that will be carried out if there is sufficient time and resources after priority 1 and 2 finalization.
PARTNERS FOR
IMPLEMENTATION
NOTES/
BENEFICIARI
ES
2013 2014 2015 2016
II I II I II I
G 1. The activity of biological and non-biological values’ promotion
Area promotion on short term 2
Mass media, NGO, Local Administration , DDBR Administration
Species and habitats are promoted in mass media and other methods to public opinion/DDBRA
G 2. The identification of income-generating activities which concords with the D.D.B.R. management
incomes 1
D.D.B.R. Administration, local administration, NGOs and private companies
DDBRA, local communities

128
Theme The implementation monitoring of the management plan
Objectives Credits which shows the steps implemented systematically with respect to
management plan, monitoring and evaluation.
Actions and indicators
correspondence
Frequency
Periodic-P
Continuous-C
As required-N
Observations
5.8.1. The monitoring of natural resources’ state
The completion of flora and fauna A1, A2, A3, P Studies
The foundation of a monitoring sector network associated to the monitoring procedures of the species and habitats
A1, A2, A3, A5 P
Collaborations
The implementation of surveillances-evaluations of the identified target-species (including game)
A3, A4, A5, A7 P
Reports
The annual implementation of the ecological impact evaluation of the tourist routes
A5, A6, B3, B4, P
Evaluation
The annual checking of the permanent water courses A6, B1, C1, E3 P Reports
G 3. The adjustment of the DDBR administration’s diagram to the necessities of the management plan’s implementation
The adjusted diagram, 6 employed field agents
1 Local administration D.D.B.R. Administration,
DDBRA
G 4. The identification of auto-financing sources and the attraction of new- financing sources in order to sustain the new climate change measures
incomes NGOs, Embassies, EU International and national financing programmes
DDBRA, Ministry of Environment, local communities
G 5. The infrastructure foundation
Visiting centres, information points, refuges, routes, other facilities
1 NGO, D.D.B.R. Administration, Local administration, Communities
DDBRA

129
(vegetation, garbage, discharges)
The establishment and implementation of a collecting system of volunteers and visitors’ suplimentary recordings (information submitted to the visiting centres, rangers’ field notebooks)
D1, D3, D4, E1, E4
C
Patrol reports and questionnaires
The establishment and updating of the data base for biological recording corresponding to the geographic information system of the DDBR
A7 C
Workshops evaluations
The monitoring of the accessory produces collecting C2, C4, D2, P Reports
The collection of data with concern to the monitoring on the usage of resources and activities carried out by other agencies within the DDBR area
C1, C2, C3, C5, E4, E6 C
Evaluation
The monitoring of the forest operations within the DDBR in order to follow the effective regulations
C3 C
Reports
Discussions with the local population with concern to waste-dropping
B4, C5, E3, F7 P
Questionnaires
5.8.2. The monitoring of the physical resources state
Annual checking of the border marks E1, E2, E4 P Check
The providing of a three-year checking of all the marked routes, as well as climbing routes. The supplementary checking if necessary
E1, E2, E3, E4, E5, E6, E7 P,N
Evaluation
Equipment inventory E7, F1 C Check
The monitoring of waste and visited areas A5, C5, E3, F9 Evaluation
5.8.3. The monitoring of the attitude and visitors’ behaviour
Data collection subsequent to guard and tourist activities related to the tourist behaviour in the DDBR
E4, E9, G3 C
Evaluation
Annual tourist inventories, with qualitative and quantitative information
E2, E4, E8, F1, F2, F3, F4, F5 P
Reports
Evaluations of awareness and understanding the DDBR goals before and after implementing educational and awareness programmes and activities.
D4, D5, F N
Workshops meetings evaluations, Letter notification
5.8.4. The monitoring of the elaboration of the work plans

130
The completion of the planned works monitoring E8, F9 N Reports
The ensurance of the fact that the teams who carry out works and installations in the field present reports, localization maps, photographs etc.
G3, G4, G5 N
Reports
The ensurance of professional design, reports and other necessary reports for large constructions and installations of the DDBR
G N
Reports
5.8.5. The monitoring of a participative management
elaboration
The monitoring of the official materials and documents, conventions elaborated by the DDBR
F1, F2, F4, F5, F6, F7, F8, F9 C
Evaluation
The recording of small grants programme G4 C Fundraising
The providing of some adequate formats for contracts, agreements, and the inclusion of the reporting, reviewing and monitoring ways
G3, G4, G5 C
PR, Collaborations
The production of minutes and reports subsequent to the work meetings, sittings etc.
F7 C
Reports
Report writing and records by the personnel who participate or organize events
F2, F7 C
Workshops meetings evaluations, Letter notification
5.8.6 The monitoring of the internal and external activities,
of the documented activities, of the documents
The maintenance of a map, plans produces’ archive and other data produced and updated through GIS and other data bases.
A7 C
Data collection
The ensurance that the official maps of the DDBR are distributed to the interested authorities
F P
Workshops
The ensurance of accession and inclusion of observations (including The Scientific and Advisory Board) on major studies and reports, ordered or carried out by the DDBR administration
C1
N
Workshops
The maintenance of project proposals’ evidence and G1, G2, G3, G4 C Collaborations
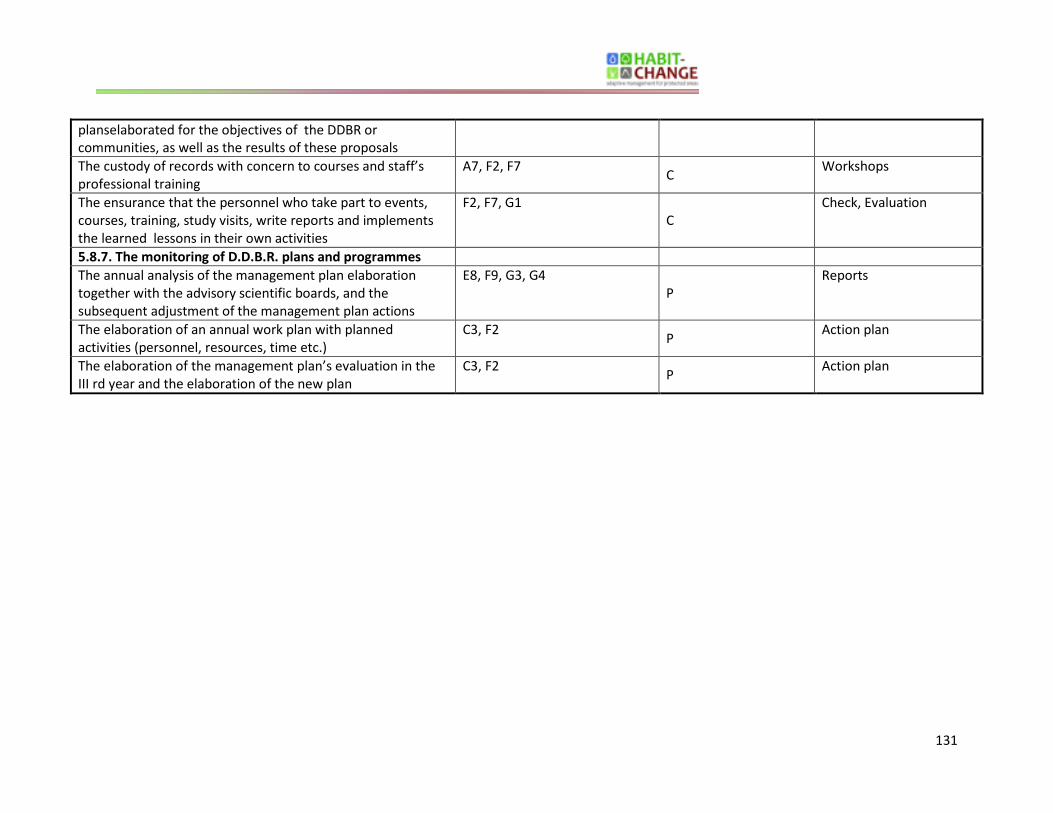
131
planselaborated for the objectives of the DDBR or communities, as well as the results of these proposals
The custody of records with concern to courses and staff’s professional training
A7, F2, F7 C
Workshops
The ensurance that the personnel who take part to events, courses, training, study visits, write reports and implements the learned lessons in their own activities
F2, F7, G1 C
Check, Evaluation
5.8.7. The monitoring of D.D.B.R. plans and programmes
The annual analysis of the management plan elaboration together with the advisory scientific boards, and the subsequent adjustment of the management plan actions
E8, F9, G3, G4 P
Reports
The elaboration of an annual work plan with planned activities (personnel, resources, time etc.)
C3, F2 P
Action plan
The elaboration of the management plan’s evaluation in the III rd year and the elaboration of the new plan
C3, F2 P
Action plan

[Tastaţi text]
132
References:
1. Anastasiu P. and Negrean G., 2005, Alien plants in Romania (I). IN: Scientific Annals of „Alex. Ioan Cuza” -
University of Iasi, seria II. Vegetal Biology, tom LI
2. Anastasiu P., Negrean G., Başnou C., Sîrbu C. and Oprea A., 2007, A preliminary study on the neophytes of
wetlands in Romania, Rabitsch, W., F. Essl & F. Klingenstein (Eds.): Biological Invasions – from Ecology to
Conservation. NEOBIOTA 7: 181-192 ;
3. Bailey-Serres J. and Voesenek L.A., 2008, Flooding stress: acclimations and genetic diversity. Annu Rev Plant Biol.
59: pp.313-319
4. Binggeli P., 1996, A taxonomic biogeographical and ecological overview of invasive woody species. Journal of
Vegetation Science, 7, 121–124
5. Blaikie P., Cannon T., Davis I., and Wisner B., 1994, At Risk: Natural Hazards, People’s Vulnerability, and
Disasters. London: Routledge;
6. Bogdan O., 2001, Climatic individuality of Dobrogea Plateau, Geographical. Review. VII, new series, Bucharest
7. Bondar C., 1993, Hydrology from Danube Delta study case, Scientific Annals of DDNI, Tulcea pp.285-289.
8. Bondar, C., 1994, Regarding the water transit and supply inside of Danube Delta. Scientific Annals of DDNI,
Tulcea, pp.259-261.
9. Clevering O. A., Brix H. and Lukavská J., 2001, Geographic variation in growth responses in Phragmites australis,
Aquatic Botany 69, 89–108;
10. Covaliov S., Hanganu J. and Doroftei M., 2010, Danube Delta Biosphere Reserve (DDBR): reed dynamics within
actual context, Advances in Environmental Sciences - International Journal of the Bioflux Society, Vol.2, Issue 1,
Cluj-Napoca;
11. Crossman N.D., Bryan B.A., and Cooke D.A., 2011, An invasive plant and climate change threat index for weed
risk management: Integrating habitat distribution pattern and dispersal process, Ecological Indicators 11 pp.183–
198;
12. Dangles O., Carpio C., Barragan A. R., Zeddam J.-L. and Silvain J.-F., 2008, Temperature as a key driver of
ecological sorting among invasive pest species in the tropical Andes, Ecological Applications 18:1795–1809;
13. Danube Delta National Institute for Research and Development, Marinov M. (coord.), 2011, Starea
biodiversității în Rezervația Biosferei Delta Dunării, raport intern;
14. Doniţă N., Popescu A., Păucă-Comănescu M., Mihăilescu S., and Biriş I. A., 2005, Habitatele din România, Editura
Tehnică Silvică, Bucureşti.442 pp.;
15. Doroftei M. and Covaliov, S., 2009, Check list of alien ligneous plants in Danube Delta, Scientific Annals of DDNI,
pp.19-24.
16. Doroftei M., Mierlă M. and Lupu G., 2011, Aproaches to habitat disturbances in the Danube Delta Biosphere
Reserve, Universitatea „Vasile Alecsandri” din Bacău, Studii și Cercetări, Seria Biologie – Vol.20, tom.1, pp.46-56;
17. Doroftei M. and Mierlă M., 2012, Danube Delta habitats versus climate change, BALWOIS 2012 Conference
Proceedings, Section Biodiversity and Climate change - Ohrid, Republic of Macedonia - 28 May, 2 June 2012;
18. Dragotă C.S., Grigorescu I., Dumitraşcu M., Doroftei M., Mierlă M. and Năstase M., 2011, Climatic potential and
key meteorological drivers for the dynamics of invasive terrestrial plant species in Romanian protected areas,
3rd
International Symposium on Weeds and Invasive Plants October 2-7, 2011 in Ascona, Switzerland;
19. Driga B.V., 2004, Danube Delta water circulation system, Science Book House, Cluj Napoca, 256 p.
20. Dukes J.S. and Mooney H.A., 1999, Does global change increase the success of biological invaders? Trends in
Ecology & Evolution 14, 135–139 ;
21. European Environmental Agency, 2004, Impacts of Europe's changing climate - an indicator based assessment.
EEA Report No 2/2004, EEA Technical Report no. 2/2004, European Environment Agency, Copenhagen;
22. European Environmental Agency, 2007, Footitt A., McKenzie Hedger A., Climate change and water adaptation
issues, EEA Technical report No 2/2007, European Environmental Agency, Copenhagen;
[133]
This project is implemented through the CENTRAL EUROPE Programme co-financed by the ERDF
23. European Environmental Agency, 2008, Feyen L. (JRC/IES), Kristensen, P. (EEA), Water quantity, river floods and
droughts in Impacts of Europe's changing climate — 2008 indicator-based assessment, Joint EEA-JRC-WHO report,
EEA Report No 4/2008, European Environmental Agency, Copenhagen, European Communities, 2008, 92-101;
24. European Environmental Agency, 2009, Collins, R, Kristensen, P, Thyssen, N, Water resources across Europe
- confronting water scarcity and drought, EEA Report No 2/2009, European Environmental Agency, Copenhagen;
25. European Environmental Agency, 2010, Kristensen, P., The European environment state and outlook 2010,
Water resources: quantity and flows, European Environmental Agency, Copenhagen;
26. Gafta D. and Mountford O. (coord.), 2008, Manual de interpretare a habitatelor Natura 2000 din România,
Elaborat si tiparit în cadrul proiectului PHARE: “Implementarea retelei NATURA 2000 în România” (publicatia UE
nr.: EuropeAid/121260/D/SV/RO Editor: Ministerul Mediului si Dezvoltarii Durabile
27. Gâștescu P. and Știucă R. (ed.), 2008, Delta Dunării - Rezervație a Biosferei, Centrul de Informare Tehnologică
Delta Dunării 460 pp.;
28. Gâştescu, P. and Driga, B., 1983, Lakes. in: Romanian Geography, vol. I, , Publisher Romanian Academy,
Bucharest, pp. 351-367
29. Glugla G. and König B., 1989, VERMO - Ein Modell für die Berechnung des Jahresganges der Evaporation,
Versickerung und Grundwasserneubildung. Tag.-Bericht, Akad. Landwirtsch.-Wiss. DDR, Berlin, 1989, 275, S.
85-91;
30. Gregory M.R., and James T.C., 2003, Invasive Species Vectors and Management Strategies Island Press, London,
ISBN 1-55963-902, pp.518;
31. Hanganu J., Dubyna D., Zhmud E., Grigoraş I., Menke U., Drost H., Ştefan N. and Sârbu I., 2002, Vegetation of
the Biosphere Reserve Danube Delta with Transboundary Vegetation Map, 1:161.000, Danube Delta National
Institute Romania, Institute of Botany and Denube Delta Biosphere Reserve Ukraine and RIZA The Netherlands;
32. Harold M., Richard N. M., Jeffrey A. M., Laurie E. N., Peter J. S. and Jeffrey K. W., 2005, Invasive Alien Species,
Island Press, London, ISBN 1-55963-362, pp.368;
33. Huxley A., 1992, The New RHS Dictionary of Gardening. MacMillan Press ISBN 0-333-47494-5
34. ICAS, 2004, Amenajament Ocolul Silvic Tulcea, Regia nationala a padurilor ROMSILVA, Institutul de Cercetari si
amenajari silvice, Bucuresti, 170 p.
35. Intergovernmental Panel on Climate Change (IPCC), 2001, Third Assessment Report on Climate Change.
International Panel on Climate Change. Cambridge University Press;
36. Intergovernmental Panel on Climate Change (IPCC), 2007, Climate Change 2007: The Physical Science
Basis - Summary for Policymakers.Contribution of Working Group I to the Fourth Assessment Report of the
Intergovernmental Panel on Climate Change. IPCC Secretariat;
37. Kasperson J.X., Kasperson R.E., Turner II B.L., Hsieh W. and Schiller A., 2002, Vulnerability to global
environmental change. In The Human Dimensions of Global Environmental Change, ed. Andreas Diekmann,
Thomas Dietz, Carlo C. Jaeger, and Eugene A. Rosa. Cambridge, MA : MIT Press;
38. Legea 69/din 26 noiembrie 1991 privind administrația publică locală Publicată in Monitorul Oficial 79 din 18
aprilie 1996 (M. Of. 79/1996), Parlamentul României.
39. Ligtvoet W. and Grimm M.P., 1992, Fish in clear water. Fish stock development and management in lake
Volerak/Zoom. – In Hooghart, J.C. & Posthumus, C.W.S. (eds.), How an estuary changed into a fresh water lake:
69 – 84. TNO Committee in Hydrological Research. Delft. Proceedings and information. No.46.
40. Munteanu I. and Curelariu Gh.,1996, Thematic map of the Danube Delta – Head Deposits 1:175000 scale, The
Netherlands, Lelystad;
[134]
41. Navodaru I., Staras M., Buijse A.D., and De Leew J.J., 2005, Changes in fish population in Danube delta lakes:
effects of hydrology and water quality change. Review of results and potential for rehabilitation. Ecohydrology &
Hydrobiology. 5(3): 245-256.
42. Bogdan O. and Niculescu E., 1999, Climatic Risks from Romania, Romanian Academy, Geography Institute, Sega
International Company, Bucharest, 280 p.
43. Oosterberg, W., Staras M., Bogdan L., Buijse A. D., Constantinescu A., Coops H., Hanganu J., Ibelings B.W.,
Menting G. A .M., Nãvodaru I. and Török L., 2000, Ecological gradients in the Danube Delta Lakes; present state
and man-induced changes. RIZA the Netherlands, Danube National Institute Romania and Danube Delta
Biosphere Reserve Authority Romania. RIZA rapport nr. 2000.015.
44. Posea, G., Bogdan O., Zăvoianu, Buza M., Bălteanu D. and Niculescu Ghe. (eds.), 2005, Romanian Geography,
vol. V, Romanian Plain, Danube, Dobrogea Plateau, Black Sea Romanian sea shore and continental platform.
Romanian Academy Publisher, Bucharest.
45. Richardson D.M., Pysek P., Rejmanek M., Barbour M.G., Panetta F.D. and West C.J., 2000, Naturalisation and
invasion of alien plants: concepts and definitions. Diversity and Distributions 6, 93–107;
46. Staraș M., 2001, Restoration programme in the Danube Delta: achievements, benefits and constraints. In:
Proceedings of the Conference on River Restoration, Ed.H.J. Nijland, Wageningen, The Netherlands, 95-101;
47. Staraş, M., Cernişencu I. and Năvodaru, I., 1993, New data regarding the presence of silver carp (H.molitrix) in
the Danube and Danube Delta, Scientific Annals of DDNI, Tulcea pp.255-258.
48. UNFCCC, 2007, United Nations Framework Convention on Climate Change Published by UNEP/WMO Information
Unit on Climate Change;
49. van der Linden P. and Mitchell J.F.B. (eds.), 2009, ENSEMBLES: Climate Change and its Impacts: Summary of
research and results from the ENSEMBLES project. Met Office Hadley Centre, FitzRoy Road, Exeter EX1 3PB, UK.
160 pp.;
50. Vervuren P.J.A., Blom C.W.P.M. and de Kroon H., 2003, Extreme flooding events on the Rhine and the survival
and distribution of riparian plant species. Journal of Ecology 91, pp. 135–146
51. Watson, R.T., Zinyoera, M.C., and Moss, R.H., 1996, Climate Change 1995: Impacts, Adaptations and Mitigation
of Climate Change: Scientific-Technical Analysis. Contribution of Working Group II to the Second Assessment
Report of the Intergovernmental Panel on Climate Change. Cambridge: Cambridge University Press;
52. Watson, R.T., Zinyoera, M.C., and Moss, R.H., 1998, The Regional Impacts of Climate Change: An Assessment of
Vulnerability. A Special Report of IPCC Working Group II. Cambridge: Cambridge University Press;
53. Wendling U. and Schellin H.G., 1986, Neue Ergebnisse zur Berechnung der potentiellen Evapotranspiration. Z. für
Meteorologie 36 (1986) 3, S. 214-217;
54. Westbrooks R.G., 2001, Potential impacts of global climate changes on the establishment and spread on invasive
species. Transactions of the North American Wildlife and Natural Resources Conference 66, 344–370;
55. Williamson M.H. and Fitter A., 1996, The characters of successful invaders. Biological Conservation, 78, 163–170;