h388 presentations 11/28/06 1.catie broussard 2.kris van voorhis 3.jessica bruno 4.elizabeth...
Post on 22-Dec-2015
212 views
TRANSCRIPT

H388 Presentations 11/28/06
1. Catie Broussard
2. Kris Van Voorhis
3. Jessica Bruno
4. Elizabeth Schlossberg
5. Amanda Graham
6. Melissa Teixeira
7. Brian Kelly
8. Yuehong Lei (no slides)
9. Michael Franklin
10.Manisha Thapa11.Susan Krissel (absent
with illness)
12.Ashlyn Murphy
REFUGEES
Catie Broussard, 28 November 2006
Dependent, Un-Free, Homeless, Unequal

What is a Refugee?• International Law and Normative Practice dictates that a refugee is a person
who “owing to a well-founded fear of being persecuted for reasons of race, religion, nationality, membership in a particular social group, or political opinion, is outside of the country of his nationality, and is unable to, or, owing to such fear, is unwilling to avail himself of the protection of that county. “ ( UN Conventoin,1951)
• By concentrating on the large refugee populations in Africa—those refugees that have being displaced within their home region and are hosted by a neighboring state—we can target the greatest unequal and dependent populations to determine how their living.
• Policy Questions for Hosts and International Community: Integration vs. Segregation and Repatriation vs. Assimilation
– Decisions based on the situations of Refugee creation– Host –or contracting – country’s government acceptance of the international treaties
and norms vs. indigenous “acceptance” of new and inherently needy populations

Source : UN Statistics Report 2005: Global Refugee Trends

Refugee Status is by nature UNEQUAL to nationals of host
countries.
• Uprooted to another country
• Persecuted• Homeless• Dependent on Host
and International Community

Obtained from ReliefWeb
Refugees in Africa

DEPENDENCE OF REFUGEES

QUESTIONS GET COMPLICATED…
Who is the “Refugee”?
Do only the poor become refugees?
How does the extreme poverty of refugee populations compare to the state of indigenous populations?
How can we understand and combat the problems of these dependent, homeless, unequal, “un-free” populations, that
is only further complicated by the difficulty of obtaining statistics and measures of their plight?

Understanding The Affordable Housing Crisis
Kris Van VoorhisHistory 388
Hunger, Poverty and Market EconomyProfessor Ludden
November 28, 2006

The Problem
• The American Planning Association has dubbed the affordable housing crisis as a “silent killer,” likening it to high blood pressure – acute, growing, deadly, and yet largely unknown for most Americans
• According to the U.S. Department of Housing and Urban Development, more than 11 million households fall within HUD’s "worst-case" category, forced to pay more than one-half their incomes for housing, endure overcrowded conditions and/or live in structures with severe physical deficiencies.
• More than 3.5 million Americans are considered homeless, 1.35 million of them being children

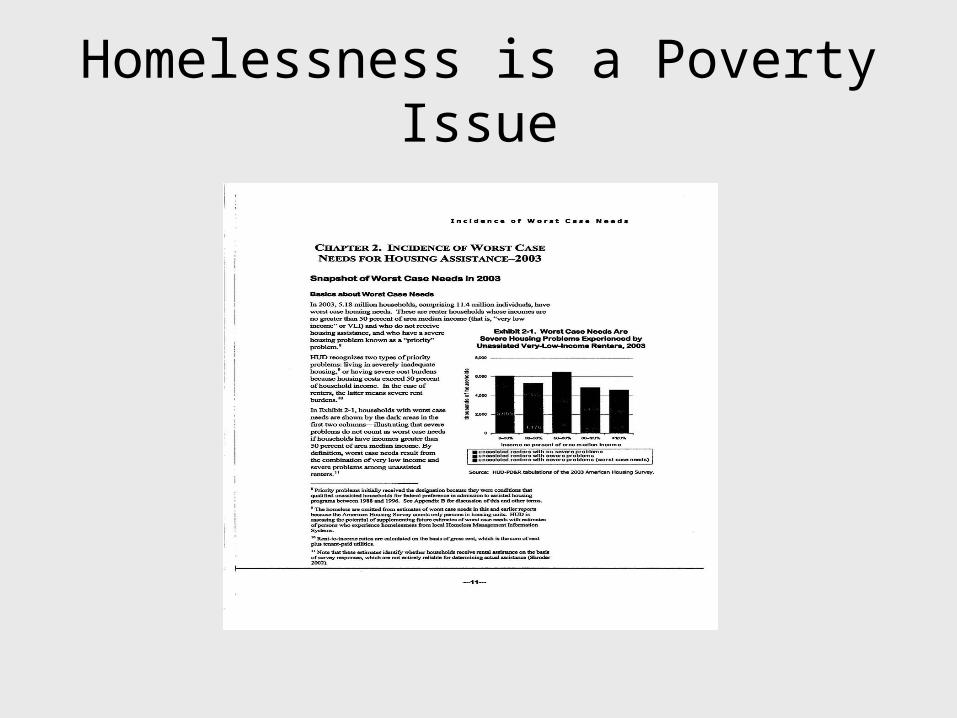
Homelessness is a Poverty Issue


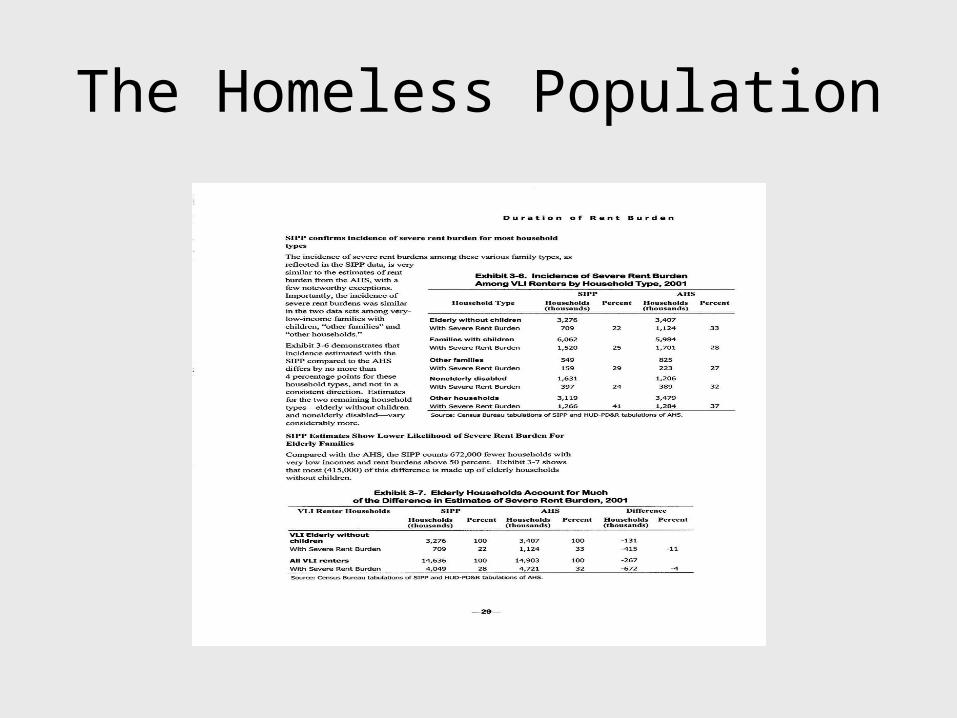
The Homeless Population

Demographic Factors:
Race
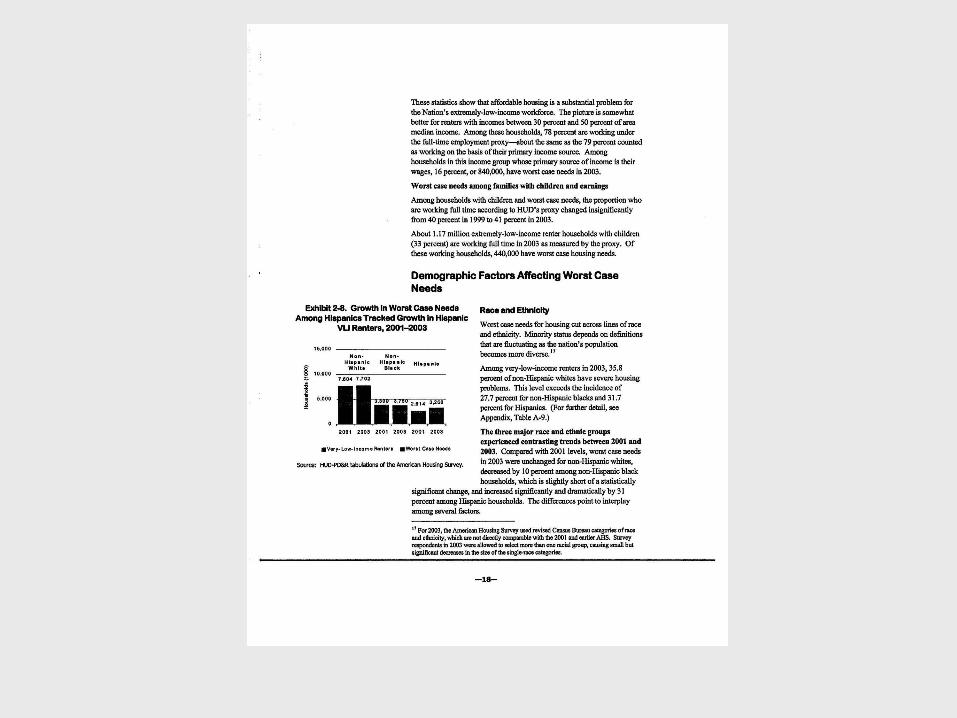
Demographic Factors:
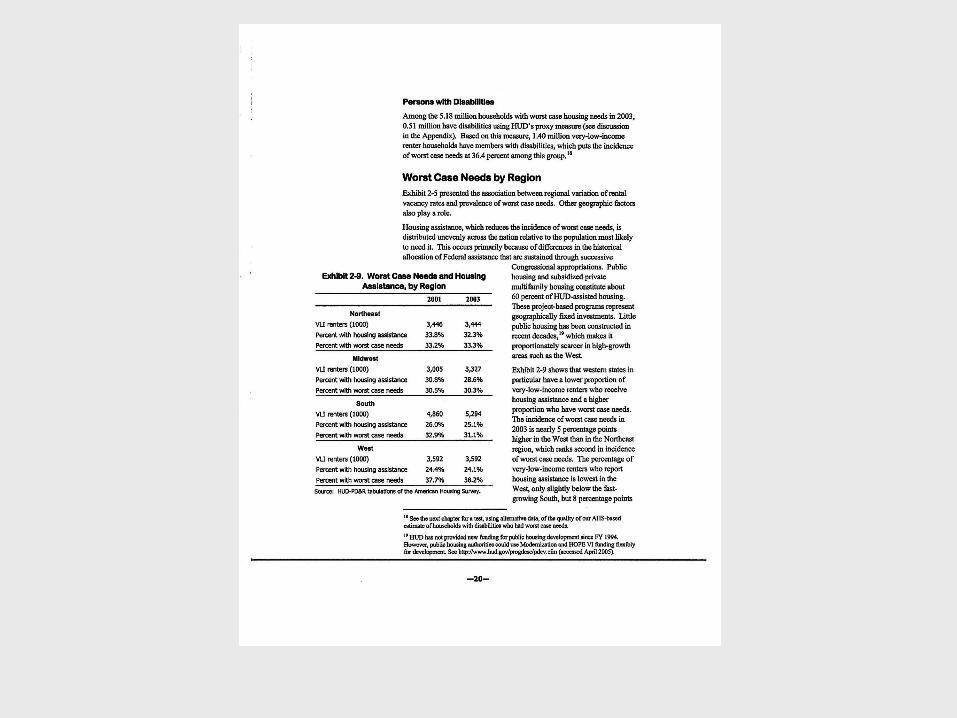
Geography


An Underlying Cause:
The Lack of Affordable Housing


An Underlying Cause:
The Lack of Government Spending


An Underlying Cause:
The Lack of
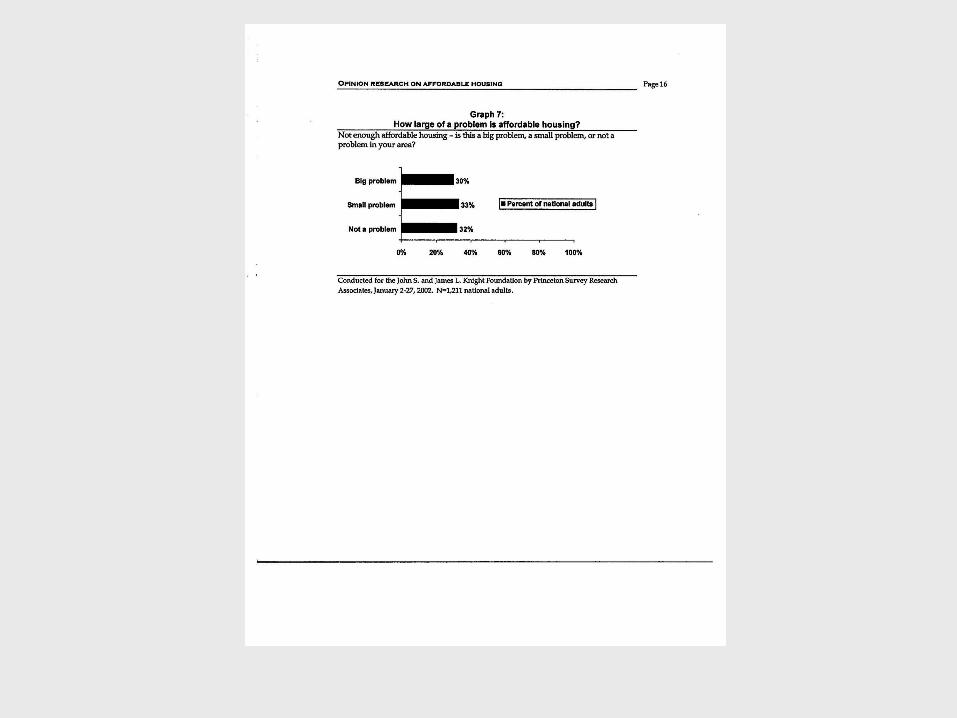
Public Awareness and Support


Assessment and Analysis of Nutritional Status in Bangladesh
Jessica Bruno
History 388
November 28th, 2006

Findings
• Comparisons of food intake vs. education level, location (urban/rural), gender, occupation, NGO (benefited/non-benefited)
• Improvements in intake with primary education completed, urban location, female gender, and cultivators

Example
Education v Total Daily Food Intake per capita
660680700720740760780800820
Illiterate Can Readand Write
Primary Class VI- X S.S.C- H.S.C Graduate
Educational Status
Dai
ly F
ood
Inta
ke p
er
capi
ta (g
m)
The Double Burden of Malnutrition
Exploring the link between obesity and poverty and why the
correlation exists…
Elizabeth Schlossberg

The Evidence
• NHANES Survey 1971-2004 revealed a 50% increased chance of becoming overweight in poor versus non poor families (Miech et al 2006)
• “The prevalence of obesity is significantly higher in poor communities than in affluent communities” (Journal of Youth and Adolescence)– Variables include age and race

Why the Link?
• Focus: Availability of healthy food
• Healthcare
• Adequate education about nutrition and a healthy lifestyle
• A safe environment for physical activity

Case Study: Washington DC
“Residents in Wards 7 & 8 where poverty is high and grocery stores are scarce are more likely to suffer from diet-related diseases than residents of the District’s other wards (Hunger Solutions).
Obesity prevalence in Wards 7 & 8 is about four times higher than in Wards 2 and 3, which have the most grocery stores and many of the highest community food security rankings in the District.” (Hunger Solutions)
QuickTime™ and aTIFF (LZW) decompressor
are needed to see this picture.
Focus on the Availability of Fresh Food

Grocery Stores and Poverty
The darker colors represent higher rates of poverty
The dots represent grocery stores that sell fresh food

Availability and Race
• Ratio of grocery stores to residents revealed a ratio of 1:3,816 in chiefly white neighborhoods as opposed to 1:23,582 in chiefly African American neighborhoods (Journal for Preventative Medicine 2002)
Why?
• Similar problems occur in Philadelphia, Chicago and New York, but why?
• The RISK is greater than the REWARD– Cost is too great to maintain security and to train
reliable employees in lower income areas– Smaller profit margin due to sales of cheaper goods

First Obesity, Then Diabetes
• Upper East Side grocery stores were three times as likely to stock diet soda, low-fat or fat-free milk, high fiber bread, fresh fruit and fresh vegetables
• “Those living in East Harlem die of diabetes at twice the rate of people in the city as a whole” (New York Times 2006)
• Sub par health care available in East Harlem leaves residents unable to afford medication for diabetes
The Upper East Side vs. East Harlem

No Such Thing as an Easy Solution
• While the availability of fresh, healthy food in lower income areas is one contributing factor to the problem, other factors include education, healthcare and a safe environment. Until all of these factors, along with government support come together, the problem can not be fixed.

Dynamics of Poverty Among the Indigenous Population of Bolivia
Amanda Graham
November 28, 2006


Introduction
• 72% of population below poverty line• Same proportion of those people are
indigenous• 60% of population indigenous• Social ladder “whitens in accordance with
class privilege”• Why? Social Exclusion-denied access to
resources

What defines indigenous?
• 36 Indian tribes recognized by government
• 2 Main Groups– Aymara (20-25%)– Quechua (35-40%)
Historical Factors
• Spanish Conquistadors– Exploitation and Slavery
• Liberalism (19th Century)– Biological Category of Slaves– Poverty dates from here– Serfdom until 1950s
• Can’t escape– Continue to live in rural highlands

Geo-Economic Factors
• Rural/Western Provinces– Home to Indigenous population
• Eastern Provinces– Local white/foreign business control– Control of natural gas resources/GDP

Mobility Factors
• Geographic landscape creates obstacles for adequate construction
• Lack of adequate roads that link Eastern and Western provinces

Discrimination Factors
• White Persona v. Indigenous Persona
• Deprivation of basic human rights by Government
• Low Paying Jobs

Educational Factors
• Low investment in education
• Indians don’t realize situation
• Dropout rate• Attendance disparity
between rich and poor
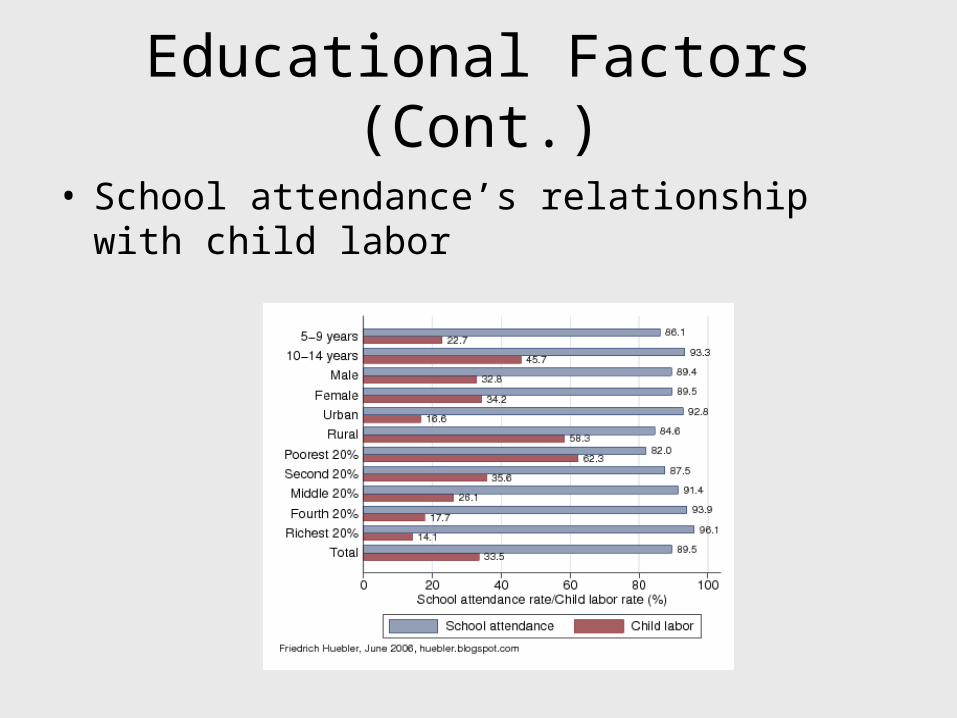
Educational Factors (Cont.)
• School attendance’s relationship with child labor
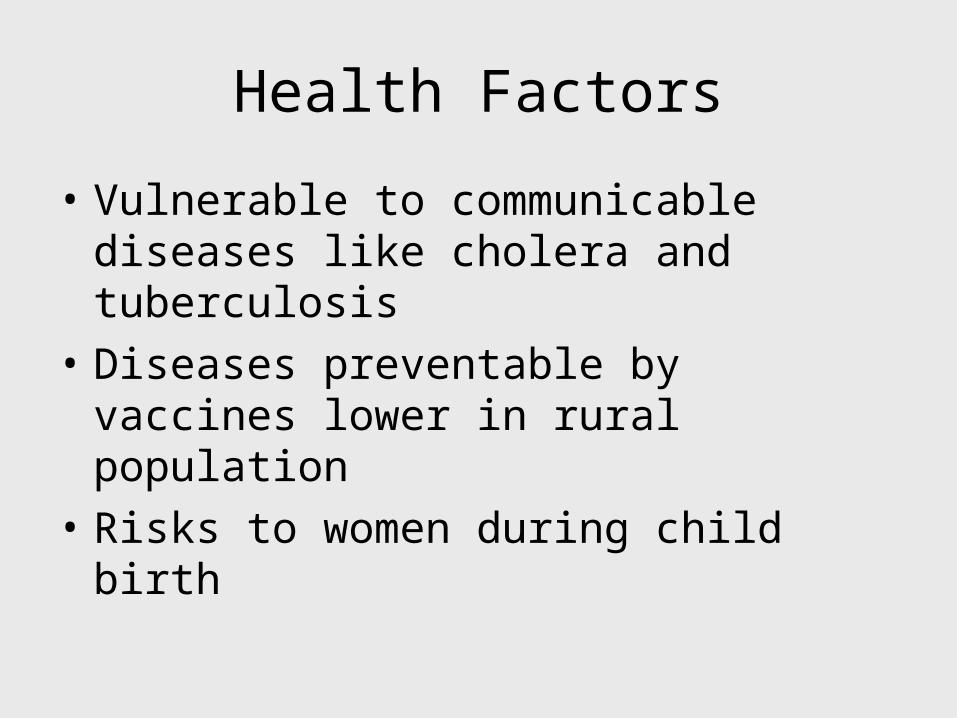
Health Factors
• Vulnerable to communicable diseases like cholera and tuberculosis
• Diseases preventable by vaccines lower in rural population
• Risks to women during child birth

Improvements
• Increase in education
• Political activism
• New government leadership
• Government recognition of demands of indigenous population
• Improvement slow-needs continued activism

I n e q u a l i t y in B r a z i l
Melissa Teixeira
North
1. Roraima
2. Amapá
3. Amazonas
4. Pará 5. Tocan
tins 6. Acre 7. Rondô
nia
Northeast 8. Maranhão 9. Piauí 10. Ceará 11. Rio Grande do
Norte 12. Paraíba 13. Pernambuco 14. Alagoas 15. Sergipe 16. Bahia
Centre-West
17. Mato Grosso 18. Goiás 19. Distrito Federal (
Brasília) 20. Mato Grosso do Sul
Southeast
21. Minas Gerais 22. Espírito Santo 23. Rio de Janeiro 24. São Paulo
South 25. Paraná 26. Santa
Catarina 27. Rio
Grande do Sul
National Statistics:
•Population: 188,078,227
•Infant Mortality: 28.6 deaths/1000 live
births
•Life expectancy at birth: 71.97 years
•Literacy rate: 86.4%
•GDP per capita (PPP): $8,300
•Percentage below the Poverty Line: 22%
•Gini Index: 0.59

I n e q u a l i t yI n e q u a l i t y
The top ten percent of theBrazilian population control
fifty percent of salaried income andthe bottom fifty percent account
fora mere twelve percent of income.
Average Monthly Salary by Region in Brazil 1995-2004 (Real$)
0
200
400
600
800
1000
1200
1995 1996 1997 1998 1999 2000 2001 2002 2003 2004 2005
Year
Ave
rag
e M
on
thly
Sal
ary
(Rea
l$)
Northern Brazil
Northeastern Brazil
Southern Brazil
Southeastern Brazil
Central-Western Brazil
Brazilian Average
“Inequalities in power and wealth translate into unequal
opportunities, leading to wasted productive potential and to an
inefficient allocation of resources”
[World Bank 2006]
Gini Index by Region in Brazil 1995-2004
0.5
0.525
0.55
0.575
0.6
0.625
1994 1995 1996 1997 1998 1999 2000 2001 2002 2003 2004 2005
Year
Gin
i In
dex
Northern Brazil
NortheasternBrazilSouthern Brazil
SoutheasternBrazilCentral-WesternBrazilBrazilianAverage

E d u c a t i o n
Average Years of Education by Region in Brazil, 2004
0.0
1.0
2.0
3.0
4.0
5.0
6.0
7.0
8.0
1
Region
Aver
age Y
ears
North Northeast Southeast South Central-West Brazil
Level of Education for Students of Five Years or Older, by Region in 2005
Level (and type) of Education (%)
Region
Brazil Northeastern Region
Southeastern Region
Average Years 6.6 5.3 7.3
Pre School 9.42 10.19 9.98
Private School 24.29 25.49 23.80
Public School 75.68 74.51 76.15
Primary Education
61.63 66.04 57.40
Private School 11.02 10.27 13.30
Public School 88.98 89.73 86.67
Secondary Education
17.75 15.32 19.88
Private School 15.00 13.55 16.83
Public School 84.98 86.45 83.12
Higher Education 8.86 5.14 10.90
Private School 73.92 58.49 81.40
Public School 26.08 41.51 18.60

E d u c a t i o n
Percentage of Population more Educated than their Father and Level of Education Attained,
by Region
0
10
20
30
40
50
60
70
80
90
100
Uneducated Primary EducationUncompleted
Primary EducationCompleted
SecondaryEducationCompleted
Higher EducationCompleted
Level of Education
Per
centa
ge (%
)
Southeast Brazil [% moreeducated than father]Northeast Brazil [% moreeducated than father]Southeast Brazil [levelattained]Northeast Brazil [levelattained]
Literacy Rate, by Literacy of Father and Region
20.58
61
33.73
70.91
71.31
25.55
56.82
17.7
8.2913.47
9.44 11.83
0%
20%
40%
60%
80%
100%
Literate in Southeast Illiterate in Southeast Literate in Northeast Illiterate in Northeast
Literacy and Region
Per
centa
ge (%
)
Literacy of Father UnknownLiterate FatherIlliterate Father
Literacy Rates for Brazil by Region
38.20%
61.78%
11.32%
88.67%
0.00
10.00
20.00
30.00
40.00
50.00
60.00
70.00
80.00
90.00
100.00
Literate in Southeast Illiterate in Southeast Literate in Northeast Illiterate in Northeast
Literacy and Region
Lite
racy
Rat
e (%
)
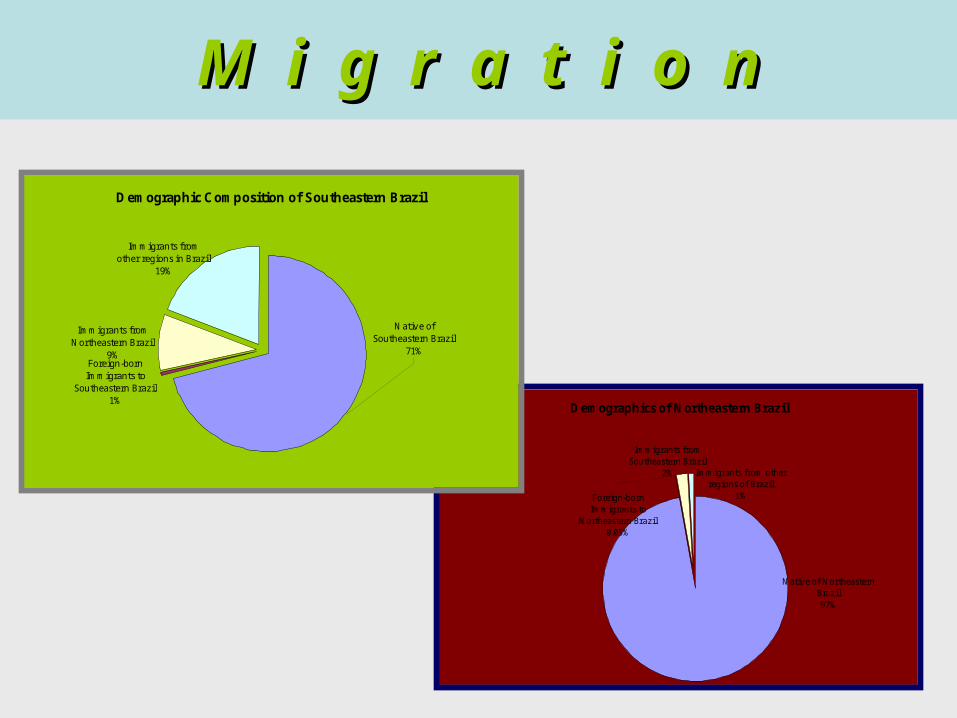
M i g r a t i o nM i g r a t i o n
Demographics of Northeastern Brazil
Native of Northeastern Brazil97%
Foreign-born Immigrants to
Northeastern Brazil0.05%
Immigrants from Southeastern Brazil
2% Immigrants from other regions of Brazil
1%
Demographic Composition of Southeastern Brazil
Native of Southeastern Brazil
71%Foreign-born Immigrants to
Southeastern Brazil1%
Immigrants from Northeastern Brazil
9%
Immigrants from other regions in Brazil
19%

S o c i a l M o b i l i t y
Percentage of Employed Persons Over the Age of 15 Still Employed in the Industry in which They First Started: Comparison Between Sao Paulo and La Bahia
0%
10%
20%
30%
40%
50%
60%
70%
80%
90%
100%
1 2 3 4 5 6 7
Industry
Perc
enta
ge W
orki
ng in
Sam
e Ind
ustry
(%)
Sao Paulo
La Bahia
Industry:1. Technicial/Scientific2. Adminis trative3. Agricultural4. Industrial/ Construction5. Commerce/Business6. Transportation/ Communication7. Service
Employment in Northeast by Sector
Agriculture40%
Industrial Production9%Construction
8%
Commercial Services13%
Services12%
Economic Services2%
Transportation and Communication
5%
Social Services5%
Public Administration5%
Other1%
Employment in Southeast by Sector
Agriculture14%
Industrial Production20%
Construction10%
Commercial Services13%
Services18%
Economic Services4%
Transportation and Communication
7%
Social Services7%
Public Administration5%
Other2%

Poverty, Inequality, and Nigeria’s Oil Economy
Questions:
1
1) Is oil wealth distributed unevenly in Nigeria?
2) What agricultural, environmental, economic, and social effects has oil extraction had on the local communities of the Niger Delta?
Brian KellyBrian Kelly

Contribution of Agriculture and Oil to Nigeria’s GDP
Brian Kelly – Nigeria and Oil, 2
0
10
20
30
40
50
60
70
80
90
100
1965
-196
6
1966
-196
7
1967
-196
8
1968
-196
9
1969
-197
0
1970
-197
1
1971
-197
2
1972
-197
3
1973
-197
4
1974
-197
5
1975
-197
6
1976
-197
7
1977
-197
8
1978
-197
9
1979
-198
0
1980
-198
1
1981
-198
2
1982
-198
3
Year
Per
cen
t
Agriculture
Mining (including Crude Oil)
Source: Onyige, P.U. Energy and Social Development in Nigeria

Nigeria’s Principal Agricultural Export Commodities
0
100,000
200,000
300,000
400,000
500,000
600,000
700,000
800,000
900,000
1974-1975
1975-1976
1976-1977
1977-1978
1978-1979
1979-1980
1980-1981
1981-1982
1982-1983
1983-1984
Year
Exp
ort
s (i
n t
on
s)
Rubber
Palm oil
Palm kernel
Groundnuts
Cotton
Cocoa
Brian Kelly – Nigeria and Oil, 3
Source: Onyige, P.U. Energy and Social Development in Nigeria
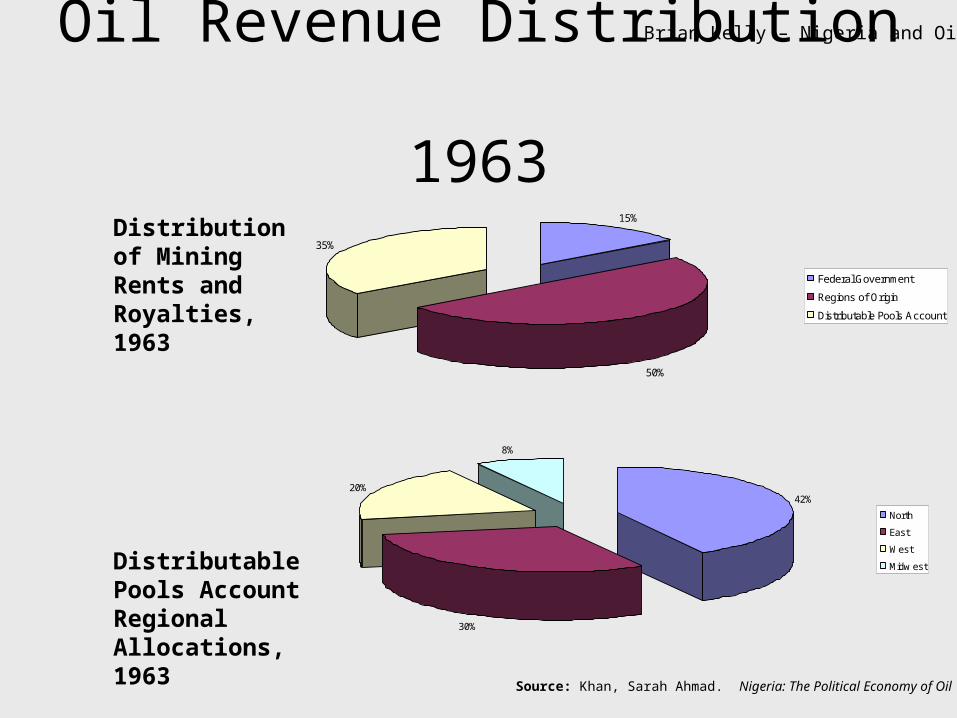
Distribution of Mining Rents and Royalties, 1963
Distributable Pools Account Regional Allocations, 1963
Oil Revenue Distribution 1963
15%
50%
35%
Federal Government
Regions of Origin
Distributable Pools Account
42%
30%
20%
8%
North
East
West
Midw est
Brian Kelly – Nigeria and Oil, 4
Source: Khan, Sarah Ahmad. Nigeria: The Political Economy of Oil

Distribution of Mining Rents and Royalties, 1979
Breakdown of Allocation to State Governments, 1979
Oil Revenue Distribution1979
55%35%
10%
Federal Government
State Government
Local Government
86%
6%4% 4%
Directly to States
Derivation
Development of Mineral Producing Areas
Ecological Problems
Brian Kelly – Nigeria and Oil, 5
Source: Khan, Sarah Ahmad. Nigeria: The Political Economy of Oil

Poverty in Nigeria
Nigerian GNP per Capita Trends
0
200
400
600
800
1000
1200
1978 1980 1982 1984 1986 1988 1990 1992
Year
GN
P pe
r Cap
ita (U
SD)
Nigerian GNP per Capita has steadily fallen since 1980.
The percentage of Nigeria’s rural population living below the poverty line has risen since 1980.
28.29%
51.43%
46%
71.73%
0.00%
10.00%
20.00%
30.00%
40.00%
50.00%
60.00%
70.00%
80.00%
1980 1985 1992 1996
Year
Percentage of Rural Population Below the Poverty Line
Brian Kelly – Nigeria and Oil, 6
Source: Anyanwu, John C. Rural Poverty in Nigeria: Profile, Determinants and Exit Paths Source: Khan, Sarah Ahmad. Nigeria: The Political Economy of Oil

Yuehong Lei
AIDS and TB in South Africa
No slides

Maternal Education and the Relationship to Children’s Health
Michael Franklin
HIST 388

Topic• Establishing a link between a mother’s
education and the health of her children– Difficult, many variables deal with children’s
health• Community and maternal endowments
– Has research “overstated” the benefits of improved maternal education?

Personal Findings
• Data comes from the UN Stats website (http://hdl.library.upenn.edu/1017/7058)
• Took 42 countries and compared:– GDP per capita in current US$ (1981-2000)– Children under 5 mortality rate per 1,000 live
births (1980-2000)– Literacy rates in women 15-24 (1981-2004)
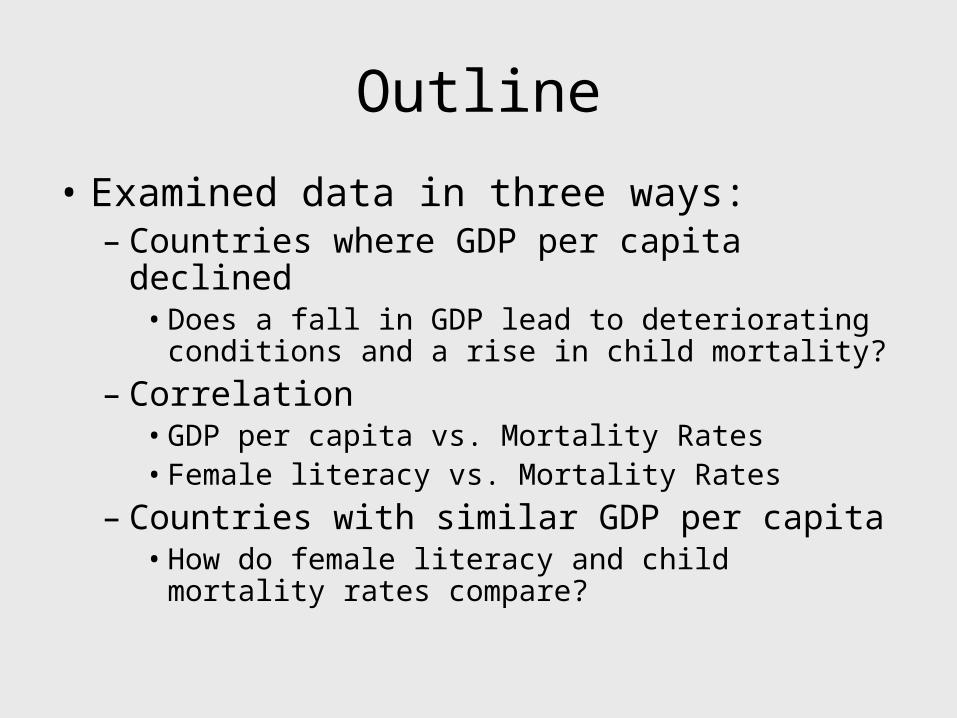
Outline
• Examined data in three ways:– Countries where GDP per capita declined
• Does a fall in GDP lead to deteriorating conditions and a rise in child mortality?
– Correlation• GDP per capita vs. Mortality Rates• Female literacy vs. Mortality Rates
– Countries with similar GDP per capita• How do female literacy and child mortality rates
compare?

Decline in GDP Per Capita
• 17 countries experienced a fall in their GDP per capita– Decrease in GDP per capita indicates living standards
did not improve, and potentially worsened
• Despite drop in GDP per capita, child mortality rates decreased everywhere, except Zimbabwe (increased) and Liberia (did not change)
• Literacy rates among women improved in each country

GDP Per Capita and Female Literacy
• GDP per capita vs. Mortality rates– R² = 0.3822
• Female literacy v. Mortality rates– R² = 0.749
• Stronger association between female literacy and child mortality than GDP per capita

GDP Per Capita vs. Mortality Rates for Children Under 5
R2 = 0.3822
0
5000
10000
15000
20000
25000
30000
35000
40000
Country
GD
P/P
er C
apit
a (i
n c
urr
ent
US
$ fo
r 19
81)
0
50
100
150
200
250
300
350
Un
der
5 C
hild
Mo
rtal
ity
per
1,0
00 L
ive
Bir
ths
(198
0)
GDP/Per Capita
Child Mortality
Linear (Child Mortality )

Female Literacy Rate vs Mortality Rates for Children Under 5
R2 = 0.749
0
20
40
60
80
100
120
Country
Fem
ale
Lit
erac
y R
ate
ages
15-
24 (
1981
)
0
50
100
150
200
250
300
350
Ch
ild M
ort
alit
y p
er 1
,000
Liv
e B
irth
s 19
80
Lit Rate
Child Mortality
Linear (Child Mortality )
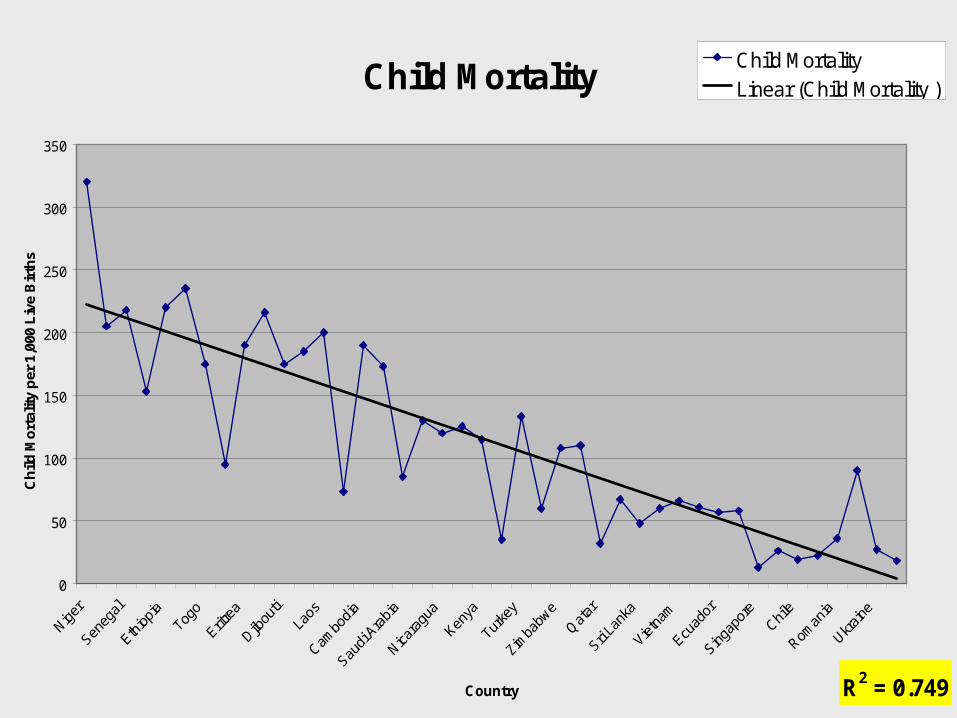
Child Mortality
R2 = 0.749
0
50
100
150
200
250
300
350
Country
Ch
ild M
ort
alit
y p
er 1
,000
Liv
e B
irth
s
Child Mortality Linear (Child Mortality )

GDP Per Capita
Country GDP Female Lit (%) Child Mortality
Cameroon 1,011 (5) 57.4 (4) 173 (4)
Nigeria 1,167 (4) 45.3 (5) 216 (5)
Ecuador 1,207 (3) 93.7 (2) 57 (2)
Costa Rica 1,381 (2) 96.7 (1) 26 (1)
Turkey 1,487 (1) 79.8 (3) 133 (3)

GDP Per Capita
Country GDP Female Lit (%) Child Mortality
Pakistan 443 21.5 153
Yemen 444 11.0 205
• Vietnam has the lowest GDP per capita in 1980 yet one of the lowest rates of child mortality and highest of female literacy

Conclusion
• Education = Good
• Importance of maternal education– Present inequality between men and women– Improving a mother’s level education has
been found to yield greater results than improving her husband’s level of education

Manisha Thapa
Female Education and Child Health in Nepal

Variables in Women’s education versus Child health relationship
• Urban-Rural differences
- access to health facilities
-access to clean drinking water
-transportation
Under 5 Child Mortality Rate Ratios (Rural : Urban and Uneducated : Educated Mothers)
0
0.5
1
1.5
2
2.5
3
3.5
4
4.5
5
bang
lades
h
botsw
ana
buru
ndi
c.a.r.
com
oros
equa
dor
eritr
ea
ghan
aHait
i
Countries
Ra
tio
rural to urban
Uneducated toEducatedMothers

Variables in Women’s education versus Child health relationship
• Wealth as a variable
-similar relation with child health as mother’s education
-stronger relation than rural-urban
Under 5 Child Mortality Rates ratios for wealth (lowest to highest quintile) and education (uneducated to
educated mothers)
00.5
11.5
22.5
33.5
44.5
5
countries
ratio
s
wealth(lowestquintile tohighest)
uneducatedto educatedmothers

Case for Nepal
WHO data for 2001
• Under-5 mortality rate (per 1 000 live births) - rural to urban ratio) - 1.7
• Under-5 mortality rate (per 1 000 live births) - lowest to highest wealth quintile ratio)- 1.9
• Under-5 mortality rate (per 1 000 live births) - mother with no to higher education ratio -2.4
Why does the relationship between women’s education and child health still hold for Nepal?
• Gradual Urbanization
• Increased per capita GDP undermined by inflation
• Government spending in education relatively higher than in health sector

Programs to improve maternal and child nutritional status
Susan Krissel
(absent due to illness)

Examples of Interventions
• UNICEF– Fortification of food (ex. Iodization of salt)– Supplemental micronutrient formula with RDIs
for pregnant/lactating women– Education for the empowerment of women– Baby-Friendly Hospital Initiative– International Code of Marketing of Breast Milk
Substitutes

• Earthwatch– Educate women about nutrition and hygiene as
related to disease prevention– Involve and train community members/leaders– Make community self-sufficient
• Canada Prenatal Nutrition Program– Supplementation– Community gardens– Gift certificates to buy healthy food– Cooking demonstrations and shopping tours– Nutrition and Health Awareness Education– Budgeting workshops– Breastfeeding incentives

Conclusions
• Various types of organizations are taking action to improve maternal/child nutrition
• These organizations are mainly focused on improving malnutrition through nutrients, rather than targeting its causes

Poverty & Female Mental Health
Ashlyn Murphy
Final Project
Hist 388

Issue of Causation
• Is there a causal relationship between poverty and mental illness?
• Which came first: the poverty or the mental illness?

Selection Hypothesis
• Emotional problems that are preexisting predispose a woman to poverty.
• Mental illness/emotional problems precede poverty.
Social Causation Hypothesis
• Stresses of poverty and the environment of poverty lead to mental illnesses.
• Poverty precedes mental illness.

Previous Findings & Links
• The following circumstances have been pre-established as common among clinically depressed women:
1. Recent entry in welfare program.2. Dependent upon welfare.3. “Inadequately” employed: marked by
unfavorable hours and/or wages.4. Nonunion employment position.

5. Residing in low-income neighborhoods.6. Residing in neighborhoods marked by drug trade. 7. Having no health benefits. 8. Spending large amount of income on child care.
9.