h2o activity in concentrated nacl solutions at high pressures and temperatures measured by the
TRANSCRIPT
Contrib Mineral Petrol (1996) 125: 200–212 C Springer-Verlag 1996
L.Ya. Aranovich ? R.C. Newton
H2O activity in concentrated NaCl solutions at high pressuresand temperatures measured by the brucite-periclase equilibrium
Received: 1 September 1995y Accepted: 24 March 1996
Abstract H2O activities in concentrated NaCl solutionswere measured in the ranges 6008–9008 C and 2–15 kbarand at NaCl concentrations up to halite saturation bydepression of the brucite (Mg(OH)2) – periclase (MgO)dehydration equilibrium. Experiments were made in in-ternally heated Ar pressure apparatus at 2 and 4.2 kbarand in 1.91-cm-diameter piston-cylinder apparatus withNaCl pressure medium at 4.2, 7, 10 and 15 kbar. Fluidcompositions in equilibrium with brucite and periclasewere reversed to closures of less than 2 mol% by measur-ing weight changes after drying of punctured Pt cap-sules. Brucite-periclase equilibrium in the binary systemwas redetermined using coarsely crystalline syntheticbrucite and periclase to inhibit back-reaction in quench-ing. These data lead to a linear expression for the stan-dard Gibbs free energy of the brucite dehydration reac-tion in the experimental temperature range:DG8(+120J)573418–134.95T(K). Using this function as abaseline, the experimental dehydration points in the sys-tem MgO2H2O2NaCl lead to a simple systematic rela-tionship of high-temperature H2O activity in NaCl solu-tion. At low pressure and low fluid densities near 2 kbarthe H2O activity is closely approximated by its mole frac-tion. At pressures of 10 kbar and greater, with fluid den-sities approaching those of condensed H2O, the H2O ac-tivity becomes nearly equal to the square of its molefraction. Isobaric halite saturation points terminating theunivariant brucite-periclase curves were determined ateach experimental pressure. The five temperature-com-position points in the system NaCl2H2O are in closeagreement with the halite saturation curves (liquiduscurves) given by existing data from differential thermalanalysis to 6 kbar. Solubility of MgO in the vapor phasenear halite saturation is much less than one mole percentand could not have influenced our determinations. Activ-
ity concentration relations in the experimentalP-T rangemay be retrieved for the binary system H2O-NaCl fromour brucite-periclase data and from halite liquidus datawith minor extrapolation. At two kbar, solutions closelyapproach an ideal gas mixture, whereas at 10 kbar andabove the solutions closely approximate an ideal fusedsalt mixture, where the activities of H2O and NaCl corre-spond to an ideal activity formulation. This profoundpressure-induced change of state may be characterizedby the activity (a) – concentration (X) expression:aH2O5XH2Oy(11aXNaCl), and aNaCl5(11a)(11a)[XNaCly(11aXNaCl)]
(11a). The parameterais determined by re-gression of the brucite-periclase H2O activity data:a5exp[A–ByqH2O ]-CPyT, where A54.226, B52.9605,C5164.984, andP is in kbar,T is in Kelvins, andqH2O isthe density of H2O at givenP and T in gycm3. Theseformulas reproduce both the H2O activity dataand theNaCl activity data with a standard deviation of+0.010.The thermodynamic behavior of concentrated NaCl solu-tions at high temperature and pressure is thus much sim-pler than portrayed by extended Debye-Hückel theory.The low H2O activity at high pressures in concentratedsupercritical NaCl solutions (or hydrosaline melts) indi-cates that such solutions should be feasible as chemicallyactive fluids capable of coexisting with solid rocks andsilicate liquids (and a CO2-rich vapor) in many processesof deep crustal and upper mantle metamorphism andmetasomatism.
Introduction
Petrologic importance of concentrated brines
Supercritical aqueous salt solutions may equally well beregarded as concentrated brines or hydrous salt melts.Economic geologists have long invoked theaction of con-centrated salt solutions of igneous origin in the genesis ofthe porphyry ores of Cu, W, Mo and Sn (Graton 1940;Roedder 1971). Since F.G. Smith’s (1948) experimentaldemonstration that highly concentrated chloride-sulfate-
L.Ya. Aranovich? R.C. Newton (✉)Department of the Geophysical Sciences,The University of Chicago, Chicago, IL 60637, USA
Editorial responsibility: I.S.E. Carmichael
201
borate solutions can coexist with H2O-saturated graniticmelts at elevated pressures, many petrologists havecon-cluded that such salt magmas can be expelled as immis-cible fluids, perhaps along with a third fluid phase, aCO2-rich gas, in the late stage of crystallization ofgranitic plutons. Such complex supercritical brines maybe potent agents in the formation of metallic ore deposits(e.g. Marakushev and Shapovalov 1994).
More recently, an important role of concentrated saltsolutions has been suggested in a number of diversepetrologic connections, mainly from study of fluid andmelt inclusions in minerals of igneous and metamorphicrocks. Lowenstern (1994) found immiscible salt-H2Oglobules in glass inclusions in quartz phenocrysts fromlavas of Pantelleria Island. The globules, which hetermed quenched hydrosaline melts, were inferred tocontain 60%–80% by weight NaCl equivalent salt con-tent. These compositions correspond to hydrous saltmagma or concentrated solutions of about 50 mol %H2O. The coexisting peralkaline rhyolite glass had up toone weight percent of Cl. The peralkaline character ofthe pantellerites may be attributed in large part to a saltcomponent in the granitic liquid which may be incom-pletely exsolved as a separate fluid phase during out-gassing at low pressure.
Pasteris et al. (1995) deduced the action of concen-trated NaCl2CaCl2 brines from wall-rock alteration andfluid inclusions in the contact zone of the Duluth Gab-bro, Minnesota. They documented salt concentrations upto 48 wt% and inferred that the fluids were of magmaticorigin, though the concentration of salt could have beenincreased by a variety of secondary processes such asboiling. Sciuto and Ottonello (1995) studied fluid-rockinteraction in the peridotite of Zabargad Island in theRed Sea. Their fluid inclusion analysis of metasomaticforsterite gems showed that recrystallization took placein the presence of salt solutions of equivalent NaCl con-centration between 45.7 and 74.6 wt%.
Samson et al. (1995) found saline fluid inclusionswith up to 49 equivalent wt% NaCl in apatite, monticel-lite and calcite of the Oka, Quebec, carbonatite complex.Many of the inclusions have halite daughter crystals anda variety of other mineral precipitates. They inferred thatthe saline fluids were exsolved from carbonatite liquidsat minimum pressures of 4 to 8 kbar, and may have beeninstrumental in emplacement of rare earth element(REE) deposits.
Oliver (1995) and De Jong and Williams (1995) stud-ied regional high-temperature scapolite and albite alter-ations of metasediments in northern Queensland, Aus-tralia. This metasomatism is associated with importantCu, Au, Pb, Ag, Zn, U and REE deposits. Both papersconcluded that metasomatism and ore formation tookplace at mid-crustal depths by migrating hypersaline flu-ids. The latter study found evidence of concentrations ofNaCl1CaCl2 of 28–41 wt%.
Touret (1985) first reported apparently primary crys-talline salt inclusions in granulites from the highestgrade, Rb-depleted zone of the Bamble region, S. Nor-
way. Fluid inclusions in some of the granulites are hyper-saline brines, coexisting with dense CO2-rich fluid inclu-sions of the same generation. His inference of an impor-tant fluid agency for granulite facies metamorphism con-sisting of near-saturated supercritical brines accompa-nied by an immiscible CO2-rich phase has been reiterat-ed in recent studies (Touret 1995). Aranovich et al.(1987) earlier argued in favor of a concentrated NaClsolution of low H2O activity as a general mechanism ingranulite metamorphism. They showed by analysis ofmineral stabilities that, for some occurrences, H2O andCO2 activities were both low, which would be impossibleif metamorphic fluids were primarily H2O2CO2 solu-tions, as some have supposed. They also noted a strongnegative correlation of water activity with pressure for anumber of intermediate-grade metapelites, and related itto the changes in thermodynamic mixing properties ofwater in the water-salt solutions, as suggested also byShmulovich (1988).
Philippot and Selverstone (1991) found abundant con-centrated brine inclusions in eclogitic veins in peri-dotites in the Western Alps. They identified a large vari-ety of daughter minerals, including halite, sylvite, car-bonates, anhydrite, sulfides and monazite. The hypersa-line solutions were attributed to decrepitation of fluidinclusions formed earlier in eclogites of the subductioncomplex.
It is increasingly evident that concentrated salt solu-tions can play important roles in many petrogenetic pro-cesses in the deep crust and upper mantle, including re-gional metamorphism, metasomatism and magma for-mation. Quantitative discussion of these processes is cur-rently inhibited by lack of knowledge of important prop-erties of concentrated supercritical salt solutions at ele-vated temperatures and pressures. Most needed are H2Oactivities, degree of ionization, solubilities of the compo-nents of silicate minerals, and partition coefficients ofminor and trace elements, including heavy metals.
Previous work in the system NaCl2H2O
The principal phase equilibria of NaCl2H2O have beenworked out in a series of experimental studies over thepast several decades. Keevil (1942) showed by measure-ments of NaCl solubility in coexisting steam and liquidwater that NaCl2H2O is an example of a binary systemhaving a continuous critical curve and a maximum in thethree-phase coexistence curve of solid(salt)-melt-(aqueous)-vapor. Sourirajan and Kennedy (1962) experi-mentally achieved the maximum in the three-phase curveand measured NaCl composition of coexisting fluids to1240 bars. These data were summarized and extendedtheoretically to 2000 bars by Bowers and Helgeson(1983). Their binary isobaric diagrams show a markedshrinkage of the two-phase (liquid1vapor) field withpressure, with a small two-phase envelope remaining attwo kbar at very high temperatures. Above 2 kbar, Na-Cl2H2O fluids are everywhere supercritical. The most
202
recent data on the compositions of coexisting liquid andvapor in the binary are presented by Shmulovich et al.(1995).
Gunter et al. (1983) determined the effect of H2O onthe NaCl melting point (halite saturation curve) by dif-ferential thermal analysis (DTA) to 2 kbar. Koster VanGroos (1991) extended the DTA measurements to 6 kbarand compositions as H2O-rich asXH2O50.724. Sterneret al. (1992) summarized these data thermodynamicallyand derived activity coefficients for NaCl in the NaCl-rich portion of the binary.
Most studies of the water-rich region have confinedtheir attention to dilute solutions, and have attempted toquantify the degree of dissociation of NaCl. Quist andMarshall (1968) measured electrical conductivity of Na-Cl solutions to temperatures of 8008 C and pressures of 4kbar. Their most concentrated solutions were 0.1M. Theyshowed that degree of dissociation depends strongly onsolution density and to a lesser extent on the temperature.At two kbar, NaCl is almost completely undissociated.Franz (1982) measured H2O activities in NaCl solutionsby depression of the brucite (Mg(OH)2 – periclase(MgO) – H2O equilibrium at two kbar. He obtained threereversed brackets of the fluid composition in equilibriumwith brucite and periclase at temperatures in the range6308–6508 C and NaCl concentrations as high asXNaCl50.2. He concluded that H2O and undissociatedNaCl (NaCl0) form a nearly ideal solution. Shmulovichet al. (1982) reported experimental observations on thissystem at 4 kbar and two fluid compositions (XNaCl50.16and 0.26), which seemed to indicate decrease in H2Oactivity relative to that at 2 kbar. No systematic determi-nations of H2O activity at higher pressures or more con-centrated solutions have been made before the presentstudy.
Scope of the present study
In this study we extended the brucite-periclase H2O ac-tivity gauge to higher temperatures, pressures and to Na-Cl concentrations up to saturation. In order to make ac-curate H2O activity calculations, it was necessary tomeasure theP–Tdehydration curve of brucite accuratelyin the pure H2O system, in view of the somewhat con-flicting determinations of previous workers (see Fig. 1).Much of the difficulty in determination of this simply-characterized equilibrium lies in relatively fast back-re-action of fine-grained periclase to brucite during the rel-atively slow quenching of standard hydrothermal experi-mental apparatus. For this reason some workers have re-sorted to dynamic methods of detecting reaction pro-gress, such as monitoring of vapor phase volumechanges during brucite dehydration or rehydration tak-ing place in slow heating and cooling cycles (Schramkeet al. 1982; Philipp 1988); these studies are imprecisebecause of large hysteresis intervals. A more reliablebrucite-periclaseP–Tcurve in the MgO2H2O system isneeded as a baseline for studies of equilibrium in the
presence of NaCl solutions. Accurate determination ofisobaric univariant temperature-fluid compositioncurves in the ternary system allows retrieval of the activ-ity-concentration relation of H2O2NaCl fluids overbroad ranges of pressure, temperature and NaCl concen-trations. The concentration range is limited by halite sat-uration, where the brucite-periclase equilibria intersectisobaric NaCl2H2O liquidus curves. Accurate locationof points on the NaCl saturation curve at various pres-sures allows us to check the DTA determinations andthermodynamic expressions of previous workers for Na-Cl activities at high concentration. The present data mayserve as an introduction to the physical chemistry of nat-ural deep-seated complex polyionic fluids.
Experimental methods
Starting materials
Most of the experiments of the present study were made withmechanically-mixed powders of synthetic periclase and brucite.The periclase was originally large limpid crystals of MgO pre-pared by an arc-fusion method by Muscle Shoals ElectrochemicalCo. This material was much superior to the typical commercialreagent, which is micro-crystalline. Previous investigations haveencountered severe difficulties in quench back-reaction of hyper-fine MgO (Johannes and Metz 1968, Franz 1982). The periclasewas analyzed with the electron microprobe and found to be pureMgO, with no detectable Fe, Ni or other substituents. Brucite wasprepared from this periclase by reaction with distilled H2O at6008 C and 2 kbar for 4 days in sealed Au capsules. The result wasa complete yield of coarsely-crystalline brucite. Microprobe andX-ray diffraction analysis of this material was consistent with pureMg(OH)2. A lightly-ground powder mix of the two crystallinesubstances was prepared in proportions such that the largest X-raydiffraction peaks were of about equal height. Numerous powderscans of the standard mix in the range 188–448 2u (Cu Ka) weremade to verify reproducibility of the standard pattern. One criteri-on of the reaction direction of an experiment was change of peak-height ratios of product to reactant.
The powder mix was sealed by welding into 1-cm lengths of1.6-mm-diameter Pt tubing, along with weighed amounts of dis-tilled H2O and reagent NaCl crystals which had been previouslyheated at 3208 C to drive off adsorbed H2O. A typical chargeconsisted of about 3 mg of powder mix, 4 mg of NaCl and 2 mg ofH2O. The amount of powder mix was sufficient to absorb or relaseabout 0.5 mg of H2O in a complete reaction to brucite or periclase.
Apparatus
Internally-heated argon-pressure vessels with wound Kanthalheaters were used in the experiments at 2 kbar and 4.2 kbar, and1.91-cm-diameter piston-cylinder apparatus with NaCl pressuremedium and graphite heater sleeve was used at 4.2, 7, 10 and 15kbar. Two capsules were ordinarily placed side-by-side in eachtype of apparatus. After a preliminary knowledge of the phaseequilibrium relations was obtained, it was usually possible tochoose the compositions of the initial fluid phases of the twocapsules so that a tight reversed bracket of the final fluid phase wasobtained in a single experiment.
A calibrated W-3% Re versus W-25% Re thermocouple was invirtual contact with the two Pt capsules in the piston-cylinderexperiments. Power input to the furnace assembly wasmonitoredthroughout a run to check for thermocouple contamination. Themanufacturer (Engelhard Industries) states that the accuracy isbetter than+18 C. No correction was made for the effect of pres-
203
sure on the thermocouple. In the gas-pressure vessel experiments,two stainless-steel-sheathed Cr-Al thermocouples were located atopposite ends of the Pt capsules, and the whole assembly wasplaced in a thick Cu holder to minimize thermal gradients. The Ptcapsules were protected from contact with the Cu and the steelthermocouple sheaths by a packing of dried calcite powder. Thethermocouples (Omega Engineering Co.) are calibrated to+0.18 C. The two thermocouples always read the same tempera-ture within 28 C. Temperatures were controlled automatically andmonitored with a precision millivolt-meter.
The control thermocouple (slightly the hotter of the two in mostexperiments) was compared with a new previously unused thermo-couple after the series of experiments was concluded, to checkthermocouple integrity. The old and new thermocouples wereplaced tip-to-tip in the heater assembly inside of the Cu holder andheated at one bar at 308 intervals from 5008 to 6508 C. The oldthermocouple consistently read 1 to 2 degrees C higher than thenew thermocouple. It is not certain if the small difference repre-sents an actual thermal gradient inside the Cu holder or change ofcalibration of the old thermocouple, but in any case it is not largeenough to require a correction to the recorded temperatures.
Experiments in the piston-cylinder apparatus were brought to apressure 3 kbar lower than the final pressure and then heated.Thermal expansion of the NaCl assemblies carried the pressure toits final run value. Some bleeding of the gauge pressure during thefinal stages of heating was usually required to hold a nominalpressure. Under these piston-out conditions the sample pressuresare believed accurate to+200 bars with no friction correction.However, in the 4.2 kbar experiments it was impossible to followthis procedure because the initial cold pressure was not sufficientto consolidate the pressure assemblies. Accordingly, the assem-blies were first pressurized to 5 kbar, then bled to 3 kbar, andfinally heated. Much bleeding was required to hold the pressure atthe nominal value. Because of the anomalous pressurizing-heatingprocedure, some uncertainty in sample pressure must be anticipat-ed. For this reason, some experiments at 4.2 kbar in the piston-cylinder were repeated in the gas-pressure apparatus.
Pressures in the gas-pressure vessels were read at the start ofthe runs on a precision Heise Bourdon tube gauge with an accuracyof +0.1%, and monitored throughout the runs on a manganinresistance cell previously calibrated against the Heise gauge. Themaximum pressure uncertainty in the gas pressure vessels is+7bars.
The temperature of the brucite-periclase equilibrium with pureH2O at a nominal 4.2 kbar was found to be marginally lower in thegas-pressure experiments than in the piston-cylinder experiments(7188+38 C versus 7238+38 C). This discrepancy, if real, could bethe result of piston-cylinder pressure in the experiments near 4kbar, which is actually 220 bars higher than the nominal pressure,or it could result from a real thermocouple calibration differenceor a pressure effect on W-Re thermocouples in the piston-cylinderapparatus. Because of this uncertainty, the 4.2 kbar bracket isassigned an error of+58 C.
Detection of reaction
Reaction progress was detected by a weight loss method. Afterquenching an experiment, the Pt capsules were cleaned andreweighed to check for leakage. Weighings on a Mettler AE 240semi-microbalance were reproducible to+231025 gm andshowed no weight changes of the quenched capsules. The capsuleswere then immersed in liquid nitrogen to freeze the solutioninside, and punctured with a needle while still frozen. The sam-ples were removed from the liquid nitrogen and dried, first at1208 C for 10 min, and then at 3208 C for 10 min. There wasusually negligible additional weight loss in the second drying. Atotal drying loss greater than the weight of H2O initially present inthe capsule signified brucite decomposition; conversely a dryingloss less than the initial H2O indicated H2O absorption by brucitegrowth. Reaction progress so monitored usually corresponded tonearly complete reactions in either direction. The reaction direc-
tions were confirmed by microscopic inspection of small portionsof charges in immersion oil. Brucite was visible as large well-formed rounded or pseudohexagonal flakes, almost isotropic dueto their planar orientation, but easily distinguishable from peri-clase by low relief, and as rectangular grains with very high bire-fringence, whereas periclase is isotropic and of very high index ofrefraction. This method by itself would have been sufficient todetect reaction directions unambiguously. Finally, the X-ray dif-fraction patterns of quenched charges were compared with thoseof the standardized starting mix. Again, nearly complete reactionswere indicated by relative X-ray peak height changes in most of theruns.
Saturation of the salt solutions limits the concentrations ofNaCl which could be obtained. Halite saturation was readily de-tected in two ways. The most definitive signal was inability tolower the brucite dehydration temperature beyond a certain limit-ing value in spite of increasing NaCl concentration of the charges,thus indicating that solutions were saturated. The second was themicroscopic detection of large blocky halite crystals, interpretedas phenocrysts, among the skeletal arrays of melt-quenched saltand small inclusion-free salt grains precipitated on drying. A se-ries of experiments was done specifically to define the saturationtemperatures at a given pressure. The intersection of the isobaricbrucite-periclase curve with the isobaric halite saturation curve inthe system MgO2H2O2NaCl produces a temperature-invariantfield boundary between brucite-halite-fluid and periclase-halite-fluid (see Fig. 3). Experiments at very high NaCl concentrations(XH2O
50.2 to 0.3) yielded reactions to either periclase or bruciteover a 58 C interval enclosing this boundary, thus defining a pointon the isobaric halite saturation curve.
Results of experiments
System MgO2H2O
Figure 1 shows our brackets on the brucite-periclaseequilibrium with pure H2O to 15 kbar. The experimentaldata are presented in Table 1. All of the brackets con-strain points on the equilibrium at 2, 4.2, 7, 10 and 15kbar within an average of+48 C. Our determinationagrees quite well with the unreversed 2 kbar bracket ofBarnes and Ernst (1963). Franz’s (1982) point (6688–6738 C) at 2 kbar is several degrees higher than ours. Hisuse of natural brucite starting material could possiblyaccount for the discrepancy. The dynamic volumetric de-terminations of Schramke et al. (1982) at several pres-sures have wide temperature hysteresis; however, theirheating-cycle signals coincide with the curve throughour data. This may indicate delayed nucleation andgrowth of brucite in their cooling cycles. Near extrapola-tion to 15 kbar of the experimental brackets of Irvinget al. (1977), obtained in theP range from 17 to 33 kbar,gives a temperature of 9058 C, which agrees reasonablywell with our determination (Table 1). The Berman(1988) and Holland and Powell (1990) thermodynamicdatasets both yield 6498 C at 2 kbar. Our use of coarse-grained periclase starting material, thus inhibiting back-reaction to brucite in the quench, removes some of theambiguity from the determination.
The one-bar Gibbs free energy of the reaction is read-ily obtained by regression using the relation:
DGo(T,1)52RTlnfH2O2PDV*s (1)

204
Fig. 2 Standard Gibbs free energy at one bar pressure for thereaction Mg(OH)2 (brucite)5MgO (periclase)1H2O, using thepresent experimental determinations, the H2O fugacity tables ofBurnham et al. (1969) extrapolated to 15 kbar with the help of theSharp (1962) tables, and the compressibility and thermal expan-sion parameters for brucite and periclase of Holland and Powell(1990). TheDGo points are satisfied by the linear expressionDGo573418–134.95T(K), obtained by regression
Fig. 1 Experimental brucite-periclase equilibrium in the systemMgO2H2O. Pressure and temperature uncertainties of present re-versed determinations indicated by height and width off illedrectangles. Shown also are unreversed experimental brackets ofBarnes and Ernst (1963) at 0.5 to 2 kbar, the hysteresis intervals(double arrowheads) determined by Schramke et al. (1982) in con-tinuous volumetric reversals of the equilibrium, and the reversedbracket (half-shaded circle) at 2 kbar of Franz (1982)
are satisfied within experimental uncertainties by thelinear relation:
DGo (+120J)5734182134.95T(K) (2)
Essentially the same relation is obtained employing ther-mophysical coefficients tabulated by Berman (1988).
System MgO2H2O2NaCl
Figure 3 shows the brackets of brucite-periclase equi-librium in the system MgO2H2O2NaCl defined by ini-tial and final fluid phase compositions. The completedataset is given in Table 2. The closure of brackets ateach temperature and pressure averages less than twomole percent width; many opposing reaction arrowheadsare coincident. A very slight apparent cross-over wasrecorded in a few brackets. The brackets define uniqueisobaric univariant brucite-periclase-fluid equilibriumcurves.
We were unable to secure brackets close to the pureH2O axis. Experiments at 10 and 7 kbar andXH2O.0.93gave unexpected periclase-forming reactions, indicatingthat, in the very dilute range, the brucite-periclase equi-librium decreases in temperature more rapidly with in-creasing NaCl solution concentration than over most oftheT–XH2O range (see Table 2). It is suspected that somesolute complexing between MgO and NaCl occurs in di-lute solutions, enhancing MgO solubility. The effectcould be analogous to the augmented solubility of brucitein dilute K2CO3 solutions observed at low temperatures
Table 1 Experimental data on the reaction Br5Per1H2O in purewater (nyr no to very little reaction progress detected by all meth-ods)
Run ' T8C P, kbar Duration, h Phase grown
PB-31 900 15.0 26 PerPB-35 895 15.0 8 BrPB-118 840 10.0 22 PerPB-4 835 10.0 71 BrPB-43 775 7.0 23 BrPB-40 785 7.0 22 PerPB-84 780 7.0 29 nyrPB-98 725 4.2 46 PerPB106 720 4.2 46 BrPB-127a 720 4.2 44 PerPB-129a 715 4.2 46 BrPB-46a 660 2.0 69 BrPB-62a 665 2.0 61 Per
a Runs made in the internally-heated gas apparatus; all the restwere piston-cylinder runs
where fH2O is the fugacity of H2O at the experimentalconditions andDV*s is the solid volume change, V(peri-clase)-V(brucite), evaluated atT andPy2. The above re-lation assumes that solubility of MgO is negligible andthat the thermal expansion and compressibility coeffi-cients are constants (volumes vary linearly with pressureand temperature). Our brackets together with H2O fugac-ity data from Burnham et al. (1969) and thermal expan-sion and compressibility coefficients from Holland andPowell (1990) give theDGo values shown in Fig. 2. They
205
Table 2 Experimental data on the reaction Br5Per1H2O in thepresence of H2O2NaCl solutions (nyr small change in water con-tent in the course of the run,Satruns under NaCl-saturated condi-tions)
Run ' P, kbar T8C Dura- XH2O, st. XH2O
, fin. Phasetion, h grown
PB-49 15 850 9 0.870 0.881 PerPB-50 15 850 9 0.930 0.893 BrPB-41 15 800 20 0.760 0.771 PerPB-42 15 800 20 0.810 0.775 BrPB-53 15 780 24 0.690 0.723 PerPB-54 15 780 24 0.750 0.728 BrPB-44 15 750 8 0.685 0.677 Br-nyrPB-45 15 750 8 0.740 0.683 BrPB-48 15 750 20 0.646 0.635 nyrPB-51 15 750 24 0.600 0.645 PerPB-67 15 725 23 0.560 0.600 PerPB-68 15 725 23 0.620 0.604 BrPB-61 15 715 44 0.250 0.300 Per; sat.PB-59 15 710 44 0.250 0.115 Br; sat.PB-10 10 820 73 0.960 0.966 PerPB-12 10 800 53 0.890 0.905 PerPB-13 10 800 53 0.930 0.911 BrPB-18 10 780 96 0.820 0.850 PerPB-19 10 780 96 0.880 0.868 BrPB-20 10 755 44 0.820 0.791 BrPB-21 10 755 44 0.700 0.753 PerPB-22 10 740 66 0.710 0.746 PerPB-23 10 740 66 0.780 0.759 BrPB-27 10 720 48 0.670 0.688 PerPB-28 10 720 48 0.730 0.686 BrPB-14 10 700 76 0.620 0.647 PerPB-15 10 700 76 0.680 0.674 BrPB-32 10 680 46 0.560 0.610 PerPB-36 10 680 51 0.580 0.618 PerPB-37 10 680 51 0.640 0.604 BrPB-30 10 675 72 0.200 0.280 Per; sat.PB-26 10 670 51 0.200 0.185 Br; sat.PB-81 7 780 19 0.990 0.994 PerPB-74 7 775 26 0.980 0.989 PerPB-77 7 770 48 0.980 0.983 Per-nyrPB-71 7 765 26 0.900 0.913 PerPB-72 7 765 26 0.960 0.947 BrPB-85 7 750 30 0.848 0.872 PerPB-91 7 750 25 0.858 0.871 PerPB-92 7 750 25 0.943 0.920 BrPB-65 7 735 26 0.800 0.828 PerPB-66 7 765 26 0.860 0.835 BrPB-87 7 715 26 0.730 0.767 PerPB-88 7 715 26 0.810 0.779 BrPB-57 7 690 23 0.670 0.687 PerPB-58 7 690 23 0.730 0.713 BrPB-95 7 650 49 0.557 0.618 PerPB-96 7 650 49 0.640 0.628 BrPB-122 7 640 46 0.300 0.351 Per; sat.PB-97 7 635 49 0.300 0.230 Br; sat.PB-111 4.2 700 49 0.963 0.970 PerPB-107 4.2 680 45 0.770 0.835 PerPB-108 4.2 680 45 0.860 0.835 BrPB-102 4.2 650 27 0.690 0.714 PerPB-103 4.2 650 27 0.770 0.714 BrPB-113 4.2 620 48 0.570 0.618 PerPB-114 4.2 620 48 0.650 0.605 BrPB-112 4.2 610 48 0.30 0.360 Per; sat.PB-121 4.2 605 50 0.300 0.245 Br; sat.PB-99 2 640 97 0.836 0.869 PerPB-100 2 640 97 0.900 0.883 BrPB-115 2 620 125 0.800 0.741 BrPB-116 2 620 125 0.700 0.743 Per
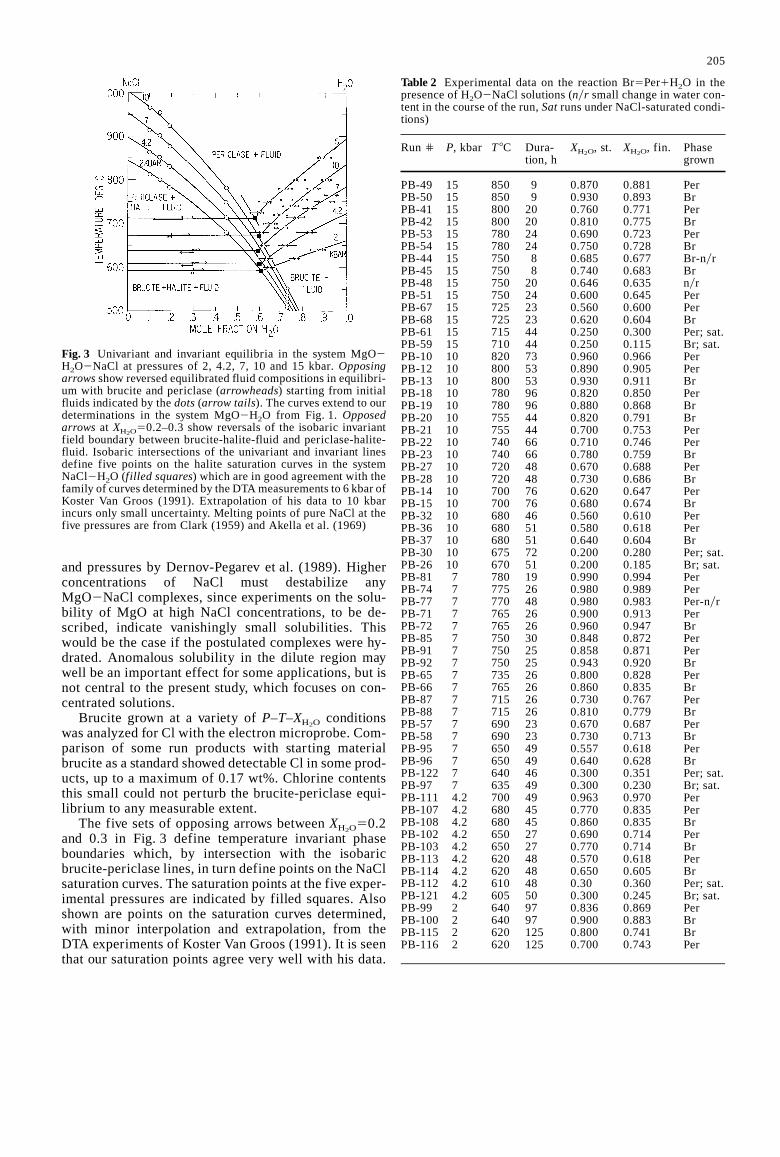
Fig. 3 Univariant and invariant equilibria in the system MgO2H2O2NaCl at pressures of 2, 4.2, 7, 10 and 15 kbar.Opposingarrowsshow reversed equilibrated fluid compositions in equilibri-um with brucite and periclase (arrowheads) starting from initialfluids indicated by thedots(arrow tails). The curves extend to ourdeterminations in the system MgO2H2O from Fig. 1. Opposedarrows at XH2O
50.2–0.3 show reversals of the isobaric invariantfield boundary between brucite-halite-fluid and periclase-halite-fluid. Isobaric intersections of the univariant and invariant linesdefine five points on the halite saturation curves in the systemNaCl2H2O (f illed squares) which are in good agreement with thefamily of curves determined by the DTA measurements to 6 kbar ofKoster Van Groos (1991). Extrapolation of his data to 10 kbarincurs only small uncertainty. Melting points of pure NaCl at thefive pressures are from Clark (1959) and Akella et al. (1969)
and pressures by Dernov-Pegarev et al. (1989). Higherconcentrations of NaCl must destabilize anyMgO2NaCl complexes, since experiments on the solu-bility of MgO at high NaCl concentrations, to be de-scribed, indicate vanishingly small solubilities. Thiswould be the case if the postulated complexes were hy-drated. Anomalous solubility in the dilute region maywell be an important effect for some applications, but isnot central to the present study, which focuses on con-centrated solutions.
Brucite grown at a variety ofP–T–XH2O conditionswas analyzed for Cl with the electron microprobe. Com-parison of some run products with starting materialbrucite as a standard showed detectable Cl in some prod-ucts, up to a maximum of 0.17 wt%. Chlorine contentsthis small could not perturb the brucite-periclase equi-librium to any measurable extent.
The five sets of opposing arrows betweenXH2O50.2and 0.3 in Fig. 3 define temperature invariant phaseboundaries which, by intersection with the isobaricbrucite-periclase lines, in turn define points on the NaClsaturation curves. The saturation points at the five exper-imental pressures are indicated by filled squares. Alsoshown are points on the saturation curves determined,with minor interpolation and extrapolation, from theDTA experiments of Koster Van Groos (1991). It is seenthat our saturation points agree very well with his data.
206
Table 2 (continued)
Run ' P, kbar T8C Dura- XH2O, st. XH2O
, fin. Phasetion, h grown
PB-104 2 600 141 0.623 0.652 PerPB-105 2 600 141 0.702 0.635 BrPB-126 2 590 96 0.300 0.292 Br; sat.PB-130 2 595 99 0.300 0.346 Per; sat.
An extrapolation to 15 kbar of the DTA data would be toouncertain to provide a reliable comparison with our 15-kbar saturation point. Our 2 kbar saturation point is con-siderably different from that given by the DTA work ofGunter et al. (1983), who showedxH2O50.53 at 6008 C.The formulae of Sterner et al. (1992), based on the Gun-ter et al. (1983) work, give saturation curves to 5 kbarwhich are consistently less H2O-rich than those found inthe present study.
A few experiments were made to determine whetherMgO solubility in concentrated NaCl solutions couldhave perturbed the halite saturation data or the H2O ac-tivities derived below. Experiments were made with avery small amount of periclase (0.1 mg compared withthe usual 2–4 mg of periclase1brucite in our normalexperiments) and the normal amount of fluid. These sol-ubility experiments were at 10 kbar and 7008 C andXH2O50.61, 0.67 and 0.76 for 48 h. In the experiment atXH2O50.61, abundant large periclase crystals werepresent in the quenched charge, some showing geometri-cal overgrowths. No brucite formed. In the two experi-ments at higher H2O concentration, abundant large geo-metrical brucite flakes formed, and occasional relics ofpericlase were visible in immersion oil, with reactionrims of brucite. These experiments show that the totalcontribution to the fluid phase of solute MgO must bemuch less than one mole percent. MgO solubilities thissmall could not measurably affect any of the phase equi-libria or derived parameters in the system NaCl2H2O.
Discussion
H2O activity
H2O activity aH2O in concentrated NaCl solutions can bederived accurately from measurements of the depressionof the brucite-periclase equilibrium temperature, by useof the following expression:
RTlnaH2O52DGo2RTlnfH2O2PDV*s (3)
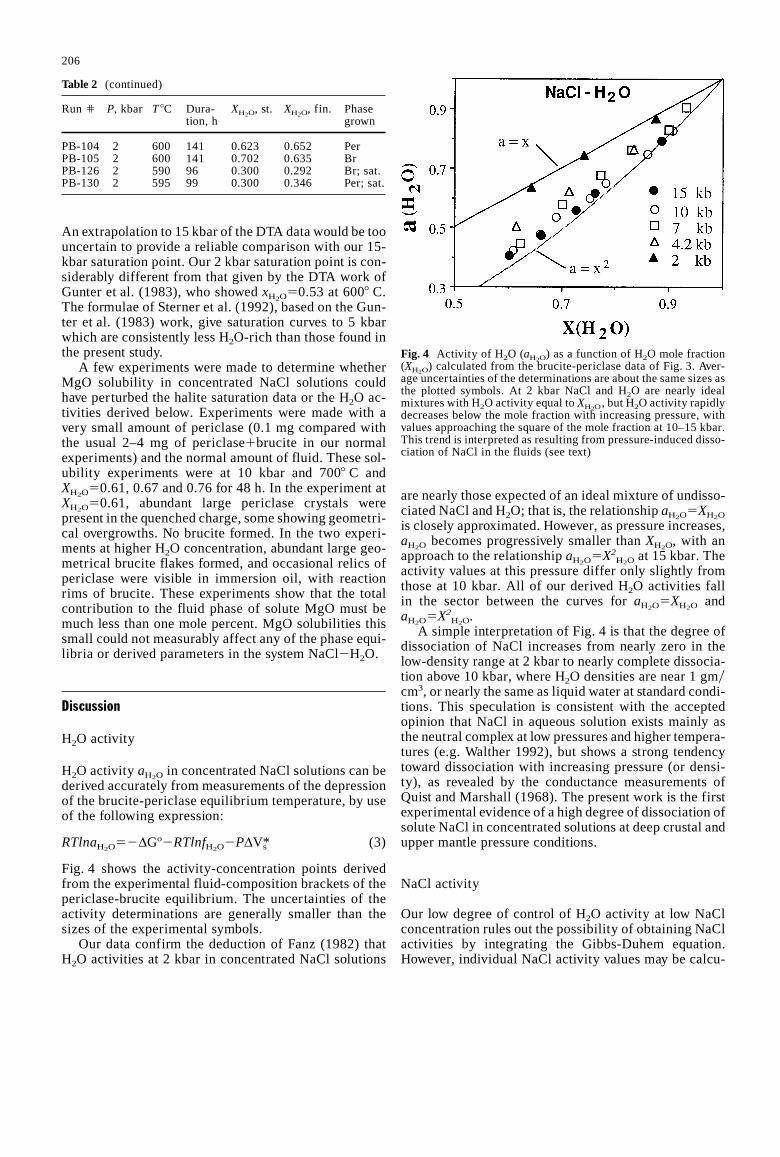
Fig. 4 shows the activity-concentration points derivedfrom the experimental fluid-composition brackets of thepericlase-brucite equilibrium. The uncertainties of theactivity determinations are generally smaller than thesizes of the experimental symbols.
Our data confirm the deduction of Fanz (1982) thatH2O activities at 2 kbar in concentrated NaCl solutions
Fig. 4 Activity of H2O (aH2O) as a function of H2O mole fraction
(XH2O) calculated from the brucite-periclase data of Fig. 3. Aver-
age uncertainties of the determinations are about the same sizes asthe plotted symbols. At 2 kbar NaCl and H2O are nearly idealmixtures with H2O activity equal toXH2O
, but H2O activity rapidlydecreases below the mole fraction with increasing pressure, withvalues approaching the square of the mole fraction at 10–15 kbar.This trend is interpreted as resulting from pressure-induced disso-ciation of NaCl in the fluids (see text)
are nearly those expected of an ideal mixture of undisso-ciated NaCl and H2O; that is, the relationshipaH2O5XH2O
is closely approximated. However, as pressure increases,aH2O becomes progressively smaller thanXH2O, with anapproach to the relationshipaH2O5X2
H2O at 15 kbar. Theactivity values at this pressure differ only slightly fromthose at 10 kbar. All of our derived H2O activities fallin the sector between the curves foraH2O5XH2O andaH2O5X2
H2O.A simple interpretation of Fig. 4 is that the degree of
dissociation of NaCl increases from nearly zero in thelow-density range at 2 kbar to nearly complete dissocia-tion above 10 kbar, where H2O densities are near 1 gmycm3, or nearly the same as liquid water at standard condi-tions. This speculation is consistent with the acceptedopinion that NaCl in aqueous solution exists mainly asthe neutral complex at low pressures and higher tempera-tures (e.g. Walther 1992), but shows a strong tendencytoward dissociation with increasing pressure (or densi-ty), as revealed by the conductance measurements ofQuist and Marshall (1968). The present work is the firstexperimental evidence of a high degree of dissociation ofsolute NaCl in concentrated solutions at deep crustal andupper mantle pressure conditions.
NaCl activity
Our low degree of control of H2O activity at low NaClconcentration rules out the possibility of obtaining NaClactivities by integrating the Gibbs-Duhem equation.However, individual NaCl activity values may be calcu-

207
lated in a straightforward manner from the five experi-mental saturation points, using the formula:
&TsatTo
DSdT5RTsatlnaNaCl (4)
whereTo is the halite melting point atP, Tsat is the tem-perature of our experimental saturation point atP, DS isthe entropy of melting of pure NaCl andaNaCl is theactivity of NaCl in the hydrous liquid relative to a stan-dard state of pure molten NaCl.DS is 26.22 JyK-mol at1073 K and 1 bar, from Robie et al. (1978), and a smalltemperature correction to the entropy may be made usingtheir heat capacity data:
DCp (melting)526.85720.0212T(K) (5)
It is assumed that pressure up to several kbar has a negli-gible effect onDS of melting. This calculation yields theNaCl activity values from the five measured saturationpoints given in Table 3. The melting points of NaCl weretaken from Clark’s (1959) equation:
P (kbar)516.7[(Ty1073.5)2.7021] (6)
which reproduces very well the experimental data ofKoster Van Groos (1991) and Akella et al. (1969) to 15kbar.
Happenstantially, the five experimental saturationpoints are nearly invariant in composition, and close to-gether in temperature, so that the effect of pressure onthe activity coefficient of NaCl may be evaluated. Thepressure effect is similar to that for H2O: at 2 kbar theactivity coefficientgNaCl is nearly unity, as it would befor an ideal binary solution, but pressure causes a sub-stantial decrease at nearly constant composition, whichprobably results from pressure-induced ionization toNa1 and Cl2. The NaCl activities we calculate are some-what larger than those given by the formulas of Sterneret al. (1992) because our saturation temperatures arehigher than those given by these authors.
Thermodynamic model
The activity-concentration relationships for both H2Oand NaCl at 2 kbar are, to a close approximation, those of
an ideal two-component mixture, where the activities areequal to their mole fractions (Table 4). In the intermedi-ate and H2O-rich composition ranges, this behavior cor-responds to an ideal solution of H2O molecules andundissociated NaCl molecules. It is not clear why therelationship persists to high NaCl concentration, inas-much as fluids approaching pure molten NaCl in compo-sition should presumably be completely ionized.
At 10 kbar the activities of both H2O and NaCl aresubstantially smaller than their mole fractions, and, infact, correspond closely to an ideal fused salt mixture inwhich the NaCl is completely ionized. The ideal (ather-mal) activities in this model, as developed by Bradley(1962) and by Pitzer and Simonson (1986) for Na-Cl2H2O, are:
aidH2O5XH2Oy(22XH2O) aid
NaCl54X2NaCly(11XNaCl)
2 (7)
The high degree of correspondence between the mea-sured activities of both H2O, from our brucite-periclasedata, and NaCl, from our NaCl saturation points and theKoster Van Groos (1991) data, is shown in Table 4.
There thus appears to be a remarkable pressureyfluiddensity-induced change of state in NaCl- H2O mixturesbetween 2 kbar and 10 kbar, which apparently resultsfrom dissociation of NaCl, and contributes a variableconfigurational entropy of solution. Extending the idealactivity formulation by Bradley (1962) and Pitzer andSimonson (1986) (Eq. 7 above), the following expres-sions can be readily obtained for the ideal activities of
Table 4 Comparison of measured and model activity values at 2.0and 10.0 kbar
P(kbar) T (8C) XH2OXNaCl ameas
H2Oaid
H2Oameas
NaCl aidNaCl
2.0a 600 0.644 0.637 0.644620 0.741 0.746 0.741640 0.876 0.868 0.876509 0.276 0.267 0.276593c 0.395c 0.407c 0.395c
681 0.551 0.581 0.551782 0.812 0.824 0.812800 0.853 0.872 0.853813 0.900 0.907 0.900
10.0b 680 0.610 0.421 0.439700 0.660 0.475 0.493720 0.690 0.535 0.527740 0.753 0.600 0.604755 0.782 0.651 0.642780 0.860 0.749 0.754800 0.907 0.828 0.830
553 0.276 0.179 0.187673c 0.400c 0.329c 0.327c
782 0.551 0.510 0.505923 0.812 0.803 0.803956 0.853 0.880 0.848968 0.900 0.909 0.898
a 2.0 kbar:aidH2O
5XH2O; aid
NaCl5XNaClb 10.0 kbar:aid
H2O5XH2O
y(22XH2O); aid
NaCl54X2NaCly(11XNaCl)
2
c Our halite saturation measurements. OtheraNaCl data are calcu-lated from the Koster Van Groos (1991) data, with minor interpo-lation and extrapolation (see text)
Table 3 Activity (a) and activity coefficient (g) of NaCl in thesystem NaCl2H2O, calculated from the measured halite saturationdata (DS* is the mean value of entropy of melting of NaCl betweenT0, the melting point atP in the H2O-free system, andTsat, theexperimental halite saturation point in the system NaCl2H2O atP)
P To Tsat DS* XNaCl aNaCl gNaCl
kbar K K JyK-mol
2.0 1117 866 25.82 0.395 0.406 1.094.2 1171 881 26.01 0.400 0.357 0.897.0 1221 911 26.19 0.405 0.342 0.85
10.0 1278 946 26.35 0.400 0.329 0.8215.0 1361 986 26.50 0.420 0.298 0.71

208
the components in solution with varying degree of ion-izationa:
aH2O5XH2Oy(11aXNaCl)aNaCl5(11a)(11a)[XNaCly(11aXNaCl)]
(11a) (8)
ais a parameter, mainly dependent on pressure, tempera-ture and fluid density, which is nearly zero at 2 kbar andnearly unity at 10 kbar and above. It may be viewed as aspeciation parameter reflecting the number of the NaCl-related species in a solution relative to that in pure super-cooled electrolite melt at any given pressure and temper-ature. It is evident that ata51, Eqs. 8 reduce to 7; ata50, Eqs. 8 giveaH2O5XH2O andaNaCl5XNaCl. The latterformulas correspond to another standard state widelyused in thermodynamic modelling of the H2O-NaCl sys-tem, that is, ideal molecular solution (e.g. Anderko andPitzer 1993). It may also be readily verified that expres-sions 8 satisfy the Gibbs-Duhem relation ifa is not afunction ofXH2O.
Several expressions fora as a function ofP, T andwater density (qH2O) have been explored in the course offitting the experimental data. Best results were obtainedwith the expression:
a5exp[A–ByqH2O]2CPyT (9)
This expression allowed for fitting of the 29 experimen-tal fluid compositions measured in this study (24 pointsalong the brucite-periclase equilibrium and 5 points onhalite saturation) with standard deviation slightly below0.010. For each particular point, the calculated fluidcomposition lies within the uncertainty of the experi-mental bracket. The resulting numerical values of theparameters of Eq. 9 are:
A54.226, B52.9605, C5164.984 (10)
whereP is in kbar,T in Kelvin, andqH2O at the samePand T is in gycm3. The activity-composition relationscomputed with expressions 8 through 10 at 1000 K anddifferentP values are shown in Fig. 5.
We can assess the validity of our formula outside theP–T–XH2O range of calibration by comparing calculatedhalite hydrous melting curves at 0.5, 2 and 5 kbar withexperimental DTA determinations, shown in Fig. 6, byGunter et al. (1983, as given in Table 2 of Chou et al.1992) and Koster van Groos (1991). As can be seen,agreement between calculations and both experimentaldata sets at 0.5 kbar is very good. AtP52 kbar (thehighest pressure of the Gunter et al. experiments) thecomputed melting curve lies between the two sets ofmeasurements, and is somewhat closer to those by Kostervan Groos (1991); at 5 kbar the agreement with the databy the latter author is also good, although the calcula-tions predict melting temperatures which are systemati-cally lower than the experimental temperatures by 58 to108 C.
We also attempted to fit our data into the model sug-gested by Pitzer and Simonson (1986). This model,which represents a combination of the Debye-Hückel
Fig. 5 Activity-composition relations of H2O and NaCl in the bi-nary join evaluated from the simple ideal expressions of the text.The curves aredashedin their metastable portions beyond thehalite saturation points at 1000 K
limiting equation with a Margules power series to ac-count for short-range electrostatic forces in solution,proved to reproduce very well water activity measure-ments in dilute to concentrated electrolyte solutions (Si-monson and Pitzer 1986; Weres and Tsao 1986). Themodel, however, failed to reproduce simultaneously theH2O and the NaCl activity values obtained in this study,even when we allowed the W parameter to be linearlydependent on bothP andT. The extension of the modelproposed by Pabalan and Pitzer (1990) relies upon toomany parameters to be evaluated with the data of thepresent study.
It is apparent that activity-composition relations ofthe system NaCl2H2O at highT, P andXNaCl are muchsimpler than inferred by the extended Debye-Hückel for-mulation; in fact the solutions behave as nearly idealmixtures of ions and molecules in which the degree ofNaCl ionization is a strong function of pressure and tem-perature (dielectric constantydensity of water) in therange 2–10 kbar. It is also apparent that the molten NaClstandard state is much preferable in simple modelling ofthe thermodynamics than the dilute solution standardstate. We should point out, however, that although theparametera, as it appears in this study, is closelyanalogous to the traditional degree of dissociation (e.g.Quist and Marshall 1968), it differs from the latter in twoimportant respects: first, it does not depend on the con-centration of electrolyte in a solution, and second, undercertain values ofP, T, andqH2O it can become slightlynegative, or greater than 1, which reflects more complexsolution behavior of NaCl (e.g. hydration andyor dissoci-ation of H2O, as well as deviation of the NaCl2H2O sys-tem from ideality).

209
Fig. 7 CalculatedP–T projections of the equilibrium talc-en-statite1quartz1H2O at various compositions of the fluid phase(XH2O
labelled at the top of diagram) in the systems H2O2NaCl(bold curves; dottedat NaCl concentrations above saturation) andH2O2CO2 (dashed)
Fig. 6 Temperature (To)-mole fraction of water (XH2O) isobars
(labelled curves) of the halite liquidus calculated from the “idealactivity” model (see text) compared with experimental DTA mea-surements by Koster van Groos (KvG 1991;circles) and Gunteret al. (GCG 1983;squares)
presence of complex electrolytes would further lowerH2O activity at a given H2O mole fraction, if pressure-in-duced ionization is indeed a principal control, and, per-haps more importantly, these additional salts would forma low-melting eutectic with NaCl, thus further loweringthe temperatures of the saturation curves, allowinghigher salt concentrations and hence lower H2O activi-ties.
The effect of concentrated NaCl solutions on the up-per temperature stability limit of hydrous silicates is il-lustrated in Fig. 7. A simple and well known high-tem-perature dehydration reaction occurs in the systemMgO2SiO22H2O:
Talc5Enstatite1Quartz1H2O.
The equilibriumP–T position of this reaction atXH2O
51.0 and in H2O2CO2 mixes with fixedXH2O was calcu-lated employing the mineral thermodynamic data set ofBerman and Aranovich (1996) and H2O2CO2 mixingproperties according to Kerrick and Jacobs (1981). Ex-pressions 8–10 have been used to calculate the positionof the reaction in the presence of H2O2NaCl fluid.
At low pressure (up to¥4 kbar) dehydration tempera-tures of talc for a givenXH2O do not differ much inH2O2CO2 and H2O2NaCl, but the difference becomesmuch greater with increasingP (up to 708 C difference at10 kbar), which is a direct consequence of the extremelypressure-dependent H2O activity in the H2O2NaCl sys-
Petrologic interpretations
A principal requisite of fluids which are feasible for deepcrust and upper mantle metamorphism is low H2O activi-ty, while maintaining the ability to exchange alkalis, asin charnockitic metamorphism (Perchuk and Gerya1993) and in mantle metasomatism (Dawson and Smith1992). Halogen zoning patterns in apatite from the Bam-ble, S. Norway granulites (Nijland et al. 1993) show at-tack by deep crustal fluids which were probably concen-trated brines. Our results show that NaCl2H2O solutionsmay have H2O activities as low as 0.25 at 7508 C and10 kbar; this would be sufficiently low to be in equilibri-um with orthopyroxene and K-feldspar, the definitivegranulite assemblage, while allowing only limited,rather than wholesale, crustal anatexis.
In all probability, natural concentrated brines wouldcontain a variety of other cations, such as Ca21, Mg21,Fe21, Fe31 and K1, and other anions, such as CO22
3SO22
4 , F2, etc. For instance, DeJong and Williams (1995)inferred CaCl2yNaCl of about 2 (wt ratio) from meltingbehavior of salt crystal-brine inclusions in metasoma-tized rocks of the Cloncurry Fault area, Queensland. The

210
tem found in this study. It is also important that the dPydTslope of the dehydration reaction in the salt-bearing sys-tem changes its sign from positive to negative, in contrastwith that in the H2O2CO2, where it remains positive, atleast in the crustal pressure range. The above exampleshows that concentrated brines are much more efficientin stabilizing anhydrous assemblages to lower tempera-tures than H2O2CO2 fluids, thus satisfying one impor-tant requisite of the fluid agent of granulite facies meta-morphism.
Another requisite of possible granulite-facies fluids isthat extensive melting be suppressed at the high tempera-tures and pressures of deep crustal metamorphism. Thepronounced decrease of H2O activity in concentratedNaCl solutions at pressures above a few kbar suggeststhat such fluids might indeed be able to coexist withfeldspars and quartz without melting at high grade condi-tions.
The problem of deep crustal melting in the presenceof concentrated alkali chloride solutions may be ap-proached quantitatively making use of experimental sim-ple-system granite melting relations with CO22H2Ofluids (Ebadi and Johannes 1991). Increasing CO2 in thevapor phase substantially raises the solidus in the systemKAlSi3O8 (Or)2NaAlSi3O8 (Ab)2SiO2 (Qz)2H2O.Comparison of the relative effects of the solutes CO2 andNaCl on granite melting may be made with the presentexperimental work and the Ebadi and Johannes (1991)data, together with experimental data of alkali partition-ing between coexisting K-feldspar and albite, and chlo-ride solutions. According to Iiyama (1965), the NayNa1K ratio of relatively dilute solutions in equilibriumwith two feldspars at 6008 C and one kbar is very high(0.8), and it is assumed here that chloride solutions at thegranite solidus remain Na-dominated at higher tempera-tures, pressures and concentrations. This assumption al-lows use of the present H2O2NaCl activity-concentra-tion relations for solutions containing a subsidiaryamount of KCl in addition to NaCl. Since the granitesolidus is determined principally byaH2O at a givenT andP, the Ebadi and Johannes (1991) solidus curves for fixedH2O mole fraction in CO22H2O fluids determine corre-sponding solidus curves in NaCl2H2O fluids. It is fur-ther assumed that the minimum melt compositions in thepresence of chloride fluids are not greatly different fromthose under CO22H2O fluids. Experiments (Metrich andRutherford 1992; Shinohara et al. 1989) show that thechlorine content of brine-saturated silicate melts is neg-ligible above 2 kbar. TheaH2O2XH2O relations used byEbadi and Johannes (1991), based on the Redlich-Kwong equation of state, are adopted here, along withequations 8–10 of the present work, leading to the gran-ite solidus curves shown in Fig. 8.
The notable changes in dPydT slopes of the soliduscurves above two kbar are a predictable result of the greatdecrease of H2O activity in NaCl solutions at higherpressures. This behavior contrasts with that of theCO22H2O system, where H2O activity rises with in-creasing pressure at a given composition and tempera-
Fig. 8 Solidus curves in the simple granite system KAlSi3O8
(Or)2NaAlSi3O8 (Ab)2SiO2 (Qz)2H2O for NaCl solutions offixed XH2O
, calculated from the present activity-concentration re-lations in the NaCl2H2O system, and correspondingXH2O
curvesin the system CO22H2O (dashed), from Ebadi and Johannes(1991)
ture. Consequently, for a fluid of 50 mole percent H2O,the NaCl2H2O melting curve at 10 kbar lies 1058 Chigher than the corresponding CO22H2O melting curve.Melting curves of the two systems converge below 2 kbaras ideal solution behavior is approached in both fluidsystems.
An important consequence for petrology of theback-bending brine-granulite solidi is that concentrated chlo-ride solutions may stream freely through the lower crustat elevated temperatures without provoking extensivemelting, and can have H2O activity low enough to desta-bilize hydrous silicate minerals including biotite and am-phibole, while retaining the ability to exchange alkalis aswell as volatiles, in keeping with the concept of the alka-lis as mobile components in metamorphism (Korzhinskii1959). In all of these regards, the brines are conceptuallysuperior to CO22H2O solutions which, at equivalent H2Omole fractions, have higher H2O activity, lower granitesolidi, and greatly reduced solubilities of the silicateconstituents (Holloway 1971; Walther 1992). Moreover,aqueous salt solutions make very small contact angleswith silicate minerals in rocks at high temperatures andpressures and therefore have much greater infiltrationability than CO2-rich fluids, which make high contactangles with silicate minerals (Watson and Brenan 1987).
Acknowledgements This research was supported by a U.S. Na-tional Science Foundation grant,'EAR-9310264. The authors ac-knowledge helpful conversations and correspondence with LucasBaumgartner, Bill Glassley, Kirill Shmulovich, Jacques Touret,Volkmar Trommsdorff, Paul Wallace, John Walther, and PatWilliams. Constructive comments on the first draft of themanuscript by Bill Glassley and Tim Holland are also greatlyappreciated.
211
References
Akella J, Vaidya SN, Kennedy GC (1969) Melting of sodium chlo-ride at pressures to 65 kbar. Phys Rev 185: 1135–1140
Anderko A, Pitzer KS (1993) Equation-of-state representation ofphase equilibria and volumetric properties of the system Na-Cl2H2O above 573 K. Geochim Cosmochim Acta 57: 1657–1680
Aranovich LYa, Shmulovich KI, Fedkin VV (1987) The H2O andCO2 regime in regional metamorphism. Int Geol Rev 29: 1379–1401
Barnes HL, Ernst WG (1963) Ideality and ionization in hydrother-mal fluids: the system MgO2H2O2NaOH. Am J Sci 261: 129–150
Berman RG (1988) Internally-consistent thermodynamic datafor minerals in the system Na2O2K2O2CaO2MgO2FeO2Fe2O32Al2O32SiO22TiO22H2O2CO2. J Petrol 29: 445–522
Berman RG, Aranovich LY (1996) Optimized standard state andsolution properties of minerals: I. Model calibration forolivine, orthopyroxene, cordierite, garnet, and ilmenite in thesystem FeO2MgO2CaO2Al2O32TiO22SiO2. Contrib Min-eral Petrol (in press)
Bowers TS, Helgeson HC (1983) Calculation of the thermodynam-ic and geochemical consequences of nonideal mixing in thesystem H2O2CO22NaCl on phase relations in geologic sys-tems: equation of state of H2O2CO22NaCl fluids at high pres-sures and temperatures. Geochim Cosmochim Acta 47: 1247–1275
Bradley RS (1962) Thermodynamic calculations on phase equi-libria involving fused salts. Part I. General theory and applica-tion to equilibria involving calcium carbonate at high pressure.Am J Sci 260: 374–382
Burnham CW, Holloway JR, Davis NF (1969) Thermodynamicproperties of water to 10008 C and 10 000 bars. Geol Soc AmSpec Pap 132
Chou I-M, Sterner SM, Pitzer KS (1992) Phase relations in thesystem NaCl2KCl2H2O: IV. Differential thermal analysis ofthe sylvite liquidus in the KCl2H2O binary, the liquidus in theNaCl2KCl2H2O ternary, and the solidus in the NaCl2KClbinary to 2 kb pressure, and a summary of experimental datafor thermodynamic-PTX analysis of solid-liquid equilibria atelevated P–T conditions. Geochim Cosmochim Acta 56: 2281–2293
Clark SP Jr (1959) Effect of pressure on the melting point of eightalkali halides. J Chem Phys 31: 1526–1531
Dawson JB, Smith JV (1992) Potassium loss during metasomaticalteration of mica pyroxenite from Oldoinyo Lengai, northernTanzania: contrasts with fenitization. Contrib Mineral Petrol112: 254–260
DeJong G, Williams PJ (1995) Giant metasomatic system formedduring exhumation of mid-crustal Proterozoic rocks in thevicinity of the Cloncurry Fault, northern Queensland. Aust JEarth Sci 42: 281–290
Dernov-Pegarev VF, Bogomolova VI, Malinin SD (1989) The sol-ubility of brucite and forsterite in K2CO3 and Na2CO3 solu-tions at 300 and 4008 C as it relates to carbonatite formation.Geochem Int 26: 68–73
Ebadi A, Johannes W (1991) Beginning of melting and composi-tion of first melts in the system Qz2Ab2Or2H2O2CO2. Con-trib Mineral Petrol 106: 286–295
Franz G (1982) The brucite-periclase equilibrium at reduced H2Oactivities: some information about the system H2O2NaCl. AmJ Sci 282: 1325–1339
Graton LC (1940) Nature of the ore-forming fluids. Econ Geol35: 197–358
Gunter WD, Chou I-M, Girsperger S (1983) Phase relations in thesystem NaCl2KCl2H2O: differential thermal analysis of thehalite liquidus in NaCl2H2O binary above 4508 C. GeochimCosmochim Acta 47: 863–873
Holland TJB, Powell R (1990) An enlarged and updated internallyconsistent thermodynamic dataset with uncertainties and cor-relations: the system K2O2Na2O2CaO2MgO2MnO2FeO2Fe2O32Al2O32TiO22SiO22C2H22O2. J MetamorphicGeol 8: 89–124
Holloway JR (1971) Composition of fluid phase solutes in a basalt-H2O2CO2 system. Geol Soc Am Bull 62: 233–238
Iiyama JT (1965) Influence des anions sur les e´quilibres d’echanged’ions Na–K dans les feldspaths alcalins a` 6008 C sous unepression de 1000 bars. Bull Soc Fr Mine´ral Cristalogr 88: 618–622
Irving AJ, Huang W-L, Wyllie PJ (1977) Phase relations of port-landite, Ca(OH)2 and brucite, Mg(OH)2 to 33 kilobars. Amer JSci 277: 313–321
Johannes W, Metz P (1968) Experimentelle Bestimmung von Gle-ichgewichtsbeziehungen im System MgO2CO22H2O. NeuesJahrb Mineral Abh 112: 15–26
Keevil NB (1942) Vapor pressure of aqueous solutions at hightemperatures. J Am Chem Soc 64: 841–850
Kerrick DM, Jacobs GK (1981) A modified Redlich-Kwong equa-tion for H2O, CO2, and H2O2CO2 mixtures at elevated pres-sures and temperatures. Am J Sci 281: 735–767
Korzhinskii DS (1959) Physiochemical basis of the analysis of theparagenesis of minerals. Consultants Bureau, New York
Koster Van Groos AF (1991) Differential thermal analysis of theliquidus relations in the system NaCl2H2O to 6 kbar. GeochimCosmochim Acta 55: 2811–2817
Lowenstern JB (1994) Chlorine, fluid immiscibility, and de-gassing in peralkaline magmas from Pantelleria, Italy. AmMineral 79: 353–369
Marakushev AA, Shapovalov YuB (1994) Main problems of originof hydrothermal ore deposits (experimental investigations).Exp Geosci 3: 1–10
Metrich N, Rutherford MJ (1992) Experimental study of chlorinebehavior in hydrous silicic melts. Geochim Cosmochim Acta56: 607–616
Nijland TG, Jansen JBH, Maijer C (1993) Halogen geochemistryof fluid during amphibolite-granulite metamorphism as indi-cated by apatite and hydrous silicates in basic rocks from theBambleSector, South Norway, Lithos 30: 167–189
Oliver NHS (1995) Hydrothermal history of the Mary KathleenFold Belt, Mt. Isa Block, Queensland. Aust J Earth Sci 42:267–279
Pabalan RT, Pitzer KS (1990) Models for aqueous electrolyte mix-tures for systems extending from dilute solutions to fused salts.In: Melchior DC, Bassett RL (eds) Chemical Modeling ofAqueous Systems II, (American Chemical Society Series 416).American Chemical Society, Washington DC, pp 44–57
Pasteris JD, Harris TN, Sassari DC (1995) Interactions of mixedvolatile-brine fluids in rocks of the southwestern footwall ofthe Duluth Complex, Minnesota – evidence from aqueous fluidinclusions. Am J Sci 295: 125–172
Perchuk LL, Gerya TV (1993) Fluid control of charnockitization.Chem Geol 108: 175–186
Philipp RW (1988) Phasenbeziehungen im system MgO2H2O2CO22NaCl. Dipl Natur thesis, ETH-Zürich
Philippot P, Selverstone J (1991) Trace-element-rich brines ineclogitic veins: implications for fluid composition and trans-port during subduction. Contrib Mineral Petrol 106: 417–430
Pitzer KS, Simonson JM (1986) Thermodynamics of multicompo-nent, miscible ionic systems: theory and equations. J PhysChem 90: 3005–3009
Quist AS, Marshall WL (1968) Electrical conductances ofaqueous sodium chloride solutions from 0 to 8008 C and atpressures up to 4000 bars. J Phys Chem 72: 684–703
Robie RA, Hemingway BS, Fisher JR (1978) Thermodynamicproperties of minerals and related substances at 298.158 K and1 bar (105 pascals) pressure and at higher temperatures. USGeol Surv Bull 1452: 1–456
Roedder E (1971) Fluid inclusion studies on porphyry-type oredeposits at Bingham, Utah, Butte, Montana, and Climax, Colo-rado. Econ Geol 66: 98–120

212
Samson IM, Liu W, Williams-Jones AE (1995) The nature of or-thomagmatic fluids in the Oka carbonatite, Quebec, Canada:evidence from fluid inclusions. Geochim Cosmochim Acta59: 1963–1977
Schranke JA, Kerrick DM, Blencoe JG (1982) Experimental deter-mination of the brucite-periclase equilibrium with a new volu-metric technique. Am Mineral 67: 269–276
Sciuto PF, Ottonello G 81995) Water-rock interaction on ZabargadIsland, Red Sea – a case study: I. Application of the concept oflocal equilibrium. Geochim Cosmochim Acta 59: 2187–2206
Sharp WE (1962) The thermodynamic functions for water in range210 to 10008 C and 1 to 250 000 bars. University of California,Ernest O. Lawrence Radiation Laboratory Publication UCRL-718 (Chemistry, UC-4)
Shinohara H, Iiyama JT, Matsuo S (1989) Partition of chlorinecompounds between silicate melt and hydrothermal solutions.II. Partition of NaCl2H2O. Geochim Cosmomich Acta 53:2617–2630
Shmulovich KI (1988) Carbon dioxide in high-temperature pro-cesses of mineral formation (in Russian). Nauka Press,Moscow
Shmulovich KI, Shmonov VM, Zharikov VA (1982) The thermo-dynamics of supercritical fluid systems. In: Saxena SK (eds)Advances in physical geochemistry. Springer, Berlin Heidel-berg New York, pp 173–190
Shmulovich KI, Tkachenko SI, Plyasunova NV (1995) Phase equi-libria in fluid systems at high pressures and temperatures. In:Shmulovich KI, Yardley BWD, Gonchar GG (eds) Fluids in theCrust. Chapman and Hall, London, pp 193–214
Simonson JM, Pitzer KS (1986) Thermodynamics of multicompo-nent, miscible, ionic systems: the system LiNO32KNO32H2O.J Phys Chem 90: 3009–3013
Smith FG (1948) Transport and deposition of the non-sulphidevein minerals. III. Phase relations at the pegmatitic stage. EconGeol 43: 535–546
Sourirajan S, Kennedy GC (1962) The system H2O2NaCl at ele-vated temperatures and pressures. Am J Sci 260: 115–141
Sterner SM, Chou I-M, Downs RT, Pitzer KS (1992) Phase rela-tions in the system NaCl2KCl2H2O: V. Thermodynamic-PTXanalysis of solid-liquid equilibria at high temperatures andpressures. Geochim Cosmochim Acta 56: 2295–2309
Touret JLR (1985) Fluid regime in southern Norway: the record offluid inclusions. In: Tobi AC, Touret JRL (eds) The deepProterozoic crust in the North Atlantic provinces. Reidel, Dor-drecht, pp 517–549
Touret JRL (1995) Brines in granulites: the other fluid. (abstract).ECROFI (European Conference on Fluid Inclusions), Barce-lona, June 1995
Walther JV (1992) Ionic association in H2O2CO2 fluids at mid-crustal conditions. J Metamorphic Geol 10: 789–797
Watson ED, Brenan JM (1987) Fluids in the lithosphere, 1. Exper-imentally-determined wetting characteristics of CO22H2Ofluids and their implications for fluid transport, host-rockphysical properties, and fluid inclusion formation. EarthPlanet Sci Lett 85: 497–515
Weres O, Tsao L (1986) Activity of water mixed with molten saltsat 3178 C. J Phys Chem 90: 3014–3018