gut microbiota composition correlates with diet and health
TRANSCRIPT

ARTICLEdoi:10.1038/nature11319
Gut microbiota composition correlateswith diet and health in the elderlyMarcus J. Claesson1,2*, Ian B. Jeffery1,2*, Susana Conde3, Susan E. Power1, Eibhlıs M. O’Connor1,2, Siobhan Cusack1,Hugh M. B. Harris1, Mairead Coakley4, Bhuvaneswari Lakshminarayanan4, Orla O’Sullivan4, Gerald F. Fitzgerald1,2,Jennifer Deane1, Michael O’Connor5,6, Norma Harnedy5,6, Kieran O’Connor6,7,8, Denis O’Mahony5,6,8, Douwe van Sinderen1,2,Martina Wallace9, Lorraine Brennan9, Catherine Stanton2,4, Julian R. Marchesi10, Anthony P. Fitzgerald3,11, Fergus Shanahan2,12,Colin Hill1,2, R. Paul Ross2,4 & Paul W. O’Toole1,2
Alterations in intestinal microbiota composition are associated with several chronic conditions, including obesity andinflammatory diseases. The microbiota of older people displays greater inter-individual variation than that of youngeradults. Here we show that the faecal microbiota composition from 178 elderly subjects formed groups, correlating withresidence location in the community, day-hospital, rehabilitation or in long-term residential care. However, clusteringof subjects by diet separated them by the same residence location and microbiota groupings. The separation of microbiotacomposition significantly correlated with measures of frailty, co-morbidity, nutritional status, markers of inflammationand with metabolites in faecal water. The individual microbiota of people in long-stay care was significantly less diversethan that of community dwellers. Loss of community-associated microbiota correlated with increased frailty.Collectively, the data support a relationship between diet, microbiota and health status, and indicate a role fordiet-driven microbiota alterations in varying rates of health decline upon ageing.
The gut microbiota is required for development and for homeostasis inadult life. Compositional changes have been linked with inflammatoryand metabolic disorders1, including inflammatory bowel disease2,3,irritable bowel syndrome4,5 and obesity6 in adults. The compositionof the human intestinal microbiota is individual-specific at the level ofoperational taxonomic units (OTUs) and stable over time in healthyadults7. The composition of the intestinal microbiota in older people(.65 years) is extremely variable between individuals8, and differsfrom the core microbiota and diversity levels of younger adults8,9. Afeature of the ageing process is immunosenescence, evidenced bypersistent NF-kB-mediated inflammation and loss of naive CD41
T cells10. The microbiota is pivotal for homeostasis in the intestine11,and chronic activation of the innate and adaptive immune system islinked to immunosenescence12. Correlations have previously beenmade between specific components of the microbiota and pro-inflammatory cytokine levels, but these did not separate young adultsfrom older people9. Alterations in the microbiota composition havealso been associated with frailty13, albeit in a small cohort from a singleresidence location.
Deterioration in dentition, salivary function, digestion and intestinaltransit time14 may affect the intestinal microbiota upon ageing. Acontrollable environmental factor is diet, which has been shown toinfluence microbiota composition in animal models, in small-scalehuman studies15–20 and over the longer term21. However, links betweendiet, microbiota composition and health in large human cohorts areunclear. To test the hypothesis that variation in the intestinal micro-biota of older subjects has an impact on immunosenescence andfrailty across the community, we determined the faecal microbiotacomposition in 178 older people. We also collected dietary intakeinformation, and measured a range of physiological, psychological
and immunological parameters. Dietary groupings were associatedwith separations in the microbiota and health data sets; the healthiestpeople live in a community setting, eat differently and have a distinctmicrobiota from those in long-term residential care. Measures ofincreased inflammation and increased frailty support a diet–microbiota link to these indicators of accelerated ageing, and suggesthow dietary adjustments could promote healthier ageing by modulat-ing the gut microbiota.
Microbiota and residence locationWe previously identified considerable inter-individual variability inthe faecal microbiota composition of 161 older people ($65 years),including 43 receiving antibiotics8. To investigate links between diet,environment, health and microbiota, we analysed 178 subjects, non-antibiotic-treated, for whom we also had dietary information, andstratified by community residence setting: (1) community-dwelling,n 5 83; (2) attending an out-patient day hospital, n 5 20; (3) in short-term (,6 weeks) rehabilitation hospital care, n 5 15; (4) in long-termresidential care (long-stay), n 5 60. The mean subject age was 78( 6 8 s.d.) years, with a range of 64 to 102 years, and all were ofCaucasian (Irish) ethnicity. We included 13 young adults with a meanage of 36 ( 6 6 s.d.) years. We generated 5.4 million sequence readsfrom 16S rRNA gene V4 amplicons, with an average of 28,099( 6 10,891 s.d.) reads per subject.
UniFrac b-diversity analysis indicates the extent of similaritybetween microbial communities22. UniFrac PCoA (principalco-ordinate) analysis of 47,563 OTUs (grouped at 97% sequenceidentity) indicated a clear separation between community-dwellingand long-stay subjects using both weighted and un-weighted analysis(Fig. 1a, b). Microbiota from the 13 younger controls clustered with
1Department of Microbiology, University College Cork, Ireland. 2Alimentary Pharmabiotic Centre, University College Cork, Ireland. 3Department of Statistics, University College Cork, Ireland. 4Teagasc,Moorepark Food Research Centre, Moorepark, Fermoy, Co, Cork, Ireland. 5Cork University Hospital, Wilton, Cork, Ireland. 6St. Finbarr’s Hospital, Douglas Road, Cork, Ireland. 7Mercy University Hospital,Grenville Place, Cork, Ireland. 8South Infirmary, Victoria University Hospital, Cork, Ireland. 9Institute of Food and Health, University College Dublin, Ireland. 10School of Biosciences, Cardiff University,Museum Avenue, Cardiff CF10 3AT, UK. 11Department of Epidemiology and Public Health, University College Cork, Ireland. 12Department of Medicine, University College Cork, Ireland.*These authors contributed equally to this work.
1 7 8 | N A T U R E | V O L 4 8 8 | 9 A U G U S T 2 0 1 2
Macmillan Publishers Limited. All rights reserved©2012
community-dwelling subjects. Eighteen other non-UniFracb-diversitymetrics supported microbiota separation by residence location(Supplementary Fig. 1).
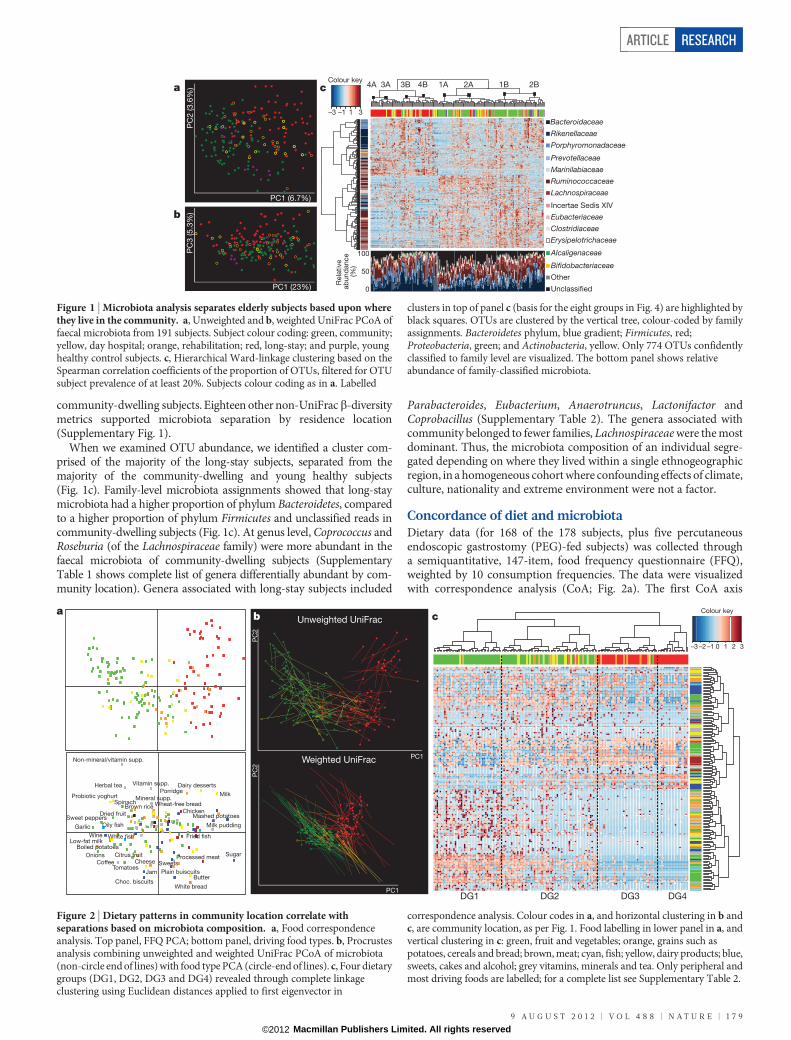
When we examined OTU abundance, we identified a cluster com-prised of the majority of the long-stay subjects, separated from themajority of the community-dwelling and young healthy subjects(Fig. 1c). Family-level microbiota assignments showed that long-staymicrobiota had a higher proportion of phylum Bacteroidetes, comparedto a higher proportion of phylum Firmicutes and unclassified reads incommunity-dwelling subjects (Fig. 1c). At genus level, Coprococcus andRoseburia (of the Lachnospiraceae family) were more abundant in thefaecal microbiota of community-dwelling subjects (SupplementaryTable 1 shows complete list of genera differentially abundant by com-munity location). Genera associated with long-stay subjects included
Parabacteroides, Eubacterium, Anaerotruncus, Lactonifactor andCoprobacillus (Supplementary Table 2). The genera associated withcommunity belonged to fewer families, Lachnospiraceae were the mostdominant. Thus, the microbiota composition of an individual segre-gated depending on where they lived within a single ethnogeographicregion, in a homogeneous cohort where confounding effects of climate,culture, nationality and extreme environment were not a factor.
Concordance of diet and microbiotaDietary data (for 168 of the 178 subjects, plus five percutaneousendoscopic gastrostomy (PEG)-fed subjects) was collected througha semiquantitative, 147-item, food frequency questionnaire (FFQ),weighted by 10 consumption frequencies. The data were visualizedwith correspondence analysis (CoA; Fig. 2a). The first CoA axis
PC1 (6.7%)P
C2 (3.6
%)
PC
3 (5.3
%)
PC1 (23%)
a
b
c
Bacteroidaceae
Rikenellaceae
Porphyromonadaceae
Prevotellaceae
Marinilabiaceae
Ruminococcaceae
Lachnospiraceae
Incertae Sedis XIV
Eubacteriaceae
Clostridiaceae
Erysipelotrichaceae
Alcaligenaceae
Bifidobacteriaceae
Other
Unclassified
–3 –1 1 3
Colour key
.
4A 3A 3B 4B 1A 2A 1B 2B
0
100
Rela
tive
ab
und
ance
(%
)
50
Figure 1 | Microbiota analysis separates elderly subjects based upon wherethey live in the community. a, Unweighted and b, weighted UniFrac PCoA offaecal microbiota from 191 subjects. Subject colour coding: green, community;yellow, day hospital; orange, rehabilitation; red, long-stay; and purple, younghealthy control subjects. c, Hierarchical Ward-linkage clustering based on theSpearman correlation coefficients of the proportion of OTUs, filtered for OTUsubject prevalence of at least 20%. Subjects colour coding as in a. Labelled
clusters in top of panel c (basis for the eight groups in Fig. 4) are highlighted byblack squares. OTUs are clustered by the vertical tree, colour-coded by familyassignments. Bacteroidetes phylum, blue gradient; Firmicutes, red;Proteobacteria, green; and Actinobacteria, yellow. Only 774 OTUs confidentlyclassified to family level are visualized. The bottom panel shows relativeabundance of family-classified microbiota.
PC1
PC
2
Unweighted UniFrac
PC1
PC
2
Weighted UniFrac
b
Chicken
Processed meat
Fried fish
Oily fish
White bread
Wheat-free bread
Porridge
Boiled potatoes
Mashed potatoes
Brown rice
Dairy desserts
Cheese Citrus fruit
Dried fruit
Spinach
Onions
Garlic
Sweet peppers
Tomatoes
Choc. biscuits
Sweets
Sugar
Jam
Herbal tea
Milk
Low-fat milk
Coffee
Wine
Vitamin supp.
Mineral supp.
Non-mineral/vitamin supp.
ButterPlain buiscuits
Probiotic yoghurt
Milk pudding
White fish
c
–3 –2 –1 0 1 2 3
Colour key
DG4 DG3 DG2 DG1
a
Figure 2 | Dietary patterns in community location correlate withseparations based on microbiota composition. a, Food correspondenceanalysis. Top panel, FFQ PCA; bottom panel, driving food types. b, Procrustesanalysis combining unweighted and weighted UniFrac PCoA of microbiota(non-circle end of lines) with food type PCA (circle-end of lines). c, Four dietarygroups (DG1, DG2, DG3 and DG4) revealed through complete linkageclustering using Euclidean distances applied to first eigenvector in
correspondence analysis. Colour codes in a, and horizontal clustering in b andc, are community location, as per Fig. 1. Food labelling in lower panel in a, andvertical clustering in c: green, fruit and vegetables; orange, grains such aspotatoes, cereals and bread; brown, meat; cyan, fish; yellow, dairy products; blue,sweets, cakes and alcohol; grey vitamins, minerals and tea. Only peripheral andmost driving foods are labelled; for a complete list see Supplementary Table 2.
ARTICLE RESEARCH
9 A U G U S T 2 0 1 2 | V O L 4 8 8 | N A T U R E | 1 7 9
Macmillan Publishers Limited. All rights reserved©2012

described over 11% of the data set variance and most differences infood consumption between community-dwelling and long-stay sub-jects. The most discriminating food types were vegetables, fruit andmeat, whose consumption changed in a gradual manner along thefirst eigenvector. Procrustes analysis of the FFQ and the microbiotab-diversity was used to co-visualize the data (Fig. 2b). Separationsbased on either diet or microbiota co-segregated along the firstaxis of both data sets (unweighted and weighted UniFrac, Fig. 2b;Monte-Carlo P value , 0.0001). Application of complete linkageclustering and Euclidean distances to the first eigenvector (Fig. 2c)revealed four dietary groups (DGs). DG1 (‘low fat/high fibre’) andDG2 (‘moderate fat/high fibre’) included 98% of the community andday hospital subjects, and DG3 (‘moderate fat/low fibre’) and DG4(‘high fat/low fibre’) included 83% of the long-stay subjects. For acomplete description of dietary groups, see Supplementary Notesand Supplementary Table 3.
The healthy food diversity index (HFD23) positively correlated withthree microbiota diversity indices (Supplementary Fig. 2a), and allfour indices showed significant differences between community andlong-stay subjects (Supplementary Fig. 2b), indicating that a healthy,diverse diet promotes a more diverse gut microbiota. Analysing bydietary groups rather than residence location confirmed that bothmicrobiota and diet were most diverse in DG1, and least diverse inDG3 and DG4 (Supplementary Fig. 3). Procrustes analysis similarlyshowed that the dietary groups were associated with separations inmicrobiota composition (Supplementary Fig. 3). Furthermore, themicrobiota was associated with the duration in long-stay, withresidents of more than a year having a microbiota that was furthestseparated from community-dwelling subjects (Supplementary Fig. 4).For the majority of these longer-term residents, the diet was differentfrom that in more recently admitted subjects (Supplementary Fig. 4).Examination of duration of care (Supplementary Fig. 4c) showed thatdiet changed more quickly than the microbiota did; both diet andmicrobiota moved in the direction away from the community types.After 1 month in long stay, all subjects had a long-stay diet, but it tooka year for the microbiota to be clearly the long-stay type. Collectivelythe data indicate that the composition of the microbiota is determinedby the composition and diversity of the diet.
Community setting and faecal metabolomeFaecal metabolites correlate with microbiota composition andinflammatory scores in Crohn’s disease24. We therefore performedmetabolomic analysis (NMR spectroscopy) of faecal water from 29
subjects, representative (by UniFrac) of three community settings.(Day-hospital subjects grouped closely to community dwellers bymicrobiota and dietary analysis, and were not included.) A represent-ative NMR profile is presented in Supplementary Fig. 5. Initial PCA(principal component analysis) analysis showed a trend for separationaccording to community setting (data not shown). Pair-wise statisticalmodels were therefore constructed according to the cluster groups.Valid and robust models were obtained for comparison of NMRspectra from community and long-stay subjects, and communityand rehabilitation subjects (Fig. 3). The major metabolites separatingcommunity from long-stay subjects were glucose, glycine and lipids(higher levels in long-stay than community subjects), and glutarate andbutyrate (higher levels in community subjects). Co-inertia analysis ofthe genus-level microbiota and metabolome data revealed a significantrelationship (P value , 0.01) between the two data sets (Supplemen-tary Fig. 6 and Supplementary Notes). Notwithstanding three long-stay subjects, a diagonal separated community from long-stay in bothmicrobiota and metabolome data sets. Other metabolites of interestwere acetate, propionate and valerate, which were more abundant incommunity dwellers (Supplementary Fig. 6).
To investigate microbial short-chain fatty acid (SCFA) productionfurther, the frequency of microbial genes for SCFA production wasinvestigated by shotgun metagenomic sequencing. We sequenced125.9 gigabases (Gb) of bacterial DNA from 27 of the 29 subjects,and assembled contigs with a total length of 2.20 Gb, containing2.51 million predicted genes (Supplementary Table 4). Consistentwith reduced microbiota diversity (Supplementary Fig. 3), there weresignificantly fewer total genes predicted, and higher N50 values (N50is the length of the smallest contig that contains the fewest (largest)contigs whose combined length represents at least 50% of the assembly),in the assembled metagenomic data of long-stay subjects compared torehabilitation or community subjects (Supplementary Fig. 7). Themetagenomes were then searched for key microbial genes in butyrate,acetate and propionate production, revealing significantly higher genecounts and coverage for butyrate- and acetate-producing enzymes(BCoAt and ACS, respectively) in community and rehabilitation com-pared to long-stay subjects (Supplementary Fig. 8 and SupplementaryTable 5). There was also significantly higher coverage of the propionate-related genes (PCoAt) in community compared to long-stay subjects,but the higher gene count was not significant (Supplementary Table 5).These observations are consistent with the association of butyrate,acetate and propionate and the direction of the main split betweenlong-stay and community subjects in the metabolome; candidate
–0.6
–0.4
–0.2
0.0
0.2
0.4
0.6
–1.2 –0.8 –0.4 –0.0 0.4 0.8 1.2
t 2
t1
a
–0.8
–0.6
–0.4
–0.2
0.0
0.2
0.4
0.6
0.8b
–0.4 0.0 0.4 0.60.2–0.2–0.6
t 2
t1
Figure 3 | PLS-DA plots of 1H NMR spectra of faecal water fromcommunity, long-stay and rehabilitation subjects. a, Community subjects(green) versus long-stay subjects (red); R2 5 0.517, Q2 5 0.409, two-component model. b, Community subjects (green) versus rehabilitationsubjects (orange); R2 5 0.427, Q2 5 0.163, two-component model. The ellipsesrepresent the Hotellings T2 with 95% confidence. To confirm the validation ofthe model, permutation tests (n 5 1,000) were performed. For model a, the 95%
confidence interval for the misclassification error rate (MER) was (0.43, 0.57).Using the PLS-DA model on the data resulted in an MER of 0.2 which is outsidethe 95% confidence interval obtained for random permutation tests, thusvalidating the model. For model b, using permutation testing the 95%confidence interval for the MER was (0.45, 0.55). Using the PLS-DA model onthe data resulted in an MER of 0.16 which is outside the 95% confidence intervalobtained for random permutation tests.
RESEARCH ARTICLE
1 8 0 | N A T U R E | V O L 4 8 8 | 9 A U G U S T 2 0 1 2
Macmillan Publishers Limited. All rights reserved©2012

genera associated include Ruminococcus and Butyricicoccus forbutyrate production (Supplementary Fig. 6), but require validationin larger cohorts. Microbiota function deduced from the metagenomethus corresponded to the measured metabolome for at least one keymetabolite that can affect health25.
Microbiota–health correlationsMarkers of inflammation (serum TNF-a, IL-6 and IL-8 andC-reactive protein (CRP)) had significantly higher levels in long-stayand rehabilitation subjects than in community dwellers (Supplemen-tary Fig. 9). Long-stay subjects also scored poorly for diverse healthparameters (Supplementary Tables 6 and 7), including the Charlson co-morbidity index (CCI, a robust predictor of survival encompassing 19medical conditions26), the geriatric depression test (GDT), the Barthelindex27, functional independence measure (FIM28), mini-mental stateexam (MMSE29) and mini nutritional assessment (MNA30).
Correlations between health parameters and microbiota composi-tion were examined using quantile (median) regression tests, adjustedfor gender, age and community setting with an additive model (Sup-plementary Methods). Median regression gives less weight to extremevalues than the linear regression based on ordinary least squares andconsequently, is less influenced by outliers. The model was adjusted formedications that might influence the tested parameters (Supplemen-tary Table 8). The effect of medication was generally small (Supplemen-tary Table 8). Because ethnicity was exclusively Irish Caucasian it didnot require model adjustment. The microbiota composition did notdiffer for males and females after adjusting for age and location.
Significant associations between several health/frailty measure-ments and the major separations from microbiota UniFrac analysis(Fig. 1) are shown in Table 1. For example, a positive change in
microbiota along the full range of the PC1 axis in the un-weightedUniFrac PCoA for long-stay-only subjects was associated withinflammation (CRP increase of 13.9 mg l21), and other inflammatorymarkers significantly correlated with microbiota (IL-6 and IL-8,whole cohort). As expected, there was minimal variability amongstcommunity-dwelling subjects, but within the long-stay subjects themost significant associations were related to functional independence(FIM), Barthel index and nutrition (MNA), followed by blood pres-sure and calf circumference. The latter may be attributable to theinfluence of diet and/or the microbiota on muscle mass, sarcopaenia31
and thereby on frailty. This was supported by investigation of linkagebetween frailty and faecal metabolites (probabilistic principal compo-nents and covariates analysis; PPCCA32). Thus, the FIM and Barthelindices were significant covariates with the faecal water metabolome(Supplementary Fig. 10) and levels of acetate, butyrate and propionateincreased with higher values of both indices (that is, less frail subjects).Among community-dwelling subjects, there was also a strong asso-ciation between microbial composition and nutrition (MNA) and aweaker link with blood pressure, for which a relationship with themicrobiota has previously been established33. There was no correla-tion between the Bacteroidetes:Firmicutes ratio and body mass index(BMI), although there was a correlation with overall microbiota inlong-stay subjects. Measures for the geriatric depression test (GDT)showed significant microbiota association with PCoA axis 2 (Table 1).We detected no significant confounding of microbiota–health corre-lations due to medications, antibiotic treatment (before the 1-monthexclusion window), and diet–health correlations separate fromdietary impact on microbiota (Supplementary Notes).
Taken together, the major trends in the microbiota that separatedhealthy community subjects from less healthy long-stay subjects were
Table 1 | Regression tests of associations between clinical measurements and microbiota composition.a Unweighted UniFrac PCoA for all four residence locations
Parameter PC1 PC2 PC3
RC range RC s.d. P RC range RC s.d. P RC range RC s.d. P
GDT –0.42 –0.11 0.6 –2.7 –0.54 0.037 0.18 0.04 0.84Diastolic blood pressure 0.97 0.25 0.81 –10.1 –2.02 0.033 –14.2 –3.1 0.001Weight –14.6 –3.8 0.033 –7.16 –1.43 0.27 –1.57 –7.2 0.18CC –3.9 –1.01 0.022 –2.9 –0.58 0.19 –3.2 –0.7 0.047IL-6 6.71 1.7 0.006 6.1 1.22 0.007 2.08 0.45 0.2IL-8 4.23 1.1 0.43 13.6 2.7 0.03 4.06 0.89 0.47376716TNF-a 1.1 0.28 0.31 0.62 0.13 0.72 3.9 0.9 0.0005
b Unweighted UniFrac PCoA for community-only subjects
Parameter PC1 PC2 PC3
RC range RC s.d. P RC range RC s.d. P RC range RC s.d. P
MNA –1.1 –0.26 0.29 1.9 0.5 0.006 0.7 0.14 0.59Diastolic blood pressure –8.4 –1.98 0.08 14.3 3.4 0.035 –15.72 –3.26 0.13GDT –0.13 –0.03 0.8 –1.5 –0.35 0.02 –0.8 –0.16 0.4
c Unweighted UniFrac PCoA for long-stay-only subjects
Parameter PC1 PC2 PC3
RC range RC s.d. P RC range RC s.d. P RC range RC s.d. P
Barthel –6 –1.5 0.004 –4.8 –1.3 0.036 –0.6 –0.15 0.71FIM –30.8 –7.8 0.046 –33.3 –4.7 0.024 –2.42 –0.6 0.86MMSE –12.15 –3.08 0.14 –18.4 –4.8 0.009 3.22 0.8 0.63MNA –3.87 –0.98 0.23 –11.2 –3 0.004 –0.02 –0.005 0.99BMI –1.2 –0.31 0.69 –5 –1.3 0.047 –0.24 –0.06 0.92CC 0.2 0.05 0.93 –6.8 –1.77 0.0016 0.45 0.11 0.82Diastolic blood pressure 19.3 4.9 0.015 –12.4 –3.24 0.034 –15.4 –3.81 0.007Systolic blood pressure 36.5 9.3 0.007 –1.57 –0.41 0.83 –2.05 –0.51 0.87Weight –3.2 –0.81 0.69 –12.7 –3.3 0.024 –2.48 –0.61 0.72IL-8 –2.56 –0.65 0.78 22.31 5.84 0.006 1.14 0.28 0.93CRP 13.9 3.53 0.02 –3.01 –0.8 0.27 –2.54 –0.63 0.61
Quantile (median) regression tests of associations between clinical measurements and microbiota composition as measured by unweighted UniFrac PCoA across all four residence locations (that is, all subjects(a), community-only subjects (b) and long-stay-only subjects (c)). Column headings are: RC range, regression coefficients scaled to the full variation along each PCoA axis, thus indicating relative magnitude anddirection of the health association; RC s.d., regression coefficients scaled to one standard deviation; P, quantile regression P values generated by boot-strap analysis. Significant associations are in bold. An additivemodel was used to adjust for the effects of age, sex, residence location, relevant medication and the two other principal coordinates. CC, calf circumference; IL, interleukin; MMSE, mini-mental state examination.
ARTICLE RESEARCH
9 A U G U S T 2 0 1 2 | V O L 4 8 8 | N A T U R E | 1 8 1
Macmillan Publishers Limited. All rights reserved©2012

associated with markers for increased frailty and poorer health,having adjusted for gender, age and location. Because location largelydetermines diet (Fig. 2), adjusting for location reduces the effect ofdiet, and as there was also clear evidence for microbiota–health asso-ciations within the long-stay setting, we infer that the causal relation-ship is in a diet–microbiota–health direction.
Microbiota structure and healthy ageingGut microbiota can be assigned to one of three enterotypes34, driven byBacteroides, Prevotella and Ruminococcus species. A recent studydetected only the Bacteroides and Prevotella enterotypes, which wereassociated with diets rich in protein and carbohydrate, respectively21.Using those methods, we predicted an optimal number of two clustersusing five out of six methodologies, albeit with weaker support thanprevious studies (Supplementary Fig. 11). In line with a previousstudy21, the two clusters associated with Bacteroides and Prevotella,but not with Ruminococcus. Although enterotype assignments fromthe three approaches were very different (Supplementary Fig. 11),community subjects were more frequently of the Prevotella enterotype.
To identify patterns in the microbiota, we established co-abundanceassociations of genera (Supplementary Fig. 12a), and then clusteredcorrelated genera into six co-abundance groups (CAGs) (Supplemen-tary Fig. 12b). These are not alternatives to enterotypes, which aresubject-driven and poorly supported in this elderly cohort, but theydescribe the microbiota structures found across the subject groups instatistically significant co-abundance groups (Supplementary Notes).The dominant genera in these CAGs were Bacteroides, Prevotella,
Ruminococcus, Oscillibacter, Alistipes and the central OdoribacterCAG. These CAG relationships are termed Wiggum plots, in whichgenus abundance can be represented as discs proportional to abund-ance (Supplementary Fig. 12), to normalized over-abundance (Fig. 4),or to differential over-abundance (Supplementary Fig. 13). In theWiggum plot corresponding to the whole cohort (SupplementaryFig. 12), the path away from the Ruminococcus CAG towardsthe Oscillibacter CAG shows a reduced number of genera that makebutyrate, and an increased number able to metabolize fermentationproducts.
To simplify the microbiota data for health correlation, we used theeight subject divisions identified by OTU clustering (Fig. 1c). Theseeight divisions were superimposed on a UniFrac PCoA analysis of thedata in Fig. 1a, defining 8 subject groups (Fig. 4, Groups 1A through4B). These are separation points within a microbiota compositionspectrum that represent groups of individuals who have significantlydifferent microbiota as defined by the permutation multivariate ana-lysis of variance (MANOVA) test on unweighted UniFrac data. Wethen constructed individual Wiggum plots for the microbiota in these8 groups (Fig. 4). The transition from healthy community-dwellingsubjects, to frail long-term care residents, is accompanied by distinctiveCAG dominance, most significantly in abundances of Prevotella andRuminococcus CAGs (community associated CAGs) and Alistipes andOscillibacter CAGs (long-stay-associated CAGs).
Our analysis of Fig. 4 suggested two paths from community-associated health to long-stay-associated frailty (plot 1A–4A, and1B–4B), which were examined with reference to health correlations
4A
3B
2A
1B
1A
2B
4B
3A
WeightCC
GDTDiastolic BP
IL-8IL-6
25
4B
OxobacterLutispora
Eubacterium
AnaerotruncusLactococcus
Eggerthella
Actinomyces LactobacillusLeuconostoc
Lactonifactor
Ethanoligenens
Akkermansia
Sharpea
Bacteroides
VeillonellaBlautia
Streptococcus
Acetanaerobacterium
Dorea
Anaerofilum
Escherichia/ShigellaCoprobacillus
MNADiastolic BP
GDT
1B
2A
1A
3A
4B
3B 2B
2A
ParaprevotellaSyntrophococcus
Escherichia/Shigella
Desulfovibrio
RobinsoniellaRikenella
Oscillibacter Acetivibrio
Sporobacter
Acetitomaculum
Acidaminobacter
Acidaminococcus
Eubacterium
Butyricimonas
ParasutterellaBarnesiella
Oribacterium
AnaerosporobacterCoprococcus
CatenibacteriumParasporobacterium
SarcinaLachnobacteriumPeptococcus
NatronincolaClostridium
Sporacetigenium
Bulleidia
Herbaspirillum
PrevotellaAnaerophaga
Cerasicoccus
46
HydrogenoanaerobacteriumAlkaliphilus
Akkermansia
Methanobrevibacter
Howardella
Victivallis
IL-6
red
Diastolic BPCRP
BarthelFIMMNACCMMSEWeightBMIDiastolic BP
Systolic BP
4A
4B
3B
2B
1B
2A
IL-8
BarthelFIM 3A
9
4A
EubacteriumSubdoligranulum
LutisporaAnaerotruncus
LeuconostocWeissella
Coprobacillus
EthanoligenensRikenella
Mogibacterium
Acetivibrio
Akkermansia
Tepidibacter
Anaerovorax
Anaerostipes
Papillibacter
Sedimentibacter
Cloacibacillus
Parabacteroides
Anaerofilum
Barnesiella
Holdemania
Methanobrevibacter
Desulfovibrio
Phascolarctobacterium
Lactonifactor
Eggerthella
3A
ButyricimonasHespellia
OdoribacterWeissella
Anaerotruncus
Lutispora
LactonifactorBifidobacterium
Tepidibacter
Alistipes
Sedimentibacter
Papillibacter
Peptococcus
ClostridiumVictivallis
24
AnaerofilumAcetanaerobacterium
Coprobacillus
Ethanoligenens
Rikenella
Sporobacter
AcetivibrioAnaerovorax
Acidaminobacter
Parabacteroides
Robinsoniella
Akkermansia
MethanobrevibacterCloacibacillus
Holdemania
Eggerthella
3B
Roseburia
OxobacterLactococcus
Weissella
Lactonifactor
LeuconostocActinomyces
Rothia
Rikenella
Mogibacterium
Oscillibacter
Asaccharobacter
Streptococcus
Bacteroides
Sharpea
Moryella
AnaerofilumEubacterium
Alistipes
DoreaAcetanaerobacterium
Parabacteroides
ActinobacillusOribacterium
Parasutterella
SutterellaDialister
Pseudobutyrivibrio
Clostridium
16
Lactobacillus
Bifidobacterium
Odoribacter Escherichia/Shigella
BlautiaButyricicoccus
Barnesiella
Coprobacillus
Veillonella
2B
Parabacteroides
Sedimentibacter
Subdoligranulum
Sarcina Odoribacter
Bifidobacterium
Phascolarctobacterium
BarnesiellaActinobacillus
Oribacterium
Ruminococcus
Coprococcus
ButyricicoccusDialister Anaerosporobacter
Bacteroides
Blautia
FaecalibacteriumAnaerostipes
Moryella
22
Catenibacterium Roseburia
Sutterella
33
1BActinobacillus
Parasutterella
OribacteriumRuminococcus
Roseburia
Streptophyta
Syntrophococcus
Subdoligranulum
LeuconostocWeissella
Actinomyces
Rothia
Oscillibacter
Sporobacter
Anaerostipes
VeillonellaFaecalibacterium Streptococcus
AsaccharobacterBlautia
Moryella
Anaerofilum
HespelliaButyricimonas
Odoribacter
Barnesiella
PseudobutyrivibrioDialister
Anaerophaga
Hydrogenoanaerobacterium
Prevotella
Lachnobacterium
Bulleidia Natronincola
Coprococcus
Clostridium
Sporacetigenium
Howardella
ButyricicoccusCatenibacterium
Parasporobacterium
1A
16
Ruminococcus
Phascolarctobacterium
Streptophyta
Paraprevotella
Bifidobacterium
Robinsoniella
Acidaminococcus
Rothia
EthanoligenensAcetivibrio
Anaerovorax
Acidaminobacter
Mogibacterium
Oscillibacter
Sporobacter
Methanobrevibacter
Anaerostipes
Veillonella
ActinobacillusSutterella
Oribacterium
Dialister
Lachnobacterium
CatenibacteriumButyricicoccus
CoprococcusPseudobutyrivibrio
Anaerophaga
Hydrogenoanaerobacterium
Prevotella
Herbaspirillum
Bulleidia
Peptococcus
Cerasicoccus NatronincolaClostridium
Sporacetigenium
Victivallis Alkaliphilus
Howardella
Parasporobacterium
Figure 4 | Transition in microbiota composition across residence location ismirrored by changes in health indices. The PCoA plots show 8 groups ofsubjects defined by unweighted UniFrac microbiota analysis of communitysubjects (left), the whole cohort (centre), and long-stay subjects (right). Themain circle shows the Wiggum plots corresponding to the 8 groups fromwhole-cohort analysis, in which disc sizes indicate genus over-abundance
relative to background. The pie charts show residence location proportions(colour coded as in Fig. 1c) and number of subjects per subject group. Curvedarrows indicate transition from health (green) to frailty (red). FIM, functionalindependence measure; MNA, mini nutritional assessment; GDT, geriatricdepression test; CC, calf circumference; CRP, C-reactive protein; IL,interleukin; BP, blood pressure; MMSE, mini-mental state examination.
RESEARCH ARTICLE
1 8 2 | N A T U R E | V O L 4 8 8 | 9 A U G U S T 2 0 1 2
Macmillan Publishers Limited. All rights reserved©2012

in Table 1, plus separate PCoAs for the community-only, and long-stay-only subjects. The community and whole-cohort analyses iden-tified an association of depression with axis 2—subjects in the lowerpath had higher GDT scores. IL-6 and IL-8 levels were higher inthe upper path by whole-cohort analysis (Fig. 4 and SupplementaryFig. 14), whereas CRP levels were higher in the lower path in long-stay-only analysis. Furthermore, subjects in the lower path had highersystolic and diastolic blood pressure, except in the community-onlyanalysis. This apparent inconsistency is explained by a highly signifi-cant change in diastolic blood pressure along the primary PCoA axis inthe long-stay subjects, emphasizing the value of a stratified cohort. Thesubjects in the upper path were older but had higher Barthel and FIMscores than subjects of a similar age in the lower path (SupplementaryFig. 14), consistent with healthier ageing. Movement along PCoA axis 1of the whole cohort (that is, from community to long-stay, left to right,Fig. 4) is associated with a reduction in abundance of Ruminococcusand Prevotella, and increased abundance of the Oscillibacter CAG,accompanied by calf circumference decrease and weight decrease(Table 1), and increase in IL-6 levels. Moving along axis 1 of the long-stay PCA (that is, between the two right-ward arms), there is a reductionin the Oscillibacter CAG, increase in abundance of the Bacteroides CAG,reduced FIM and Barthel indices, and increased levels of CRP (Fig. 4).Consideration of the microbiota–health correlations in the long-staycohort (Fig. 4), upwards along axis 2, highlights the association withincreased frailty, reduced muscle mass, and poorer mental activity mov-ing away from community-type microbiota.
Health–microbiota associations were statistically significant, evenwhen regression models were adjusted for location. Although otherfactors undoubtedly contribute to health decline, and are difficult tocompletely adjust for in retrospective studies, the most plausibleinterpretation of our data is that diet shapes the microbiota, whichthen affects health in older people. Diet-determined differences inmicrobiota composition may have subtle impacts in young adults indeveloped countries. These would be difficult to correlate with healthparameters, but become far more evident in the elderly who areimmunophysiologically compromised. This is supported by thestronger microbiota–health associations evident in the long-staycohort, and there is now a reasonable case for microbiota-relatedacceleration of ageing-related health deterioration. An ageingpopulation is now a general feature of western countries35,36 and anemerging phenomenon even among developing countries. Theassociation of the intestinal microbiota of older people withinflammation12 and the clear association between diet and microbiotaoutlined in this and previous studies20,21,37,38 argue in favour of anapproach of modulating the microbiota with dietary interventionsdesigned to promote healthier ageing. Dietary supplements withdefined food ingredients that promote particular components of themicrobiota may prove useful for maintaining health in older people.On a community basis, microbiota profiling, potentially coupled withmetabolomics, offers the potential for biomarker-based identificationof individuals at risk for, or undergoing, less-healthy ageing.
METHODS SUMMARYAmplicons of the 16S rRNA gene V4 region were sequenced on a 454Genome Sequencer FLX Titanium platform. Sequencing reads werequality filtered, OTU clustered, ChimeraSlayer filtered and furtheranalysed using the QIIME pipeline39 and RDP-classifier40. Statisticalanalysis was performed using Stata and R software packages. Nuclearmagnetic resonance (NMR) spectroscopy was performed on a600 MHz Varian NMR Spectrometer as previously described41.
Habitual dietary intake was assessed using a validated, semiquan-titative, FFQ, administered by personnel who received standardizedtraining in dietary assessment. FFQ coding, data cleaning and datachecks were conducted by a single, trained individual to ensure con-sistency of data.
Full Methods and any associated references are available in the online version ofthe paper.
Received 10 January; accepted 14 June 2012.
Published online 13 July 2012.
1. O’Toole, P. W. & Claesson, M. J. Gut microbiota: changes throughout the lifespanfrom infancy to elderly. Int. Dairy J. 20, 281–291 (2010).
2. Frank, D.N.et al.Molecular-phylogenetic characterizationofmicrobial communityimbalances in human inflammatory bowel diseases. Proc. Natl Acad. Sci. USA 104,13780–13785 (2007).
3. Qin, J. et al. A human gut microbial gene catalogue established by metagenomicsequencing. Nature 464, 59–65 (2010).
4. Kassinen, A. et al. The fecal microbiota of irritable bowel syndrome patients differssignificantly from that of healthy subjects. Gastroenterology 133, 24–33 (2007).
5. Jeffery, I. B. et al. An irritable bowel syndrome subtype defined by species-specificalterations in faecal microbiota. Gut 61, 997–1006 (2012).
6. Ley, R. E., Turnbaugh, P. J., Klein, S. & Gordon, J. I. Microbial ecology: human gutmicrobes associated with obesity. Nature 444, 1022–1023 (2006).
7. Rajilic-Stojanovic, M. et al. Development and application of the human intestinaltract chip, aphylogeneticmicroarray: analysis ofuniversally conservedphylotypesin the abundant microbiota of young and elderly adults. Environ. Microbiol. 11,1736–1751 (2009).
8. Claesson, M. J.et al. Composition, variability, and temporal stability of the intestinalmicrobiota of the elderly. Proc. Natl Acad. Sci. USA 108 (Suppl 1), 4586–4591(2011).
9. Biagi, E. et al. Through ageing, and beyond: gut microbiota and inflammatorystatus in seniors and centenarians. PLoS ONE 5, e10667 (2010).
10. Franceschi, C. et al. Inflamm-aging: an evolutionary perspective onimmunosenescence. Ann. NY Acad. Sci. 908, 244–254 (2000).
11. Garrett, W. S., Gordon, J. I. & Glimcher, L. H. Homeostasis and inflammation in theintestine. Cell 140, 859–870 (2010).
12. Guigoz, Y., Dore, J. & Schiffrin, E. J. The inflammatory status of old age can benurtured from the intestinal environment. Curr. Opin. Clin. Nutr. Metab. Care 11,13–20 (2008).
13. van Tongeren, S. P., Slaets, J. P., Harmsen, H. J. & Welling, G. W. Fecal microbiotacomposition and frailty. Appl. Environ. Microbiol. 71, 6438–6442 (2005).
14. Lovat, L. B. Age related changes in gut physiology and nutritional status. Gut 38,306–309 (1996).
15. Hildebrandt, M. A. et al. High-fat diet determines the composition of themurine gutmicrobiome independently of obesity. Gastroenterology 137, 1716–1724 (2009).
16. Mai, V., McCrary, Q. M., Sinha, R. & Glei, M. Associations between dietary habits andbody mass indexwith gut microbiota compositionand fecalwater genotoxicity: anobservational study in African American and Caucasian American volunteers.Nutr. J. 8, 49 (2009).
17. Muegge, B. D. et al. Diet drives convergence in gut microbiome functions acrossmammalian phylogeny and within humans. Science 332, 970–974 (2011).
18. De Filippo, C. et al. Impact of diet in shaping gut microbiota revealed by acomparative study in children from Europe and rural Africa. Proc. Natl Acad. Sci.USA 107, 14691–14696 (2010).
19. Turnbaugh, P. J. et al. The effect of diet on the human gut microbiome: ametagenomic analysis in humanized gnotobiotic mice. Sci. Transl. Med. 1, 6ra14(2009).
20. Faith, J. J., McNulty, N. P., Rey, F. E. & Gordon, J. I. Predicting a human gutmicrobiota’s response to diet in gnotobiotic mice. Science 333, 101–104 (2011).
21. Wu, G. D. et al. Linking long-term dietary patterns with gut microbial enterotypes.Science 334, 105–108 (2011).
22. Lozupone, C. & Knight, R. UniFrac: a new phylogenetic method for comparingmicrobial communities. Appl. Environ. Microbiol. 71, 8228–8235 (2005).
23. Drescher, L. S., Thiele, S. & Mensink, G. B. A new index to measure healthy fooddiversity better reflects a healthy diet than traditional measures. J. Nutr. 137,647–651 (2007).
24. Jansson, J. et al. Metabolomics reveals metabolic biomarkers of Crohn’s disease.PLoS ONE 4, e6386 (2009).
25. Pryde, S. E., Duncan, S. H.,Hold, G. L., Stewart, C. S. & Flint, H. J. Themicrobiology ofbutyrate formation in the human colon. FEMS Microbiol. Lett. 217, 133–139(2002).
26. de Groot, V., Beckerman, H., Lankhorst, G. J. & Bouter, L. M. How to measurecomorbidity. a critical review of available methods. J. Clin. Epidemiol. 56, 221–229(2003).
27. Mahoney, F. I. & Barthel, D. W. Functional evaluation: the Barthel index. Md. StateMed. J. 14, 61–65 (1965).
28. Kidd, D. et al. The functional independence measure: a comparative validity andreliability study. Disabil. Rehabil. 17, 10–14 (1995).
29. Folstein, M. F., Folstein, S. E. & McHugh, P. R. ‘‘Mini-mental state’’: a practicalmethod for grading the cognitive state of patients for the clinician. J. Psychiatr. Res.12, 189–198 (1975).
30. Bauer, J. M., Kaiser, M. J., Anthony, P., Guigoz, Y. & Sieber, C. C. The mini nutritionalassessment–its history, today’s practice, and future perspectives. Nutr. Clin. Pract.23, 388–396 (2008).
31. Cruz-Jentoft, A. J. et al. Sarcopenia: European consensus on definition anddiagnosis: report of the European Working Group on Sarcopenia in Older People.Age Ageing 39, 412–423 (2010).
32. Nyamundanda, G., Brennan, L. & Gormley, I. C. Probabilistic principal componentanalysis for metabolomic data. BMC Bioinformatics 11, 571 (2010).
ARTICLE RESEARCH
9 A U G U S T 2 0 1 2 | V O L 4 8 8 | N A T U R E | 1 8 3
Macmillan Publishers Limited. All rights reserved©2012

33. Wang, Z. et al. Gut flora metabolism of phosphatidylcholine promotescardiovascular disease. Nature 472, 57–63 (2011).
34. Arumugam, M. et al. Enterotypes of the human gut microbiome. Nature 473,174–180 (2011).
35. European Commission. Population structure and ageing http://epp.eurostat.ec.europa.eu/statistics_explained/index.php/Population_structure_and_ageing (2011).
36. Kinsella, K. & He, W. An Aging World: 2008 (US Government Printing Office, 2009).37. Kau, A. L., Ahern, P. P., Griffin, N. W., Goodman, A. L. & Gordon, J. I. Human nutrition,
the gut microbiome and the immune system. Nature 474, 327–336 (2011).38. Walker, A. W. et al. Dominant and diet-responsive groups of bacteria within the
human colonic microbiota. ISME J. 5, 220–230 (2011).39. Caporaso, J. G. et al. QIIME allows analysis of high-throughput community
sequencing data. Nature Methods 7, 335–336 (2010).40. Wang, Q., Garrity, G. M., Tiedje, J. M. & Cole, J. R. Naive Bayesian classifier for rapid
assignment of rRNA sequences into the new bacterial taxonomy. Appl. Environ.Microbiol. 73, 5261–5267 (2007).
41. O’Sullivan, A., Gibney, M. J. & Brennan, L. Dietary intake patterns are reflected inmetabolomicprofiles: potential role indietaryassessmentstudies.Am. J.Clin.Nutr.93, 314–321 (2011).
Supplementary Information is linked to the online version of the paper atwww.nature.com/nature.
Acknowledgements This work was supported by the Government of Ireland NationalDevelopment Plan by way of a Department of Agriculture Food and Marine, and HealthResearch Board FHRI award to the ELDERMET project, as well as by a ScienceFoundation Ireland award to the Alimentary Pharmabiotic Centre. M.J.C. is funded by afellowship from the Health Research Board of Ireland. We thank K. O’Donovan andP. Egan for clinical assistance, staff in Cork City and County hospitals for facilitatingsubject recruitment, S. Wong and B. Clayton for supercomputer access.
Author Contributions All authors are members of the ELDERMET consortium (http://eldermet.ucc.ie). P.W.O.T., E.M.O.C., S.Cu.1 andR.P.R.managed theproject;D.v.S., G.F.F.,C.S., J.R.M., F.S., C.H., R.P.R. and PWOT designed the analyses; M.J.C., I.B.J., S.Co.3,E.M.O.C., H.M.B.H., M.C., B.L., O.O.S., A.P.F., S.E.P., M.W. and L.B. performed the analyses;J.D. performed DNA extraction and PCR; M.W. and L.B. performedNMR metabolomics;M.O.C.,N.H., K.O.C. andD.O.M.performed clinical analyses;M.J.C., I.B.J., S.Co.3, E.M.O.C.,L.B., J.R.M., A.P.F., R.P.R., C.H., F.S. and P.W.O.T. wrote the manuscript.
AuthorInformationAmpliconsequencedata,andshotgunsequencedata,contigs,genesand annotations, have been deposited in MG-RAST under the Project ID 154 (http://metagenomics.anl.gov/linkin.cgi?project154).Reprints and permissions information isavailable at www.nature.com/reprints. The authors declare no competing financialinterests. Readers are welcome to comment on the online version of this article atwww.nature.com/nature. Correspondence and requests for materials should beaddressed to P.W.O.T. ([email protected]).
RESEARCH ARTICLE
1 8 4 | N A T U R E | V O L 4 8 8 | 9 A U G U S T 2 0 1 2
Macmillan Publishers Limited. All rights reserved©2012

METHODSSubject recruitment and sample collection. This study was approved by theCork Clinical Research Ethics Committee. Subjects older than 64 years wererecruited and clinically investigated in two local hospitals, which serve a popu-lation base of ,481,000 in the Cork city and county region. They were defined as(1) community-dwelling (community); (2) attending an out-patient day hospital(out-patient); (3) in short-term rehabilitation hospital care (rehabilitation; under6 weeks stay) or (4) in long-term institutionalized care (long stay; more than6 weeks). The mean age of the subjects was 78 (6 8) years, with a range of 64to 102 years. The subjects were all of Irish ethnicity. None of the faecal samplesfrom elderly subjects from our previous study8 were analysed in the currentanalysis, because we did not have food frequency data for all that cohort.Exclusion criteria were a history of alcohol abuse, participation in an investiga-tional drug evaluation or antibiotic treatment within the previous 30 days, oradvanced organic disease. Informed consent was obtained from all subjects or,in cases of cognitive impairment, by next-of-kin in accordance with the localresearch ethics committee guidelines. Data collected included anthropometricmeasurements, clinical history and status and medication history. Antibioticuse before the one-month exclusion period was also recorded for each subject.Thirteen younger adult subjects of age ranging 28–46 years, which had not beentreated with antibiotics within 30 days, were also recruited by informed consent.Clinical and nutritional data collection. Habitual dietary intake was assessedusing a validated, semiquantitative, food frequency questionnaire (FFQ) based uponthe SLAN study42. Food properties were determined using the UK Food StandardsAgency Nutrient databank43. The mini nutritional assessment (MNA) was used as ascreening and assessment tool to identify subjects at risk of malnutrition.
Non-fasted blood samples were collected and analysed at Cork UniversityHospital clinical laboratories. Cytokines were measured using validated, commercialmulti-spot microplates (Meso Scale Diagnostics). Anthropometric measuresincluded height, weight, calf and mid-arm circumference. Charlson comorbidityindex, mini mental state exam, geriatric depression test, Barthel score and functionalindependence measures were carried out on all participants. For long-term care, day-hospital and rehabilitation subjects, a research nurse reviewed the medical recordsfor information on disease and current medication usage.Molecular methods and bioinformatics. DNA was extracted from faecal samples,and the V4 region of the 16S rRNA gene was amplified, sequenced and analysed, asdescribed previously44. Briefly, V4 amplicons were sequenced on a 454 GenomeSequencer FLX Titanium platform (Roche Diagnostics and Beckman CoulterGenomics). Raw sequencing reads were quality trimmed using the QIIME pipe-line39 according to the following criteria: (1) exact matches to primer sequences andbarcode tags, (2) no ambiguous bases (Ns); (3) read-lengths not shorter than150 base pairs (bp) or longer than 350 bp; (4) the average quality score in a slidingwindow of 50 bp not to fall below 25. For large-scale assignments into the newBergey’s bacterial taxonomy45 we used the RDP-classifier version 2.2 with 50% asconfidence value threshold. This was based on what was found suitable for V4amplicons from the human gut environment44. RDP classifications were importedinto a MySQL database for efficient storage and advanced querying.
The amplicon reads were clustered into OTUs at 97% identity level, and filtered forchimaeric sequences using ChimeraSlayer (http://microbiomeutil.sourceforge.net/#A_CS). Representative sequences (the most abundant) for each OTU werealigned using PyNAST46 before tree building using FastTree47. These phylogenieswere combined with absence/presence or abundance information for each OTU tocalculate unweighted or weighted UniFrac distances, respectively48. Principal co-ordinate analysis and Procrustes superimposition were then performed from theUniFrac distances and Food Frequency data. The amplicon sequences were depositedin MG-RAST under the Project ID 154.
Metagenomes were sequenced from libraries with 91 bp paired-end Illuminareads and 350 bp insert size and assembled using MetaVelvet49. Samples EM039and EM173 were sequenced from libraries of 101 bp paired-end Illumina readswith a 500 bp insert size, and subsequently assembled using MIRA50 in hybridwith 551,726 and 665,164 454 Titanium reads, respectively. Protein sequencesfrom enzymes were screened against the assembled metagenomes usingTBLASTN with an amino acid identity cut-off of 30% and an alignment lengthcut-off of 200 bp. We screened the metagenome data for enzymes associated withproduction of butyrate (butyryl-CoA transferase/acetyl-CoA hydrolase), acetate(acetate-formyltetrahydrofolate synthetase/formate-tetrahydrofolate ligase),and propionate (propionyl-CoA:succinate-CoA transferase/propionate CoA-transferase). Genes were predicted using MetaGene51.NMR analysis of the faecal water metabolome. Faecal water samples were pre-pared by the addition of 60ml D2O and 10ml tri-methylsilyl-2,2,3,3-tetradeuterio-propionate to 540ml faecal water. Spectra of samples were acquired by using aCarr–Purcell–Meiboom–Gill (CPMG) pulse sequence with 32k data points and256 scans. Spectra were referenced to TSP at 0.0 p.p.m., phase and baseline
corrected with a line broadening of 0.3 Hz using the processor on ChenomxNMR suite 7 (Chenomx). The spectra were integrated at full resolution for dataanalysis (PCA, PLS-DA, CIA) with the water region (4–6 p.p.m.) excluded and thedata was normalized to the sum of the spectral integral. For PPCCA data analysis,the spectra were integrated into spectral regions (0.01 p.p.m.). Two-dimensional1H–1H correlation spectroscopy (COSY) and total correlation spectroscopy(TOCSY) were acquired on a 600 MHz NMR spectrometer. TOCSY spectra wereacquired with a spin lock of 65 ms. All two-dimensional data were recorded withstandard Varian pulse sequences collecting 1,024 3 128 data points with a sweepwidth of 9.6 kHz and 32 scans per increment.Statistical methods and metabolome data analysis. Statistical analysis wascarried out using R (version 2.13.2) or Stata (version 11) software packages.Kruskal–Wallis and Mann–Whitney tests were used to find significant differencesin microbial taxa, clinical and biochemical measures, alpha diversity, and HealthyFood Diversity (HFD). Data were visualized by boxplots. Unless stated otherwise,box plots represented the median and interquartile ranges, with the error barsshowing the last datum within 1.5 of the interquartile range of the upper and lowerquartiles. We used least square linear regression for comparing alpha diversity andHFD. Median regression52 was used to compare clinical measures and microbiota,while adjusting for age, gender, medications, and when appropriate residencelocation. For median regression, the median was modelled as a linear functionof independent variables. Model parameters are estimated such that they mini-mised the sum of the absolute differences between observed and predicted values. Pvalues were generated using the wild bootstrap method53 to estimate variance.
A linear quantile (median) regression for two variables—a response variable (y)and a predictor variable (x)—is the following: median (y) 5 b0 1 b1x where b0 is theintercept (value when y 5 0) and b1 is the slope (change in median of y for a unitchange in x). Together, these parameters describe the association between y and x,where x is a predictor of y. In the case of multiple predictor variables, each one is addedto the regression equation and so the equation becomes median (y) 5 b0 1 b1x1 1
b2x2 and now the slope b1 is interpreted as the median change in x1 after adjusting forx2. This can be likened to a laboratory experiment where the specific effect of onevariable on another is isolated by holding all other relevant variables constant.
Following statistical analysis of the taxonomic classifications, we estimatedFDR values using the Benjamini–Hochberg method54 to control for multipletesting. The exception to this were analyses at the genus level where we estimatedthe proportion of true null hypotheses with the Q-value function unless theestimated p0 was less than or equal to zero55.
Statistical analysis of the NMR data was performed using diverse softwarepackages: PCA and PLS-DA analysis was performed in SIMCA-P1
(Umetrics); permutation testing was performed in R and PPCCA was performedin R using the MetabolAnalyze package. The NMR data was Pareto-scaled beforedata analysis. Assignment of the spectral peaks (Supplementary Table 9) wasperformed using in-house libraries, statistical correlation analysis and two-dimensional NMR spectra (TOCSY and COSY).
42. Harrington, J.et al. Sociodemographic, health and lifestyle predictors of poor diets.Public Health Nutr. 14, 2166–2175 (2011).
43. McCance, R. A. & Widdowson, E. M. The composition of foods 6th edn (Royal Soc.Chemistry, 2002).
44. Claesson, M. J. et al. Comparative analysis of pyrosequencing and a phylogeneticmicroarray for exploring microbial community structures in the human distalintestine. PLoS ONE 4, e6669 (2009).
45. Lilburn, T. G. & Garrity, G. M. Exploring prokaryotic taxonomy. Int. J. Syst. Evol.Microbiol. 54, 7–13 (2004).
46. Caporaso, J. G. et al. PyNAST: a flexible tool for aligning sequences to a templatealignment. Bioinformatics 26, 266–267 (2010).
47. Price, M. N., Dehal, P. S. & Arkin, A. P. FastTree 2–approximately maximum-likelihood trees for large alignments. PLoS ONE 5, e9490 (2010).
48. Hamady, M., Lozupone, C. & Knight, R. Fast UniFrac: facilitating high-throughputphylogenetic analyses of microbial communities including analysis ofpyrosequencing and PhyloChip data. ISME J. 4, 17–27 (2010).
49. Namiki, T., Hachiya, T., Tanaka, H. & Sakakibara, Y. in ACM Conference onBioinformatics Computational Biology and Biomedicine (Association for ComputingMachinery, 2011).
50. Chevreux, B. et al. Using the miraEST assembler for reliable and automated mRNAtranscript assembly and SNP detection in sequenced ESTs. Genome Res. 14,1147–1159 (2004).
51. Noguchi, H., Park, J. & Takagi, T. MetaGene: prokaryotic gene finding fromenvironmental genome shotgun sequences. Nucleic Acids Res. 34, 5623–5630(2006).
52. Koenker, R. & Basset, G. Regression quantiles. Econometrica 46, 33–50 (1978).53. Feng, X. D., He, X. M. & Hu, J. H. Wild bootstrap for quantile regression. Biometrika
98, 995–999 (2011).54. Benjamini, Y. & Hochberg, Y. Controlling the false discovery rate: a practical and
powerful approach to multiple testing. J. R. Stat. Soc. 57, 289–300 (1995).55. Dabney, A., Storey, J. D. & Warnes, G. R. qvalue: Q-value estimation for false
discovery rate control; R package version 1.24.20 (2010).
ARTICLE RESEARCH
Macmillan Publishers Limited. All rights reserved©2012