growth and volatility in an era of globalization · growth and volatility in an era of...
TRANSCRIPT

31
IMF Staff PapersVol. 52, Special Issue
© 2005 International Monetary Fund
Growth and Volatility in an Era of Globalization
M. AYHAN KOSE, ESWAR S. PRASAD, and MARCO E. TERRONES*
We extend the analysis in Kose, Prasad, and Terrones (2005) to provide a compre-hensive examination of the cross-sectional relationship between growth and macro-economic volatility over the past four decades. We also document that while therehas generally been a negative relationship between volatility and growth during thisperiod, the nature of this relationship has been changing over time and across dif-ferent country groups. In particular, we detect major shifts in this relationship aftertrade and financial liberalizations. In addition, our results show that volatilitystemming from the main components of domestic demand is negatively associatedwith economic growth. [JEL E32, F36, F43]
During his distinguished tenure as the Economic Counselor of the IMF andDirector of its Research Department, Michael Mussa made many important
contributions to the literature on globalization and its implications for both indus-trial and developing countries. Having been at the Fund during the trying periodsof the Asian and Russian crises, Mussa had a special appreciation for the chal-lenges faced by emerging market economies in trying to balance the benefits andrisks of globalization. Many of his writings on this topic have focused on howdeveloping countries could attain the growth benefits of globalization while min-imizing their susceptibility to financial and balance of payments crises.
Indeed, the broader issue of understanding the complex relationship betweenmacroeconomic volatility and economic growth has long been a challenge for econ-omists. During the 1980s, it was generally accepted that the impact of volatility on
*M. Ayhan Kose is an Economist, Eswar S. Prasad is a Division Chief, and Marco E. Terrones is aSenior Economist—all three are in the Research Department of the IMF. The authors are grateful to LuisCatão and Gian Maria Milesi-Ferretti for their helpful comments and suggestions. We thank Nick Nedelchevand Smita Wagh for excellent research assistance.
M. Ayhan Kose, Eswar S. Prasad, and Marco E. Terrones
32
economic growth and welfare was at most minor and that, therefore, volatility washardly anything to be feared.1 Research in the 1990s (for example, Ramey andRamey, 1995) reached a strikingly different conclusion—that macroeconomicvolatility may actually reduce long-term growth.2 This was an important resultsince it implied that policies and economic shocks that increased volatility couldhave significant longer-term negative effects on economic welfare by reducinggrowth.
The causes and consequences of macroeconomic volatility have also receivedrenewed attention because of the financial crises experienced by a number of devel-oping countries over the past two decades. Such crises are extreme manifestations ofvolatility, but they have clearly highlighted its costs, including the consequencesof large episodes of volatility in terms of increases in inequality and poverty. Manyof these crises have been associated with the rapid opening-up of some developingeconomies to global trade and financial linkages—a phenomenon broadly referred toas globalization. While facing episodes of high-output volatility on account of thesecrises, this group of developing economies, often referred to as “emerging markets,”has also posted much better average growth rates during the period of globalizationthan other developing economies.
The ongoing debate about the benefits and costs of globalization has prompteda resurgence of interest in analyzing the relationship between volatility and growth,particularly since the Ramey and Ramey (1995) results are based on a data set thatends in 1985, just when the pace of trade and financial integration started to gainmomentum. Some recent papers show that the negative relationship between growthand volatility persisted into the 1990s (for example, Fatás, 2002; Aizenman andPinto, 2005; and Hnatkovska and Loayza, 2005). Other empirical studies focus onhow the relationship between growth and volatility is affected by a particular sourceof volatility, including volatility stemming from fluctuations in government expen-ditures and the terms of trade (see, for example, Mendoza, 1997; Turnovsky andChattopadhyay, 2002; and Fatás and Mihov, 2003). Recent research also considersvarious channels linking macroeconomic volatility to long-term growth (for exam-ple, Aizenman and Marion, 1999; and Martin and Rogers, 2000).
In Kose, Prasad, and Terrones (2005), we analyze how the growth-volatilityrelationship has been influenced by different aspects of globalization. Our mainresult in that paper is that, while the growth-volatility relationship was preserved onaverage in the 1990s, both trade and financial openness appear to attenuate this neg-ative relationship. In other words, even though economies that are more integratedinto the global economy might be subject to more volatility, they do not necessarilysuffer lower growth than less integrated economies as a result of that additionalvolatility.
1In addition, Lucas’s (1987) work suggested that the welfare costs associated with business-cycle fluc-tuations were small, bringing into question the desirability of stabalization policies aimed at smoothing outthese fluctuations.
2Lucas’s finding about the direct adverse welfare effects of volatility has also been challenged sincethen (see Pallage and Robe, 2003; and Barlevy, 2004). Recent empirical research also finds that volatilityhas a significantly negative impact on poverty (Laursen and Mahajan, 2005).

GROWTH AND VOLATILITY IN AN ERA OF GLOBALIZATION
33
This paper extends the scope of our research program by analyzing the growth-volatility relationship in several dimensions. First, we provide a more detaileddescriptive account of the evolution of the dynamics of growth and volatility overtime and across countries. We then analyze the role of globalization in this processby employing an event-study analysis to examine how growth and volatility changebefore and after trade and financial liberalizations. We also examine the implica-tions of the negative relationship between volatility and growth in the context of aregional case study on sub-Saharan Africa (SSA). In addition, we analyze the empir-ical importance of various components of aggregate output in influencing the rela-tionship between volatility and growth.
To set the stage for this analysis, it is useful to begin with a characteriza-tion of how pervasive the forces of globalization have been in recent decades. Theincrease in international trade and financial linkages since 1985 has indeed beenquite remarkable. For example, between 1985 and 2000, the share of emergingmarket countries in our data set that had liberalized their trade regimes increasedfrom 30 percent to almost 85 percent. The share of countries with open financialaccounts rose from 20 percent to about 55 percent over this period. Spurred by theseliberalizations, the volume of international trade has registered a dramatic increase,with the ratio of world exports and imports to world GDP rising from 75 percent inthe mid-1980s to more than 150 percent by the end of the 1990s. Private capital flowsfrom industrialized to developing economies have also increased dramatically sincethe mid-1980s, with the bulk of these flows going to emerging market economies.3
Why is it important to consider these dramatic changes in trade and financiallinkages in analyzing the relationship between growth and volatility? While bothtrade and financial integration probably have their distinct roles in explaining thechanges in the dynamics of this relationship, financial integration, in particular, islikely to have been an important factor influencing the relationship during the past20 years, especially as increased international financial flows appear to have pre-cipitated episodes of high volatility in many developing economies. This raises aninteresting question about whether the high growth rates in emerging markets thatare presumably fueled in part by international financial flows come at the cost ofhigher volatility associated in part with the vagaries of these flows.
The change over time in the relative vulnerability of industrial and develop-ing economies to external crises also raises questions about whether the growth-volatility relationship is influenced by the “growing pains” seemingly associatedwith rising trade and financial integration. To be more specific, are the level of acountry’s development and the extent of its integration into international marketsimportant in determining the conditional validity of this relationship? In this con-text, while there appears to be a consensus that trade openness stimulates domesticgrowth, it also seems to be the case that such openness increases an economy’s vul-nerability to external shocks, including highly volatile terms-of-trade shocks. The
3See Lane and Milesi-Ferretti (2001 and 2003) for a detailed analysis of the increase in global finan-cial flows, including among industrial countries. The main increase in gross capital flows to developingcountries has been in terms of foreign direct investment (FDI) and portfolio flows, while the relativeimportance of bank lending and other official flows has declined over time.
M. Ayhan Kose, Eswar S. Prasad, and Marco E. Terrones
34
effects of financial integration are less obvious in theoretical and empirical studies.And the theoretical literature is largely inconclusive on how trade and financialintegration, in addition to the factors discussed above, affect the growth-volatilityrelationship. A more detailed empirical analysis of this issue is therefore warranted.
I. What Do We Learn from Recent Theoretical and Empirical Studies?
Effects of Globalization on Growth
A number of theoretical models have been developed to analyze the importanceof trade and financial openness in promoting economic growth. Some of thesetheoretical models focus on static gains, including the gains derived from com-parative advantage considerations. Others consider knowledge spillovers andchanges in the growth dynamics of productivity and investment associated withinternational trade (Grossman and Helpman, 1991; Levine and Renelt, 1992; andBaldwin and Seghezza, 1998).4
There are various direct and indirect theoretical channels through whichincreased financial flows can enhance growth. The direct channels include aug-mentation of domestic savings, reduction in the cost of capital through betterglobal allocation of risk, development of the financial sector (Levine, 1996; andCaprio and Honohan, 1999), and transfer of technological know-how. The mainindirect channels are associated with promotion of specialization (Kalemli-Ozcan, Sorensen, and Yosha, 2003) and inducement for better economic policies(Gourinchas and Jeanne, 2003).
There is a large empirical literature studying the role of openness to trade andfinancial flows in economic growth. For example, using a variety of methods, sev-eral researchers, including Sachs and Warner (1995), Frankel and Romer (1999),Dollar and Kraay (2002) and Wacziarg and Welch (2003), show that trade opennesshelps promote economic growth. Rodriquez and Rodrik (2000) challenge the robust-ness of some of these findings and argue that several of these studies suffer fromproblems associated with model misspecification and with the use of openness mea-sures that may capture other policy or institutional features.
In contrast to the literature on trade and growth, recent empirical research isunable to establish a clear link between financial integration and economic growth.Most empirical studies find that financial integration has no effect or at best a mod-est effect on economic growth (see the survey by Prasad and others, 2003). Anotherset of empirical studies suggests that the composition of capital flows determines theeffects of financial integration on economic growth (Reisen and Soto, 2001; andGoldberg, 2004). In particular, these studies conclude that FDI flows tend to be pos-itively associated with output growth in those countries that have a sufficient levelof human capital (Borenzstein, De Gregorio, and Lee, 1998) and well-developed
4Berg and Krueger (2003), Baldwin (2003), and Winters (2004) provide extensive surveys of the lit-erature on trade and growth.

GROWTH AND VOLATILITY IN AN ERA OF GLOBALIZATION
35
domestic financial markets (Alfaro and others, 2004). Other studies focus on theimpact of equity market liberalization on the growth rates of output and invest-ment, typically finding a positive effect (Henry, 2000; and Bekaert, Harvey, andLundblad, 2001).
Effects of Globalization on Volatility
The theoretical impact of increased trade and financial flows on output volatilitydepends on various factors, including the composition of these flows, patterns ofspecialization, and the sources of shocks. For example, if trade openness results inincreased specialization of countries’ production structures (at the industry level)and if industry-specific shocks are important in driving business cycles, it could leadto an increase in output volatility. However, if rising trade flows are associated withincreased vertical specialization across countries, the volatility of output growthcould decline (Kose, Prasad, and Terrones, 2003a).
In theory, financial integration could help lower the volatility of macroeconomicfluctuations in capital-poor developing countries by providing access to capitalthat could help them diversify their production base. Rising financial integration,however, could also lead to increasing specialization of production based on com-parative advantage considerations, thereby making economies more vulnerable toindustry-specific shocks (Kalemli-Ozcan, Sorensen, and Yosha, 2003).
There is little consensus in the literature about the empirical relationship betweenthe intensity of trade linkages and macroeconomic volatility. While some studiesfind no significant relationship between an increased degree of trade interdepen-dence and domestic macroeconomic volatility (Buch, Döpke, and Pierdzioch, 2002),others find that an increase in the degree of trade openness leads to higher outputvolatility, especially in developing countries (Karras and Song, 1996; Easterly, Islam,and Stiglitz, 2001). Kose, Prasad, and Terrones (2003a) find that while trade open-ness increases the volatility of output and consumption growth in emerging marketeconomies, it reduces the volatility of consumption growth relative to that of incomegrowth, implying that trade flows improve risk-sharing possibilities. They also doc-ument that financial integration does not have a statistically significant impact onthe volatility of output growth. They find some evidence that financial integrationcould actually increase the volatility of consumption growth relative to that of incomegrowth but argue that this relationship is a nonlinear one—rising financial inte-gration is associated with rising relative volatility of consumption only up to a cer-tain threshold.
The Relationship Between Growth and Volatility
Several papers in the stochastic dynamic business-cycle literature have typicallypropounded the view that the distinction between trend and cycles is an artificialone, since both growth and fluctuations are driven by the same set of shocks.However, there is no clear implication that can be derived from these models aboutthe relationship between volatility and growth (Jones, Manuelli, and Stacchetti,1999; and Jovanovic, 2004).

M. Ayhan Kose, Eswar S. Prasad, and Marco E. Terrones
36
Various theoretical channels that can lead to a negative relationship betweengrowth and volatility are discussed in the literature. For example, some theoreticalmodels argue that the link between growth and volatility depends on the dynamicsof investment (Bernanke, 1983; Pindyck, 1991; and Aizenman and Marion, 1993).A few papers emphasize the importance of costs associated with learning (Martinand Rogers, 2000; and Blackburn and Galindev, 2003), while others consider theimportance of terms-of-trade fluctuations (Mendoza, 1997). There are some theo-retical studies arguing that macroeconomic volatility could have a beneficial impacton economic growth (Aghion, Banerjee, and Piketty, 1999; Aghion, Bacchetta, andBanerjee, 2000; Blackburn, 1999; and Blackburn and Pelloni, 2004). Ranciere,Tornell, and Westermann (2003) and Tornell, Westermann, and Martinez (2003)find that credit market imperfections in financially open economies could lead toincreased volatility and higher growth.
Kormendi and Meguire (1985) and Grier and Tullock (1989) are among theearliest papers to directly examine the growth-volatility relationship. These papersreport that the relationship is positive. On the other hand, in an influential contribu-tion that has since acquired the status of conventional wisdom, Ramey and Ramey(1995; henceforth referred to as RR) conclude that growth and volatility are neg-atively related. Using a data set comprising 92 countries and covering the period1950–85, they show that the relationship is robust after introducing various controlvariables, including the share of investment in GDP, population growth, human cap-ital, and initial GDP.
Recent papers include Martin and Rogers (2000), who find evidence similar tothat of RR. Fatás (2002) explores the effects of using different control variablesand different measures of volatility and concludes that the negative growth-volatilityrelationship is robust.5 Hnatkovska and Loayza (2005) study the growth-volatilityrelationship using a sample of 79 developed and developing countries over the period1960–2000. They confirm that the relationship is robustly negative when numerouscontrols from the growth literature are incorporated into their regression framework.Both Fatás (2002) and Hnatkovska and Loayza (2005) also control for trade open-ness in their regressions, but their results indicate that the trade openness variablehas no significant impact on the relationship between volatility and growth. Noneof these studies has examined the effects of financial integration.
II. Understanding the Basic Stylized Facts About Growth and Volatility
This section first describes the data set used in the analysis. Next, it presents somestylized facts about the evolution of growth and volatility over time and across dif-ferent groups of countries. It then provides a brief descriptive analysis of the dynam-ics of growth and volatility before and after financial and trade liberalizations.
5In a recent paper, Imbs (2002) attempts to reconcile the positive relationship between growth andvolatility at the sectoral level with the negative relationship at the country level. He notes that how thisrelationship at the sectoral level translates into the relationship at the aggregate level depends on the degreeof synchronicity of fluctuations across sectors and on the relative importance of aggregate versus sector-specific shocks.

GROWTH AND VOLATILITY IN AN ERA OF GLOBALIZATION
37
Data Set
We examine the relationship between growth and volatility using a large data set thatincludes industrial as well as developing countries. While the basic data set we useis the latest version of the Penn World Tables (Heston, Summers, and Aten, 2002),we supplement that with data from various other sources, including databases main-tained by the World Bank and IMF. Our data set comprises annual data over theperiod 1960–2000 for a sample of 85 countries—21 industrial and 64 developing.The group of industrial countries corresponds to a subsample of the Organization forEconomic Cooperation and Development (OECD) economies for which data usedin the empirical analysis are available. For the descriptive analysis in the next twosections, we divide developing countries into two coarse groups—more financiallyintegrated (MFI) economies and less financially integrated (LFI) economies. Thereare 23 MFI and 41 LFI economies in our sample. The former essentially constitutethe group of emerging markets and account for a substantial fraction of net capitalflows from industrial to developing countries in recent decades.
In our analysis, we use two measures of trade integration. The first is a binarymeasure based on the dates of trade liberalization and is taken from Wacziarg andWelch (2003), who extend the data set constructed by Sachs and Warner (1995).This measure takes a value of one when a country’s trade regime is liberalized, anda value of zero otherwise. The trade liberalization dates were based on a detailedexamination of country case studies of liberalization. The second measure of tradeintegration is a continuous one used widely in the literature—the ratio of the sumof imports and exports to GDP.
To measure the degree of financial integration, we again employ both a binaryand a continuous measure. Our binary measure takes a value of one when the equitymarket is officially liberalized; otherwise, it takes a value of zero. Most of the datesof official financial liberalization for individual countries are taken from Bekaert,Harvey, and Lundblad (2002) and Kaminski and Schmukler (2002). Our secondfinancial integration measure—the ratio of gross capital flows to GDP—is analo-gous to the trade openness ratio.6
Evolutions of Growth and Volatility
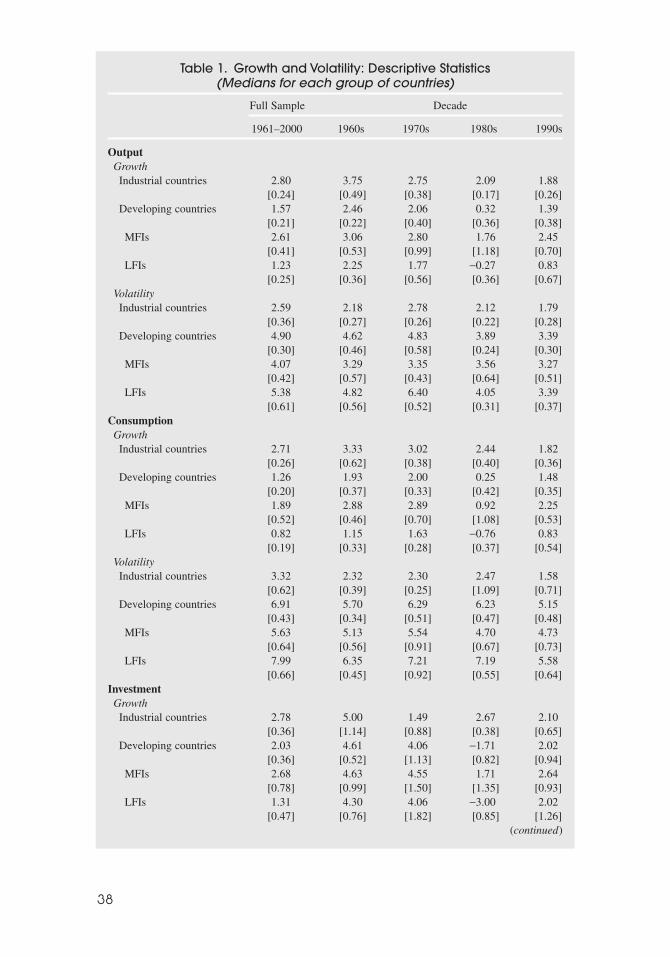
The first column of Table 1 presents, for different country groupings, the cross-sectional medians of the level and volatility of the growth rates of output and itsmain components over the past four decades. Volatility is measured by the standarddeviation of the growth rate of each variable. Over the full sample period, output
6A detailed description of the data set and sources is provided in Kose, Prasad, and Terrones (2005).Our binary indicators can be regarded as measures of de jure trade and financial integration, while the con-tinuous measures capture de facto integration. The distinction is of particular importance in understandingthe effects of financial integration, since many economies that have maintained controls on capital accounttransactions have found them ineffective in many circumstances, particularly in the context of episodes ofcapital flight. Financial-flows data are available for some countries for only a shorter period. In our regres-sions, we use cross-sectional data that are based on averages over shorter time spans for some countries.For the sample of countries we study, the problem is mostly for the 1960s, when financial flows to devel-oping countries were quite limited anyway.
38
Table 1. Growth and Volatility: Descriptive Statistics(Medians for each group of countries)
Full Sample Decade
1961–2000 1960s 1970s 1980s 1990s
OutputGrowthIndustrial countries 2.80 3.75 2.75 2.09 1.88
[0.24] [0.49] [0.38] [0.17] [0.26]Developing countries 1.57 2.46 2.06 0.32 1.39
[0.21] [0.22] [0.40] [0.36] [0.38]MFIs 2.61 3.06 2.80 1.76 2.45
[0.41] [0.53] [0.99] [1.18] [0.70]LFIs 1.23 2.25 1.77 −0.27 0.83
[0.25] [0.36] [0.56] [0.36] [0.67]VolatilityIndustrial countries 2.59 2.18 2.78 2.12 1.79
[0.36] [0.27] [0.26] [0.22] [0.28]Developing countries 4.90 4.62 4.83 3.89 3.39
[0.30] [0.46] [0.58] [0.24] [0.30]MFIs 4.07 3.29 3.35 3.56 3.27
[0.42] [0.57] [0.43] [0.64] [0.51]LFIs 5.38 4.82 6.40 4.05 3.39
[0.61] [0.56] [0.52] [0.31] [0.37]ConsumptionGrowthIndustrial countries 2.71 3.33 3.02 2.44 1.82
[0.26] [0.62] [0.38] [0.40] [0.36]Developing countries 1.26 1.93 2.00 0.25 1.48
[0.20] [0.37] [0.33] [0.42] [0.35]MFIs 1.89 2.88 2.89 0.92 2.25
[0.52] [0.46] [0.70] [1.08] [0.53]LFIs 0.82 1.15 1.63 −0.76 0.83
[0.19] [0.33] [0.28] [0.37] [0.54]VolatilityIndustrial countries 3.32 2.32 2.30 2.47 1.58
[0.62] [0.39] [0.25] [1.09] [0.71]Developing countries 6.91 5.70 6.29 6.23 5.15
[0.43] [0.34] [0.51] [0.47] [0.48]MFIs 5.63 5.13 5.54 4.70 4.73
[0.64] [0.56] [0.91] [0.67] [0.73]LFIs 7.99 6.35 7.21 7.19 5.58
[0.66] [0.45] [0.92] [0.55] [0.64]InvestmentGrowthIndustrial countries 2.78 5.00 1.49 2.67 2.10
[0.36] [1.14] [0.88] [0.38] [0.65]Developing countries 2.03 4.61 4.06 −1.71 2.02
[0.36] [0.52] [1.13] [0.82] [0.94]MFIs 2.68 4.63 4.55 1.71 2.64
[0.78] [0.99] [1.50] [1.35] [0.93]LFIs 1.31 4.30 4.06 −3.00 2.02
[0.47] [0.76] [1.82] [0.85] [1.26](continued)
39
Table 1. (Concluded)
Full Sample Decade
1961–2000 1960s 1970s 1980s 1990s
VolatilityIndustrial countries 9.16 7.40 10.53 8.36 7.11
[0.90] [0.86] [1.29] [1.55] [0.72]Developing countries 18.37 18.24 18.24 16.27 15.14
[1.27] [1.66] [1.38] [1.37] [1.10]MFIs 15.76 14.48 11.32 13.27 14.18
[1.74] [3.00] [2.73] [3.26] [2.37]LFIs 21.80 19.12 20.28 17.40 15.14
[1.42] [1.77] [1.62] [1.10] [1.24]ExportsGrowthIndustrial countries 5.27 7.07 4.96 4.33 5.60
[0.38] [0.92] [0.53] [0.28] [0.71]Developing countries 2.55 2.77 3.23 2.23 3.47
[0.49] [0.54] [0.94] [0.66] [0.73]MFIs 4.95 2.60 5.21 4.35 6.04
[1.03] [0.77] [1.01] [1.32] [1.39]LFIs 1.82 3.25 2.20 1.11 1.94
[0.40] [1.16] [1.05] [0.99] [1.00]VolatilityIndustrial countries 4.67 3.95 5.26 3.51 3.89
[0.42] [0.84] [0.37] [0.54] [0.45]Developing countries 11.85 9.88 12.23 10.08 7.73
[0.65] [0.93] [1.29] [0.70] [0.57]MFIs 9.20 8.51 10.36 8.28 6.76
[1.09] [1.69] [1.52] [0.74] [0.75]LFIs 13.71 11.56 14.79 10.84 9.02
[0.88] [1.21] [1.66] [1.70] [1.23]ImportsGrowthIndustrial countries 5.16 7.59 4.05 3.92 5.07
[0.40] [0.81] [0.61] [0.42] [0.40]Developing countries 2.46 3.14 4.28 −0.58 3.41
[0.46] [0.56] [0.61] [0.97] [0.85]MFIs 3.61 3.07 5.56 1.43 6.17
[0.85] [0.93] [1.08] [2.35] [1.07]LFIs 1.82 3.14 3.74 −1.75 1.56
[0.54] [0.78] [1.04] [1.09] [1.02]VolatilityIndustrial countries 6.07 5.76 8.02 5.09 4.93
[0.56] [1.13] [0.77] [0.65] [0.35]Developing countries 14.12 11.59 13.18 14.44 11.86
[0.82] [0.41] [0.72] [0.94] [0.91]MFIs 13.84 12.04 12.72 12.75 11.86
[1.32] [1.86] [1.02] [2.21] [1.50]LFIs 15.21 11.23 13.18 15.44 11.48
[1.26] [0.58] [1.12] [0.94] [1.29]
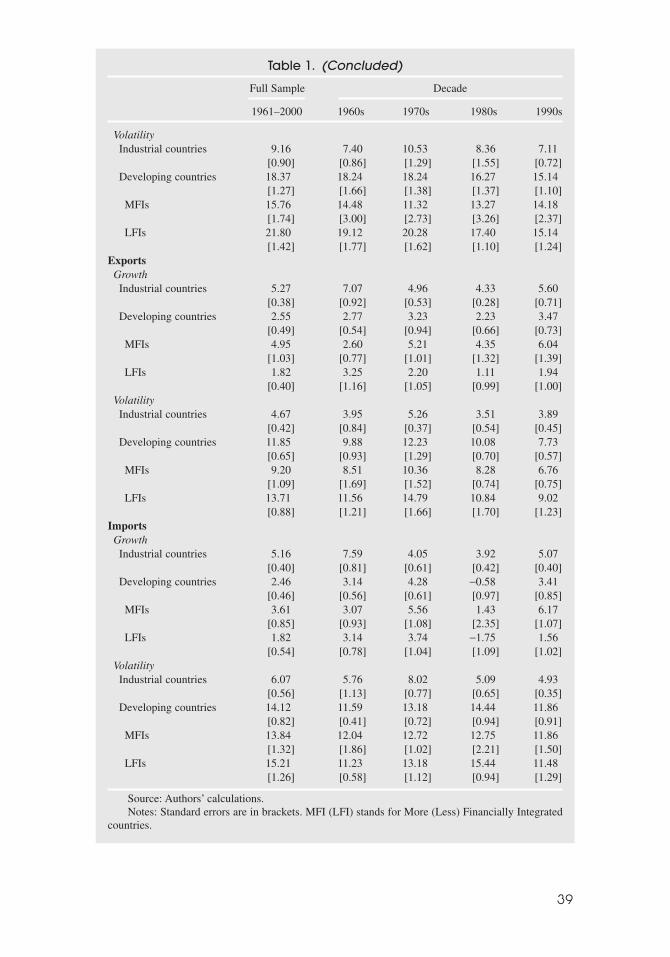
Source: Authors’ calculations.Notes: Standard errors are in brackets. MFI (LFI) stands for More (Less) Financially Integrated
countries.
M. Ayhan Kose, Eswar S. Prasad, and Marco E. Terrones
40
growth is highest on average for industrial countries, followed by MFI economiesand then the LFI economies. The order is reversed for output volatility. Thus, at avery coarse level, one can already discern a negative cross-sectional relationshipbetween growth and volatility.
Kose, Prasad, and Terrones (2005) show that this is confirmed by a cross-sectional plot of growth against volatility. In effect, this is the updated versionof the basic RR result. The relationship is, however, different across the three groupsof countries. Like RR, Kose, Prasad, and Terrones (2005) find a positive relationshipbetween growth and volatility among industrial countries and a negative one amongdeveloping countries. But the relationship also differs among the developing coun-tries. While it is strongly negative for LFI economies, it is positive among the groupof MFI economies. These results suggest the need to clearly discriminate amongthese different groups of countries in further analysis.
Next, we provide some basic stylized facts from a time-series perspective. Anexamination of changes in patterns of macroeconomic volatility over time (Table 1,columns 2–5) shows that average output growth and volatility have both declinedin industrialized countries over the 1980s and 1990s.7 Both MFI and LFI economiessaw a decline in their average output growth rates in the 1980s and a subsequentrebound in the 1990s, although growth remained below the corresponding levels inthe 1970s. The evolution of volatility is less similar across these two groups, withMFI economies experiencing a small increase in volatility in the 1980s, while LFIeconomies had a significant decline in volatility in each of the past two decades.From this broad perspective, it is difficult to detect a stable time-series relationshipbetween growth and volatility that is consistent across different country groups.
The results for the levels and volatility of consumption growth, reported in thesecond panel of Table 1, show a similar pattern in the sense that industrialized coun-tries have the highest average consumption growth rate, followed by MFI and LFIeconomies; for the volatility of consumption growth, the order is reversed. However,while both industrialized and LFI economies experience a decline in the volatility ofconsumption growth in the 1990s, MFI economies show no such improvement. Thissuggests that MFI economies do not appear to benefit from financial integration interms of being able to use international capital markets to better share their incomerisk and smooth growth of consumption.8
The results for investment are also different from those for output in somerespects. For example, one key difference is that average investment growth forindustrial economies picks up significantly in the 1980s, after dipping sharply inthe 1970s, and then settles back slightly in the 1990s. For both groups of devel-oping economies, average investment growth slows markedly in the 1980s beforerebounding in the 1990s. Interestingly, while the volatility of investment growthdeclines slightly in the 1980s and 1990s for both industrial and LFI economies, itrises gradually but noticeably for the MFI economies.
7The steady decline in the volatility of macroeconomic aggregates in industrialized countries since the1970s has been documented extensively (see, for example, Stock and Watson, 2002).
8See Kose, Prasad, and Terrones (2003b) for a more detailed analysis of this issue.

GROWTH AND VOLATILITY IN AN ERA OF GLOBALIZATION
41
In the cases of exports and imports, the basic growth-volatility relationship ispreserved over the full sample period across the three groups of countries. On aver-age, industrial countries display the highest level of growth and lowest volatility,with MFI and LFI economies following in the usual order. However, the patternsof growth and volatility across decades again reveal some differences. During the1990s, MFI economies become the group with the highest levels and volatility ofimport growth rates. Again, the relationship between growth and volatility of thesemacroeconomic variables has been changing over time even within country groups,implying that no clear pattern emerges from this analysis.9
Growth and Volatility Before and After Liberalizations
A different approach to exploring the effects of globalization on the growth-volatility relationship is to examine if this relationship has shifted during the periodof globalization. As a first cut, we split the sample into two periods—1960–85 and1986–2000. We picked this break point because, as noted earlier, capital flowsacross industrial countries as well as between industrial and developing countriessurged dramatically starting in the mid-1980s. The results did not show a sharp shiftin the relationship across the two periods. For industrial economies, the relationshiplooks strongly positive in both periods. For developing economies, it appears tobecome more strongly negative in the second period. One potential problem withthis approach is that because trade and financial liberalization occurred at differenttimes, especially among the developing economies, the choice of an identical breakpoint in the sample for all countries could influence the results.
To overcome this problem, we turn our attention to the group of MFI economies,which faced the most dramatic shifts in openness to trade and financial flows duringthe past 20 years. Figures 1a–1b (taken from Kose, Prasad, and Terrones, 2005)show the relationship for this group of economies before and after trade and finan-cial liberalization, respectively. The results indicate a major change in the growth-volatility relationship after liberalizations. For example, the relationship is stronglynegative in the period before trade liberalization and positive after that. The differ-ence between the pre- and postfinancial liberalizations periods follows a similar butsomewhat less striking pattern. These plots suggest that trade and financial integra-tion might have a considerable effect on how volatility and growth are associated.
To explore this finding further, we conduct an event study analysis for the MFIeconomies and examine the dynamics of growth and volatility before and after thedifferent measures of liberalization. Table 2 presents the cross-sectional mean andmedian values of average levels and volatility of growth for the MFI sample beforeand after trade and financial liberalizations. There is a sharp increase in the average
9To examine whether the results discussed above could be distorted by the use of decade averages, weplotted the growth and volatility of each variable for different groups of countries using 10-year rollingwindows for both the growth and volatility measures. The qualitative features of the results in Table 1 weregenerally preserved, indicating that the use of decade averages is not driving or distorting either the cross-sectional or time-series results.

M. Ayhan Kose, Eswar S. Prasad, and Marco E. Terrones
42
growth rates of output and its components after trade liberalizations. Financial lib-eralizations are also associated, on average, with improvements in the growth per-formance of the MFI economies. Figures 2a–2b show that these results are not justdriven by a small set of countries. For most of the countries in our sample, averagegrowth rates of output increase after trade liberalization. The results are similar, butweaker, for financial liberalization. The lower panel of Table 2 indicates that thereis only a modest reduction in the average volatility of output growth after trade orfinancial liberalizations, a result that is echoed by the country-specific results inFigures 3a–3b. Table 2 also shows that a similar result holds for the volatility ofconsumption growth. Interestingly, however, the volatility of the growth rates ofthe other components of output do appear to decline significantly after trade liberal-izations, although the picture is much more mixed in pre- and postfinancial liber-alization comparisons.
We now turn to a more detailed study of the time profiles of growth and volatil-ity in MFI economies before and after liberalizations. We first compute the level andstandard deviation of average growth rates of output, consumption, investment,exports, and imports for each MFI economy over an eight-year rolling window. We
ARG
BRA
CHL
CHNCOL EGY
HKG
IDNIND
ISRJORKOR
MARMEX
MYS
PERPHLTUR
VEN
ZAF
–5.00
0.00
5.00
10.00
Gro
wth
0.00 2.50 5.00 7.50 10.00Volatility
Before
–5.00
0.00
5.00
10.00
Gro
wth ARG
BRA
CHL
CHN
COLEGY
HKG
IDNIND
ISRJOR
KOR
MARMEX
MYSPER
PHL
SGPTHA
TUR
VEN
ZAF
0.00 2.50 5.00 7.50 10.00Volatility
After
a. Trade Liberalization
–5.00
0.00
5.00
10.00
Gro
wth
0.00 2.50 5.00 7.50 10.00Volatility
ARG
BRA
CHL
CHN
COL EGY
HKG
IDNIND
ISR
JOR
KOR
MARMEX
MYSPAK
PERPHL
THA
TUR
VEN
ZAF
Before
0.00 2.50 5.00 7.50 10.00Volatility
–5.00
0.00
5.00
10.00
Gro
wth
ARGBRA
CHL
CHN
COL
EGY HKG IDNIND
ISRJOR
KOR
MAR
MEX
MYS
PAKPERPHL
SGP
THATUR
VENZAF
After
b. Financial Liberalization
Source: Authors’ calculations. MFI stands for More Financially Integrated countries.
Figure 1. Growth and Volatility in MFI Countries(Simple correlation, before and after liberalizations)

43
then examine the behavior of sample median volatility and growth over this windowbefore and after the liberalization dates.
Figure 4a displays the evolutions of the cross-sectional medians of averagegrowth rates of output and its components for eight years before and eight years aftera trade liberalization event. It appears that trade liberalizations often take placearound the time of an economic slowdown and are, in general, followed by a sub-stantial expansion in economic activity in the succeeding eight-year period. Changesin the growth rate of consumption closely follow those in output. After trade liber-alization, investment growth on average rises more than output growth, implying asubstantial increase in the rate of investment (investment/output). On average, the
Source: Authors’ calculations. Note: See Table 2 for information about sample coverage.
a. Trade Liberalization
–4
–2
0
2
4
6
8A
RG
BR
A
CH
N
CO
L
HK
G
IND
ISR
ME
X
MA
R
PE
R
PH
L
ZA
F
TU
R
ME
AN
ME
DIA
N
Ave
rage
gro
wth
rat
e (p
erce
nt)
Before After
b. Financial Liberalization
–3
–2
–1
0
1
2
3
4
5
6
7
AR
G
BR
A
CH
I
CH
N
CO
L
HK
G
IND
IDN
KO
R
MY
S
ME
X
PA
K
PE
RU
PH
L
ZA
F
TH
A
TU
R
VE
N
ME
AN
ME
DIA
N
Ave
rage
gro
wth
rat
e (p
erce
nt)
Before After
Figure 2. Output Growth: Before and After Liberalizations
GROWTH AND VOLATILITY IN AN ERA OF GLOBALIZATION

44
Tab
le 2
.G
row
th a
nd
Vo
latil
ity: D
esc
riptiv
e S
tatis
tics
Befo
re a
nd
Afte
r Li
be
raliz
atio
n(S
am
ple
me
an
s a
nd
me
dia
ns
for
the
MFI
co
un
trie
s)
Bef
ore
Aft
erB
efor
eA
fter
Bef
ore
Aft
erB
efor
eA
fter
Bef
ore
Aft
er
Gro
wth
Out
put
Con
sum
ptio
nIn
vest
men
tE
xpor
tsIm
port
s
Tra
de li
bera
lizat
ion
Mea
n0.
842.
230.
912.
01−1
.51
3.46
5.03
5.91
2.22
6.57
Med
ian
0.33
1.61
0.07
1.57
−2.5
73.
062.
874.
99−0
.54
5.20
Fin
anci
al li
bera
lizat
ion
Mea
n1.
882.
731.
602.
451.
752.
734.
716.
702.
587.
13M
edia
n1.
742.
660.
642.
622.
283.
534.
016.
922.
467.
69V
olat
ility
Out
put
Con
sum
ptio
nIn
vest
men
tE
xpor
tsIm
port
s
Tra
de li
bera
lizat
ion
Mea
n3.
883.
634.
924.
2017
.13
12.7
69.
986.
9816
.54
11.1
5M
edia
n4.
103.
594.
463.
8314
.06
12.8
19.
266.
6514
.95
10.0
0
Fin
anci
al li
bera
lizat
ion
Mea
n3.
873.
625.
104.
7816
.73
15.9
49.
156.
6915
.73
12.4
3M
edia
n3.
803.
564.
004.
6013
.45
15.1
98.
886.
6713
.58
11.9
4
Sour
ce: A
utho
rs’c
alcu
latio
ns.
Not
es:
The
per
iod
of a
naly
sis
is 1
980
to 2
000.
Cou
ntri
es w
ith f
ewer
tha
n fi
ve o
bser
vatio
ns, e
ither
bef
ore
or a
fter
lib
eral
izat
ion
have
bee
n dr
oppe
d fr
om t
hesa
mpl
e. M
FI s
tand
s fo
r M
ore
Fina
ncia
lly I
nteg
rate
d co
untr
ies.
M. Ayhan Kose, Eswar S. Prasad, and Marco E. Terrones

growth rates of imports and exports also register noticeable increases followingtrade liberalization. Figure 4b shows the median growth rates before and after finan-cial liberalizations. Financial liberalizations are also associated with a pickup in out-put growth, but the increase in the cross-sectional average of output growth rates issmaller than in the case of trade liberalizations. After financial liberalizations, thereis typically also a substantial increase in the growth rates of investment and imports.
How can we explain the V-shaped behavior of the growth performance of MFIeconomies around liberalization episodes? First, many of the liberalization programswere probably undertaken following an economic slowdown or crisis. Indeed,Tornell (1998) argues that economic reforms generally take place in the aftermath of
Source: Authors’ calculations. Note: See Table 2 for information about the sample coverage.
a. Trade Liberalization
0
2
4
6
8
10A
RG
BR
A
CH
N
CO
L
HK
G
IND
ISR
ME
X
MA
R
PE
R
PH
L
ZA
F
TU
R
ME
AN
ME
DIA
N
Stan
dard
dev
iati
on (
perc
ent)
Before After
b. Financial Liberalization
0
2
4
6
8
10
AR
G
BR
A
CH
I
CH
N
CO
L
HK
G
IND
IDN
KO
R
MY
S
ME
X
PA
K
PE
RU
PH
L
ZA
F
TH
A
TU
R
VE
N
ME
AN
ME
DIA
N
Stan
dard
dev
iati
on (
perc
ent)
Before After
Figure 3. Output Volatility: Before and After Liberalizations
45
GROWTH AND VOLATILITY IN AN ERA OF GLOBALIZATION

economic and/or political crises and documents that between 1970 and 1995, almost60 percent of trade liberalizations were implemented during periods of economicturmoil. Second, implementation of liberalization programs could signal a change inthe nature of economic policies, which in turn leads to increased credibility. In thecase of financial liberalizations, this probably increases both foreign financial flowsand domestic investment, which results in an increase in economic growth. In thecase of trade liberalizations, there could be an increase in domestic investment growthbecause of the fall in the cost of foreign capital goods and intermediate inputs. Theexport sector would also be expected to expand faster following trade liberaliza-tion, owing to increased access to foreign markets. Both of these could boost outputgrowth in the aftermath of trade liberalization programs.
Figures 5a–5b show how the cross-sectional medians of the volatility of thegrowth rates of output and its components evolve before and after trade and finan-cial liberalizations, respectively. Neither type of liberalization leads to a decisivechange in the volatility of output and consumption growth. However, growth ratesof investment, exports, and imports do appear to become somewhat less volatileafter trade and financial liberalizations.
Some of these results are consistent with other findings in the literature. Forexample, Wacziarg and Welch (2003) document that trade liberalizations are asso-
M. Ayhan Kose, Eswar S. Prasad, and Marco E. Terrones
46
Source: Authors’ calculations. Notes: 0 (zero) indicates the year of liberalization. In each panel, the sample median of eight-year rolling window of the average growth rate of respective variable is plotted.
b. Financial Liberalization
a. Trade Liberalization
0.0
0.5
1.0
1.5
2.0
2.5
3.0
–8 –6 –4 –2 0 2 4 6 80.0
0.5
1.0
1.5
2.0
2.5
3.0
–4
–2
0
2
4
6
8
10
–8 –6 –4 –2 0 2 4 6 8
0.5
1.5
2.5
3.5
4.5
5.5
6.5
0.8
1.2
1.6
2.0
2.4
2.8
3.2
–8 –7 –6 –5 –4 –3 –2 –1 0 2 3 4 5 6 7 810.5
1.0
1.5
2.0
2.5
3.0
3.5
0.0
0.5
1.0
1.5
2.0
2.5
3.0
3.5
4.0
4.5
5.0
–8 –6 –4 –2 0 2 4 6 81.0
2.3
3.6
4.9
6.2
7.5
8.8
10.1
Consumption(right scale)
Output(left scale)
Imports(right scale)
Exports(right scale)
Investment(left scale)
Output(left scale)
Consumption(right scale)
Exports(right scale)
Imports(right scale)
Investment(left scale)
Figure 4. Growth: Before and After Liberalizations(8-year rolling windows)

ciated with increases in the average growth rate of output and the investment rate.Bekaert, Harvey, and Lundblad (2001) find that equity market liberalizations onaverage produce a 1 percent increase in the growth rate of output over a five-yearperiod and lead to an increase in the investment rate. However, in the case of theimpact of financial liberalizations on volatility, our results are somewhat differentfrom those of Bekaert, Harvey, and Lundblad (2002), who employ a larger sampleof countries than in our data set. They find that after equity market liberalizations,there is generally a significant decrease in the volatility of output and consumptiongrowth.
A Regional Case Study: Growth and Volatility in Sub-Saharan Africa
In previous sections, we documented a negative relationship between growth andvolatility in developing countries. In addition, recent research concludes that outputvolatility could have a negative impact on poverty. Among the poorest regions of theworld, Sub-Saharan Africa (SSA) has always been a stark example of the negativerelationship between volatility and growth and the adverse effects of volatility onpoverty and welfare. The average growth rate of output in the region has been the
GROWTH AND VOLATILITY IN AN ERA OF GLOBALIZATION
47
Source: Authors’ calculations. Notes: 0 (zero) indicates the year of liberalization. In each panel, the sample median of the eight-year rolling window of the standard deviation of the average growth rate of the respective variable is plotted.
a. Trade Liberalization
b. Financial Liberalization
2.0
2.5
3.0
3.5
4.0
4.5
–8 –6 –4 –2 0 2 4 6 83.0
3.5
4.0
4.5
5.0
5.5
6.0
Consumption(right scale)
Output(left scale)
8
10
12
14
16
18
–8 –6 –4 –2 0 2 4 6 84
6
8
10
12
14
16
Imports(right scale)
Exports(right scale)
Investment(left scale)
2.4
2.8
3.2
3.6
4.0
–8 –6 –4 –2 0 2 4 6 83.5
4
4.5
5
5.5
Output(left scale)
Consumption(right scale)
8
9
10
11
12
13
14
15
–8 –6 –4 –2 0 2 4 6 84
6
8
10
12
14
16
18
Exports(right scale)
Imports(right scale)
Investment(left scale)
Figure 5. Volatility: Before and After Liberalizations(8-year rolling windows)
slowest of any region over the past three decades, while its volatility has been thehighest. This section briefly analyzes the relationship between growth and volatilityin SSA.10
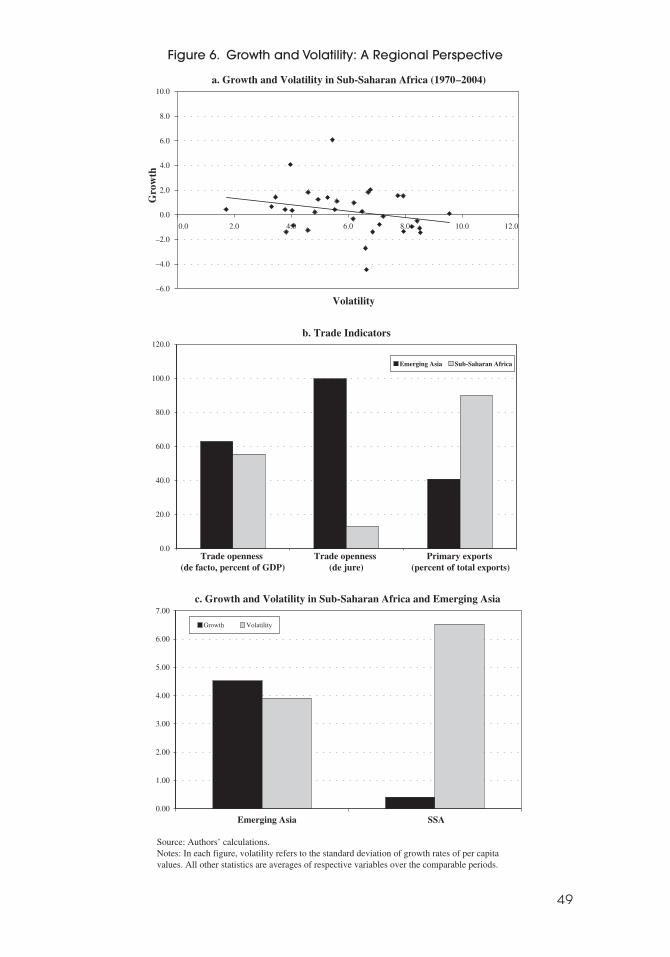
Figure 6a shows the negative relationship between volatility and growth insub-Saharan Africa over the period 1970–2004. The countries in SSA, in additionto being poor, share several other features that further magnify the negative effectsof volatility on growth. In particular, the strength and composition of economic link-ages with the global economy play a major role in explaining the negative relation-ship between volatility and growth in the region. For example, SSA’s trade linkageswith the global economy remain relatively weak, limiting the region’s ability to copewith the adverse impact of volatility on growth. Despite recent improvements in theregion as a whole, the trade policy regimes of several countries in SSA are highlyrestrictive, reflecting the presence of high and dispersed tariffs and widespread useof nontariff barriers.
Sub-Saharan African trade linkages with the global economy are weak in somerespects when compared, for instance, with the emerging market countries in Asia.(Figure 6b). As we show using various regression models in the next section, weaktrade linkages could be one of the major factors driving the negative associa-tion between volatility and growth in the region. Moreover, sub-Saharan Africaneconomies depend on a narrow range of commodities for their export earnings. Inparticular, primary goods constitute close to 90 percent of total exports in these coun-tries, which is more than double that in emerging Asia. Mainly because of this, terms-of-trade fluctuations are very volatile in the sub-Saharan African countries, adverselyaffecting growth. Consistent with the stylized facts we documented earlier, the aver-age growth is much higher in emerging Asian countries than in sub-Saharan Africa,while volatility in emerging Asia is roughly half of that in the SSA region (Figure 6c).
III. Regression Analysis
This section turns to a more formal empirical analysis of the growth-volatility rela-tionship. We first reexamine the validity of the basic RR results in our longer (andslightly different) sample covering the period 1960–2000. Next, we analyze theimpact of globalization on this relationship by interacting volatility with the measuresof economic integration in our regressions. We also provide a brief discussion of howdifferent types of financial flows could affect the growth-volatility relationship. Wethen turn our attention to the effects of volatility stemming from different componentsof demand on this relationship. Finally, we examine the impact of numerous addi-tional control variables and conduct some robustness tests of our main results.
The Basic Relationship Between Growth and Volatility
The first regression that RR report in their paper is a cross-sectional bivariate regres-sion of mean output growth on its standard deviation for a 92-country sample
M. Ayhan Kose, Eswar S. Prasad, and Marco E. Terrones
48
10Some of the material in this subsection is drawn from research conducted by two of the authors ofthis paper for the IMF’s World Economic Outlook (see Kose and Terrones, 2005).
49
a. Growth and Volatility in Sub-Saharan Africa (1970–2004)
–6.0
–4.0
–2.0
0.0
2.0
4.0
6.0
8.0
10.0
0.0 2.0 4.0 6.0 8.0 10.0 12.0
Volatility
Gro
wth
b. Trade Indicators
0.0
20.0
40.0
60.0
80.0
100.0
120.0
Trade openness (de facto, percent of GDP)
Trade openness (de jure)
Primary exports (percent of total exports)
Emerging Asia Sub-Saharan Africa
c. Growth and Volatility in Sub-Saharan Africa and Emerging Asia
0.00
1.00
2.00
3.00
4.00
5.00
6.00
7.00
Emerging Asia SSA
Growth Volatility
Source: Authors’ calculations. Notes: In each figure, volatility refers to the standard deviation of growth rates of per capita values. All other statistics are averages of respective variables over the comparable periods.
Figure 6. Growth and Volatility: A Regional Perspective
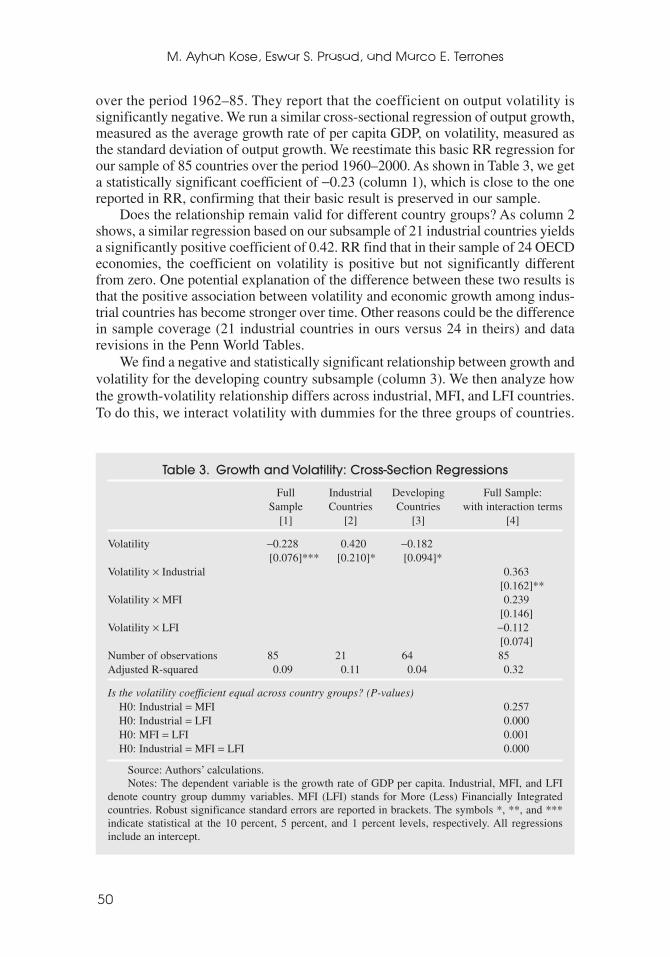
over the period 1962–85. They report that the coefficient on output volatility issignificantly negative. We run a similar cross-sectional regression of output growth,measured as the average growth rate of per capita GDP, on volatility, measured asthe standard deviation of output growth. We reestimate this basic RR regression forour sample of 85 countries over the period 1960–2000. As shown in Table 3, we geta statistically significant coefficient of −0.23 (column 1), which is close to the onereported in RR, confirming that their basic result is preserved in our sample.
Does the relationship remain valid for different country groups? As column 2shows, a similar regression based on our subsample of 21 industrial countries yieldsa significantly positive coefficient of 0.42. RR find that in their sample of 24 OECDeconomies, the coefficient on volatility is positive but not significantly differentfrom zero. One potential explanation of the difference between these two results isthat the positive association between volatility and economic growth among indus-trial countries has become stronger over time. Other reasons could be the differencein sample coverage (21 industrial countries in ours versus 24 in theirs) and datarevisions in the Penn World Tables.
We find a negative and statistically significant relationship between growth andvolatility for the developing country subsample (column 3). We then analyze howthe growth-volatility relationship differs across industrial, MFI, and LFI countries.To do this, we interact volatility with dummies for the three groups of countries.
M. Ayhan Kose, Eswar S. Prasad, and Marco E. Terrones
50
Table 3. Growth and Volatility: Cross-Section Regressions
Full Industrial Developing Full Sample: Sample Countries Countries with interaction terms
[1] [2] [3] [4]
Volatility −0.228 0.420 −0.182[0.076]*** [0.210]* [0.094]*
Volatility × Industrial 0.363[0.162]**
Volatility × MFI 0.239[0.146]
Volatility × LFI −0.112[0.074]
Number of observations 85 21 64 85Adjusted R-squared 0.09 0.11 0.04 0.32
Is the volatility coefficient equal across country groups? (P-values)H0: Industrial = MFI 0.257H0: Industrial = LFI 0.000H0: MFI = LFI 0.001H0: Industrial = MFI = LFI 0.000
Source: Authors’ calculations.Notes: The dependent variable is the growth rate of GDP per capita. Industrial, MFI, and LFI
denote country group dummy variables. MFI (LFI) stands for More (Less) Financially Integratedcountries. Robust significance standard errors are reported in brackets. The symbols *, **, and ***indicate statistical at the 10 percent, 5 percent, and 1 percent levels, respectively. All regressionsinclude an intercept.

GROWTH AND VOLATILITY IN AN ERA OF GLOBALIZATION
51
We again find a statistically significant positive relationship between volatilityand growth for industrial countries (column 4). The results suggest that there isa weak positive association between volatility and growth (borderline signifi-cant at the 10 percent level) for MFI economies, whereas it is negative (but notstatistically significant) for LFI countries. In addition, the coefficient associatedwith LFI economies appears to be significantly different from those of other groupsof economies.
Three main findings from this exercise stand out. First, the unconditional neg-ative cross-sectional relationship between growth and volatility documented by RRis preserved in our sample. Second, the basic relationship is sensitive to the choiceof country groups. In particular, the results indicate that while there is a significantpositive relationship for industrial countries, the relationship is significantly nega-tive for developing countries. Third, the association between growth and volatilityappears to differ across the groups of MFI and LFI economies. The latter two resultssuggest that levels of trade and financial integration might have an influence on thegrowth-volatility relationship.
However, these bivariate regressions set aside the issue of additional controlsthat could explain growth. To address this issue, we follow the RR study and includea set of standard controls commonly used in the growth literature, including thelog level of initial per capita income, the fraction of the population with at leasta primary education, the share of investment in GDP, and the average populationgrowth rate. We present the results of regressions with additional controls inTable 4 (column 2). The results indicate that these additional controls are statis-tically significant with their expected signs. The education variable has a signif-icantly positive impact on growth, and initial per capita income has a significantand negative impact (which has been interpreted as evidence of conditional con-vergence). More importantly, the nature of the relationship between growth andvolatility is not affected by the inclusion of the growth controls. In particular,while the coefficient on volatility becomes smaller, it retains its statistical sig-nificance.11 We then estimate the regressions using the industrial and developingcountry subsamples (columns 3 and 4). The results are broadly consistent withthose from the full sample. Interestingly, for the industrial country subsample, thecoefficient on volatility is almost the same as that in the RR regression (−0.385 inRR and −0.379 in ours; both are statistically significant).
These findings indicate that the growth-volatility relationship documented byRR persisted into the 1990s. However, the unconditional correlations in Table 3also suggest that there could be a nonlinear relationship between growth andvolatility, since the correlation is negative for developing countries and positive forindustrial countries. To further analyze the nature of this nonlinearity, we nowexamine directly the roles of trade and financial linkages.
11These results are consistent with the findings in Hnatkovska and Loayza (2005), but they differ fromthose in Fatás and Mihov (2003). The latter study reports that while the unconditional growth-volatilityrelationship is significantly negative, it becomes insignificant when these authors introduce the additionalgrowth controls.

52
Tab
le 4
.G
row
th a
nd
Vo
latil
ity: C
ross
-Se
ctio
n R
eg
ress
ion
s
[1]
[2]
[3]
[4]
[5]
[6]
[7]
[8]
Vol
atili
ty−0
.228
***
−0.1
57**
−0.3
79**
−0.1
84**
−0.1
52*
−0.2
32**
−0.0
90−0
.230
***
[0.0
76]
[0.0
73]
[0.1
42]
[0.0
73]
[0.0
77]
[0.0
89]
[0.0
87]
[0.0
86]
Vol
atili
ty ×
Tra
de
0.11
9***
0.16
2***
inte
grat
ion
[0.0
44]
[0.0
52]
Vol
atili
ty ×
Fina
ncia
l −0
.128
−0.6
37**
inte
grat
ion
[0.5
88]
[0.3
18]
Tra
de in
tegr
atio
n 0.
012*
**0.
011*
0.01
2**
0.01
2***
(bin
ary)
[0.0
04]
[0.0
05]
[0.0
05]
[0.0
04]
Fina
ncia
l int
egra
tion
0.01
30.
003
0.00
50.
009
(bin
ary)
[0.0
11]
[0.0
11]
[0.0
13]
[0.0
10]
Tra
de in
tegr
atio
n 0.
009*
**(p
erce
nt o
f G
DP)
[0.0
03]
Fina
ncia
l int
egra
tion
−0.0
26**
*(p
erce
nt o
f G
DP)
[0.0
09]
Initi
al in
com
e (l
og)
−0.0
09**
*−0
.026
***
−0.0
06**
*−0
.010
***
−0.0
10**
*−0
.010
***
−0.0
10**
*[0
.002
][0
.005
][0
.002
][0
.002
][0
.002
][0
.002
][0
.002
]Pr
imar
y ed
ucat
ion
0.02
2***
0.04
10.
014*
*0.
024*
**0.
024*
**0.
025*
**0.
023*
**[0
.005
][0
.025
][0
.007
][0
.007
][0
.005
][0
.006
][0
.005
]In
vest
men
t rat
e 0.
111*
**−0
.016
0.13
3***
0.05
5**
0.06
3**
0.08
3***
0.05
6**
(per
cent
of
GD
P)[0
.028
][0
.030
][0
.028
][0
.027
][0
.026
][0
.030
][0
.027
]Po
pula
tion
grow
th−0
.005
***
−0.0
04*
−0.0
07**
−0.0
04**
−0.0
04**
−0.0
03*
−0.0
04**
[0.0
02]
[0.0
02]
[0.0
03]
[0.0
02]
[0.0
02]
[0.0
02]
[0.0
02]
Num
ber
of o
bser
vatio
ns85
8521
6485
8585
85A
djus
ted
R-s
quar
ed0.
090.
540.
800.
530.
620.
600.
560.
62
Sour
ce: A
utho
rs’c
alcu
latio
ns.
Not
es: T
he d
epen
dent
var
iabl
e is
the
grow
th r
ate
of G
DP
per
capi
ta. R
obus
t sta
ndar
d er
rors
are
rep
orte
d in
bra
cket
s. T
he s
ymbo
ls *
, **,
and
***
indi
cate
sta
-tis
tical
sig
nifi
canc
e at
the
10
perc
ent,
5 pe
rcen
t, an
d 1
perc
ent
leve
ls, r
espe
ctiv
ely.
For
the
int
erac
tion
term
s, t
rade
int
egra
tion
is d
efin
ed a
s th
e ra
tio o
f to
tal
trad
eto
GD
P, a
nd f
inan
cial
inte
grat
ion
is d
efin
ed a
s th
e ra
tio o
f ca
pita
l flo
ws
to G
DP.
All
regr
essi
ons
incl
ude
an in
terc
ept.
M. Ayhan Kose, Eswar S. Prasad, and Marco E. Terrones

GROWTH AND VOLATILITY IN AN ERA OF GLOBALIZATION
53
Understanding the Role of Globalization
We now analyze how different aspects of globalization affect the growth-volatilityrelationship by introducing various measures of integration into the cross-sectionregression. Interestingly, when we introduce measures of trade and financial inte-gration, the coefficient on volatility remains negative and statistically significant(Table 4, column 5). The coefficients on both trade integration variables are statisti-cally significant and positive, indicating that trade integration has a positive impacton economic growth even after controlling for the effect of volatility. However, thecoefficient on the financial openness variable is negative. As noted in Section I, sev-eral papers suggest that there is no robust correlation between financial integrationand economic growth, and, in some of these, the coefficient on financial opennesshas a negative sign, similar to the result reported here.
We then interact volatility with the integration variables to examine if the rela-tionship between growth and volatility is linked to the degree of integration. Whenwe interact the volatility variable with measures of integration, we always use con-tinuous rather than discrete measures of the latter. These continuous measurescapture variations over time in the degree of trade and financial integration betterthan the binary ones, as they more accurately reflect the changes in annual tradeand financial flows.
Column 6 of Table 4 shows that the interaction between volatility and trade inte-gration is significantly positive. The coefficient on volatility is also significant andnegative. The positive interaction term indicates that the greater the degree of tradeintegration, the weaker the negative relationship between volatility and growth. Inother words, for a given level of volatility, economies with a higher degree of tradeintegration appear to suffer smaller negative effects on growth than those with alower degree of trade integration. Column 7 reports results for the measures of finan-cial integration. The basic relationship between growth and volatility disappears,and only the binary measure of trade integration has a positive and statistically sig-nificant coefficient.
We now turn our attention to the roles played by trade and financial integrationtogether to get a better grasp of how different aspects of globalization affect therelationship between growth and volatility. When we include both the trade andfinancial interaction terms, the positive coefficient on the interaction with tradeintegration stays statistically significant, while the coefficient on the financial inte-gration interaction term turns negative and significant (column 8). Thus, once tradeintegration is accounted for, financial integration appears to have a negative impacton the growth-volatility relationship. This result is similar and could be related tothe sign of the coefficient on the financial integration variable in column 3.
One interpretation of these results is that higher trade openness brings with itbenefits in terms of higher growth even though it may also expose an economy tomore volatility arising from external shocks. This is consistent with a large body ofliterature showing that trade integration is good for growth (Baldwin, 2003; Bergand Krueger, 2003; and Winters, 2004) but is typically associated with highervolatility (Kose, Prasad, and Terrones, 2003a). What are the mechanisms throughwhich openness to trade could mitigate the adverse impact of volatility on growth?

12Kose, Meredith, and Towe (2005) analyze the impact of the North American Free Trade Agreementon the dynamics of volatility and growth in Mexico and argue that trade integration has made the Mexicaneconomy more resilient to shocks and may have contributed to Mexico’s faster recovery from the 1994–95peso crisis than from the 1982 debt crisis.
13Non-FDI flows could include official flows. However, in our data set, it is difficult to distinguishbetween official grants/loans and other types of non-FDI flows. Hence, the results below using non-FDIflows should be interpreted with some caution.
M. Ayhan Kose, Eswar S. Prasad, and Marco E. Terrones
54
While our present paper does not attempt to address this question, recent researchsuggests several possible mechanisms. For example, trade integration could help adeveloping economy export its way out of a recession, since a given exchange ratedepreciation could have a larger impact on its export revenues than in an economywith weaker trade linkages. Stronger export revenues could also help service exter-nal debt, which is quite substantial in a number of developing countries (see Catão,2002). These factors also suggest that openness to trade flows could make devel-oping countries less vulnerable to sudden stops of international capital flows (seeCavallo and Frankel, 2004).12
Could the results for the financial openness variable be driven by highly volatileportfolio flows? As discussed in Section I, some studies find that different types offinancial flows may have different effects on economic performance. In particular,these studies consistently indicate that FDI flows tend to be positively associatedwith economic growth. While other forms of capital inflows could also have a pos-itive association with economic growth, their impact tends to be smaller and lessrobust (Prasad and others, 2003; Reisen and Soto, 2001). Another important featurethat has been documented in the literature is that different types of capital flows dif-fer substantially in terms of their volatility. For example, FDI flows constitute theleast volatile category of financial flows to developing countries, which is not sur-prising given their long-term and relatively fixed nature. Portfolio flows tend to befar more volatile and prone to abrupt reversals (Wei, 2001).
To further analyze the impact of financial integration on the growth-volatilityrelationship, we now compare the impacts of different types of financial flows. Wefocus on two broad categories: FDI flows and all other categories of flows, includ-ing portfolio flows and bank lending.13 The first panel of Table 5 shows the resultsof cross-section regressions when volatility is interacted with financial integration,now measured by the ratio of gross flows of FDI to GDP. The coefficients associatedwith the interaction terms suggest that FDI flows have a significant and positiveimpact on the relationship between growth and volatility (columns 1, 2, and 3).When both interaction terms are employed, the coefficient on the trade opennessinteraction, while still positive, turns insignificant (column 4). Interestingly, the inter-action term on financial integration becomes positive and significant, suggestingthat FDI flows could dampen the adverse impact of volatility on economic growth.
When volatility is interacted with the other financial integration measure, whichis based on gross non-FDI capital inflows and outflows as a ratio to GDP, the inter-action term on financial integration again turns negative (columns 5–7). Moreover,when the trade openness interaction is included, the interaction coefficient associ-ated with financial integration becomes significantly negative (column 8). The inter-action term-on-trade integration, on the other hand, again becomes positive and

Tab
le 5
.G
row
th a
nd
Vo
latil
ity: C
ross
-Se
ctio
n R
eg
ress
ion
s(D
iffe
ren
t typ
es
of f
ina
nc
ial f
low
s)
FDI
Flow
sA
ll O
ther
Flo
ws
[1]
[2]
[3]
[4]
[5]
[6]
[7]
[8]
Vol
atili
ty−0
.142
*−0
.232
**−0
.141
*−0
.200
**−0
.144
*−0
.232
**−0
.078
−0.2
16**
[0.0
79]
[0.0
89]
[0.0
79]
[0.0
90]
[0.0
78]
[0.0
89]
[0.0
85]
[0.0
87]
Vol
atili
ty ×
Tra
de
0.11
9***
0.06
20.
119*
**0.
127*
**in
tegr
atio
n[0
.044
][0
.047
][0
.044
][0
.043
]V
olat
ility
×Fi
nanc
ial
1.51
7***
1.11
4**
−0.4
25−0
.487
***
inte
grat
ion
[0.3
45]
[0.4
93]
[0.3
7][0
.174
]T
rade
inte
grat
ion
0.01
3***
0.01
1*0.
015*
**0.
014*
**0.
013*
**0.
011*
0.01
4***
0.01
3***
(bin
ary)
[0.0
05]
[0.0
05]
[0.0
05]
[0.0
05]
[0.0
04]
[0.0
05]
[0.0
05]
[0.0
04]
Fina
ncia
l int
egra
tion
−0.0
010.
003
−0.0
010.
000
0.01
00.
003
0.00
60.
006
(bin
ary)
[0.0
12]
[0.0
11]
[0.0
11]
[0.0
11]
[0.0
10]
[0.0
11]
[0.0
11]
[0.0
10]
Tra
de in
tegr
atio
n 0.
004
0.00
8***
(per
cent
of
GD
P)[0
.004
][0
.003
]Fi
nanc
ial i
nteg
ratio
n 0.
042
−0.0
23**
*(p
erce
nt o
f G
DP)
[0.0
31]
[0.0
06]
Initi
al in
com
e (l
og)
−0.0
10**
*−0
.010
***
−0.0
10**
*−0
.010
***
−0.0
10**
*−0
.010
***
−0.0
10**
*−0
.010
***
[0.0
02]
[0.0
02]
[0.0
02]
[0.0
02]
[0.0
02]
[0.0
02]
[0.0
02]
[0.0
02]
Prim
ary
educ
atio
n0.
024*
**0.
024*
**0.
024*
**0.
023*
**0.
024*
**0.
024*
**0.
025*
**0.
023*
**[0
.006
][0
.005
][0
.006
][0
.006
][0
.006
][0
.005
][0
.006
][0
.005
]In
vest
men
t rat
e 0.
067*
*0.
063*
*0.
067*
*0.
061*
*0.
057*
*0.
063*
*0.
078*
*0.
057*
*(p
erce
nt o
f G
DP)
[0.0
26]
[0.0
26]
[0.0
26]
[0.0
26]
[0.0
27]
[0.0
26]
[0.0
30]
[0.0
27]
Popu
latio
n gr
owth
−0.0
03**
−0.0
04**
−0.0
03*
−0.0
03*
−0.0
04**
−0.0
04**
−0.0
03*
−0.0
04**
[0.0
02]
[0.0
01]
[0.0
02]
[0.0
02]
[0.0
02]
[0.0
02]
[0.0
02]
[0.0
02]
Obs
erva
tions
8585
8585
8585
8585
Adj
uste
d R
-squ
ared
0.61
0.60
0.62
0.62
0.62
0.60
0.58
0.62
Sour
ce: A
utho
rs’c
alcu
latio
ns.
Not
es: T
he d
epen
dent
var
iabl
e is
the
grow
th r
ate
of G
DP
per
capi
ta. T
rade
inte
grat
ion
is th
e ra
tio o
f to
tal t
rade
to G
DP.
Fin
anci
al in
tegr
atio
n is
the
ratio
of
FDI
flow
s to
GD
Pin
col
umns
1 t
hrou
gh 4
and
the
rat
io o
f po
rtfo
lio a
nd o
ther
flo
ws
to G
DP
in c
olum
ns 5
thr
ough
8. R
obus
t st
anda
rd e
rror
s ar
e re
port
ed i
n br
acke
ts.
The
sym
bols
*, *
*, a
nd *
** in
dica
te s
tatis
tical
sig
nifi
canc
e at
the
10 p
erce
nt, 5
per
cent
, and
1 p
erce
nt le
vels
, res
pect
ivel
y. A
ll re
gres
sion
s in
clud
e an
inte
rcep
t.
55

14Aizenman and Marion (1999) find a negative correlation between aggregate volatility and privateinvestment in developing countries. RR find little evidence in support of theories that attribute the nega-tive link between volatility and economic growth to investment dynamics. Balassa (1978), Feder (1983),Moran (1983), and Basu and McLeod (1992) examine the relationship between export instability and eco-nomic growth.
15We also examined the roles played by the volatility of the growth rates of exports and imports. Thoseresults are not reported here, since those two components of GDP do not appear to be important in driv-ing the growth-volatility relationship.
16For example, investment plays a critical role in transmitting the negative impact of volatility to growthin Africa. While sub-Saharan Africa’s low rate of investment has always been a major impediment to eco-nomic growth, the high volatility of investment in the region has been particularly damaging (see Fischer,Hernández-Catá, and Khan, 1998). The average growth rate of investment in sub-Saharan Africa has beenthe slowest of any region over the past three decades, while its volatility has been the highest. Sub-SaharanAfrican countries also suffer from the detrimental effects of highly volatile and procyclical fiscal policies oneconomic growth. Government revenues in sub-Saharan Africa are dependent on extremely volatile com-modity exports, which results in large fluctuations in these revenues (Dehn, Gilbert, and Varangis, 2005).Recent research shows that highly volatile and procyclical fiscal policies often lead to an increase in theamplitude of macroeconomic fluctuations and lower economic growth (Fatás and Mihov, 2003).
M. Ayhan Kose, Eswar S. Prasad, and Marco E. Terrones
56
significant. These findings suggest that portfolio and other flows, which are relativelymore volatile than FDI flows, tend to intensify the negative relationship betweenvolatility and growth, while trade openness appears to weaken it.
Roles Played by Different Components of Aggregate Demand
Section I discussed the potential roles played by various components of demandand different types of shocks in linking the volatility of output to economic growth.We now examine how the volatility of the growth rates of different components ofdemand affect the growth rate of output. This could help explain the nature of therelationship between the amplitude of macroeconomic fluctuations and economicgrowth as emphasized by some studies. For example, some theoretical models arguethat the link between growth and volatility depends on the dynamics of investment.Bernanke (1983) and Aizenman and Marion (1993) construct models in whichirreversibilities and/or the presence of asymmetric adjustment costs in investmentcould lead to higher volatility and lower investment, which in turn reduces eco-nomic growth.14
To shed light on this issue, we regress the growth rate of output on the volatil-ity of each demand component within the same regression framework used so far. Inparticular, we focus on the roles played by consumption, investment, and governmentexpenditure.15 The results in Table 6 show that the unconditional correlation betweengrowth and volatility remains significantly negative when we include the volatility ofthe demand components except for government expenditures (columns 1, 4, and 7).We then reestimate the same relationship after introducing additional growth controls(columns 2, 5, and 8). There is a significant and negative relationship between outputgrowth and the volatility of each demand component, indicating the importance ofeach of these components in accounting for the overall negative relationship betweengrowth and volatility.16
Next, we analyze how globalization affects the growth-volatility relationship byinteracting the volatility of each demand component with the measures of integra-

57
Tab
le 6
.G
row
th a
nd
Vo
latil
ity: C
ross
-Se
ctio
n R
eg
ress
ion
s(C
om
po
ne
nts
of D
em
an
d)
Con
sum
ptio
nIn
vest
men
tG
over
nmen
t Exp
endi
ture
[1]
[2]
[3]
[4]
[5]
[6]
[7]
[8]
[9]
Vol
atili
ty−0
.136
***
−0.1
00**
−0.1
87**
*−0
.077
***
−0.0
42**
*−0
.058
***
−0.0
31−0
.045
*−0
.060
**[0
.046
][0
.039
][0
.049
][0
.014
][0
.013
][0
.019
][0
.032
][0
.024
][0
.025
]V
olat
ility
×T
rade
0.
120*
*0.
043
0.04
2in
tegr
atio
n[0
.048
][0
.026
][0
.027
]V
olat
ility
×Fi
nanc
ial
−0.4
31−0
.171
−0.1
80in
tegr
atio
n[0
.400
][0
.136
][0
.140
]T
rade
inte
grat
ion
0.01
2**
0.01
2**
0.01
6***
(bin
ary)
[0.0
05]
[0.0
05]
[0.0
04]
Fina
ncia
l int
egra
tion
0.00
80.
010
0.00
7(b
inar
y)[0
.011
][0
.011
20]
[0.0
11]
Tra
de in
tegr
atio
n (p
erce
nt o
f G
DP)
Fina
ncia
l int
egra
tion
(per
cent
of
GD
P)In
itial
inco
me
(log
)−0
.009
***
−0.0
10**
*−0
.008
***
−0.0
10**
*−0
.008
***
−0.0
10**
*[0
.002
][0
.002
][0
.002
][0
.002
][0
.002
][0
.002
]Pr
imar
y ed
ucat
ion
0.02
4***
0.02
6***
0.01
9***
0.02
0***
0.02
2***
0.02
5***
[0.0
06]
[0.0
06]
[0.0
06]
[0.0
06]
[0.0
06]
[0.0
06]
Inve
stm
ent r
ate
0.10
6***
0.05
3*0.
097*
**0.
055*
*0.
110*
**0.
061*
*(p
erce
nt o
f G
DP)
[0.0
29]
[0.0
27]
[0.0
26]
[0.0
23]
[0.0
25]
[0.0
26]
Popu
latio
n gr
owth
−0.0
05**
*−0
.004
**−0
.005
***
−0.0
03**
−0.0
06**
*−0
.004
**[0
.002
][0
.002
][0
.002
][0
.002
][0
.002
][0
.002
]O
bser
vatio
ns85
8585
8585
8585
8585
Adj
uste
d R
-squ
ared
0.10
0.56
0.63
0.25
0.56
0.61
0.00
0.54
0.61
Sour
ce: A
utho
rs’c
alcu
latio
ns.
Not
es: T
he d
epen
dent
var
iabl
e is
the
grow
th r
ate
of G
DP
per
capi
ta. V
olat
ility
is m
easu
red
by th
e vo
latil
ity o
f co
nsum
ptio
n in
col
umns
1 th
roug
h 3,
by
the
vola
tility
of
inve
stm
ent
in c
olum
ns 4
thro
ugh
6, a
nd th
e vo
latil
ity o
f go
vern
men
t exp
endi
ture
in c
olum
ns 7
thro
ugh
9. T
rade
inte
grat
ion
is th
e ra
tio o
f to
tal t
rade
to G
DP.
Rob
ust s
tand
ard
erro
rs a
re r
epor
ted
inbr
acke
ts. T
he s
ymbo
ls *
, **,
and
***
indi
cate
sta
tistic
al s
igni
fica
nce
at th
e 10
per
cent
, 5 p
erce
nt, a
nd 1
per
cent
leve
ls, r
espe
ctiv
ely.
All
regr
essi
ons
incl
ude
an in
terc
ept.
M. Ayhan Kose, Eswar S. Prasad, and Marco E. Terrones
58
tion in our regressions (columns 3, 6, and 9). Our results are broadly consistent withthe benchmark findings reported in Table 4. For all three demand components, tradeintegration appears to weaken the negative relationship between growth and volatil-ity, but the interaction term on trade integration is statistically significant only for thevolatility of consumption growth. There are a couple of possible reasons why theresults with consumption are most similar to our benchmark findings. First, con-sumption fluctuations could be better at tracking the fluctuations in output simplybecause consumption is the largest component of output in most of the countries inour sample. Moreover, among the components of domestic demand, the growth rateof consumption has the highest correlation with output growth. In the case of thefinancial integration variable, the results indicate that the interaction term is againnegative, but not statistically significant, in all of these specifications.
Robustness Tests
We conducted a variety of robustness tests of our main results. To conserve space,we only summarize our main findings here.17 We took the benchmark specification(Table 4, column 8) and added a number of additional controls (one per regression—we did not include all of these additional controls simultaneously). These additionalcontrols included measures of financial development (ratios of broad money and pri-vate sector credit to GDP), real exchange rate overvaluation, the composition of out-put (share of the agricultural sector in GDP), indicators of institutional quality, andthe skewness of output growth (one way of capturing the effects of large episodes ofvolatility on the growth-volatility relationship). We also checked the sensitivity ofour results to alternative regression frameworks. To address the concern that the keyresults could be driven by outliers, we reestimated the benchmark specificationusing a least-absolute deviation regression.18
In virtually all of these specifications, the negative coefficient on volatility andthe positive coefficients on the trade integration and volatility*trade integrationinteraction variables were preserved. The coefficients on financial integration andvolatility*financial integration proved to be somewhat fragile, however, losing theirstatistical significance in a few of the specifications. In short, many of the key resultsof our paper—especially those related to trade integration—are reasonably robust.In particular, the role of trade integration in dampening the negative associationbetween growth and volatility is significant across all these robustness experiments.
IV. Conclusions
This paper has provided a comprehensive examination of the relationship betweengrowth and volatility. We first documented the basic stylized facts about the evolu-tion of the growth and volatility relationship over time and across countries. The
17Tables with detailed results are available from the authors upon request.18Another potential concern is endogeneity of the trade and financial integration variables. This is a
much bigger concern for panel data estimation. In our earlier paper (Kose, Prasad, and Terrones, 2005),where we use growth and volatility measures over 10-year periods and conduct panel estimation, we runinstrumental variables regressions to address this problem explicitly.

results indicate that this relationship has been changing over time and across differ-ent country groups in response to increased trade and financial flows. In particular,evidence suggests that the nature of this relationship differs even among developingcountries, depending on the level of their integration into the global economy. Resultsfrom the event-study analysis suggest that there tends to be a major shift in thegrowth-volatility relationship after trade and financial liberalizations. For example,among MFI economies, the relationship is strongly negative in the period beforetrade liberalizations and positive after that. The difference between the pre- and post-financial liberalizations periods follows a similar but less definitive pattern. Thesefindings suggest that trade and financial integration could have a considerable effecton the association between volatility and growth.
We then provided a more formal analysis of the relationship between growthand volatility using various cross-section regression models. Several interestingresults from this analysis stand out. First, when we include the data for the 1990s,the negative relationship between volatility and growth appears to survive, but withsome important qualifications. Trade integration seems to attenuate the negativegrowth-volatility relationship, as the estimated coefficients on interactions betweenvolatility and trade integration are significantly positive. This suggests that countriesthat are more open to trade flows could face a less severe trade-off between growthand volatility. Financial integration, however, seems to strengthen the negative rela-tionship between growth and volatility.
We then examined whether the latter finding could be driven by highly volatileportfolio flows. Our results indicate that portfolio and other capital flows, whichare relatively more volatile than FDI flows, do intensify the negative relationship,while FDI flows dampen the adverse impact of volatility on economic growth.We also found that volatility stemming from various components of aggregatedemand—including consumption, investment, and government expenditure—isnegatively associated with overall economic growth.
Does the result about the role of financial integration imply that the adverseimpact of macroeconomic volatility on growth is further exacerbated in more finan-cially integrated economies? Such a strong conclusion may not be warranted simplyon the basis of the cross-section regressions presented in this paper, which do not uti-lize the marked variation over time in the measures of integration. As briefly docu-mented above, trade linkages have increased substantially over the past four decades.Moreover, these changes over time are particularly important in the context of finan-cial integration, which has risen greatly since the mid-1980s. In our earlier paper(Kose, Prasad, and Terrones, 2005), we provided a panel regression analysis of therelationship between volatility and growth that is aimed at capturing the effects ofthe significant changes over time in the volume of trade and financial flows. Thatanalysis indicates that both trade and financial integration attenuate the negativegrowth-volatility relationship. This finding suggests that it is necessary to considerthe temporal patterns as well as cross-sectional changes in the dynamics of financialflows in order to account for the impact of financial integration on the relationshipbetween volatility and growth. While the results for trade integration are very similarto those reported here, our earlier paper also documents that the results for the inter-action of financial integration with volatility are smaller and less robust in termsof statistical significance across different specifications.
GROWTH AND VOLATILITY IN AN ERA OF GLOBALIZATION
59

M. Ayhan Kose, Eswar S. Prasad, and Marco E. Terrones
60
The finding that FDI flows may have different effects than the other types ofcapital flows is intriguing. However, before drawing any firm conclusions, a deeperanalysis of this issue is warranted. In future work, we also plan to examine how cap-ital account openness and domestic financial sector liberalization jointly affect aneconomy’s growth rate and exposure to macroeconomic volatility.
REFERENCES
Aghion, Philippe, Abhijit Banerjee, and Thomas Piketty, 1999, “Dualism and MacroeconomicVolatility,” Quarterly Journal of Economics, Vol. 114, No. 4, pp. 1359–97.
Aghion, Philippe, Philippe Bacchetta, and Abhijit Banerjee, 2000, “Capital Markets and theInstability in Open Economies,” in The Asian Crisis: Causes, Contagion, and Consequences,ed. by P. R. Agenor, M. Miller, D. Vines, and A. Weber (Cambridge: Cambridge UniversityPress).
Aizenman, Joshua, and Nancy Marion, 1993, “Policy Uncertainty, Persistence and Growth,”Review of International Economics, Vol. 1 (June), pp. 145–63.
———, 1999, “Volatility and Investment: Interpreting Evidence from Developing Countries,”Economica, Vol. 66 (May), pp. 157–79.
Aizenman, Joshua, and Brian Pinto, eds., 2005, Managing Economic Volatility and Crises: APractitioner’s Guide (forthcoming; Cambridge: Cambridge University Press).
Alfaro, Laura, Areendam Chanda, Sebnem Kalemli-Ozcan, and Selin Sayek, 2004, “FDI andEconomic Growth: The Role of Local Financial Markets,” Journal of InternationalEconomics, Vol. 64, No. 1, pp. 113–34.
Balassa, Bela, 1978, “Exports and Economic Growth: Further Evidence,” Journal of DevelopmentEconomics, Vol. 5, pp. 181–89.
Baldwin, Richard, 2003, “Openness and Growth: What Is the Empirical Relationship?” NBERWorking Paper No. 9578 (Cambridge, Massachusetts: National Bureau of EconomicResearch).
———, and Elena Seghezza, 1998, “Testing for Trade-Induced Investment-Led Growth,”NBER Working Paper No. 5416 (Cambridge, Massachusetts: National Bureau of EconomicResearch).
Barlevy, Gadi, 2004, “The Cost of Business Cycles and the Benefits of Stabilization: A Survey,”NBER Working Paper No. 10926 (Cambridge, Massachusetts: National Bureau of EconomicResearch).
Basu, Parantap, and Darryl McLeod, 1992, “Terms of Trade Fluctuations and Economic Growthin Developing Countries,” Journal of Development Economics, Vol. 37, No. 1, pp. 89–110.
Bekaert, Geert, Campbell R. Harvey, and Christian Lundblad, 2001, “Emerging EquityMarkets and Economic Development,” Journal of Development Economics, Vol. 66, No.2, pp. 465–504.
———, 2002, “Growth Volatility and Equity Market Liberalization” (unpublished; Durham,North Carolina: Duke University). Available via the Internet: http://faculty.fuqua.duke.edu/∼charvey/Research/Working_Papers/W60_Growth_volatility_and.pdf.
Berg, Andrew, and Anne Krueger, 2003, “Trade, Growth, and Poverty: A Selective Survey,”IMF Working Paper 03/30 (Washington: International Monetary Fund).
Bernanke, Ben, 1983, “Irreversibility, Uncertainty, and Cyclical Investment,” Quarterly Journalof Economics, Vol. 97, No. 1, pp. 85–106.
Blackburn, Keith, 1999, “Can Stabilization Policy Reduce Long-Run Growth?” EconomicJournal, Vol. 109, pp. 67–77.

GROWTH AND VOLATILITY IN AN ERA OF GLOBALIZATION
61
———, and Ragchaasuren Galindev, 2003, “Growth, Volatility and Learning,” EconomicsLetters, Vol. 79, pp. 417–421.
Blackburn, Keith and Alessandra Pelloni, 2004 “On the Relationship Between Growth andVolatility,” Economics Letters, Vol. 83, pp. 123–127.
Borensztein, Eduardo, José De Gregorio, and Jong-Wha Lee, 1998, “How Does Foreign DirectInvestment Affect Growth?” Journal of International Economics, Vol. 45 (June), pp. 115–35.
Buch, Claudia M., Jörg Döpke, and Christian Pierdzioch, 2002, “Financial Openness and BusinessCycle Volatility,” Kiel Working Paper No. 1105 (Kiel: Kiel Institute for World Economics).
Caprio, Gerard, and Patrick Honohan, 1999, “Restoring Banking Stability: Beyond SupervisedCapital Requirements,” Journal of Economic Perspectives, Vol. 13 (Fall), pp. 43–64.
Catão, Luis, 2002, “Debt Crises: What Is Different About Latin America?” World EconomicOutlook, April 2002, World Economic and Financial Surveys (Washington: InternationalMonetary Fund), pp. 61–74.
Cavallo, Eduardo A., and Jeffrey A. Frankel, 2004, “Does Openness to Trade Make CountriesMore Vulnerable to Sudden Stops, or Less? Using Gravity to Establish Causality,” JohnF. Kennedy School of Government Faculty Research Working Paper No. RWP04-038(Cambridge, Massachusetts: Harvard University).
Dehn, Jan, Christopher Gilbert, and Panos Varangis, 2005, “Commodity Price Variability,” inManaging Economic Volatility and Crises: A Practitioner’s Guide, ed. by Joshua Aizenmanand Brian Pinto (forthcoming; Cambridge: Cambridge University Press).
Dollar, David, and Aart Kraay, 2002, “Institutions, Trade, and Growth,” Journal of MonetaryEconomics, Vol. 50 (January), pp. 133–62.
Easterly, William, Roumeen Islam, and Joseph E. Stiglitz, 2001, “Shaken and Stirred: ExplainingGrowth Volatility,” in Proceedings of the Annual World Bank Conference on DevelopmentEconomics, ed. by B. Pleskovic and N. Stern (Washington: World Bank).
Fatás, Antonio, 2002, “The Effects of Business Cycles on Growth,” in Economic Growth:Sources, Trends and Cycles, ed. by N. Loayza and R. Soto (Santiago: Central Bank of Chile).
———, and Ilian Mihov, 2003, “The Case for Restricting Fiscal Policy Discretion,” QuarterlyJournal of Economics, Vol. 118 (November), pp. 1419–47.
Feder, Gershon, 1983, “On Exports and Economic Growth,” Journal of Development Economics,Vol. 12, No. 1, pp. 59–73.
Fischer, Stanley, Ernesto Hernández-Catá, and Mohsin Khan, 1998, “Africa: Is This the TurningPoint?” IMF Paper on Policy Analysis and Assessment 98/6 (Washington: InternationalMonetary Fund).
Frankel, Jeffrey A., and David Romer, 1999, “Does Trade Cause Growth?” American EconomicReview, Vol. 89, No. 3, pp. 379–99.
Goldberg, Linda, 2004, “Financial-Sector FDI and Host Countries: New and Old Lessons,”NBER Working Paper No. 10441 (Cambridge, Massachusetts: National Bureau of EconomicResearch).
Gourinchas, Pierre-Olivier, and Olivier Jeanne, 2003, “The Elusive Gains from InternationalFinancial Integration,” NBER Working Paper No. 9684 (Cambridge, Massachusetts: NationalBureau of Economic Research).
Grier, Kevin B., and Gordon Tullock, 1989, “An Empirical Analysis of Cross-National EconomicGrowth, 1951–80,” Journal of Monetary Economics, Vol. 24, No. 2, pp. 259–76.
Grossman, Gene M., and Elhanan Helpman, 1991, Innovation and Growth in the Global Economy(Cambridge, Massachusetts, and London: MIT Press).
Henry, Peter, 2000, “Do Stock Market Liberalizations Cause Investment Booms?” Journal ofFinancial Economics, Vol. 58, Nos. 1–2, pp. 301–34.

M. Ayhan Kose, Eswar S. Prasad, and Marco E. Terrones
62
Heston, Alan, Robert Summers, and Bettina Aten, 2002, Penn World Tables Version 6.1(Philadelphia: University of Pennsylvania, Center for International Comparisons).
Hnatkovska, Viktoria, and Norman Loayza, 2005, “Volatility and Growth,” in ManagingEconomic Volatility and Crises: A Practitioner’s Guide, ed. by Joshua Aizenman and BrianPinto (forthcoming; Cambridge: Cambridge University Press).
Imbs, Jean, 2002, “Why the Link Between Volatility and Growth Is Both Positive and Negative”CEPR Discussion Paper No. 3561 (London: Centre for Economic Policy and Research).
Jones, Larry, Rodolfo Manuelli, and Ennio Stacchetti, 1999, “Technology (and Policy) Shocksin Models of Endogenous Growth,” NBER Working Paper No. 7063 (Cambridge,Massachusetts: National Bureau of Economic Research).
Jovanovic, Boyan, 2004, “Asymmetric Cycles,” NBER Working Paper No. 10573 (Cambridge,Massachusetts: National Bureau of Economic Research).
Kalemli-Ozcan, Sebnem, Bent Sorensen, and Oved Yosha, 2003, “Risk Sharing and IndustrialSpecialization: Regional and International Evidence,” American Economic Review, Vol. 93,No. 3, pp. 903–18.
Kaminsky, Graciela, and Sergio L. Schmukler, 2002, “Short-Run Pain, Long-Run Gain: TheEffects of Financial Liberalization,” World Bank Working Paper No. 2912 (Washington:World Bank).
Karras, Georgios, and Frank Song, 1996, “Sources of Business-Cycle Volatility: AnExploratory Study on a Sample of OECD Countries,” Journal of Macroeconomics, Vol. 18,No. 4, pp. 621–37.
Kormendi, Roger, and Philip Meguire, 1985, “Macroeconomic Determinants of Growth,”Journal of Monetary Economics, Vol. 16, No. 2, pp. 141–63.
Kose, M. Ayhan, Eswar S. Prasad, and Marco E. Terrones, 2003a, “Financial Integration andMacroeconomic Volatility,” IMF Staff Papers, Vol. 50 (Special Issue), pp. 119–42.
———, 2003b, “How Does Globalization Affect the Synchronization of Business Cycles?”American Economic Review, Papers and Proceedings, Vol. 93, No. 2, pp. 57–62.
———, 2005, “How Do Trade and Financial Integration Affect the Relationship BetweenGrowth and Volatility?” IMF Working Paper 05/19 (Washington: International MonetaryFund) and forthcoming in Journal of International Economics.
Kose, M. Ayhan, Guy Meredith, and Christopher Towe, 2005, “How Has NAFTA Affectedthe Mexican Economy? Review and Evidence,” in Monetary Policy and MacroeconomicStabilization in Latin America, eds. by Rolf J. Langhammer and Lucio Vinhas de Souza(forthcoming; New York: Springer).
Kose, M. Ayhan, and Marco E. Terrones, 2005, “How Does Macroeconomic Instability StifleSub-Saharan African Growth?” World Economic Outlook, April 2005, World Economic andFinancial Surveys (Washington: International Monetary Fund), pp. 49–51.
Lane, Philip, and Gian Maria Milesi-Ferretti, 2001, “The External Wealth of Nations: Estimatesof Foreign Assets and Liabilities for Industrial and Developing Countries,” Journal ofInternational Economics, Vol. 55, pp. 263–94.
———, 2003, “International Financial Integration,” IMF Staff Papers, Vol. 50 (Special Issue),pp. 82–113.
Laursen, Thomas, and Sandeep Mahajan, 2005, “Volatility, Income Distribution and Poverty,” inManaging Economic Volatility and Crises: A Practitioner’s Guide, ed. by Joshua Aizenmanand Brian Pinto (forthcoming; Cambridge: Cambridge University Press).
Levine, Ross, 1996, “Foreign Banks, Financial Development, and Economic Growth,” inInternational Financial Markets: Harmonization Versus Competition (Washington: AEIPress), pp. 224–54.

GROWTH AND VOLATILITY IN AN ERA OF GLOBALIZATION
63
———, and David Renelt, 1992, “A Sensitivity Analysis of Cross-Country Growth Regressions,”American Economic Review, Vol. 82, No. 4, pp. 942–63.
Lucas, Robert E., 1987, Models of Business Cycles (Oxford: Blackwell Publishing Ltd.).
Martin, Philippe, and Carol A. Rogers, 2000, “Long-Term Growth and Short-Term EconomicInstability,” European Economic Review, Vol. 44, No. 2, pp. 359–81.
Mendoza, Enrique G., 1997, “Terms-of-Trade Uncertainty and Economic Growth,” Journal ofDevelopment Economics, Vol. 54, No. 2, pp. 323–56.
Moran, Christian, 1983, “Export Fluctuations and Economic Growth,” Journal of DevelopmentEconomics, Vol. 12 (February), pp. 195–218.
Pallage, Stephane, and Michel Robe, 2003, “On the Welfare Cost of Economic Fluctuations inDeveloping Countries,” International Economic Review, Vol. 44 (May), pp. 677–98.
Pindyck, Robert S., 1991, “Irreversibility, Uncertainty, and Investment,” Journal of EconomicLiterature, Vol. 29 (September), pp. 1110–48.
Prasad, Eswar S., Kenneth Rogoff, Shang-Jin Wei, and M. Ayhan Kose, 2003, Effects of FinancialGlobalization on Developing Countries: Some Empirical Evidence, IMF Occasional PaperNo. 220 (Washington: International Monetary Fund).
Ramey, Garey, and Valerie A. Ramey, 1995, “Cross-Country Evidence on the Link BetweenVolatility and Growth,” American Economic Review, Vol. 85, No. 5, pp. 1138–51.
Ranciere, Romain, Aaron Tornell, and Frank Westermann, 2003, “Crises and Growth: A Re-evaluation,” NBER Working Paper No. 10073 (Cambridge, Massachusetts: National Bureauof Economic Research).
Reisen, Helmut, and Marcelo Soto, 2001, “Which Types of Capital Inflows Foster Developing-Country Growth?” International Finance, Vol. 4 (Spring), pp. 1–14.
Rodriquez, Francisco, and Dani Rodrik, 2000, “Trade Policy and Economic Growth: ASkeptic’s Guide to the Cross-National Evidence,” in NBER Macroeconomics Annual 2000,ed. by Ben Bernanke and Kenneth Rogoff (Cambridge, Massachusetts: MIT Press).
Sachs, Jeffrey, and Andrew Warner, 1995, “Economic Reform and the Process of Global Inte-gration,” Brookings Papers on Economic Activity: 2, Brookings Institution, pp. 523–64.
Stock, James H., and Mark Watson, 2002, “Has the Business Cycle Changed and Why?” in NBERMacroeconomics Annual, ed. by Mark Gertler and Ken Rogoff (Cambridge, Massachusetts:MIT Press).
Tornell, Aaron, 1998, “Reform from Within,” NBER Working Paper No. 6497 (Cambridge,Massachusetts: National Bureau of Economic Research).
———, Frank Westermann, and Lorenza Martinez, 2003, “Liberalization, Growth and FinancialCrises,” UCLA Economics Online Paper No. 276 (Los Angeles: University of California atLos Angeles).
Turnovsky, Stephen J., and Pradip Chattopadhyay, 2002, “Volatility and Growth in DevelopingEconomies: Some Numerical Results and Empirical Evidence,” Journal of InternationalEconomics, Vol. 59, No. 2, pp. 267–95.
Wacziarg, Romain, and Karen Horn Welch, 2003, “Trade Liberalization and Growth: NewEvidence,” NBER Working Paper No. 10152 (Cambridge, Massachusetts: National Bureauof Economic Research).
Wei, Shang-Jin, 2001, “Domestic Crony Capitalism and International Fickle Capital: Is Therea Connection?” International Finance, Vol. 4, No. 1, pp. 15–46.
Winters, L. Alan, 2004, “Trade Liberalization and Economic Performance: An Overview,”Economic Journal, Vol. 114 (February), pp. 4–21.