1q 2018 investment portfolio review - cbisonline.com · era of low equity volatility ending...
TRANSCRIPT

Christian Brothers Investment Services, Inc. n [email protected] PAGE 1
1Q 2018
Investment Portfolio Review
LEADING CATHOLIC INSTITUTIONAL
INVESTMENT MANAGER
} Over $7 billion in assets under management
} Exclusively serve Catholic institutions
} Founded and owned by the De La Salle Christian Brothers
PIONEERED CATHOLIC RESPONSIBLE
INVESTINGSM
} Thoughtful and disciplined Catholic investment screens
} Encourage companies to improve policies and practices through active ownership
DIVERSIFIED INVESTMENT PROGRAMS
} Manager of managers } Institutional pooled funds
and separate accounts
UNIFY FAITH AND FINANCE
} Align investments with mission
DIVERSE RANGE OF NEEDS
} Portfolio services for a range of institutions
} Single- and multi-product relationships with institutions and their consultants
GLOBAL INVESTOR BASE
} Religious Institutes } Dioceses } Education } Healthcare
CBIS helps Catholic organizations achieve their financial goals through the socially responsible management of their investments.
BY PRODUCT TYPE ($MILLION)
BY CUIT TYPE ($MILLION)
Separate Accounts $663Global Funds PLC (UCITS) $641CUIT Funds $6,143
Money MarketOpportunistic BondBalancedCore IndexValue
Short bondInt. Diversified BondSmall capGrowthInternational
CBIS Asset Review
$7.4 BILLION IN TOTAL ASSETS
UNDER MANAGEMENT (3/31/18)
1%
6%
20%
5%6%
5%
6%
14%
30%
6%
8%9%
83%

Key Highlights:Market Overviewpage 2
Investment Program Offeringspage 8
CUIT Fund’s Performancepage 9
CUIT Fund Reportspage 10
Investment Portfolio Review 1Q 2018
Christian Brothers Investment Services, Inc. n [email protected] PAGE 2Christian Brothers Investment Services, Inc. n [email protected] PAGE 1
MARKET PERSPECTIVE 1Q 2018
The Return of Volatility
Volatility has returned to equity markets, but despite the turbulence, the
overall market saw only modest declines in the first quarter, with the
S&P 500 Index down by less than 1%. A number of economic signals and
policy factors, including normalizing interest rates, drove the change in
volatility—which may signal an opportunity for disciplined investors.
CAPITAL MARKETS REVIEW
Global Overview
U.S. Equity Markets
Fixed Income Markets
Inflation Moving Toward Fed Target
Wages Finally Increasing
Growth Still Dominating Value
Gap Narrows Between Bond & Equity Valuations
MARKET MUSINGS
Era of Low Equity Volatility Ending
Normalizing Interest Rates
Low Unemployment & Labor Participation
Trade Fears: Globalization Is Real

Christian Brothers Investment Services, Inc. n [email protected] PAGE 3
Investment Portfolio Review 1Q 2018
Market Perspective 1Q 2018 APRIL 2018
Christian Brothers Investment Services, Inc. n [email protected] PAGE 2
Capital Markets Review
Market Performance: 3 Month Market Performance: 12 Month
BB U.S. Short T-Bill (1-3M)
BB U.S. Aggregate
S&P 500
Russell 1000 Value
Russell 1000 Growth
S&P SmallCap 600
MSCI ACWI-Ex US (USD)
MSCI ACWI-Ex US (Local)
MSCI EM (USD)
MSCI EM (Local) 0.8
1.5
-3.0
-1.1
0.6
1.4
-2.8
-.08
-1.5
0.3 BB U.S. Short T-Bill (1-3M)
BB U.S. Aggregate
S&P 500
Russell 1000 Value
Russell 1000 Growth
S&P SmallCap 600
MSCI ACWI-Ex US (USD)
MSCI ACWI-Ex US (Local)
MSCI EM (USD)
MSCI EM (Local) 22.4
25.4
9.4
17.0
12.7
21.3
6.9
14.0
1.2
1.1
S&P 500
Consumer Discretionary
Consumer Staples
Energy
Financials
Healthcare
Industrials
Info Technology
Materials
Real Estate
Telecom
Utilities
S&P 500
Consumer Discretionary
Consumer Staples
Energy
Financials
Healthcare
Industrials
Info Technology
Materials
Real Estate
Telecom
Utilities
1.7
1.9
10.5
27.7
14.0
11.3
18.0
-0.2
-0.9
16.9
14.0
-5.0
-7.5 -4.9
-3.3
-5.5
3.5
-1.6
-1.2
-1.0
-5.9
-7.1
3.1
-0.8
Market Performance: 3 Month Market Performance: 12 Month
GLOBAL OVERVIEW
• Despite increased equity market
volatility and headlines about the
FAANG stocks (Facebook, Apple,
Amazon, Netflix, and Google), U.S.
growth stocks kept advancing while
value stocks lost ground.
• In the last 12 months, growth has
outperformed value by almost 15%.
• Small caps outperformed larger
cap stocks for the quarter, driven
largely by concerns over tariffs and a
resulting trade war.
• Emerging markets stocks
outperformed developed markets in
local and dollar terms.
• U.S. fixed income underperformed
equities as interest rates increased
across the curve during the quarter.
• Despite a weak March, the
Information Technology sector
generated the strongest
performance during 1Q, followed by
Consumer Discretionary.
• The Consumer Staples and Telecom
sectors were relatively weak in the
period.
• Over the last 12 months, only
three of the 11 S&P 500 sectors
outperformed the overall market.
• The Information Technology sector
has provided market leadership
for the last 12 months, followed
distantly by the Financials and
Consumer Discretionary sectors.
U.S. EQUITY MARKETS
Christian Brothers Investment Services, Inc. n [email protected] PAGE 4
Investment Portfolio Review 1Q 2018
Market Perspective 1Q 2018 APRIL 2018
Christian Brothers Investment Services, Inc. n [email protected] PAGE 3
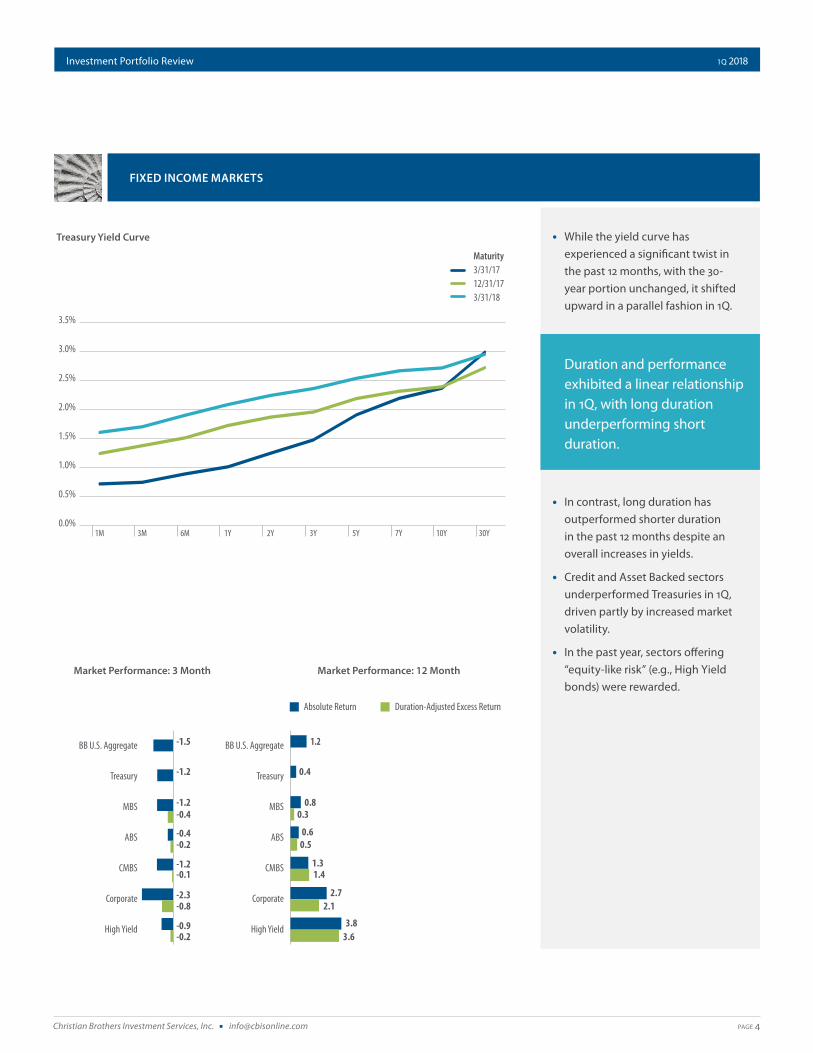
Treasury Yield Curve
Market Performance: 12 MonthMarket Performance: 3 Month
0.0%
0.5%
1.0%
1.5%
2.0%
2.5%
3.0%
3.5%
3/31/17Maturity
12/31/173/31/18
30Y10Y7Y5Y3Y2Y1Y6M3M1M
High Yield
Corporate
CMBS
ABS
MBS
Treasury
BB U.S. Aggregate
-1.2
-1.2-0.4
-0.2
High Yield
Corporate
CMBS
ABS
MBS
Treasury
BB U.S. Aggregate -1.5
-0.4
-1.2-0.1
-2.3-0.8
-0.9-0.2
0.4
0.80.3
0.50.6
1.2
1.31.4
2.72.1
3.83.6
Duration-Adjusted Excess ReturnAbsolute Return
FIXED INCOME MARKETS
• While the yield curve has
experienced a significant twist in
the past 12 months, with the 30-
year portion unchanged, it shifted
upward in a parallel fashion in 1Q.
• In contrast, long duration has
outperformed shorter duration
in the past 12 months despite an
overall increases in yields.
• Credit and Asset Backed sectors
underperformed Treasuries in 1Q,
driven partly by increased market
volatility.
• In the past year, sectors offering
“equity-like risk” (e.g., High Yield
bonds) were rewarded.
Duration and performance exhibited a linear relationship in 1Q, with long duration underperforming short duration.

Christian Brothers Investment Services, Inc. n [email protected] PAGE 5
Investment Portfolio Review 1Q 2018
Market Perspective 1Q 2018 APRIL 2018
Christian Brothers Investment Services, Inc. n [email protected] PAGE 4
Source: U.S. Bureau of Labor Statistics, via Federal Reserve Economic Data, as of 3/31/2018; www.myf.red/g/jelQ
Employment Cost Index
Perce
nt Ch
ange
from
a Ye
ar A
go
2004 2006 2008 2010 2012 2014 20161.0
1.5
2.0
2.5
3.0
3.5
4.0
WAGES FINALLY INCREASING
• Wage increases should be
welcomed, not feared as
inflationary.
• The rate of wage increase is well
below historical norms, at levels
economists generally consider
“healthy.”
• Further increases closer to 3.5%-
4.5% would be a sign of stronger
economic growth.
• The Fed’s preferred measure of
inflation, the Personal Consumption
Expenditures Index, has moved
toward the monetary authority’s
stated target.
• The Fed will welcome consistent
readings between 2% and 2.5%.
INFLATION MOVING TOWARD FED TARGET
1970 1980 1990 2000 2010-2.5
0.0
2.5
5.0
7.5
10.0
12.5
Personal Consumption Expenditures Index
Source: U.S. Bureau of Economic Analysis, via Federal Reserve Economic Data, as of 3/31/2018; www.myf.red/g/iSGP
Perce
nt Ch
ange
from
a Ye
ar A
go

Christian Brothers Investment Services, Inc. n [email protected] PAGE 6
Market Perspective 1Q 2018 APRIL 2018
Christian Brothers Investment Services, Inc. n [email protected] PAGE 5
• Growth sectors continue to
outperform value despite increased
volatility; when will this trend turn?
• The gap between bond and
equity price-to-earnings ratios has
compressed; this trend is expected
to continue.
GROWTH STILL DOMINATING VALUE
GAP NARROWS BET WEEN BOND & EQUITY VALUATIONS
1980 1990
Relative Cumulative Added Value
Source: Bloomberg, as of 3/31/2018; www.Bloomberg.com
-0.4
-0.2
0
0.2
0.4
0.6
0.8
Feb ‘00
Jul ‘06
2000 2010 2018
0.0
10.0
20.0
30.0
40.0
50.0
60.0
70.0
80.0
Source: Bloomberg, U.S. Department of the Treasury as of 3/31/2018; www.bloomberg.com, www.treasury.gov
2017201020001990 1995 200519851980
Bond P/E
Stock P/E
Market volatility will increase as the valuation difference narrows between these two asset classes.
Investment Portfolio Review 1Q 2018

Christian Brothers Investment Services, Inc. n [email protected] PAGE 7
Investment Portfolio Review 1Q 2018Market Perspective 1Q 2018 APRIL 2018
Christian Brothers Investment Services, Inc. n [email protected] PAGE 6
Thus the equity market volatility we witnessed in the first quarter was not unexpected. Rising interest rates represent change at the margin—in this case, higher borrowing costs for companies. Stock market investors consider that change and adjust their forecasts for the future profitability of companies. As a result, the relative attractiveness of individual stocks changes. Shares are traded. Repricing occurs. Volatility rises. All this happens so we can return the monetary system to the normal footing we require for the economy to function sustainably.
This increased volatility signals opportunity for disciplined investors. It exacerbates valuation differences and increases the potential for market mispricing of securities. This provides the potential for outperformance or alpha by active asset managers. At the portfolio level, volatility provides opportunities for improved outcomes for investors who follow a disciplined rebalancing process. In this case, market volatility encourages investors to “buy low and sell high” through rebalancing. Of course, emotion and institutional decision-making may make this advice difficult to follow. Each of these characteristics serves to transform market volatility from a risk into an asset.
The larger concern for market returns is not the increased volatility, but the potential for policy mistakes from well-intentioned actions and initiatives. This is where the quote from Milton Friedman comes into play.
There is no doubt in my mind the Federal Reserve is on the correct path by normalizing interest rates. In doing so, the Fed removes perverse incentives and potential risks from negative real interest rates. However, in forecasting the relationship between the unemployment rate and inflation in a 21st century
Volatility has returned to equity markets, a development that should cause neither surprise nor apprehension. For most of the past six years, we have been in an environment characterized by low levels of volatility, caused in large part by historically low interest rates. The world’s central banks engineered the low rate environment to stave off economic collapse in the face of the 2008 credit crisis and to prevent recession in the years of fragile recovery that followed.
Think of it as a program of life support—extreme measures applied on a temporary basis. Now the Federal Reserve has been quite eager to move its patient out of treatment and back to routine daily life. To do so, the central bank has been explicit in its desire to normalize interest rates, which means simply raising rates from levels near zero to somewhere in the direction of their longer-term averages. In the case of the federal funds rate, that’s just under 5%. Over the past 16 months, Fed policymakers have approved a series of six 0.25% interest rate increases, lifting the targeted federal funds rate into a range of 1.50% to 1.75%. That’s a significant move from zero, and while still a long way from the long-term historical average, it represents an extremely high percentage of change, coming as it does off a small base.
0%
5%
10%
15%
20%
Normalizing Interest Rates
1954 1962 1970 1978 1986 1994 2002 2010 2018
LT Avg. 4.85%
0.00%
0.50%
1.00%
1.50%
2.00%
2016 2017 2018
Path to Normal
Sep Dec Mar Jun Sep Dec Mar
Effec
tive F
eder
al Fu
nds R
ate
Source: Board of Governors of the Federal Reserve System, via Federal Reserve Economic Data, as of 3/31/2018; www.myf.red/g/iOFF
0%
1988 1998 2008 2018
10%
20%
30%
40%
50%
60%
70%
80%
90%AverageVolatility
Era of Low Equity Volatility Ending
Source: Bloomberg, as of 3/31/2018; www.Bloomberg.com
Equity market volatility has remained below long-run averages for most of the period since
the Global Financial Crisis, but we believe this period of tranquility is over as the Fed moves
toward normalization of short-term rates.
Market Musings
“One of the great mistakes is to judge policies and programs by their intentions rather than their results.” — Milton Friedman

Investment Portfolio Review 1Q 2018
Christian Brothers Investment Services, Inc. n [email protected] PAGE 8
Market Perspective 1Q 2018 APRIL 2018
Christian Brothers Investment Services, Inc. n [email protected] PAGE 7
corporations in foreign domiciles. Trade is not a “you win, I lose” proposition but rather a “win-win” or “lose-lose” equation. The dollars we spend on imports find their way back to the U.S. to purchase goods, services, or government debt to support our economic growth. Where else would the dollars
go? Unfortunately, tariffs simply increase the cost of the good or service. As with any product, increased prices result in reduced demand. The market reaction to the trade rhetoric is well-placed, and we anticipate continued volatility as these policies play out.
We have been fortunate to have low market volatility through the period of rehabilitation of global economies in the aftermath of the Financial Crisis. Now as economic growth is becoming more robust, monetary authorities are moving towards normalization of policy. This is a positive development that includes higher market volatility with all its risks and benefits.
economy, members of the Fed’s Open Market Committee risk overshooting—setting interest rates too high and triggering recession. Certainly this fear permeated the market in early February as a result of a strong employment report, a short-term increase in long-term bond yields as a result of increased inflationary expectations, and the first shot of higher volatility.
Shouldn’t we welcome higher wage growth? We have been waiting for this for years. Yes, the unemployment rate is low, and maybe it is close to a level that will spur inflationary wage increases. But, we cannot overlook the fact that the labor participation rate is also low and has not increased. The unemployment rate only factors in those individuals that are actively seeking employment, not those who have given up the job search. The low participation rate points to a supply of potential workers who are not currently seeking employment. With an increase in wages, is it not likely that some of the frustrated job seekers will re-enter the work force? That increase in the supply of labor could mitigate wage inflation. Wage growth remains below historical levels, and while we must always remain vigilant for inflation, at this point it remains a risk—not a reality.
A trade war presents an even greater threat to the market outlook. Trade is an ever-increasing percentage of world economic growth, with significant profits earned by U.S.
Low Unemployment & Labor Participation
1950 1960 1970 1980 1990 2000 20102%
3%
4%
5%
6%
7%
8%
9%
10%
11%
65.00%
63.75%
62.50%
61.25%
60.00%
58.75%
57.50%
66.25%
67.50%
68.75%Civilian Labor Force Participation Rate (right)Civilian Unemployment Rate (left)
Source: U.S. Bureau of Labor Statistics, via Federal Reserve Economic Data, as of 3/31/2018; www.myf.red/g/jeH4
Inflation fears in 1Q were based on the Phillips Curve Theory, which holds that unemployment
and inflation have a stable, inverse relationship. However, the decline in the participation
rate—particularly post-2008—can be viewed as a mitigating factor to offset Phillips Curve
concerns.
Wor
ld Tr
ade a
s Sha
re of
Wor
ld G
DP0%
10%
20%
30%
40%
50%
60%
70%
Trade Fears: Globalization Is Real
1960 1968 1976 1984 1992 2000 2008 2016
Source: World Development Indicators, as of 3/1/2018; databank.worldbank.org
Trade makes up more than 50% of global GDP; an outbreak of trade wars has the potential to
harm both economic growth and corporate earnings in the U.S.
John W. Geissinger, CFACIO, CBIS
Important Information: This is for informational purposes only and does not constitute an offer to sell any investment. The Funds are not available for sale in all jurisdictions. Where available for sale, an offer will only be made through the prospectus for the Funds, and the Funds may only be sold in compliance with all applicable country and local laws and regulations.

Christian Brothers Investment Services, Inc. n [email protected] PAGE 9
INVESTMENT PROGRAM OFFERINGSCBIS Offers Pooled Funds through its CUIT and Global Funds plc (UCITS) Fund families
CUIT FUND BENCHMARK MANAGER(S)
CUIT Money Market Fund Bloomberg Barclays U.S. Short T-Bills (1-3M) Index Wellington
CUIT Short Bond Bloomberg Barclays 1-3 Year Treasury Index Longfellow
CUIT Intermediate Diversified Bond Bloomberg Barclays Aggregate Index Dodge & Cox, Jennison, Reams
CUIT Opportunistic Bond Bloomberg Barclays 1-5 Year US Gov’t Credit Index Longfellow and Reams
CUIT Balanced 60% S&P 500 / 40% BBAgg Dodge & Cox, Jennison, Reams, RhumbLine
CUIT Core Equity Index S&P 500 RhumbLine
CUIT Value Equity Russell 1000 Value Index AJO, Dodge & Cox
CUIT Growth Russell 1000 Growth Index LA Capital, Wellington
CUIT Small-Cap Equity Index S&P SmallCap 600 Index RhumbLine
CUIT International Equity MSCI ACWI Ex-U.S. Index Causeway, Principal Global, WCM
UCITS FUND BENCHMARK MANAGER(S)
European Short-Term Government Bond Bloomberg Barclays Euro Gov’t Bond Index 1-3 Year ARCA
World Bond Bloomberg Barclays Capital Global Aggregate Index Degroof Fund Management Company
European Equity MSCI Europe Index Degroof Fund Management Company
World Equity MSCI AC World IndexScott Investment Partners; Los Angeles Capital Management Equity Research
Note: CUIT Funds are available to tax-exempt Catholic institutions in the United States. CBIS Global (UCITS) Funds can be purchased in select countries around the world.
Investment Management ProcessCBIS hires institutional investment management firms to manage our institutional funds and separately managed portfolios. We typically combine two or more managers in actively managed funds in order to achieve our investment objective.
MANAGERIDENTIFICATIONAND SELECTION
PORTFOLIOCONSTRUCTION
ON-GOINGDUE DILIGENCE
Proven Investment Process
Defined Core Competency
Value add over a full market cycle
Preference for majority-owned firms
Assess CRI Impact
Diversification of manager core competencies
Improved risk-adjusted returns
Managed Active Share
Systematic evaluation process
Quantitative and qualitative assessment
Analyze any disconnect between expectations and reality
Investment Portfolio Review 1Q 2018

Christian Brothers Investment Services, Inc. n [email protected] PAGE 10
Please review the Important Disclosures on page 32 for further information.
CUIT Funds Performance (March 31, 2018)
INVESTMENT OPTION/BENCHMARK1
MONTH3
MONTHS1
YEAR3
YEARS5
YEARS10
YEARSSINCE
INCEPTIONINCEPTION
DATE
CUIT Money Market Fund 0.12 0.32 1.08 0.52 0.33 0.32 3.24 Jan 1985
Bloomberg Barclays U.S. Short T-Bills (1-3 M) Index ± 0.13 0.33 1.05 0.51 0.32 0.33 3.66
CUIT Short Bond Fund 0.19 (0.06) 1.13 1.26 1.25 2.25 5.15 Jan 1985
Bloomberg Barclays 1-3 Year Treasury Index** 0.20 (0.16) (0.00) 0.38 0.50 1.12 4.95
CUIT Opportunistic Bond Fund Class A 0.07 (0.53) 0.72 1.25 * * 1.13 May 2013
CUIT Opportunistic Bond Fund Class B 0.08 (0.50) 0.87 1.40 * * 1.28 May 2013
Bloomberg Barclays 1-5 Year US Government/Credit Index 0.24 (0.50) 0.19 0.77 * * 0.90
CUIT Intermediate Diversified Bond Fund Class A 0.56 (1.24) 1.30 1.25 1.85 4.31 5.63 Jan 1995
CUIT Intermediate Diversified Bond Fund Class B 0.65 (1.13) 1.52 1.43 2.02 4.47 4.51 Jan 2003
Bloomberg Barclays Aggregate Bond Index 0.64 (1.46) 1.20 1.20 1.82 3.63 5.55 / 3.98
CUIT Balanced Fund (1.76) (0.87) 8.68 7.08 8.62 7.50 8.87 Dec 1983
60% S&P 500 / 40% BB Agg *** (1.24) (0.92) 8.89 7.10 8.81 7.52 9.55
CUIT Value Equity Fund Class A (2.53) (2.01) 10.96 7.87 11.07 8.17 9.66 Jan 1995
CUIT Value Equity Fund Class B (2.51) (1.92) 11.36 8.25 11.46 8.55 9.78 Jan 2003
Russell 1000 Value Index (1.76) (2.83) 6.95 7.88 10.78 7.78 10.02 / 9.19
CUIT Core Equity Index Fund Class A (2.51) (0.70) 14.88 10.50 13.10 9.08 9.67 Jan 1995
CUIT Core Equity Index Fund Class B (2.47) (0.63) 15.13 10.73 13.33 9.30 5.77 Mar 2000
S&P 500 Index (2.54) (0.76) 13.99 10.78 13.31 9.49 9.91 / 5.75
CUIT Growth Fund Class A (2.88) 1.68 18.31 11.18 13.97 9.65 8.70 Jan 1991
CUIT Growth Fund Class B (2.85) 1.74 18.66 11.52 14.33 9.98 9.12 Jan 2003
Russell 1000 Growth Index **** (2.74) 1.42 21.25 12.90 15.53 11.34 9.86 / 10.62
CUIT Small Capitalization Equity Index Fund Class A 1.97 0.56 12.62 8.27 11.18 9.47 7.13 Jan 2007
CUIT Small Capitalization Equity Index Fund Class B 2.00 0.63 12.97 8.58 11.50 9.79 7.43 Jan 2007
S&P SmallCap 600 Index § 2.04 0.57 13.09 8.80 11.72 9.97 7.66
CUIT International Equity Fund Class A (0.88) (0.88) 19.15 7.74 7.65 2.93 6.21 Jan 1995
CUIT International Equity Fund Class B (0.86) (0.79) 19.64 8.17 8.09 3.35 2.68 Mar 2000
MSCI ACWI-ex U.S. ‡ (1.69) (1.08) 17.05 6.74 7.40 3.43 5.76 / 4.07
Investment Portfolio Review 1Q 2018

Christian Brothers Investment Services, Inc. n [email protected] PAGE 11
FUND FACTS
PROFILE Q1 2018
Christian Brothers Investment Services, Inc. (800) 592-8890 n [email protected]
CUIT Money Market Fund
Objective Preserve capital, provide current income; and maintain liquidity
InvestmentsHigh quality, short-term, fixed-income obligations
StrategyLiquidity will be maintained by investing in highly rated securities with short maturities and by constraining the average portfolio maturity to less than 90 days; credit and default risk are further minimized by diversifying among issuers; the Fund attempts to maintain a stable net asset value of $1.00 per unit.
BenchmarkBloomberg Barclays U.S. Short T-Bills (1-3 M) Index
Asset ManagersWellington Management Company (Effective 8/1/01)
Total Expense Ratio / Minimum 0.32% / No Minimum
Fund Features Commingled fund exclusive for tax-exempt Catholic institutions
Daily NAV and daily liquidity
Dividends Distributed Monthly
MATURITY DISTRIBUTION %
FUND
0 to 7 Days 26.4
8 to 29 Days 26.4
30 to 59 Days 18.1
60 to 89 Days 12.8
90 to 179 Days 9.6
180 and Over 6.8
PORTFOLIO ANALYSIS
STATISTICS FUND BENCHMARK
Effective Duration (years) 0.1 Yrs 0.1 Yrs
Average Quality A-1 A-1+
Yield-to-Maturity 1.9% 1.6%
Fund Size $62.1MM
CREDIT QUALITY %
FUND BENCHMARK
A-1+ or higher 71.7 100.0
A-1 25.5 0.0
Less than A-1 1.3 0.0
Cash 1.4 0.0
1.4%
5.0%
4.0%
3.0%
2.0%
1.0%
0.%
CUIT Money Market A BB U.S. Short T-Bills (1-3 M) Index
FUND PERFORMANCE
QUARTERLY RETURN 3 MO 1 YR 3 YR 5 YR 10 YR
CUIT Money Market 0.32 1.08 0.52 0.33 0.32
Bloomberg Barclays U.S. Short T-Bills (1-3 M) Index 0.33 1.05 0.51 0.32 0.33
CALENDAR YEAR RETURN 2017 2016 2015 2014 2013
CUIT Money Market 0.93 0.31 0.02 0.05 0.01
Bloomberg Barclays U.S. Short T-Bills (1-3 M) Index 0.81 0.33 0.05 0.04 0.07
Please see Important Information on Page 2
The Fund’s benchmark was changed to the Bloomberg Barclays U.S. Short Treasury Bills (1-3 Month) Index effective April 1, 2017. For periods prior to
April 1, 2017, the applicable benchmark was the Merrill Lynch 91-Day Treasury Bill Index.
3 MO 1 YR 3 YR 5 YR 10 YR
Christian Brothers Investment Services, Inc. n [email protected] PAGE 12Christian Brothers Investment Services, Inc. n [email protected] PAGE 2 | CB -FFS-000-0000
Important InformationBenchmark Index: The Fund’s benchmark was changed to the Bloomberg Barclays U.S. Short Treasury Bills (1-3 Month) Index effective April 1, 2017. For periods prior to April 1, 2017, the applicable benchmark was the Merrill Lynch 91-Day Treasury Bill Index. Performance for periods of one year and longer are annualized. All Fund performance is reported net of any fees and expenses, but inclusive of dividends and interest. Past performance is not indicative of future performance. The return and principal value of the Fund will fluctuate, and upon redemption, shares in the Fund may be worth less than their original cost. The comparative indices represent unmanaged or average returns on various financial assets which can be compared to the Fund’s total returns for the purpose of measuring relative performance, but are not necessarily intended to parallel the risk or investment approach of your investments. The indices do not incur taxes or expenses but are inclusive of dividends and interest. Comparative index information is provided by BNY Mellon Bank; information regarding composition of the indices may be obtained from our provider or CBIS.
Bloomberg Index Services Limited: BLOOMBERG® is a trademark and service mark of Bloomberg Finance L.P. and its affiliates (collectively “Bloomberg”). BARCLAYS® is a trademark and service mark of Barclays Bank Plc (collectively with its affiliates, “Barclays”), used under license. Bloomberg or Bloomberg’s licensors, including Barclays, own all proprietary rights in the Bloomberg Barclays Indices. Neither Bloomberg nor Barclays approves or endorses this material, or guarantees the accuracy or completeness of any information herein, or makes any warranty, express or implied, as to the results to be obtained therefrom and, to the maximum extent allowed by law, neither shall have any liability or responsibility for injury or damages arising in connection therewith.
CUIT Money Market Fund
ALLOCATIONS %
US Government & Agencies
Certificates of Deposit
Repurchase Agreements
Commercial Paper Corporate
Asset-BackedSecurities
Non-Corporate Credit Cash
Fund 32.2 3.6 0.5 10.1 21.1 30.1 0.8 1.4
BENCHMARK 100.0 0.0 0.0 0.0 0.0 0.0 0.0 0.0
FUND COMMENTARY
3-Month Review
¡ Rates rose during the quarter as the Fed increased rates 25 basis points at its December meeting.
– The 1-month Treasury yield rose from 1.29% to 1.63%;– The 3-month yield rose from 1.44% to 1.73%;– The 6-month yield rose from 1.61% to 1.93%.
¡ The Fund’s yield to maturity rose from 1.44% to 1.91%.
¡ The Fund’s performance was slightly above the benchmark for the quarter, largely driven by asset backed securities – autos, which account for just over 19% of the holdings.
12-Month Review
¡ During the past year the Fed increased the Fed Funds rate by 25 basis points three times, for a total of 75 basis points, in turn lifting yields and Fund performance.
¡ The 1-month and 3-month Treasury yields rose during the past 12 months, up 89 basis points and 97 basis points respectively.
¡ Asset classes that outperformed for the period were asset backed securities – autos and credit cards and corporate/non-corporate credit.
Positioning & Outlook
¡ It is the sub-advisor’s view that the Fed will continue its gradual tightening trajectory with U.S. balance sheet reductions. The expectation is for steady U.S. economic growth and a stable inflation outlook. This supports the case for two to four additional Fed rate hikes in 2018.
¡ With a high likelihood of several more rate hikes this year, the sub-advisor has positioned the portfolio with roughly 50% floating rate notes, possibly moving to 60% depending on economic strength. The current floating rate breakdown is 40% corporates, which are linked to LIBOR, 0% T-Bill floaters and 5% Agency floaters. This positioning is well suited to weather Fed tightening.
¡ The sub-advisor believes the recent LIBOR-Overnight Swap spread widening will revert to historical norms later this year. Although the spread typically ranges from 10-20 basis points, it recently spiked to 60 basis points, a result of the corporate tax code changes and U.S. corporations repatriating overseas cash. This has driven down demand for short-term securities. This is a supply and demand issue and not credit related.

Christian Brothers Investment Services, Inc. n [email protected] PAGE 13
FUND FACTS
PROFILE Q1 2018
Christian Brothers Investment Services, Inc. (800) 592-8890 n [email protected]
CUIT Short Bond Fund
Objective Preserve capital while providing current income in excess of cash market yields with moderate emphasis on capital appreciation
InvestmentsU.S. government, agency, corporate, asset-backed and mortgage-backed securities with an average maturity of less than five years; up to 10% of the portfolio may be invested in securities rated below investment-grade (including U.S. dollar-denominated domestic, supranational or foreign issues)
StrategyFocuses on sector allocation and security selection, coupled with a top-down macroeconomic risk management process; aimed at minimizing downside risk while maximizing income potential
BenchmarkBloomberg Barclays 1–3 Year Treasury Index
Asset ManagersLongfellow Investment Management Co. (Effective 7/1/08)
Total Expense Ratio / Minimum 0.34% / No Minimum
Fund Features Commingled fund exclusive for tax-exempt Catholic institutions
Daily NAV and daily liquidity
Dividends Distributed Monthly
PORTFOLIO ANALYSIS
STATISTICS FUND BENCHMARK
Average Maturity (years) 2.1 Yrs 1.9 Yrs
Effective Duration (years) 1.7 Yrs 1.9 Yrs
Average Quality AA- AAA
Yield-to-Maturity 3.1% 2.3%
Current Yield 3.0% 1.8%
# of Securities 187 95
Fund Size $390.3MM
EFFECTIVE DURATION %
FUND BENCHMARK
< 1 Year 40.4 0.0
1 - 3 Years 46.8 100.0
3 - 5 Years 9.8 0.0
5 - 7 Years 2.6 0.0
7 - 10 Years 0.5 0.0
10 - 20 Years 0.0 0.0
> 20 Years 0.0 0.0
CREDIT QUALITY %
FUND BENCHMARK
AAA 58.9 100.0
AA 8.2 0
A 13.3 0
BBB 15.5 0
Below BBB 3.8 0
Cash 0.3 0
3%
2%
1%
0%
-1%
CUIT Short Bond A BB 1-3 Year Treasury Index
FUND PERFORMANCE
QUARTERLY RETURN 3 MO 1 YR 3 YR 5 YR 10 YR
CUIT Short Bond -0.06 1.13 1.26 1.25 2.25
Bloomberg Barclays 1-3 Year Treasury Index -0.16 0.00 0.38 0.50 1.12
CALENDAR YEAR RETURN 2017 2016 2015 2014 2013
CUIT Short Bond 1.71 1.99 0.81 1.37 0.84
Bloomberg Barclays 1-3 Year Treasury Index 0.42 0.86 0.54 0.62 0.36
Please see Important Information on Page 2 The Fund’s benchmark was changed to the Bloomberg Barclays 1-3 Year Treasury Index effective July 1, 2016. For periods prior to July 1, 2016, the applicable benchmarks were: ML 1-3 Yr Treasury Index effective 7/1/01.
3 MO 1 YR 3 YR 5 YR 10 YR
RISK METRICS
CHARACTERISTICS FUND / 5 YR BENCHMARK / 5 YR
Sharpe Ratio 1.6 0.3
Information Ratio 2.1 N/A
Standard Deviation 0.8 0.7
Tracking Error 0.5 N/A
Upside Capture 153.0 100.0
Downside Capture 36.5 100.0

Christian Brothers Investment Services, Inc. n [email protected] PAGE 14Christian Brothers Investment Services, Inc. n [email protected] PAGE 2 | CB -FFS-000-0000
Important InformationBenchmark Index: The Fund’s benchmark was changed to the Bloomberg Barclays 1-3 Year Treasury Index effective July 1, 2016. For periods prior to July 1, 2016, the applicable benchmarks were: ML 1-3 Yr Treasury Index effective 7/1/01; ML 1-5 Yr G/C Index effective 4/1/98; 50% LB Intermediate Government /50% LB 1-3 Yr Government effective 5/1/96; LB 1-3 Yr Government in prior periods. The performance shown for SBF reflects the linked performance of these benchmarks for each applicable period. Characteristics presented for the Short Bond Fund were also compiled using data from Barclays Capital U.S. 1-3 Year Treasury Bond Index. Performance for periods of one year and longer are annualized. All Fund performance is reported net of any fees and expenses, but inclusive of dividends and interest. Past performance is not indicative of future performance. The return and principal value of the Fund will fluctuate, and upon redemption, shares in the Fund may be worth less than their original cost. The comparative indices represent unmanaged or average returns on various financial assets which can be compared to the Fund’s total returns for the purpose of measuring relative performance, but are not necessarily intended to parallel the risk or investment approach of your investments. The indices do not incur taxes or expenses but are inclusive of dividends and interest. Comparative index information is provided by BNY Mellon Bank; information regarding composition of the indices may be obtained from our provider or CBIS.
Bloomberg Index Services Limited: BLOOMBERG® is a trademark and service mark of Bloomberg Finance L.P. and its affiliates (collectively “Bloomberg”). BARCLAYS® is a trademark and service mark of Barclays Bank Plc (collectively with its affiliates, “Barclays”), used under license. Bloomberg or Bloomberg’s licensors, including Barclays, own all proprietary rights in the Bloomberg Barclays Indices. Neither Bloomberg nor Barclays approves or endorses this material, or guarantees the accuracy or completeness of any information herein, or makes any warranty, express or implied, as to the results to be obtained therefrom and, to the maximum extent allowed by law, neither shall have any liability or responsibility for injury or damages arising in connection therewith.
CBIS offers pooled funds on behalf of a not-for-profit investment trust, the Catholic United Investment Trust (CUIT) Offering Memorandum, which contains further information, is available by calling 800-592-8890. Such information should be carefully considered prior to investing in the Fund. Commingled Fund exclusively for tax-exempt Catholic institutions. All assets are invested in accordance with CBIS’ Catholic Responsible Investing Guidelines. Total expense ratio includes management fee and all other fees (accounting, custody and transfer agent). The Funds provide daily NAV and daily liquidity.
CUIT Short Bond Fund
ALLOCATIONS %
Treasuries Agency Industrials Finance Utilities MBS CMO CMBS ABS Municipals Cash
Fund 23.5 8.7 13.6 17.0 1.7 1.6 1.3 10.8 18.9 2.7 0.3
Benchmark 100.0 0.0 0.0 0.0 0.0 0.0 0.0 0.0 0.0 0.0 0.0
FUND COMMENTARY
3-Month Review ¡ The Fed increased benchmark interest rate to 1.50-1.75% in March. As a result, yields rose about 40 basis points across short to intermediate
areas of the curve.
¡ The Fund’s strongest source of return, approximately10 basis points, was its shorter relative duration to the benchmark (1.7 vs. 1.9).
¡ The combination of sector and security selection added modestly to overall outperformance of the Fund.
¡ Curve positioning was neutral for the period.
12-Month Review
¡ The Fund’s combined allocation to corporates and securitized bonds contributed approximately 80 basis points of income advantage over the all-Treasury index. Allocations to financials, industrials, asset backed and commercial mortgage backed securities were additive.
¡ Shorter duration and curve positioning together added approximately 45 basis points to overall performance as yields increased on the front end of the curve.
¡ Security selection added modestly to results.
Positioning & Outlook
¡ The sub-advisor expects modest economic growth in the 2-3% range for 2018 and continues to seek added income from non-Treasury holdings.
¡ The Fund maintains duration slightly below the benchmark in anticipation of the Fed’s desire to raise rates.
¡ Emphasis on industrials, financials, asset backed, and commercial mortgage backed issues provide attractive opportunities to generate stable cash flow in the Fund.
¡ Curve positioning remains “barbelled” versus the benchmark, with an overweight in the 0-1 and 3-5 year duration buckets.
¡ The portfolio maintains close to a 4% exposure to high-yield bonds; the sub-advisor will continue to emphasize upgrade and take-out opportunities within the industrial sector.

Christian Brothers Investment Services, Inc. n [email protected] PAGE 15
FUND FACTS
PROFILE Q1 2018
Christian Brothers Investment Services, Inc. (800) 592-8890 n [email protected]
CUIT Opportunistic Bond Fund
Objective Current income and long-term capital appreciation
InvestmentsU.S. government, agency, corporate, and mortgage-backed securities; primarily investment grade with no more than 20% of the portfolio rated below BBB; up to a 10% allocation to merger/arbitrage sector
StrategyUses top down macroeconomic analysis, along with fundamental industry and company research, to capture inefficiencies in the valuation of sectors and individual securities; this is combined with duration management (+/– 2.5 years of the benchmark) in pursuit of above-benchmark returns over a full market cycle
BenchmarkBloomberg Barclays 1-5 Year Government/Credit Index
Asset ManagersLongfellow Investment Management (Effective 5/1/13); Reams AssetManagement Co. (Effective 5/1/13)
Total Expense Ratio/MinimumClass A: 0.56% / No MinimumClass B: 0.41% / $5M
Fund Features Commingled fund exclusive for tax-exempt Catholic institutions
Daily NAV and daily liquidity
Dividends Distributed Monthly
PORTFOLIO ANALYSIS
STATISTICS FUND BENCHMARK
Average Maturity (years) 3.0 Yrs 2.8 Yrs
Effective Duration (years) 2.5 Yrs 2.7 Yrs
Average Quality A+ AA
Yield-to-Maturity 3.4% 2.6%
Current Yield 3.1% 2.3%
# of Securities 347 2,847
Fund Size $471.8MM
EFFECTIVE DURATION %
FUND BENCHMARK
< 1 Year 15.4 2.9
1 - 3 Years 52.8 59.2
3 - 5 Years 27.8 37.9
5 - 7 Years 3.6 0.0
7 - 10 Years 0.4 0.0
10 - 20 Years 0.1 0.0
> 20 Years 0.0 0.0
CREDIT QUALITY %
FUND BENCHMARK
AAA 38.8 68.7
AA 5.1 6.0
A 19.1 13.0
BBB 25.0 12.2
Below BBB 4.2 0.0
Merger/Arbitrage 6.7 0.0
Cash 1.0 0.0
2%
1%
0%
-1%
CUIT Opport. Bond B Bloomberg Barclays 1-5 Yr Gov't/Credit
FUND PERFORMANCE
QUARTERLY RETURN 3 MO 1 YR 3 YR 5 YR 10 YR
CUIT Opport. Bond A -0.53 0.72 1.25 – –
CUIT Opport. Bond B -0.50 0.87 1.40 – –
Bloomberg Barclays 1-5 Year Government/Credit -0.50 0.19 0.77 – –
CALENDAR YEAR RETURN 2017 2016 2015 2014 2013
CUIT Opport. Bond A 1.63 2.54 0.98 1.23 –
CUIT Opport. Bond B 1.78 2.69 1.23 1.27 –
Bloomberg Barclays 1-5 Year Government/Credit 1.27 1.56 0.97 1.42 –
Please see Important Information on Page 2
3 MO 1 YR 3 YR 5 YR 10 YR
*Allocations exclude M&A.
RISK METRICS
CHARACTERISTICS FUND / 3 YR BENCHMARK / 3 YR
Sharpe Ratio 1.3 0.2
Information Ratio 1.6 N/A
Standard Deviation 1.0 1.2
Tracking Error 0.7 N/A
Upside Capture 113.1 100.0
Downside Capture 34.1 100.0

Christian Brothers Investment Services, Inc. n [email protected] PAGE 16Christian Brothers Investment Services, Inc. n [email protected] PAGE 2 | CB -FFS-000-0000
Important InformationBenchmark Index: Bloomberg Barclays 1–5 Year U.S. Govt/Credit Index. Performance for periods of one year and longer are annualized. All Fund performance is reported net of any fees and expenses, but inclusive of dividends and interest. Past performance is not indicative of future performance. The return and principal value of the Fund will fluctuate, and upon redemption, shares in the Fund may be worth less than their original cost. The comparative index represents unmanaged or average returns on various financial assets which can be compared to the Fund’s total returns for the purpose of measuring relative performance, but is not necessarily intended to parallel the risk or investment approach of your investments. The index does not incur taxes or expenses but is inclusive of dividends and interest. Comparative index information is provided by BNY Mellon Bank; information regarding composition of the index may be obtained from our provider or CBIS.
Bloomberg Index Services Limited: BLOOMBERG® is a trademark and service mark of Bloomberg Finance L.P. and its affiliates (collectively “Bloomberg”). BARCLAYS® is a trademark and service mark of Barclays Bank Plc (collectively with its affiliates, “Barclays”), used under license. Bloomberg or Bloomberg’s licensors, including Barclays, own all proprietary rights in the Bloomberg Barclays Indices. Neither Bloomberg nor Barclays approves or endorses this material, or guarantees the accuracy or completeness of any information herein, or makes any warranty, express or implied, as to the results to be obtained therefrom and, to the maximum extent allowed by law, neither shall have any liability or responsibility for injury or damages arising in connection therewith.
CUIT Opportunistic Bond Fund
ALLOCATIONS %
Treasuries Agency Industrials Finance Utilities Sovereign MBS CMO CMBS ABS MunicipalsMerger/
Arbitrage Cash
Fund 14.9 1.6 22.0 21.4 1.6 0.0 3.6 0.7 11.2 11.6 3.7 6.7 1.0
Benchmark 60.8 6.6 14.8 11.5 1.1 0.6 0.0 0.0 0.0 0.0 0.7 0.0 0.0
All attribution is based on gross portfolio performance.
Active Weights
-45.9%
Treasuries
-5.0%
Agency 3.6%
MBS
0.7%CMO
3.0%
Municipals
6.7%
M&A
1.0%
Cash
7.2%
Industrials
9.9%
Finance0.5%Utilies -0.6%
Sovereign11.2% 11.6%
CMBS ABS
FUND COMMENTARY
3-Month Review ¡ The Fund’s relatively shorter duration (2.5 vs. 2.7) was the main driver of excess returns as yields rose during the quarter.
¡ Curve positioning was neutral for the period.
¡ Security selection added modestly to offset the negative drag caused by key areas such as financials and industrials.
¡ The Fund’s merger and arbitrage sleeve lagged the index due to a difficult regulatory environment and concerns around the uncertain timeline for deal approvals.
12-Month Review ¡ Sector allocation was additive (+79 basis points), due to the Fund’s overweight in the outperforming securitized and corporate sectors.
An underweight to Treasuries also benefitted results.
¡ Over the period, the Fund’s relative shorter duration added 18 basis points to performance.
¡ Curve positioning benefitted due to longer relative to benchmark exposure 5+ years.
¡ Security selection was additive (+27 basis points) largely from strength among corporates; industrial issues contributed 17 basis points.
¡ The merger and arbitrage strategy outperformed the Index and was additive for the trailing 12-month period.
Positioning & Outlook ¡ The Fund continues to maintain shorter duration than the benchmark. Positioning remains defensive given the likelihood of continued Fed
tightening.
¡ The sub-advisor continues to emphasize corporates and securitized sectors with a corresponding underweight to Treasuries. Allocation to industrials, financials, ABS and CMBS remains near 70% of the Fund’s sector exposure.
¡ Curve positioning continues to overweight 0-1 year securities with a significant relative underweight to 3-5 year exposure.
¡ The Fund maintains approximately a 7% allocation to the merger and arbitrage strategy. The sub-advisor seeks to find pockets of opportunity in deals that have the most attractive risk/reward, but where there appears to be a defined path to close.

Christian Brothers Investment Services, Inc. n [email protected] PAGE 17
FUND FACTS
PROFILE Q1 2018
Christian Brothers Investment Services, Inc. (800)-592-8890 n [email protected]
CUIT Int. Diversified Bond Fund
Objective Current income and long-term capital appreciation
InvestmentsU.S. government, agency, corporate, and mortgage-backed securities; holdings are primarily investment grade (BBB to AAA, based on the three primary rating agencies)
StrategyUses top down macroeconomic analysis, along with fundamental research, to capture inefficiencies in the valuation of sectors and individual securities; combined with duration management (+/– 20% of the benchmark) in pursuit of above-benchmark returns over a full market cycle
BenchmarkBloomberg Barclays Aggregate Bond Index
Asset ManagersDodge & Cox, Inc. (Effective 1/1/95); Jennison Associates (Effective 9/2/02); Reams Asset Management Co. (Effective 7/1/08)
Total Expense Ratio/MinimumClass A: 0.53% / No MinimumClass B: 0.38% / $5M
Fund Features Commingled fund exclusive for tax-exempt Catholic institutions
Daily NAV and daily liquidity
Dividends Distributed Monthly
PORTFOLIO ANALYSIS
STATISTICS FUND BENCHMARK
Average Maturity (years) 7.8 Yrs 8.3 Yrs
Effective Duration (years) 5.7 Yrs 6.0 Yrs
Average Quality AA+ AA
Yield-to-Maturity 3.2% 3.1%
Current Yield 3.1% 3.1%
# of Securities 744 9,826
Fund Size $1,239.5MM
EFFECTIVE DURATION %
FUND BENCHMARK
< 1 Year 8.2 1.1
1 - 3 Years 19.6 22.2
3 - 5 Years 29.3 28.9
5 - 7 Years 24.6 26.0
7 - 10 Years 6.4 7.4
10 - 20 Years 11.4 14.2
> 20 Years 0.4 0.2
CREDIT QUALITY %
FUND BENCHMARK
AAA 65.2 71.6
AA 4.2 3.8
A 11.0 11.2
BBB 16.2 13.3
Below BBB 2.4 0.0
Cash 1.2 0.0
6%
4%
2%
0%
-2%
CUIT Int. Divers. Bond B Bloomberg Barclays Aggregate Bond Index
FUND PERFORMANCE
QUARTERLY RETURN 3 MO 1 YR 3 YR 5 YR 10 YR
CUIT Int. Divers. Bond A -1.24 1.30 1.25 1.85 4.31
CUIT Int. Divers. Bond B -1.13 1.52 1.43 2.02 4.47
Bloomberg Barclays Aggregate Bond Index -1.46 1.20 1.20 1.82 3.63
CALENDAR YEAR RETURN 2017 2016 2015 2014 2013
CUIT Int. Divers. Bond A 3.38 3.53 -0.13 5.65 -1.73
CUIT Int. Divers. Bond B 3.54 3.69 -0.05 5.81 -1.51
Bloomberg Barclays Aggregate Bond Index 3.54 2.65 0.55 5.97 -2.02
Please see Important Information on Page 2
3 MO 1 YR 3 YR 5 YR 10 YR
RISK METRICS
CHARACTERISTICS FUND / 5 YR BENCHMARK / 5 YR
Sharpe Ratio 0.7 0.5
Information Ratio 0.9 N/A
Standard Deviation 2.8 2.9
Tracking Error 0.7 N/A
Upside Capture 100.9 100.0
Downside Capture 83.2 100.0

Christian Brothers Investment Services, Inc. n [email protected] PAGE 18Christian Brothers Investment Services, Inc. n [email protected] PAGE 2
CUIT Int. Diversified Bond Fund
ALLOCATIONS %
Treasuries Agency Industrials Finance Utilities Supranational Sovereign MBS CMO CMBS ABS MunicipalsCovered Bonds
Merger Arbitrage Cash
Fund 41.0 0.7 16.2 13.9 1.7 0.0 0.0 18.8 1.0 1.9 2.5 1.2 0.0 0.0 1.2
Benchmark 37.2 3.3 15.4 8.1 1.8 1.6 1.0 28.2 0.0 1.9 0.5 1.0 0.1 0.0 0.0
All attribution is based on gross portfolio performance.
Active Weights
3.8%
Treasuries
-2.6%
0.8%Agency
-1.0%
Sovereign
-9.4%
MBS
2.0%
0.2%1.2%
0.0%ABS Municipals CashMerger
Arbitrage
CoveredBonds
Industrials
5.8%
Finance -0.1% -0.1%
Utilies
-1.6%
Supranational 1.0%CMO
0.0%CMBS

Christian Brothers Investment Services, Inc. n [email protected] PAGE 3 | CB -FFS-000-0000
CUIT Int. Diversified Bond Fund
Important InformationBenchmark Index: Bloomberg Barclays Aggregate Bond Index. Performance for periods of one year and longer are annualized. All Fund performance is reported net of any fees and expenses, but inclusive of dividends and interest. Past performance is not indicative of future performance. The return and principal value of the Fund will fluctuate, and upon redemption, shares in the Fund may be worth less than their original cost. The comparative index represents unmanaged or average returns on various financial assets which can be compared to the Fund’s total returns for the purpose of measuring relative performance, but is not necessarily intended to parallel the risk or investment approach of your investments. The index does not incur taxes or expenses but is inclusive of dividends and interest. Comparative index information is provided by BNY Mellon Bank; information regarding composition of the index may be obtained from our provider or CBIS.
Bloomberg Index Services Limited: BLOOMBERG® is a trademark and service mark of Bloomberg Finance L.P. and its affiliates (collectively “Bloomberg”). BARCLAYS® is a trademark and service mark of Barclays Bank Plc (collectively with its affiliates, “Barclays”), used under license. Bloomberg or Bloomberg’s licensors, including Barclays, own all proprietary rights in the Bloomberg Barclays Indices. Neither Bloomberg nor Barclays approves or endorses this material, or guarantees the accuracy or completeness of any information herein, or makes any warranty, express or implied, as to the results to be obtained therefrom and, to the maximum extent allowed by law, neither shall have any liability or responsibility for injury or damages arising in connection therewith.
CBIS offers pooled funds on behalf of a not-for-profit investment trust, the Catholic United Investment Trust (CUIT) Offering Memorandum, which contains further information, is available by calling 800-592-8890. Such information should be carefully considered prior to investing in the Fund. Commingled Fund exclusively for tax-exempt Catholic institutions. All assets are invested in accordance with CBIS’ Catholic Responsible Investing Guidelines. Total expense ratio includes management fee and all other fees (accounting, custody and transfer agent). The Funds provide daily NAV and daily liquidity.
FUND COMMENTARY
3-Month Review ¡ The Fund’s duration positioning, shorter than the benchmark, was the largest contributor to outperformance for the quarter (+24 basis points).
¡ Curve positioning was a neutral as the curve shifted in parallel for the quarter.
¡ Sector allocation was slightly negative (-3 basis points), primarily due to the 4.1% bank sector overweight.
¡ Security selection was positive (+10 basis points) for the quarter. Corporate names in the industrial and financial sectors were the primary drivers.
12-Month Review
¡ The Fund’s shorter than benchmark duration positioning was positive (+49 basis points). Over the period, the Fund’s duration modestly increased from 5.4 years to 5.7 years.
¡ Curve positioning was a slight negative due to a flattening with no change to the 30-year.
¡ Sector exposure was additive (+8 basis points), largely due the Fund’s 6.2% overweight to corporates.
¡ Security selection was a slight detractor (-5 basis points) due primarily to Treasuries and agencies and offset by corporates and government related.
Positioning & Outlook
¡ The Fund’s sub-advisors are all in a defensive mode due to historically tight spreads and a lack of volatility. They are poised to take advantage of opportunities as they emerge.
¡ The Fund’s effective duration continues to be slightly below benchmark (5.7 vs 6.0 years) as the sub-advisors expectations of continued Fed rate increases and improved economic conditions continue.
¡ The Fund’s curve positioning remains similar to last quarter with an overweight to 0-3 year securities and a slight underweight to 10+ years. During the quarter the sub-advisors increased 5-7 year maturity holdings by about 7% due to relative valuation opportunities.
¡ The Fund’s sector allocation remains similar to the previous quarter end. Overweight sectors are Treasuries (+5%) and corporates (+5%), primarily in Bank names. The largest underweight position is the mortgage backed securities sector (-8%).
Christian Brothers Investment Services, Inc. n [email protected] PAGE 19

Christian Brothers Investment Services, Inc. n [email protected] PAGE 20
FUND FACTS
PROFILE Q1 2018
Christian Brothers Investment Services, Inc. (800) 592-8890 n [email protected]
CUIT Balanced Fund
Objective Long-term capital appreciation and current income
InvestmentsThe equity allocation is comprised primarily of large-cap U.S. companies diversified across industry sectors. Fixed-income instruments include corporate, U.S. government and agency bonds, and asset-backed and mortgage-backed securities.
StrategyThe equity portion blends undervalued companies with a modest exposure to growth through a core equity index allocation. The fixed-income portion leverages economic and fundamental research in an attempt to identify and capture inefficiencies across the yield curve.
Benchmark60% S&P 500 Index / 40% Bloomberg Barclays Aggregate Bond Index
Asset ManagersFixed Income: Dodge & Cox, Inc. (Effective 4/1/91); Jennison Associates(Effective 9/2/02); Reams Asset Management Co. (Effective 7/1/08)
Equities: Dodge & Cox, Inc. – (Effective 4/1/91); RhumbLine Advisers – (Effective 4/1/02)
Total Expense Ratio / Minimum 0.89% / No Minimum
Fund Features Commingled fund exclusive for tax-exempt Catholic institutions
Daily NAV and daily liquidity
Dividends Distributed Monthly
PORTFOLIO ANALYSIS
STATISTICS FUND S&P 500
Weighted Median Market Cap $70.3B $100.5B
Price/Book 2.3x 3.1x
Price/Earnings 17.4x 21.4x
Return on Equity 16.2% 19.8%
Dividend Yield 1.6% 1.9%
5-year Earnings Growth 8.7% 9.5%
Beta 1.0 1.0
10 Largest Holdings 27.6 11.7
# of Equity Securities 474 507
Fund Size $230.3MM
TOP TEN HOLDINGS
STATISTICS %
Microsoft Corporation 3.4
Alphabet Inc. 3.2
Bank of America Corporation 3.1
Charles Schwab Corporation 3.0
Wells Fargo & Company 2.8
Capital One Financial Corporation 2.8
JPMorgan Chase & Co. 2.5
Comcast Corporation 2.3
Twenty-First Century Fox, Inc. 2.3
Goldman Sachs Group, Inc. 2.2
PORTFOLIO ANALYSIS: FIXED INCOME
STATISTICS FUND BBAgg
Average Maturity 7.8 8.3
Effective Duration (years) 5.7 6.0
Average Quality AA AA
Yield-to-Maturity 3.2% 3.1%
Current Yield 3.1% 3.1%
# of Securities 439 9,826
EFFECTIVE DURATION FUND BBAgg
< 1 Year 6.1 1.1
1 - 3 Years 20.8 22.2
3 - 5 Years 31.0 28.9
5 - 7 Years 24.4 26.0
7 - 10 Years 6.2 7.4
10 - 20 Years 11.1 14.2
> 20 Years 0.4 0.2
18%
10%
8%
6%
4%
2%
0%
-2%
CUIT Balanced Fund 60% S&P 500 / 40% BB Agg
FUND PERFORMANCE
% AVERAGE ANNUAL RETURN 3 MO 1 YR 3 YR 5 YR 10 YR
CUIT Balanced -0.87 8.68 7.08 8.62 7.50
60% S&P 500 Index / 40% Bloomberg Barclays Aggregate Bond -0.92 8.89 7.10 8.81 7.52
CALENDAR YEAR RETURN 2017 2016 2015 2014 2013
CUIT Balanced 13.08 12.05 -2.33 8.80 21.29
60% S&P 500 Index / 40% Bloomberg Barclays Aggregate Bond 14.25 8.31 1.28 10.62 17.56
Please see Important Information on Page 2
3 MO 1 YR 3 YR 5 YR 10 YR

Christian Brothers Investment Services, Inc. n [email protected] PAGE 21Christian Brothers Investment Services, Inc. n [email protected] PAGE 2
CUIT Balanced Fund
MARKET SECTOR ANALYSIS % – EQUITY
ConsumerDiscretionary
ConsumerStaples Energy Financials Healthcare Industrials
InformationTechnology Materials Real Estate
Telecomm Service Utilities Cash
Fund 16.7 2.5 7.6 26.0 9.4 7.3 22.4 2.0 1.1 1.8 1.0 2.2
Benchmark 12.7 7.7 5.7 14.8 13.7 10.2 24.8 2.8 2.8 1.9 2.8 0.0
All attribution is based on gross portfolio performance.
Active Weights
4.0%
1.9%
11.2%
ConsumerDiscretionary
Energy Energy
-5.2%
ConsumerStaples
-2.9% -2.4%-1.7% -1.8%
-0.1%-0.8%
IndustrialsInformationTechnology Real Estate Real Estate
TelecommServiceMaterials
2.2%
Cash
-4.3%
Healthcare
MARKET SECTOR ANALYSIS % – FIXED INCOME
Treasuries Agency Industrials Finance Utilities Supranational Sovereign MBS CMO CMBS ABS MunicipalsCovered Bonds
Merger Arbitrage Cash
Fund 41.8 0.6 15.4 12.5 1.6 0.0 0.0 19.5 0.9 1.7 3.0 0.8 0.0 0.0 2.2
Benchmark 37.2 3.3 15.4 8.1 1.8 1.6 1.0 28.2 0.0 1.9 0.5 1.0 0.1 0.0 0.0
Industrials
All attribution is based on gross portfolio performance.
Active Weights
4.6%
Treasuries
-2.7%
0.0%Agency
-1.0%
-8.7%
Sovereign MBS
2.5%2.2%
0.0%ABS
Municipals
CashMergerArbitrage
CoveredBonds
4.4%
Finance -0.2% -0.2%-0.2% -0.1%
Utilies
-1.6%
Supranational 0.9%CMO
CMBS

Christian Brothers Investment Services, Inc. n [email protected] PAGE 3 | CB -FFS-000-0000
Important InformationBenchmark Index: The Fund’s benchmark was changed to 60% S&P 500 Index / 40% Bloomberg Barclays Aggregate effective January 2, 2003. For prior periods, the applicable benchmark was 60% S&P 500 Index / 30% LB Aggregate / 10% T-Bill. Performance for periods of one year and longer are annualized. All Fund performance is reported net of any fees and expenses, but inclusive of dividends and interest. Past performance is not indicative of future performance. The return and principal value of the Fund will fluctuate, and upon redemption, shares in the Fund may be worth less than their original cost. The comparative indices represent unmanaged or average returns on various financial assets which can be compared to the Fund’s total returns for the purpose of measuring relative performance, but are not necessarily intended to parallel the risk or investment approach of your investments. The indices do not incur taxes or expenses but are inclusive of dividends and interest. Comparative index information is provided by BNY Mellon Bank; information regarding composition of the indices may be obtained from our provider or CBIS.
The S&P 500 Index is a product of S&P Dow Jones Indices LLC or its affiliates ("SPDJI"), and has been licensed for use by CBIS. Standard & Poor's® and S&P® are registered trademarks of Standard & Poor's Financial Services LLC ("S&P"); Dow Jones® is a registered trademark of Dow Jones Trademark Holdings LLC ("Dow Jones"); and these trademarks have been licensed for use by SPDJI and sublicensed for certain purposes by CBIS. The CUIT Core Equity Index Fund is not sponsored, endorsed, sold or promoted by SPDJI, Dow Jones, S&P, or their respective affiliates and none of such parties make any representation regarding the advisability of investing in such product(s) nor do they have any liability for any errors, omissions, or interruptions of the S&P 500 Index.
Bloomberg Index Services Limited: BLOOMBERG® is a trademark and service mark of Bloomberg Finance L.P. and its affiliates (collectively “Bloomberg”). BARCLAYS® is a trademark and service mark of Barclays Bank Plc (collectively with its affiliates, “Barclays”), used under license. Bloomberg or Bloomberg’s licensors, including Barclays, own all proprietary rights in the Bloomberg Barclays Indices. Neither Bloomberg nor Barclays approves or endorses this material, or guarantees the accuracy or completeness of any information herein, or makes any warranty, express or implied, as to the results to be obtained therefrom and, to the maximum extent allowed by law, neither shall have any liability or responsibility for injury or damages arising in connection therewith.
CBIS offers pooled funds on behalf of a not-for-profit investment trust, the Catholic United Investment Trust (CUIT) Offering Memorandum, which contains further information, is available by calling 800-592-8890. Such information should be carefully considered prior to investing in the Fund. Commingled Fund exclusively for tax-exempt Catholic institutions. All assets are invested in accordance with CBIS’ Catholic Responsible Investing Guidelines. Total expense ratio includes management fee and all other fees (accounting, custody and transfer agent). The Funds provide daily NAV and daily liquidity.
FUND COMMENTARY
3-Month Review ¡ The equity component of the Fund trailed the S&P 500 by a small amount (-32 basis points); the fixed income composite finished ahead of the
Barclays U.S. Aggregate index.
¡ The style tilt of the equity component detracted as value oriented sub-advisor Dodge & Cox did not keep pace with the S&P 500, although it was well ahead of the Russell 1000 Value. This was the case in Q1 and has been for much of the past five years.
¡ Overall stock selection results were weakest in consumer discretionary (media & retail), financials, and healthcare.
¡ The Fund’s fixed income duration positioning, shorter than the benchmark, was the largest contributor to outperformance for the quarter (+24 basis points).
12-Month Review
¡ The Fund underperformed the index over the trailing 12-month period primarily because of the value tilt of the equity allocation and weak stock selection (combined -83 basis points). The fixed income component added value.
¡ The largest negatives for relative performance were media holdings in the consumer discretionary sector of the Dodge & Cox portfolio. The passive index strategy outperformed, driven by the absence of industrial conglomerate GE and several weak performing pharmaceutical stocks.
¡ The fixed income segment’s shorter than benchmark duration positioning was positive (+45 basis points). Over the period, the Fund’s duration modestly increased from 5.5 to 5.7 years.
Positioning & Outlook
¡ The Fund maintains a value tilt within the equity allocation. This has hindered relative performance in the short term, but is generally beneficial over longer time periods.
¡ Within the equity portfolio, the Fund is overweight financials, consumer discretionary (predominately media companies), and energy.
¡ The equity portfolio is underweight consumer staples (predominately tobacco), industrials, healthcare, information technology, utilities, and real estate.
¡ The Fund’s fixed income sub-advisors are all in a defensive mode due to historically tight spreads and a lack of volatility. They are poised to take advantage of opportunities as they emerge.
¡ The Fund’s effective duration continues to be slightly below benchmark (5.7 vs 6.0 years) as the sub-advisors expectations of continued Fed rate increases and improved economic conditions continue.
CUIT Balanced Fund
Christian Brothers Investment Services, Inc. n [email protected] PAGE 22

Christian Brothers Investment Services, Inc. n [email protected] PAGE 23
FUND FACTS
PROFILE Q1 2018
Christian Brothers Investment Services, Inc. (800) 592-8890 n [email protected]
CUIT Core Equity Index Fund
Objective Long-term capital appreciation
InvestmentsCommon stocks of companies that make up the S&P 500, except those excluded as a result of CBIS’ screens (about 6% of the S&P 500's constituent companies – all unscreened companies are held at their index weight or higher)
StrategyTrack the S&P 500 and counter the impact of screens by overweighting select holdings so that the Fund's broadquantitative characteristics match those of the S&P 500 as closely as possible
BenchmarkS&P 500 Index
Asset ManagersRhumbLine Advisers (Effective 1/1/95)
Total Expense Ratio / Minimum Class A: 0.38% / No MinimumClass B: 0.18% / $3M
Fund Features Commingled fund exclusive for tax-exempt Catholic institutions
Daily NAV and daily liquidity
Dividends Distributed Quarterly
PORTFOLIO ANALYSIS
STATISTICS FUND BENCHMARK
Weighted Median Market Cap $86.7B $100.5B
Price/Book 3.1x 3.1x
Price/Earnings 21.3x 21.4x
Return on Equity 20.3% 19.8%
Dividend Yield 1.8% 1.9%
5-year Earnings Growth 10.5% 9.5%
Beta 1.0 1.0
Active Share 14.9 0
10 Largest Holdings 22.9 20.6
# of Equity Securities 465 507
Fund Size $1,847.2MM
TOP TEN HOLDINGS
STATISTICS %
Apple Inc. 3.9
Microsoft Corporation 3.4
Alphabet Inc. 3.0
Amazon.com, Inc. 2.6
Berkshire Hathaway Inc. 2.6
Facebook, Inc. 1.8
JPMorgan Chase & Co. 1.7
Exxon Mobil Corporation 1.5
Bank of America Corporation 1.3
3M Company 1.2
20%
15%
10%
5%
0%
-5%
CUIT Core Equity B S&P 500 Index
RISK METRICSCHARACTERISTICS FUND / 5 YR BENCHMARK / 5 YR
Sharpe Ratio 1.3 1.3
Information Ratio 0.4 N/A
Standard Deviation 10.0 9.9
Tracking Error 0.6 N/A
Upside Capture 101.9 100.0
Downside Capture 101.7 100.0
FUND PERFORMANCE
QUARTERLY RETURN 3 MO 1 YR 3 YR 5 YR 10 YR
CUIT Core Equity A -0.70 14.87 10.49 13.10 9.08
CUIT Core Equity B -0.63 15.12 10.72 13.32 9.30
S&P 500 Index -0.76 13.99 10.78 13.31 9.49
CALENDAR YEAR RETURN 2017 2016 2015 2014 2013
CUIT Core Equity A 22.64 11.27 0.29 13.99 32.03
CUIT Core Equity B 22.87 11.51 0.50 14.19 32.31
S&P 500 Index 21.83 11.96 1.38 13.69 32.39
Please see Important Information on Page 2 The Fund’s benchmark was changed to the Bloomberg Barclays 1-3 Year Treasury Index effective July 1, 2016. For periods prior to July 1, 2016, the applicable benchmarks were: ML 1-3 Yr Treasury Index effective 7/1/01.
3 MO 1 YR 3 YR 5 YR 10 YR

Christian Brothers Investment Services, Inc. n [email protected] PAGE 24Christian Brothers Investment Services, Inc. n [email protected] PAGE 2
CUIT Core Equity Index Fund
MARKET SECTOR ANALYSIS %
Consumer Discretionary
Consumer Staples Energy Financials Healthcare Industrials
Information Technology Materials Real Estate
TelecommService Utilities Cash
Fund 12.9 7.5 5.7 15.6 11.7 9.0 25.4 3.2 3.3 2.0 3.0 0.7
Benchmark 12.7 7.7 5.7 14.8 13.7 10.2 24.8 2.8 2.8 1.9 2.8 0.0
All attribution is based on gross portfolio performance.
Active Weights0.2% 0.4% 0.2%
-0.2%0.0%
0.6% 0.7%0.8%
-1.2%-2.0%
0.5%0.1%
Consumer Discretionary
InformationTechnology
Materials Cash
ConsumerStaples
Energy Financials
Healthcare Industrials
RealEstate
TelecommService
Utilities

Christian Brothers Investment Services, Inc. n [email protected] PAGE 25Christian Brothers Investment Services, Inc. n [email protected] PAGE 3 | CB -FFS-000-0000
Important InformationBenchmark Index: S&P 500 Index. Performance for periods of one year and longer are annualized. All Fund performance is reported net of any fees and expenses, but inclusive of dividends and interest. Past performance is not indicative of future performance. The return and principal value of the Fund will fluctuate, and upon redemption, shares in the Fund may be worth less than their original cost. The comparative index represents unmanaged or average returns on various financial assets which can be compared to the Fund’s total returns for the purpose of measuring relative performance, but is not necessarily intended to parallel the risk or investment approach of your investments. The index does not incur taxes or expenses but is inclusive of dividends and interest. Comparative index information is provided by BNY Mellon Bank; information regarding composition of the index may be obtained from our provider or CBIS.
The S&P 500 Index is a product of S&P Dow Jones Indices LLC or its affiliates ("SPDJI"), and has been licensed for use by CBIS. Standard & Poor's® and S&P® are registered trademarks of Standard & Poor's Financial Services LLC ("S&P"); Dow Jones® is a registered trademark of Dow Jones Trademark Holdings LLC ("Dow Jones"); and these trademarks have been licensed for use by SPDJI and sublicensed for certain purposes by CBIS. The CUIT Core Equity Index Fund is not sponsored, endorsed, sold or promoted by SPDJI, Dow Jones, S&P, or their respective affiliates and none of such parties make any representation regarding the advisability of investing in such product(s) nor do they have any liability for any errors, omissions, or interruptions of the S&P 500 Index.
CBIS offers pooled funds on behalf of a not-for-profit investment trust, the Catholic United Investment Trust (CUIT) Offering Memorandum, which contains further information, is available by calling 800-592-8890. Such information should be carefully considered prior to investing in the Fund. Commingled Fund exclusively for tax-exempt Catholic institutions. All assets are invested in accordance with CBIS’ Catholic Responsible Investing Guidelines. Total expense ratio includes management fee and all other fees (accounting, custody and transfer agent). The Funds provide daily NAV and daily liquidity.
CUIT Core Equity Index Fund
FUND COMMENTARY
3-Month Review ¡ The Fund was slightly overweight in the best performing information technology sector, adding 3 basis points to relative return in the quarter.
¡ Pharmaceutical companies had returns averaging -3.0% in Q1. The Fund did not hold most of those companies and redeployed assets into much stronger performing biotech stocks, adding 30 basis points in the quarter.
¡ Tobacco screens by themselves added 9 basis points; however, re-weighting into other industries within consumer staples offset much of that gain.
¡ Aerospace and defense company screens hindered relative performance in the quarter, as those stocks had 8.2% average gains. The restriction on GE added 14 basis points in the quarter. In total the relative performance impact was -16 basis points for the industrials sector.
¡ There were no significant performance differentials in the remaining sectors.
12-Month Review
¡ The largest contributors to the Fund’s outperformance in the 12-month period were noted in healthcare and industrials holdings.
¡ In healthcare, the large underweight in pharmaceuticals, together with the specific performance of the Fund’s pharma holdings added more than 70 basis points in relative return. Some of that gain (approximately 20 basis points) was offset by the subsequent re-weighting into weaker performing biotech stocks.
¡ The industrials sector was additive (+42 basis points) over the past 12 months. Due to screening GE, which returned -53% during the period, the Fund gained nearly 80 basis points.
¡ Also within industrials, aerospace and defense screens subtracted 55 basis points from relative return.
¡ Tobacco screens were additive (+~30 basis points); the total impact within consumer staples was added 12 basis points.
Positioning & Outlook
¡ The Fund is structurally underweight pharmaceuticals (healthcare sector), aerospace and defense and a large conglomerate (industrials sector) and tobacco (consumer staples sector) due to Catholic Responsible InvestingSM screens.
¡ Screened companies represent about 14% of the S&P 500 by market cap.
¡ The Fund is constructed using a portfolio optimization process that aligns the portfolio’s factor exposures as closely as possible with those of its benchmark, using a range of fundamental security and industry factors, while also minimizing specific risk by constraining individual security weights to their Index weights or slightly higher. In so doing it seeks to minimize tracking error, while also constraining trading costs.

Christian Brothers Investment Services, Inc. n [email protected] PAGE 26
FUND FACTS
PROFILE Q1 2018
Christian Brothers Investment Services, Inc. (800) 592-8890 n [email protected]
CUIT Value Equity Fund
Objective Long-term capital appreciation
InvestmentsPrimarily the common stocks of U.S. companies, and the dollar denominated stocks of foreign companies, with market capitalizations greater than $1 billion
StrategyCombines complementary value strategies – one seeks undervalued securities using fundamental research, emphasizing industry-leaders with a medium to long-term investment horizon; the other seeks undervalued securities using a quantitative model to analyze asset values, earnings, and other factors
BenchmarkRussell 1000 Value Index
Asset ManagersDodge & Cox (Effective 2/1/00) AJO (Effective 4/1/02)
Total Expense Ratio / Minimum Class A: 1.04% / No MinimumClass B: 0.69% / $5M
Fund Features Commingled fund exclusive for tax-exempt Catholic institutions
Daily NAV and daily liquidity
Dividends Distributed Quarterly
TOP TEN HOLDINGS
STATISTICS %
Bank of America Corporation 3.8
JPMorgan Chase & Co. 3.7
Microsoft Corporation 2.4
Charles Schwab Corporation 2.4
Capital One Financial Corporation 2.2
Wells Fargo & Company 1.8
Cigna Corporation 1.8
Twenty-First Century Fox, Inc. 1.7
Hewlett Packard Enterprise Company 1.7
Goldman Sachs Group, Inc. 1.7
PORTFOLIO ANALYSIS
STATISTICS FUND BENCHMARK
Weighted Median Market Cap $40.9B $63.4B
Price/Book 2.0x 2.0x
Price/Earnings 15.1x 17.0x
Return on Equity 17.0% 12.3%
Dividend Yield 1.7% 2.4%
5-year Earnings Growth 11.8% 5.9%
Beta 1.1 1.0
Active Share 69.8 N/A
10 Largest Holdings 23.1 9.3
# of Equity Securities 174 711
Turnover Rate 47.0 N/A
Fund Size $338.8MM
RISK METRICSCHARACTERISTICS FUND / 5 YR BENCHMARK / 5 YR
Sharpe Ratio 1.0 1.0
Information Ratio 0.4 N/A
Standard Deviation 11.5 10.0
Tracking Error 3.4 N/A
Upside Capture 109.8 100.0
Downside Capture 102.9 100.0
Please see Important Information on Page 2
20%
10%
0%
-10%
CUIT Value Equity B Russell 1000 Value Index
FUND PERFORMANCE
QUARTERLY RETURN 3 MO 1 YR 3 YR 5 YR 10 YR
CUIT Value Equity A -2.01 10.96 7.87 11.07 8.17
CUIT Value Equity B -1.92 11.36 8.25 11.46 8.55
Russell 1000 Value Index -2.83 6.95 7.88 10.78 7.78
CALENDAR YEAR RETURN 2017 2016 2015 2014 2013
CUIT Value Equity A 16.53 13.98 -3.58 9.57 38.32
CUIT Value Equity B 16.96 14.41 -3.26 9.97 38.80
Russell 1000 Value Index 13.66 17.34 -3.83 13.45 32.53
3 MO 1 YR 3 YR 5 YR 10 YR

Christian Brothers Investment Services, Inc. n [email protected] PAGE 27Christian Brothers Investment Services, Inc. n [email protected] PAGE 2
CUIT Value Equity Fund
All attribution is based on gross portfolio performance.
Active Weights
6.3%
-4.6%
-0.9%
-2.9%
-0.6%
2.0%
6.5%
-0.4% -0.9%
-3.5
1.5%
-2.6%
Consumer Discretionary
InformationTechnology
Materials
Cash
Real EstateConsumer
Staples Energy
Financials
Healthcare IndustrialsTelecomm
Service Utilities
MARKET SECTOR ANALYSIS %
Consumer Discretionary
Consumer Staples Energy Financials Healthcare Industrials
Information Technology Materials Real Estate
TelecommService Utilities Cash
Fund 13.1 3.5 9.8 29.1 10.7 7.6 15.8 2.5 2.0 2.0 2.4 1.5
Benchmark 6.8 8.1 10.7 27.1 13.6 8.2 9.3 2.9 4.6 2.9 5.9 0.0

Christian Brothers Investment Services, Inc. n [email protected] PAGE 28Christian Brothers Investment Services, Inc. n [email protected] PAGE 3 | CB -FFS-000-0000
Important InformationBenchmark Index: Russell 1000 Value Index. Performance for periods of one year and longer are annualized. All Fund performance is reported net of any fees and expenses, but inclusive of dividends and interest. Past performance is not indicative of future performance. The return and principal value of the Fund will fluctuate, and upon redemption, shares in the Fund may be worth less than their original cost. The comparative indices represent unmanaged or average returns on various financial assets which can be compared to the Fund’s total returns for the purpose of measuring relative performance, but are not necessarily intended to parallel the risk or investment approach of your investments. The indices do not incur taxes or expenses but are inclusive of dividends and interest. Comparative index information is provided by BNY Mellon Bank; information regarding composition of the indices may be obtained from our provider or CBIS.
CBIS offers pooled funds on behalf of a not-for-profit investment trust, the Catholic United Investment Trust (CUIT) Offering Memorandum, which contains further information, is available by calling 800-592-8890. Such information should be carefully considered prior to investing in the Fund. Commingled Fund exclusively for tax-exempt Catholic institutions. All assets are invested in accordance with CBIS’ Catholic Responsible Investing Guidelines. Total expense ratio includes management fee and all other fees (accounting, custody and transfer agent). The Funds provide daily NAV and daily liquidity.
CUIT Value Equity Fund
FUND COMMENTARY
3-Month Review ¡ Sector allocation bets, driven primarily by sub-advisor Dodge & Cox, drove most of the Q1 performance differential.
¡ The largest sector impacts were the overweight in information technology (+55 basis points) and underweights in consumer staples and real estate (+36 basis points).
¡ Stock selection results within the Fund were neutral to the benchmark during the quarter as AJO’s gains were offset by Dodge’s deficit in relative terms. AJO also marginally gained from sector weightings.
¡ In aggregate, both sub-advisors outperformed the Russell 1000 Value. Dodge’s outperformance was driven by their sector decisions; AJO’s gains were a result of strong stock selection within sectors, especially in healthcare and real estate.
12-Month Review¡ Both sub-advisors generated returns that were almost identical and outperformed the benchmark over the 12-month period, though they did so in
very different ways.
¡ The total relative performance impact was equally split between sector allocation and stock selection. Dodge’s gain came almost exclusively via the sector weights, while AJO is sector neutral and generates alpha through stock selection within each sector.
¡ For the Fund, sector impacts were positive in all 11 sectors, led by information technology (+99 basis points), consumer staples (+44 basis points), and real estate (+30 basis points) – just as in the most recent quarter.
¡ Positive stock selection results were concentrated in four components: healthcare, staples, industrials, and information technology. The Fund’s healthcare providers and service company holdings generated returns exceeding 17%.
¡ Food and staples retailer holdings returns were 32.7% over the period, adding 64 basis points.
Positioning & Outlook¡ The Fund enters Q2 with its largest overweights in information technology (+6.5% vs. the Index, mostly in software and services) and in consumer
discretionary (+6.3%). Financial stocks comprise 29% of the holdings, +2% versus the Russell 1000 Value.
¡ To compensate for the overages, the Fund’s allocations are underweight in consumer staples (-4.6% vs. the Index, primarily food, tobacco, and household products); healthcare (-2.9%); utilities (-2.5%), and real estate (-2.6%). Other sector differences are modest.
¡ The Fund has 174 securities; its weighted average market cap and the trailing 12-month P/E ratio (15.1 vs. 17.0) are both lower than the Index.
¡ The three largest individual overweights are Microsoft (+2.4%), Charles Schwab (+2.3%) and Capital One Financial (+1.8%). The largest underweights are Berkshire Hathaway (-3.1%), Johnson & Johnson (-2.4%, screened holding), and Intel (-2.0%).

Christian Brothers Investment Services, Inc. n [email protected] PAGE 29
FUND FACTS
PROFILE Q1 2018
Christian Brothers Investment Services, Inc. (800) 592-8890 n [email protected]
CUIT Growth Fund
Objective Long-term capital appreciation
InvestmentsCommon stocks of U.S. companies and the dollar-denominated stocks of foreign companies with market capitalizations above $500 million
StrategyFocus on mid- and large-cap stocks that exhibit sustainable, above- average earnings growth; blends a quantitative manager that seeks to identify key investment risks and capture alpha through dynamic modeling with a bottom-up fundamental manager to deliver a portfolio with balanced growth, valuation, and quality attributes
BenchmarkRussell 1000 Growth Index
Asset ManagersWellington Management (Effective 12/31/04)Los Angeles Capital Management (Effective 4/1/09)
Total Expense Ratio / Minimum Class A: 1.16% / No MinimumClass B: 0.86% / $5M
Fund Features Commingled fund exclusive for tax-exempt Catholic institutions
Daily NAV and daily liquidity
30%25%20%15%10%
5%
0%
CUIT Growth B Russell 1000 Growth Index
RISK METRICSCHARACTERISTICS FUND / 5 YR BENCHMARK / 5 YR
Sharpe Ratio 1.5 1.5
Information Ratio -0.1 N/A
Standard Deviation 10.2 10.5
Tracking Error 1.7 N/A
Upside Capture 96.8 100.0
Downside Capture 95.4 100.0
FUND PERFORMANCE
QUARTERLY RETURN 3 MO 1 YR 3 YR 5 YR 10 YR
CUIT Growth A 1.68 18.31 11.18 13.97 9.65
CUIT Growth B 1.74 18.66 11.52 14.33 9.98
Russell 1000 Growth Index 1.42 21.25 12.90 17.33 11.34
CALENDAR YEAR RETURN 2017 2016 2015 2014 2013
CUIT Growth A 25.38 5.37 5.29 11.65 32.92
CUIT Growth B 25.77 5.69 5.63 12.06 33.31
Russell 1000 Growth Index 30.21 7.08 5.67 13.05 33.49
Please see Important Information on Page 2
3 MO 1 YR 3 YR 5 YR 10 YR
PORTFOLIO ANALYSIS
STATISTICS FUND BENCHMARK
Weighted Median Market Cap $82.0B $98.6B
Price/Book 5.5x 6.3x
Price/Earnings 30.0x 27.0x
Return on Equity 23.5% 25.6%
Dividend Yield 1.1% 1.3%
5-year Earnings Growth 12.6% 13.4%
Beta 1.1 1.0
Active Share 45.8 N/A
10 Largest Holdings 35.9 30.1
# of Equity Securities 256 553
Turnover Rate 65.7 N/A
Fund Size $309.8MM
TOP TEN HOLDINGS
STATISTICS %
Microsoft Corporation 6.4
Apple Inc. 6.2
Alphabet Inc. 5.7
Amazon.com, Inc. 4.7
Facebook, Inc. 3.6
Home Depot, Inc. 2.3
Visa Inc. 2.3
Mastercard Incorporated 2.1
Caterpillar Inc. 1.3
Adobe Systems Incorporated 1.3

Christian Brothers Investment Services, Inc. n [email protected] PAGE 30Christian Brothers Investment Services, Inc. n [email protected] PAGE 2
CUIT Growth Fund
All attribution is based on gross portfolio performance.
Active Weights
-3.8%-4.7%
1.6%2.3%
-2.8%
-1.1% -0.9%-1.6%
11.4%
-1.0%
0.0% 0.4%Consumer Discretionary
InformationTechnology
Materials
Cash
ConsumerStaples
Energy Financials Healthcare
Industrials Real EstateTelecomm
Service
Utilities
MARKET SECTOR ANALYSIS %
Consumer Discretionary
Consumer Staples Energy Financials Healthcare Industrials
Information Technology Materials Real Estate
TelecommService Utilities Cash
Fund 14.8 1.7 2.4 5.8 9.7 11.6 50.1 2.5 0.8 0.0 0.0 0.4
Benchmark 18.6 6.4 0.8 3.5 12.5 12.7 38.7 3.5 2.4 0.9 0.0 0.0

Christian Brothers Investment Services, Inc. n [email protected] PAGE 31Christian Brothers Investment Services, Inc. n [email protected] PAGE 3 | CB -FFS-000-0000
Important InformationBenchmark Index: The Fund’s benchmark was changed to the Russell 1000 Growth Index effective June 1, 2000. For prior periods, the benchmark was the Russell Mid-Cap Growth Index. Performance for periods of one year and longer are annualized. All Fund performance is reported net of any fees and expenses, but inclusive of dividends and interest. Past performance is not indicative of future performance. The return and principal value of the Fund will fluctuate, and upon redemption, shares in the Fund may be worth less than their original cost. The comparative index represents unmanaged or average returns on various financial assets which can be compared to the Fund’s total returns for the purpose of measuring relative performance, but is not necessarily intended to parallel the risk or investment approach of your investments. The index does not incur taxes or expenses but is inclusive of dividends and interest. Comparative index information is provided by BNY Mellon Bank; information regarding composition of the index may be obtained from our provider or CBIS.
CBIS offers pooled funds on behalf of a not-for-profit investment trust, the Catholic United Investment Trust (CUIT) Offering Memorandum, which contains further information, is available by calling 800-592-8890. Such information should be carefully considered prior to investing in the Fund. Commingled Fund exclusively for tax-exempt Catholic institutions. All assets are invested in accordance with CBIS’ Catholic Responsible Investing Guidelines. Total expense ratio includes management fee and all other fees (accounting, custody and transfer agent). The Funds provide daily NAV and daily liquidity.
CUIT Growth Fund
FUND COMMENTARY
3-Month Review ¡ The Fund’s outperformance in Q1 was primarily due to its overweight in the information technology sector (+19 basis points) and underweight in
consumer staples (+31 basis points).
¡ The performance impacts of other sector imbalances were relatively small and offset one another.
¡ The composite impact of stock selection within sectors was also small but positive. Sub-advisor Wellington did particularly well in information technology (+66 basis points), holding software and services stocks that outperformed the overall market.
¡ The underweight in pharmaceuticals was beneficial, but the positive results among biotech holdings were even larger.
¡ On the downside, the lack of aerospace and defense companies and overweight in construction machinery detracted.
12-Month Review
¡ Wellington managed to stay ahead of the index, but the shortfall from LA Capital’s stock selection models dominated the net returns.
¡ The three strongest sectors in the market – information technology, industrials, and financials – each registered gains exceeding 25% over the past 12 months for an average return of 28.3%. The Fund’s average return in those sectors was 24.7%. This differential explains more than 200 basis points of negative relative performance for the 12-month period.
¡ After performing very well in 2016 and previously, LA Capital’s quantitative models had difficulty adapting to several shifts in market sentiment in 2017 and Q1 2018, particularly in the growth versus valuation factors.
Positioning & Outlook
¡ The CUIT Growth Fund has 256 securities with a weighted average market cap above $240 billion, slightly higher than the benchmark’s market cap.
¡ The Fund has 50.1% of its holdings in the information technology sector, compared to 38.7% for the Russell 1000 Growth index. Secondary overweights remain in financials (+2.3%) and energy (+1.6%).
¡ To compensate, the underweights are largest in consumer staples (-4.7%), consumer discretionary (-3.6%), and healthcare (-2.8%).
¡ Both sub-advisors expect to add value primarily through specific stock selection analytics and research, though they do so in different ways. We expect relative performance to improve when evaluated over a complete market cycle.
¡ Largest active positions are Cummins (+1.1%), Microsoft (+1.1%), and Alphabet (+0.9%). Largest under-weights were United Health Group (-1.6%), Boeing (-1.4%), and AbbVie (-1.2%), all screened holdings.

Christian Brothers Investment Services, Inc. n [email protected] PAGE 32
FUND FACTS
PROFILE Q1 2018
Christian Brothers Investment Services, Inc. (800) 592-8890 n [email protected]
CUIT Small Cap Equity Index Fund
Objective Long-term capital appreciation by attempting to replicate the performance of the S&P SmallCap 600, a commonly used index of domestic small-capitaliza-tion stocks
InvestmentsCommon stocks of companies that generally comprise the S&P SmallCap 600
StrategyClosely track the benchmark Index, while seeking replacements for screened stocks among companies with similar market capitalizations in the same or a related industry
BenchmarkS&P SmallCap 600 Index
Asset ManagersRhumbLine Advisers (Effective 1/07)
Total Expense Ratio / Minimum Class A: 0.56% / No MinimumClass B: 0.26% / $3M
Fund Features Commingled fund exclusive for tax-exempt Catholic institutions
Daily NAV and daily liquidity
20%
15%
10%
5%
0%
CUIT Small Cap B S&P SmallCap 600 Index
RISK METRICSCHARACTERISTICS FUND / 5 YR BENCHMARK / 5 YR
Sharpe Ratio 0.8 1.0
Information Ratio 0.6 N/A
Standard Deviation 13.8 13.4
Tracking Error 0.2 N/A
Upside Capture 99.7 100.0
Downside Capture 99.1 100.0
FUND PERFORMANCE
QUARTERLY RETURN 3 MO 1 YR 3 YR 5 YR 10 YR
CUIT Small Cap Equity Index A 0.56 12.62 8.27 11.18 9.47
CUIT Small Cap Equity Index B 0.63 12.97 8.58 11.50 9.79
S&P SmallCap 600 Index 0.57 13.09 8.80 11.72 9.97
CALENDAR YEAR RETURN 2017 2016 2015 2014 2013
CUIT Small Cap Equity Index A 14.43 20.60 -4.75 4.46 38.05
CUIT Small Cap Equity Index B 14.81 20.97 -4.53 4.81 38.38
S&P SmallCap 600 Index 15.22 21.31 -4.41 4.90 38.82
The Fund’s benchmark was changed to the S&P SmallCap 600 Index effective November 1, 2017. For periods prior to November 1, 2017, the benchmark was the Russell 2000 Index. Please see Important Information on Page 2.
3 MO 1 YR 3 YR 5 YR 10 YR
PORTFOLIO ANALYSIS
STATISTICS FUND BENCHMARK
Weighted Median Market Cap $1.7B $1.8B
Price/Book 2.1x 2.2x
Price/Earnings 21.5x 21.8x
Return on Equity 10.2% 10.2%
Dividend Yield 1.4% 1.3%
5-year Earnings Growth 8.2% 8.2%
Beta 1.0 1.0
Active Share 5.6 0
10 Largest Holdings 5.1% 5.1%
# of Equity Securities 602 604
Turnover Rate 89.3 N/A
Fund Size $353.2MM
TOP TEN HOLDINGS
STATISTICS %
Chemed Corporation 0.6
Five Below, Inc. 0.5
ASGN Inc 0.5
Lumentum Holdings, Inc. 0.5
Haemonetics Corporation 0.5
FirstCash, Inc. 0.5
CACI International Inc 0.5
John Bean Technologies Corporation 0.5
Selective Insurance Group, Inc. 0.5
Integra LifeSciences Holdings Corporation 0.5

Christian Brothers Investment Services, Inc. n [email protected] PAGE 33Christian Brothers Investment Services, Inc. n [email protected] PAGE 2
CUIT Small Cap Equity Index Fund
All attribution is based on gross portfolio performance.
MARKET SECTOR ANALYSIS %
Consumer Discretionary
Consumer Staples Energy Financials Healthcare Industrials
Information Technology Materials Real Estate
TelecommService Utilities Cash
Fund 15.0 2.9 3.3 17.0 12.6 19.3 15.5 5.2 5.6 1.0 2.2 0.3
Benchmark 14.6 2.5 3.1 16.8 15.3 19.0 14.7 5.1 5.2 1.0 2.6 0.0
EnergyActive Weights
0.4% 0.4% 0.4% 0.3%
0.8%
0.0%0.2% 0.2%
0.3% 0.1% -0.4%Consumer
Discretionary
InformationTechnology Materials
CashConsumerStaples
FinancialsHealthcare Industrials
TelecommService
Real EstateUtilities
-2.7%

Christian Brothers Investment Services, Inc. n [email protected] PAGE 34Christian Brothers Investment Services, Inc. n [email protected] PAGE 3 | CB -FFS-000-0000
Important InformationBenchmark Index: The Fund’s benchmark was changed to the S&P SmallCap 600 Index effective November 1, 2017. For periods prior to November 1, 2017, the benchmark was the Russell 2000 Index. Performance for periods of one year and longer are annualized. Performance for periods of one year and longer are annualized. All Fund performance is reported net of any fees and expenses, but inclusive of dividends and interest. Past performance is not indicative of future performance. The return and principal value of the Fund will fluctuate, and upon redemption, shares in the Fund may be worth less than their original cost. The comparative index represents unmanaged or average returns on various financial assets which can be compared to the Fund’s total returns for the purpose of measuring relative performance, but is not necessarily intended to parallel the risk or investment approach of your investments. The index does not incur taxes or expenses but is inclusive of dividends and interest. Comparative index information is provided by BNY Mellon Bank; information regarding composition of the index may be obtained from our provider or CBIS.
The S&P SmallCap 600 Index is a product of S&P Dow Jones Indices LLC or its affiliates ("SPDJI"), and has been licensed for use by CBIS. Standard & Poor's® and S&P® are registered trademarks of Standard & Poor's Financial Services LLC ("S&P"); Dow Jones® is a registered trademark of Dow Jones Trademark Holdings LLC ("Dow Jones"); and these trademarks have been licensed for use by SPDJI and sublicensed for certain purposes by CBIS. The CUIT Small Capitalization Equity Index Fund is not sponsored, endorsed, sold or promoted by SPDJI, Dow Jones, S&P, or their respective affiliates and none of such parties make any representation regarding the advisability of investing in such product(s) nor do they have any liability for any errors, omissions, or interruptions of the S&P SmallCap 600 Index.
CBIS offers pooled funds on behalf of a not-for-profit investment trust, the Catholic United Investment Trust (CUIT) Offering Memorandum, which contains further information, is available by calling 800-592-8890. Such information should be carefully considered prior to investing in the Fund. Commingled Fund exclusively for tax-exempt Catholic institutions. All assets are invested in accordance with CBIS’ Catholic Responsible Investing Guidelines. Total expense ratio includes management fee and all other fees (accounting, custody and transfer agent). The Funds provide daily NAV and daily liquidity.
CUIT Small Cap Equity Index Fund
FUND COMMENTARY
3-Month Review ¡ The large number of Fund holdings and small weight of restrictions (under 2% of Index weight) generally result in little performance impact from
screens; this was the case again in Q1.
¡ While the overall market in the S&P SmallCap 600 universe was mostly flat for the quarter, the disparity among sectors was unusually large. Healthcare returns averaged +14% in Q1; financials, information technology, consumer discretionary and Industrial stock returns were close to zero; utilities, consumer staples, real estate and energy stocks ranged between -5% and -10%.
¡ U.S. small cap stocks outperformed large cap in Q1 but remain slightly behind on a trailing 1-year basis. Over the 3- and 5-year periods, large cap returns are still 150-200 basis points ahead of small cap on an annualized basis.
12-Month Review
¡ The impact on performance from Catholic Responsible InvestingSM screens within the Fund was minimal over the 12-month period.
¡ Healthcare returns were also very robust among small cap companies over the trailing 1-year period, averaging 41% within the linked benchmark index.
¡ Industrials gained 18%; consumer discretionary stocks increased nearly 14%; and financials were up 12%.
¡ Consumer staples and real estate stocks declined by roughly 5%, and energy companies lost 19% of their market values on average over the past 12 months.
Positioning & Outlook
¡ The Fund screens select pharmaceutical, aerospace ans defense, and tobacco benchmark constituents. A few companies in other industries are also restricted due to CBIS’ Catholic Responsible InvestingSM criteria.
¡ Screened companies represent less than 2% of the S&P SmallCap 600 Index by market cap.
¡ The sub-advisor constructs the portfolio using an optimization process that aligns the portfolio’s factor exposures as closely as possible with those of its benchmark. In so doing it seeks to minimize tracking error, while also constraining trading costs. Due in part to the small weight of screened names, this creates very close to a fully replicated portfolio.
¡ Generally speaking, the Fund owns most Index constituents at their index weight, along with a subset of the very smallest constituents to help round up the Fund’s industry weights at or very close to their Index weights.
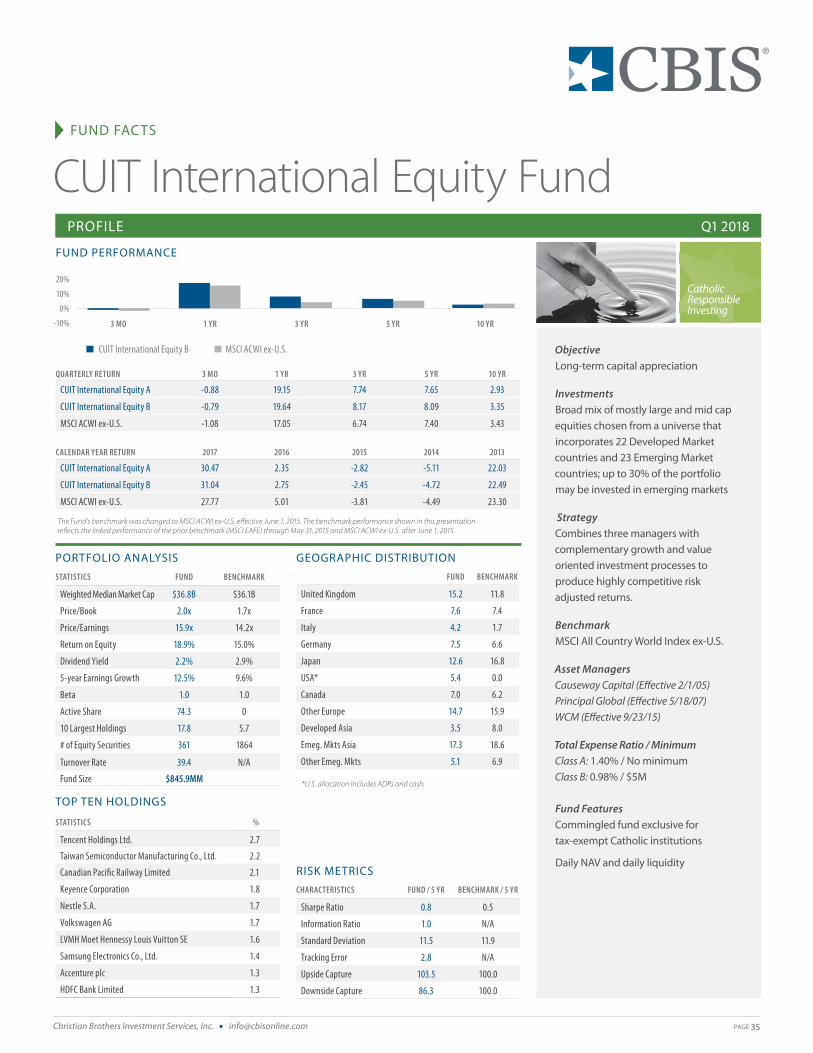
Christian Brothers Investment Services, Inc. n [email protected] PAGE 35
FUND FACTS
PROFILE Q1 2018
Christian Brothers Investment Services, Inc. (800) 592-8890 n [email protected]
CUIT International Equity Fund
Objective Long-term capital appreciation
InvestmentsBroad mix of mostly large and mid cap equities chosen from a universe that incorporates 22 Developed Market countries and 23 Emerging Market countries; up to 30% of the portfolio may be invested in emerging markets
Strategy Combines three managers with complementary growth and value oriented investment processes to produce highly competitive risk adjusted returns.
BenchmarkMSCI All Country World Index ex-U.S.
Asset ManagersCauseway Capital (Effective 2/1/05) Principal Global (Effective 5/18/07)WCM (Effective 9/23/15)
Total Expense Ratio / Minimum Class A: 1.40% / No minimumClass B: 0.98% / $5M
Fund Features Commingled fund exclusive for tax-exempt Catholic institutions
Daily NAV and daily liquidity
QUARTERLY RETURN 3 MO 1 YR 3 YR 5 YR 10 YR
CUIT International Equity A -0.88 19.15 7.74 7.65 2.93
CUIT International Equity B -0.79 19.64 8.17 8.09 3.35
MSCI ACWI ex-U.S. -1.08 17.05 6.74 7.40 3.43
CALENDAR YEAR RETURN 2017 2016 2015 2014 2013
CUIT International Equity A 30.47 2.35 -2.82 -5.11 22.03
CUIT International Equity B 31.04 2.75 -2.45 -4.72 22.49
MSCI ACWI ex-U.S. 27.77 5.01 -3.81 -4.49 23.30
The Fund’s benchmark was changed to MSCI ACWI ex-U.S. effective June 1, 2015. The benchmark performance shown in this presentation reflects the linked performance of the prior benchmark (MSCI EAFE) through May 31, 2015 and MSCI ACWI ex-U.S. after June 1, 2015.
RISK METRICSCHARACTERISTICS FUND / 5 YR BENCHMARK / 5 YR
Sharpe Ratio 0.8 0.5
Information Ratio 1.0 N/A
Standard Deviation 11.5 11.9
Tracking Error 2.8 N/A
Upside Capture 103.5 100.0
Downside Capture 86.3 100.0
GEOGRAPHIC DISTRIBUTIONFUND BENCHMARK
United Kingdom 15.2 11.8
France 7.6 7.4
Italy 4.2 1.7
Germany 7.5 6.6
Japan 12.6 16.8
USA* 5.4 0.0
Canada 7.0 6.2
Other Europe 14.7 15.9
Developed Asia 3.5 8.0
Emeg. Mkts Asia 17.3 18.6
Other Emeg. Mkts 5.1 6.9
20%
10%
0%
-10%
CUIT International Equity B MSCI ACWI ex-U.S.
FUND PERFORMANCE
3 MO 1 YR 3 YR 5 YR 10 YR
PORTFOLIO ANALYSIS
STATISTICS FUND BENCHMARK
Weighted Median Market Cap $36.8B $36.1B
Price/Book 2.0x 1.7x
Price/Earnings 15.9x 14.2x
Return on Equity 18.9% 15.0%
Dividend Yield 2.2% 2.9%
5-year Earnings Growth 12.5% 9.6%
Beta 1.0 1.0
Active Share 74.3 0
10 Largest Holdings 17.8 5.7
# of Equity Securities 361 1864
Turnover Rate 39.4 N/A
Fund Size $845.9MM
TOP TEN HOLDINGS
STATISTICS %
Tencent Holdings Ltd. 2.7
Taiwan Semiconductor Manufacturing Co., Ltd. 2.2
Canadian Pacific Railway Limited 2.1
Keyence Corporation 1.8
Nestle S.A. 1.7
Volkswagen AG 1.7
LVMH Moet Hennessy Louis Vuitton SE 1.6
Samsung Electronics Co., Ltd. 1.4
Accenture plc 1.3
HDFC Bank Limited 1.3
*U.S. allocation includes ADRs and cash.

Christian Brothers Investment Services, Inc. n [email protected] PAGE 36Christian Brothers Investment Services, Inc. n [email protected] PAGE 2
CUIT International Equity Fund
MARKET SECTOR ANALYSIS %
Consumer Discretionary
Consumer Staples Energy Financials Healthcare Industrials
Information Technology Materials Real Estate
TelecommService Utilities Cash
Fund 14.0 9.2 5.6 17.3 5.2 15.5 16.5 8.4 0.9 2.7 1.5 3.1
Benchmark 11.4 9.5 6.7 23.1 7.7 11.8 11.8 8.0 3.2 3.9 3.0 0.0
All attribution is based on gross portfolio performance.
Active Weights
2.6%
-0.3%
0.4%
-1.1%
-5.8%
-2.5%
3.7%4.7%
-2.3%
-1.2% -1.5%
3.1%
Consumer Discretionary
InformationTechnology
Materials Cash
ConsumerStaples Energy Financials Healthcare
Industrials
Real EstateTelecomm
Service Utilities

Christian Brothers Investment Services, Inc. n [email protected] PAGE 37Christian Brothers Investment Services, Inc. n [email protected] PAGE 3 | CB -FFS-000-0000
CUIT International Equity Fund
Important InformationBenchmark Index: The Fund’s benchmark was changed to MSCI All Country World Index (ACWI) ex-U.S. effective June 1, 2015. For periods prior to June 1, 2015, the applicable benchmark was the Morgan Stanley Capital International Europe, Australia and the Far East Index (“EAFE”). Performance for periods of one year and longer are annualized. All Fund performance is reported net of any fees and expenses, but inclusive of dividends and interest. Past performance is not indicative of future performance. The return and principal value of the Fund will fluctuate, and upon redemption, shares in the Fund may be worth less than their original cost. The comparative index represents unmanaged or average returns on various financial assets which can be compared to the Fund’s total returns for the purpose of measuring relative performance, but is not necessarily intended to parallel the risk or investment approach of your investments. The index does not incur taxes or expenses but is inclusive of dividends and interest. Comparative index information is provided by BNY Mellon Bank; information regarding composition of the index may be obtained from our provider or CBIS.
Total Estimated Expense Ratio for Class B reflects the partial waiver of the Investment Management Fee so total expenses do not exceed 99 bps.
CBIS offers pooled funds on behalf of a not-for-profit investment trust, the Catholic United Investment Trust (CUIT) Offering Memorandum, which contains further information, is available by calling 800-592-8890. Such information should be carefully considered prior to investing in the Fund. Commingled Fund exclusively for tax-exempt Catholic institutions. All assets are invested in accordance with CBIS’ Catholic Responsible Investing Guidelines. Total expense ratio includes management fee and all other fees (accounting, custody and transfer agent). The Funds provide daily NAV and daily liquidity.
FUND COMMENTARY
3-Month Review ¡ Although small in magnitude, value was added through both sector weightings and stock selection in the quarter. The two growth-oriented
sub-advisors finished ahead of the benchmark; the value-focused manager trailed by 1.1%.
¡ The Fund’s largest sector overweight in information technology was beneficial (+~20 basis points) in relative terms, as the sector’s average returns of 1.90% were once again the best performing in the index. The other sector imbalances had minimal impact on relative return.
¡ Collectively, stock selection results for the sub-advisors were most productive in financials (led by diversified bank and multi-line insurance company holdings), healthcare, and information technology – for a total of approximately 70 basis points in added value.
¡ The only significant weakness was noted in food and beverage companies within consumer staples (-35 basis points in aggregate).
12-Month Review
¡ Outperformance for the 12-month period was driven by stock selection (75%) and by sector weighting differences versus the benchmark (25%).
¡ The Fund maintained an average 5% overweight in information technology stocks. Holdings gained 43.2% in the Fund and 34.6% in the Index. These allocation and selection decisions accounted for nearly half of the excess return.
¡ Small additional gains were realized through underweights in telecom, utilities, financials, and healthcare (+32 basis points combined), offsetting a portion of the performance drag from holding transactional cash in a strong up market.
¡ Stock selection results were strong in healthcare (avoiding poor performing pharma companies) and in financials (particularly bank stocks). Restricting tobacco stocks added roughly 35 basis points; but defense restrictions detracted marginally.
Positioning & Outlook
¡ The Fund’s holdings are 78% in developed countries and 22% in emerging markets. Relative to the index, the Fund is about 2% underweight in emerging markets.
¡ Within developed countries, the Fund is roughly 4% overweight in Europe (especially UK, Germany and Italy) and underweight in Japan (largest underweight) and other Asian countries.
¡ The Fund’s 361 holdings indicate a slight bias toward growth over value with a higher than market P/E ratio (15.9 vs 14.2). The weighted-average market cap is very close to the benchmark Index. The 5-year earnings growth rate is higher than market and the dividend yield is lower than average.
¡ Sector allocations remain similar to recent positioning with a significant underweight to financials (-5.8%) and smaller underweights in energy, healthcare, telecom, utilities, and real estate. The significant overweights are in information technology (+4.7%), industrials (+3.7%), and consumer discretionary (+2.6%).

Christian Brothers Investment Services, Inc. n [email protected] PAGE 38
CBIS’ offers a disciplined and comprehensive approach to Catholic Responsible InvestingSM
} CBIS pioneered Catholic Responsible Investingsm (CRI)and has more than 30 years of experience applying Catholic ethical and social teaching to the investing process.
} While socially responsible investing is often equated with stock screens, a truly effective Catholic Responsible InvestingSM program requires that we also act as responsible owners of companies to bring about a more just society. Our approach to Catholic socially responsible investing emphasizes direct engagement with companies to help improve their policies and practices.
} Catholic Responsible InvestingSM enables Catholic institutions to align their investments with their beliefs and effect real change in corporate activities with respect to human rights, the environment, and corporate governance.
} As an institutional investment firm, we believe that by encouraging strong corporate environmental, social and governance policies, we are helping support long-term performance and the potential growth of shareholder value.
TEL: 800-592-8890 EMAIL: [email protected]
PO Box 9683 Providence, RI 02940-9683
U.S. TEL: 800-321-7194 U.S. FAX: 844-261-6489
NON-U.S. TEL: 508-871-9942 NON-U.S. FAX: 508-599-4183
Via Aurelia, 476 CP 9099 00165 ROMA-ITALIA
TEL: (39) 06 66 01 72 18 FAX: (39) 06 663 88 21
CHICAGO, IL 20 North Wacker Drive, Suite 2000 Chicago, IL 60606-3002
TEL: 877-550-2247 312-803-6440 FAX: 312-803-6441
NEW YORK, NY 777 Third Avenue, 29th Floor, New York NY 10017-1401
TEL: 800-592-8890 212-490-0800 FAX: 212-490-6092
SAN FRANCISCO, CA One Embarcadero Center, Suite 500 San Francisco, CA 94111
TEL: 800-754-8177 415-623-2080 FAX: 415-623-2070
CBIS REGIONAL OFFICES
CBIS REGIONAL TEAMS
TO LEARN MORE ABOUT CBIS CBIS ACCOUNT SERVICES CBIS GLOBAL ROME SERVICE CENTRE
Investment Portfolio Review 1Q 2018
CENTRAL
Daniel T. Hynes Managing Director – Relationship Management DIRECT: (312) 803-4722 EMAIL: [email protected]
Michael A. Nagy Managing Director – Investor and Consultant Relations DIRECT: (312) 803-4732 EMAIL: [email protected]
Thomas R. Kelly, CFA® Director – Investment Concierge DIRECT: (312) 803-4710 EMAIL: [email protected]
EAST
Mark F. Degenhart, Sr. Managing Director – Relationship Management DIRECT: (212) 503-1934 EMAIL: [email protected]
Sean P. McCaffrey, CAIA Managing Director – Investor & Consultant Relations DIRECT: (212) 503-1913 EMAIL: [email protected]
Jelena Milinkovic, CFA® Managing Director – Investment Concierge DIRECT: (212) 503-1970 EMAIL: [email protected]
WEST
Thomas D. Matty Managing Director - Relationship Management DIRECT: (415) 315-1594 EMAIL: [email protected]
David A. Schwarzenberger, CFA® Managing Director – Investor & Consultant Relations DIRECT: (415) 623-2089 EMAIL: [email protected]
Elizabeth J. Vella Director – Investment Concierge DIRECT: (415) 623-2083 EMAIL: [email protected]
Christian Brothers Investment Services, Inc. n [email protected] PAGE 39
Investment Portfolio Review 1Q 2018
Important Disclosures+ The CUIT Money Market Fund changed its investment approach from overnight repurchase agreements, to actively managed effective 8/1/01. ± Effective April 1, 2017, the benchmark for the CUIT Money Market Fund was changed to the Bloomberg Barclays U.S. Short Treasury Bills (1-3 Month) Index. For periods prior to April 1, 2017, the applicable benchmark was the Merrill Lynch 91-Day Treasury Bill Index. ** Effective July 1, 2016, the benchmark for the CUIT Short Bond Fund (SBF) was changed to the Bloomberg Barclays 1-3 Year Treasury Index. For periods prior to July 1, 2016, the applicable benchmarks were: ML 1-3 Yr Treasury Index effective 7/1/01; ML 1-5 Yr G/C Index effective 4/1/98; 50% LB Intermediate Government /50% LB 1-3 Yr Government effective 5/1/96; LB 1-3 Yr Government in prior periods. The benchmark performance shown for SBF in this presentation reflects the linked performance of these benchmarks for each applicable period. *** Effective January 2, 2003, the benchmark for the CUIT Balanced Fund was changed to 60% S&P 500/40% Bloomberg Barclays Aggregate. For prior periods, the applicable benchmark was 60% S&P 500/30% LB Aggregate/10% T Bill. **** Effective June 1, 2000, the benchmark was changed to the Russell 1000 Growth Index; prior to this date, historical returns reflect Russell Mid-Cap Growth Index. ‡ Effective June 1, 2015, the benchmark for the International Fund was changed to the Morgan Stanley Capital International All Country World ex U.S. Index (“ACWI ex U.S.”). For periods prior to June 1, 2015, the applicable benchmark was the Morgan Stanley Capital International Europe, Australia and the Far East Index (“EAFE”). The benchmark performance shown in this presentation reflects the linked performance of the two benchmarks for the respective applicable periods.
All data sourced from FactSet unless otherwise noted. FactSet returns can vary from other sources due to different methodologies. Active share is defined as the sum of the absolute value of the differences between the weights of the securities in a portfolio and the weights of securities in the fund’s benchmark, divided by two.
The CUIT Money Market Fund is not guaranteed by the U.S. Government and there can be no assurance that a stable net asset value of $1.00 can be maintained.
The comparative indices represent unmanaged or average returns on various financial assets which can be compared to the Funds’ total returns for the purpose of measuring relative performance, but are not necessarily intended to parallel the risk or investment approach of your investments. The indices do not incur taxes or expenses but are inclusive of dividends and interest. Comparative index information is provided by certain third parties; information regarding composition of indexes may be obtained from provider or CBIS.
The CUIT Funds are exempt from registration with the Securities and Exchange Commission and therefore are exempt from certain regulatory requirements applicable to registered mutual funds. Performance for periods of one year and longer are annualized. All Fund performance, except where otherwise noted, is reported net of any fees and expenses, but inclusive of dividends and interest. The return and principal value of the Funds will fluctuate and, upon redemption, shares in the Funds may be worth less than their original cost. Past performance is not indicative of future performance.
CBIS offers pooled funds on behalf of a not-for-profit investment trust, Catholic United Investment Trust (CUIT). Offering Memoranda / Disclosure Statements, which contain further information regarding each of the Funds, including certain restrictions regarding redemptions, are available by calling 800-592-8890. Such information should be carefully considered prior to investing in the Funds. Shares in the CUIT Funds are offered exclusively through CBIS Financial Services, Inc., a broker-dealer subsidiary of CBIS.
The S&P 500 Index and S&P SmallCap 600 Index are products of S&P Dow Jones Indices LLC or its affiliates (“SPDJI”), and have been licensed for use by CBIS. Standard & Poor’s®, S&P®, S&P 500® and S&P SmallCap 600® are registered trademarks of Standard & Poor’s Financial Services LLC (“S&P”) and Dow Jones® is a registered trademark of Dow Jones Trademark Holdings LLC (“Dow Jones”). The trademarks have been licensed to SPDJI and have been sublicensed for use for certain purposes by CBIS. The CUIT Core Equity Fund and the CUIT Small Cap Equity Index Fund are not sponsored, endorsed, sold or promoted by SPDJI, Dow Jones, S&P, or any of their respective affiliates (collectively, “S&P Dow Jones Indices”). S&P Dow Jones Indices does not make any representation or warranty, express or implied, to the owners of the CUIT Core Equity Fund, the CUIT Small Cap Equity Index Fund, or any member of the public regarding the advisability of investing in securities generally or in the CUIT Core Equity Fund or the CUIT Small Cap Equity Index Fund particularly or the ability of the S&P 500 Index and S&P SmallCap 600 Index to track general market performance. S&P Dow Jones Indices’ only relationship to CBIS with respect to the S&P 500 Index and the S&P SmallCap 600 Index is the licensing of the Indices and certain trademarks, service marks and/or trade names of S&P Dow Jones Indices and/or its licensors. The S&P 500 Index and the S&P SmallCap 600 Index are determined, composed and calculated by S&P Dow Jones Indices without regard to CBIS, the CUIT Core Equity Fund, or the CUIT Small Cap Equity Index Fund. S&P Dow Jones Indices has no obligation to take the needs of CBIS, the owners of the CUIT Core Equity Fund, or the owners of the CUIT Small Cap Equity Index Fund into consideration in determining, composing or calculating the S&P 500 Index and the S&P SmallCap 600 Index. S&P Dow Jones Indices is not responsible for and has not participated in the determination of the prices, and amount of the CUIT Core Equity Fund and the CUIT Small Cap Equity Index Fund or the timing of the issuance or sale of the CUIT Core Equity Fund and the CUIT Small Cap Equity Index Fund or in the determination or calculation of the equation by which the CUIT Core Equity Fund and the CUIT Small Cap Equity Index Fund are to be converted into cash, surrendered or redeemed, as the case may be. S&P Dow Jones Indices has no obligation or liability in connection with the administration, marketing or trading of the CUIT Core Equity Fund or the CUIT Small Cap Equity Index Fund. There is no assurance that investment products based on the S&P 500 Index and the S&P SmallCap 600 Index will accurately track index performance or provide positive investment returns. S&P Dow Jones Indices LLC is not an investment advisor. Inclusion of a security within an index is not a recommendation by S&P Dow Jones Indices to buy, sell, or hold such security, nor is it considered to be investment advice.
S&P DOW JONES INDICES DOES NOT GUARANTEE THE ADEQUACY, ACCURACY, TIMELINESS AND/OR THE COMPLETENESS OF THE S&P 500 INDEX AND THE S&P SMALLCAP 600 INDEX OR ANY DATA RELATED THERETO OR ANY COMMUNICATION, INCLUDING BUT NOT LIMITED TO, ORAL OR WRITTEN COMMUNICATION (INCLUDING ELECTRONIC COMMUNICATIONS) WITH RESPECT THERETO. S&P DOW JONES INDICES SHALL NOT BE SUBJECT TO ANY DAMAGES OR LIABILITY FOR ANY ERRORS, OMISSIONS, OR DELAYS THEREIN. S&P DOW JONES INDICES MAKES NO EXPRESS OR IMPLIED WARRANTIES, AND EXPRESSLY DISCLAIMS ALL WARRANTIES, OF MERCHANTABILITY OR FITNESS FOR A PARTICULAR PURPOSE OR USE OR AS TO RESULTS TO BE OBTAINED BY CBIS, OWNERS OF THE CUIT CORE EQUITY FUND AND THE CUIT SMALL CAP EQUITY INDEX FUND OR ANY OTHER PERSON OR ENTITY FROM THE USE OF THE S&P 500 INDEX AND THE S&P SMALLCAP 600 INDEX OR WITH RESPECT TO ANY DATA RELATED THERETO. WITHOUT LIMITING ANY OF THE FOREGOING, IN NO EVENT WHATSOEVER SHALL S&P DOW JONES INDICES BE LIABLE FOR ANY INDIRECT, SPECIAL, INCIDENTAL, PUNITIVE, OR CONSEQUENTIAL DAMAGES INCLUDING BUT NOT LIMITED TO, LOSS OF PROFITS, TRADING LOSSES, LOST TIME OR GOODWILL, EVEN IF THEY HAVE BEEN ADVISED OF THE POSSIBILITY OF SUCH DAMAGES, WHETHER IN CONTRACT, TORT, STRICT LIABILITY, OR OTHERWISE. THERE ARE NO THIRD PARTY BENEFICIARIES OF ANY AGREEMENTS OR ARRANGEMENTS BETWEEN S&P DOW JONES INDICES AND CBIS, OTHER THAN THE LICENSORS OF S&P DOW JONES INDICES.
Bloomberg Index Services Limited: BLOOMBERG® is a trademark and service mark of Bloomberg Finance L.P. and its affiliates (collectively “Bloomberg”). BARCLAYS® is a trademark and service mark of Barclays Bank Plc (collectively with its affiliates, “Barclays”), used under license. Bloomberg or Bloomberg’s licensors, including Barclays, own all proprietary rights in the Bloomberg Barclays Indices. Neither Bloomberg nor Barclays approves or endorses this material, or guarantees the accuracy or completeness of any information herein, or makes any warranty, express or implied, as to the results to be obtained therefrom and, to the maximum extent allowed by law, neither shall have any liability or responsibility for injury or damages arising in connection therewith.