growth and diversity population the soviet union
TRANSCRIPT
155
Growth and Diversity of thePopulation of the Soviet Union
By BARBARA A. ANDERSON and BRIAN D. SILVER
Barbara A. Anderson is professor of sociology at the University of Michigan and researchscientist and associate director for training at the university’s Population Studies Center. She holdsa Ph.D. in sociology from Princeton University. She is the author of Internal Migration andModernization in Late Nineteenth-Century Russia and coauthor of Human Fertility in Russia.
Brian D. Silver is professor and chairperson of the Department of Political Science at MichiganState University and a research affiliate of the Population Studies Center of the University ofMichigan. He earned his Ph.D. from the University of Wisconsin. He is coeditor of Soviet AsianEthnic Frontiers.
ABSTRACT: The most remarkable feature of the Soviet Union’s demographyis its ethnic diversity. More than 90 ethnic groups are indigenous to the territoryof the Soviet Union. Ethnic Russians composed only 50.8 percent of thepopulation according to preliminary 1989 census results. The article examinesofficial Soviet statistics for the period 1959 to 1989 to illustrate some of the risksin describing Soviet demographic behavior. Is fertility in the Soviet Union highor low? Answer: both. Is the Soviet population growing rapidly or slowly?Answer: both. The changing ethnic composition of the population of the USSRas a whole reflects large differences in growth rates of ethnic groups; thechanging composition of the USSR by region also reflects differences in
migration by ethnic group. Differences in growth rates are reshaping the ethniccomposition of the Soviet labor force. For the USSR as a whole between 1979and 1989, three-fourths of the net increment to the working ages was contributedby the one-sixth of the population in 1979 that was traditionally Muslim inreligion.
NOTE: The authors share equal responsibility for this article. The research was supported by NICHD grantnos. ROl HD-19915 and P30 HD-10003.

156
THE Soviet Union has the third-largest-L population of any country in the
world. The 1989 census counted 286.7 mil-
lion people.’ Developments in the Sovietpopulation have been of great interest be-cause of its size and because of the impor-tance of the Soviet Union in world affairs.In addition, reports of unfavorable demo-graphic features of the Soviet population,such as high rates of infant mortality andadult mortality, have been cited within thecountry and abroad as evidence of the lowquality of life in the Soviet Union com-pared to other industrial countries. The in-fant mortality rate, for example, was 25.4infant deaths per 1000 live births in 1987;life expectancy at birth for Soviet maleswas 65.0 years and for females, 73.8 years,in 1986-87.’
Perhaps the most remarkable feature ofthe Soviet Union’s demography is not itssize or the state of its public health but itsethnic diversity. Members of more thanninety ethnic groups that are indigenous tothe territory of the Soviet Union werecounted in the 1989 census. Twenty-twoethnic groups-&dquo;nationalities,&dquo; in com-mon Soviet usage-had populations of 1million or more. Ethnic Russians com-
posed 50.8 percent of the population in1989 and they will fall below 50 percent ofthe Soviet population before the middle ofthe 1990s.~ In addition to 145 million eth-nic Russians in 1989, the Soviet populationhad 56 million members of other Slavic
nationalities, 56 million members of na-tionalities whose traditional religion is
Islam, and another 29 million people whoare neither Slavs nor Muslims. Moreover,the Muslim population is growing rapidly.Though comprising only one-sixth of thepopulation of the USSR in 1979, Muslimscontributed 50 percent of the increase inthe Soviet population between 1979 and1989.
It should be difficult for observers of theSoviet Union today to ignore the multi-ethnic character of that country, as thenon-Russian nationalities seek greatereconomic, cultural, and political auton-omy, sometimes manifesting their feel-ings in large-scale public demonstrations.There have been many reported inci-dents of violence between ethnic groups-not only, as might be commonly supposed,
1. This is the total of the de facto or present (inRussian, nalichnoe) population in the USSR accord-ing to preliminary figures from the 1989 census. Thede jure or permanent (postoiannoe) population is 1
million less: 285.7 million. The State Committee on
Statistics of the USSR-formerly the Central Statis-tical Board - has changed the way in which it reportsmost population data in the censuses. Barbara A.
Anderson and Brian D. Silver, "’Permanent’ and’Present’ Populations in Soviet Statistics," SovietStudies, 37:386-402 (July 1985). Accordingly, unlessnoted otherwise, all data in this article from the 1959and 1970 Soviet censuses refer to the present popula-tion, and all data from the 1979 and 1989 censusesrefer to the permanent population.
2. All of these reported figures are subject toerror. Infant deaths appear to be underreported sub-stantially, especially in the regions with high rates;and Soviet definitions of "infant death" and "live
birth" differ from those proposed by the World HealthOrganization. We estimate that the reported infantmortality rates for the Soviet Union need to be inflatedby at least 22 percent to make them comparable withWorld Health Organization definitions. Barbara A.Anderson and Brian D. Silver, "Infant Mortality in theSoviet Union: Regional Differences and Measure-ment Issues," Population and Development Review,12:705-38(Dec. 1986). Life expectancy at birth is
probably overestimated, due to underreporting ofdeaths, overstatement of age at death, and overstate-
ment of age in Soviet censuses. Idem, "The ChangingShape of Soviet Mortality, 1958-85: An Evaluation ofOld and New Evidence," Population Studies, 43:243-65 (July 1989).
3. For further discussion of the changing ethniccomposition of the Soviet population, see Barbara A.Anderson and Brian D. Silver, "Demographic Sourcesof the Changing Ethnic Composition of the SovietUnion," Population and Development Review, Dec.1989, vol. 15.
157
between Russians and non-Russians, butalso between members of non-Russian
nationalities.But even today one often reads of Soviet
public health, Soviet mortality, and Sovietpopulation growth, as if the range of demo-graphic experience in the USSR weresmall. In this article we highlight the mag-nitude of the demographic differences as-sociated with the ethnic diversity of theUSSR, while describing trends in some ofthe main indicators of demographicchange.
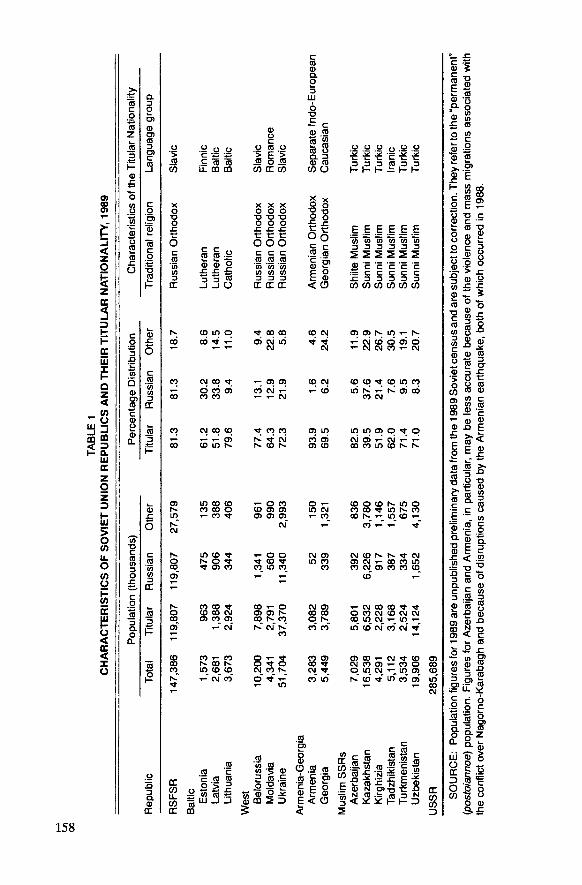
Our analysis is based on official Sovietpopulation statistics.’ Although ethnic dif-ferences in demographic behavior are veryimportant in the Soviet Union, we cannotconduct our entire analysis on this basis,because very few data by ethnic group havebeen published. Thus part of our analysisrelies on examination of regional patterns.The Soviet Union has a federal politicalsystem. Most major types of demographicdata are published both for the SovietUnion as a whole and for the 15 majorconstituent union republics-also knownas Soviet Socialist Republics (SSRs)-butnot for ethnic groups. The 15 SSRs are
listed in Table 1.
The SSRs are the traditional homelands
of major ethnic groups. These ethnicgroups are the titular nationalities of these
regions in the sense that the areas arenamed after the ethnic group - Kazakhstan
after the Kazakhs, Ukraine after the Ukrai-nians, and so on. But none of the areas isethnically homogeneous. As shown inTable 1, the percentage of a republic’s pop-ulation that is of the titular nationality
ranges from a low of 39.5 percent in
Kazakhstan to a high of 93.9 percent inArmenia. Consequently, statistics for theSSRs do not reflect only the demographicbehavior of the titular nationality. Never-theless, differences in the behavior of thetitular nationalities are the main source ofdifferences in most demographic behaviorsof the populations of the SSRs. We shalluse demographic statistics on ethnicgroups when they are available.
SOVIET DEMOGRAPHIC BEHAVIOR
AS A COMPOSITE OFTHE BEHAVIOR OF ITS PARTS
Change in the behavior of a populationoften reflects different rates of change indifferent subpopulations. For example,from 1971 to 1976, the infant mortality rate(IMR) in the Soviet Union rose from 22.9infant deaths per 1000 live births to 31.4,an increase of 37 percent. This increasewas much larger in the rural areas: the IMRin rural areas rose from 24.3 to 37.8-an
increase of 56 percent-while the IMR inthe urban areas increased 24 percent, from21.6 to 26.7. By 1987, the IMR of thecountry as a whole had fallen to 25.4; in theurban areas it was 21.1, and in the ruralareas it was 31.5. Thus the only reason theIMR in the USSR as a whole was higher in1987 than in 1971 is that the rural IMR was
higher in 1987 than it had been in 1971.Social scientists sometimes use the term
&dquo;compositional effect&dquo; to describe situa-tions in which changes in the behavior ofthe whole population are a result of
changes in the composition of that popula-tion rather than changes in the behavior ofthe constituent parts. For example, if a
population consists of two subpopulations,one with a crude birth rate (CBR) of 20 livebirths per 1000 population and anotherwith a CBR of 40, then the CBR of the
4. These data have appeared in a variety ofsources and are based either on Soviet censuses-of
1959, 1970, 1979, and 1989-or on vital registrationstatistics. The data on ethnic groups for 1989 comefrom preliminary unpublished official data from the1989 Soviet census.
158
0)OD0)
r-iaz0
az«4
JH_r«WXH0za.....0
S2J -Jm m<nHaw«z0zn
H50NLL0NU
5t;CEH
vaoe16o
Y L~ .¡c 7coE§0)
. Q) 0.0 II) 0mgy5 ~o·- crg&#w
~.~WEco cn c6
.
c.Q E.....g©Cca -a
U No ~ ~-i 80-0 OS 0 0.- >.s:::.?~1I).s:::..s:::.a~ ~ctscCg-§§~f2DQ~,
-
~.s<D ~ ~~ ~ O’-....0&dquo;s 8€’s Uren o co 0 co Q)0> II) e:S2 ~.~0)..... Q) Q)m2~.s:::. >-....~ E ~a E a~0 E~(ij;’m COê03.o0.9-0&dquo; e: co ~ .2 t co 0. &dquo;tJ co Q) ~coc e: 0.- E .- - II)zacc -0 a o c0 ’a9 2L~~-o-0 =! (0 C ’S:3 coCL 0
5 .m. ~D=a fl!o 0 -e (0 o Saeg~aCON&dquo;0) < Ccts
o.9.s:::.-qyg#S©
3Dj~ .2’ i;;¡¡::LL.:::.:::
0 c p c 6= .0 E«~Sg,o.::JCO75 0 a 75 0 OLZ
gQ. 8.......,§lw ~ oüg-II: t:.25’~ ~ c0 0~ H U
0 0).9.:5
159
FIGURE 1
PERCENTAGE DISTRIBUTION OF THE SOVIET POPULATION AMONG REGIONS, 1987
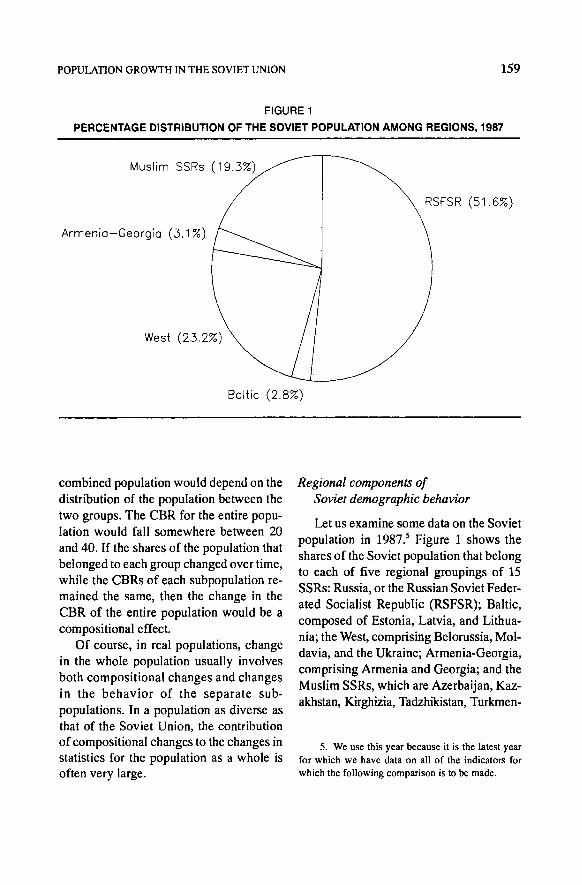
combined population would depend on thedistribution of the population between thetwo groups. The CBR for the entire popu-lation would fall somewhere between 20
and 40. If the shares of the population thatbelonged to each group changed over time,while the CBRs of each subpopulation re-mained the same, then the change in theCBR of the entire population would be acompositional effect.
Of course, in real populations, changein the whole population usually involvesboth compositional changes and changesin the behavior of the separate sub-
populations. In a population as diverse asthat of the Soviet Union, the contributionof compositional changes to the changes instatistics for the population as a whole isoften very large.
Regional components ofSoviet demographic behavior
Let us examine some data on the Soviet
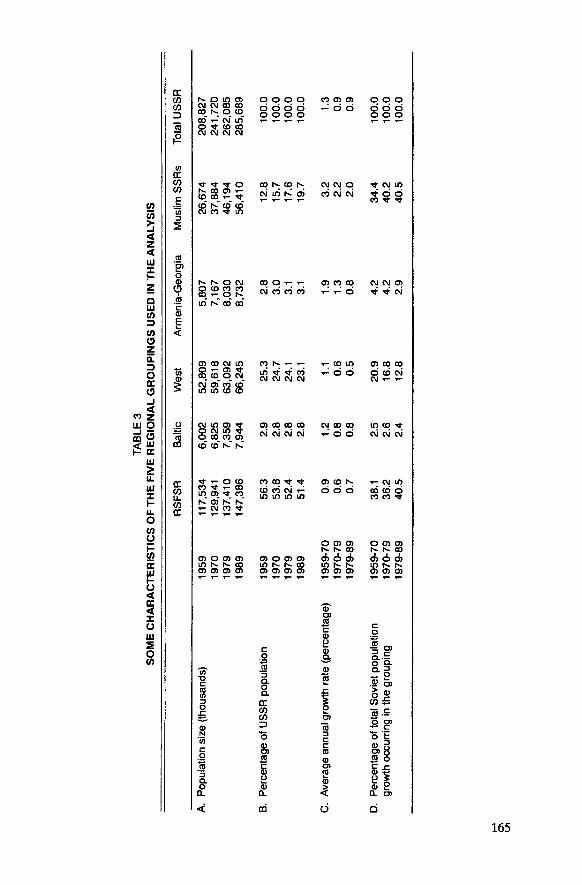
population in 1987.~ Figure 1 shows the
shares of the Soviet population that belongto each of five regional groupings of 15SSRs: Russia, or the Russian Soviet Feder-ated Socialist Republic (RSFSR); Baltic,composed of Estonia, Latvia, and Lithua-nia ; the West, comprising Belorussia, Mol-davia, and the Ukraine; Armenia-Georgia,comprising Armenia and Georgia; and theMuslim SSRs, which are Azerbaijan, Kaz-akhstan, Kirghizia, Tadzhikistan, Turkmen-
5. We use this year because it is the latest yearfor which we have data on all of the indicators for
which the following comparison is to be made.
160
istan, and Uzbekistan.’ A slight majority ofthe population, 51.6 percent, lived in theRSFSR. Only about 3 percent of the popu-lation lived in the Baltic or in Armenia-
Georgia. Another 23 percent lived in thethree republics of the Soviet West, and 19percent lived in the six Muslim republics.Since these groupings exhaust the popula-tion of the USSR, the weighted average ofthe demographic behavior of the parts rep-resents the demographic behavior of theUSSR as a whole.Now let us examine the share of births
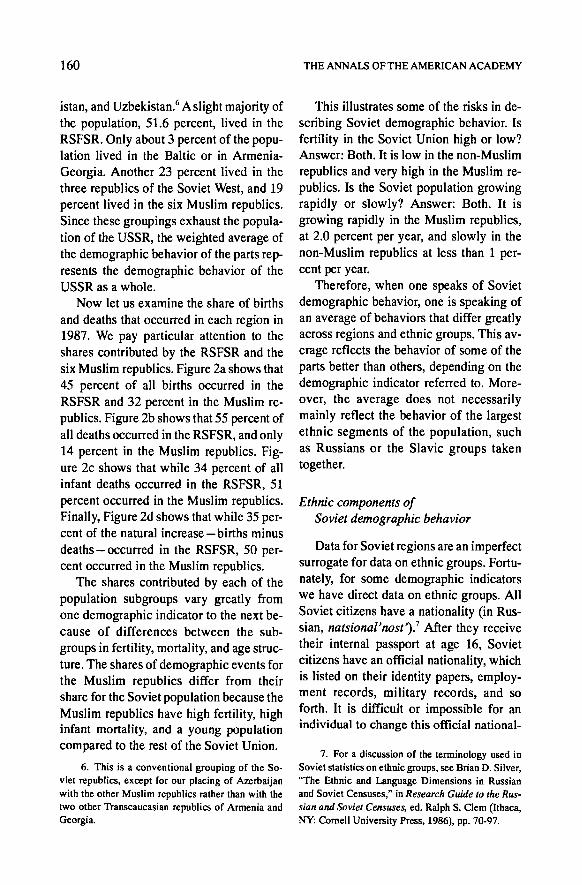
and deaths that occurred in each region in1987. We pay particular attention to theshares contributed by the RSFSR and thesix Muslim republics. Figure 2a shows that45 percent of all births occurred in the
RSFSR and 32 percent in the Muslim re-
publics. Figure 2b shows that 55 percent ofall deaths occurred in the RSFSR, and only14 percent in the Muslim republics. Fig-ure 2c shows that while 34 percent of allinfant deaths occurred in the RSFSR, 51
percent occurred in the Muslim republics.Finally, Figure 2d shows that while 35 per-cent of the natural increase -births minus
deaths - occurred in the RSFSR, 50 per-cent occurred in the Muslim republics.
The shares contributed by each of thepopulation subgroups vary greatly fromone demographic indicator to the next be-cause of differences between the sub-
groups in fertility, mortality, and age struc-ture. The shares of demographic events forthe Muslim republics differ from theirshare for the Soviet population because theMuslim republics have high fertility, highinfant mortality, and a young populationcompared to the rest of the Soviet Union.
This illustrates some of the risks in de-
scribing Soviet demographic behavior. Isfertility in the Soviet Union high or low?Answer: Both. It is low in the non-Muslim
republics and very high in the Muslim re-publics. Is the Soviet population growingrapidly or slowly? Answer: Both. It is
growing rapidly in the Muslim republics,at 2.0 percent per year, and slowly in thenon-Muslim republics at less than 1 per-cent per year.
Therefore, when one speaks of Sovietdemographic behavior, one is speaking ofan average of behaviors that differ greatlyacross regions and ethnic groups. This av-erage reflects the behavior of some of the
parts better than others, depending on thedemographic indicator referred to. More-over, the average does not necessarilymainly reflect the behavior of the largestethnic segments of the population, suchas Russians or the Slavic groups taken
together.
Ethnic components ofSoviet demographic behavior
Data for Soviet regions are an imperfectsurrogate for data on ethnic groups. Fortu-nately, for some demographic indicatorswe have direct data on ethnic groups. AllSoviet citizens have a nationality (in Rus-sian, natsional’nost’).’ After they receivetheir internal passport at age 16, Sovietcitizens have an official nationality, whichis listed on their identity papers, employ-ment records, military records, and soforth. It is difficult or impossible for anindividual to change this official national-
6. This is a conventional grouping of the So-viet republics, except for our placing of Azerbaijanwith the other Muslim republics rather than with thetwo other Transcaucasian republics of Armenia andGeorgia.
7. For a discussion of the terminology used inSoviet statistics on ethnic groups, see Brian D. Silver,"The Ethnic and Language Dimensions in Russianand Soviet Censuses," in Research Guide to the Rus-sian and Soviet Censuses, ed. Ralph S. Clem (Ithaca,NY: Cornell University Press, 1986), pp. 70-97.
161
162
FIGURE 3
PERCENTAGE DISTRIBUTION OF THE SOVIETPOPULATION AMONG NATIONALITY GROUPINGS, 1989
ity. Nationality in the Soviet censuses,however, is a subjective phenomenon,based on the self-report of the individual.
Even if there were no emigration fromthe Soviet Union, ethnic groups would notbe closed populations, since people canmigrate into or out of a given nationalityby changing their self-reported ethnicidentity from one census to the next. Werefer to this process as ethnic reidentifica-
tion. There is evidence of substantial ethnicreidentification among Soviet non-Russiannationalities in the past.8
Change in the number of people belong-ing to the different Soviet nationalities is
therefore not simply a result of fertility,mortality, and international migration.Based on projections of the population in1989 from earlier data, whether ethnicRussians remained a majority of the popu-lation of the USSR in 1989 depended sub-stantially on the extent of ethnic reidentifi-cation of the population between thecensuses of 1979 and 1989. Some peoplewho identified as a member of a non-
Russian nationality in 1979 could havecalled themselves Russian in 1989, andsome who identified as Russian in 1979could have identified with a non-Russian
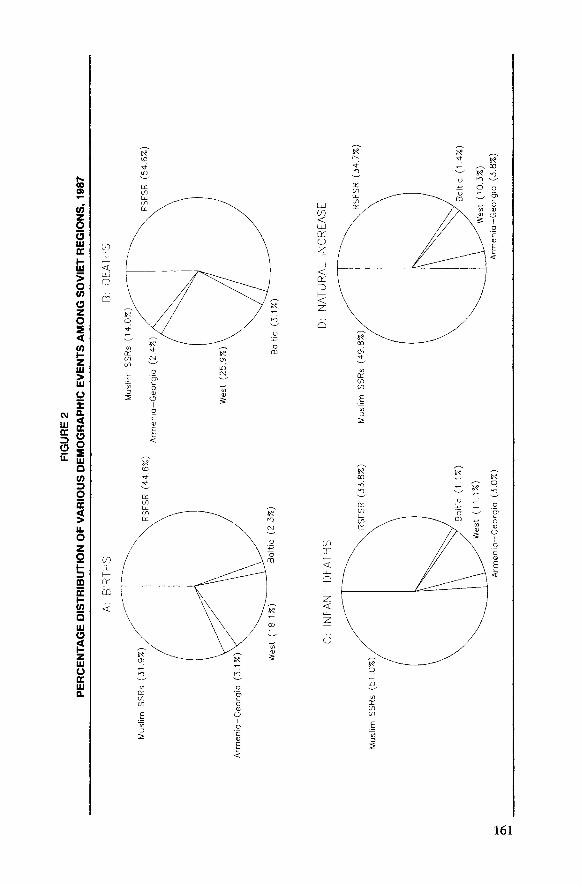
nationality in 1989.’Figure 3 shows the share of the popula-
tion that belonged to four groupings ofSoviet nationalities, according to prelimi-nary data from the 1989 Soviet census:Russians constituted 50.8 percent; non-Russian Slavs, 19.5 percent; other non-
8. For a summary of the evidence, as well as adiscussion of methods of measuring ethnic reidentifi-
cation, see Barbara A. Anderson, "Some Factors Re-lated to Ethnic Reidentification in the Russian Repub-lic," in Soviet Nationality Policies and Practices(New York: Praeger, 1978), pp. 309-33; Barbara A.Anderson and Brian D. Silver, "Estimating Russifica-tion of Ethnic Identity among Non-Russians in theUSSR," Demography, 20:461-89 (Nov. 1983).
9. For further discussion, see Anderson and Sil-
ver, "Demographic Sources."

163
Muslims, 10.3 percent; and Muslims, 19.4
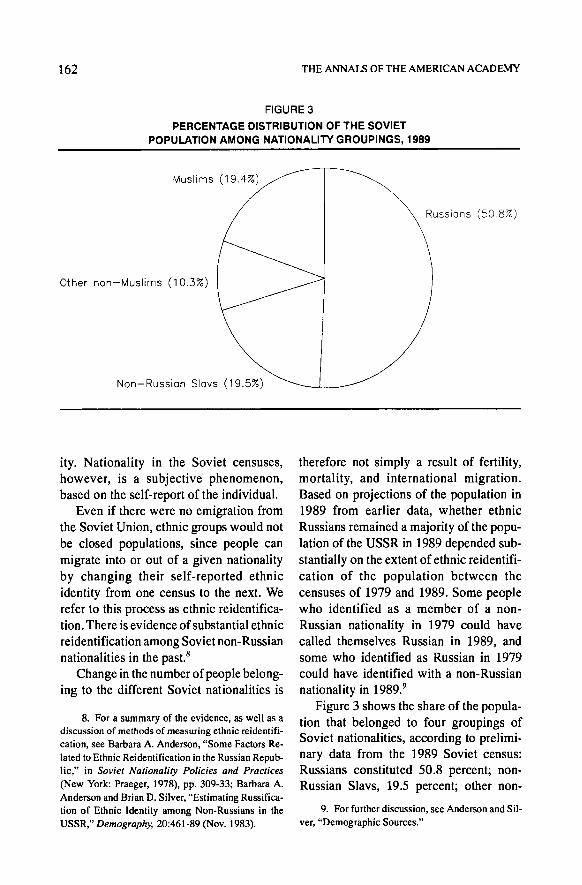
percent. The number of people that thisrepresents is given in panel A of Table 2.These figures are based on the entire Sovietpopulation, not only the titular nationalitiesof the 15 union republics.&dquo;
In 1989, Russians remained a bare ma-
jority of the Soviet population. We thinkthe number of Russians is somewhat
smaller than might have been expected,due to a decrease in the tendency of non-Russians to change their identification toRussian and perhaps to a return by someself-declared Russians to an earlier non-
Russian ethnic identity. But with the avail-able data, we cannot measure the extent ofethnic reidentification between 1979 and1989.’1
Panel B of Table 2 shows that Russians
compose a decreasing share of the Sovietpopulation between the last four census
dates, from 54.7 percent in 1959 to 50.8percent in 1989. Muslims, on the otherhand, constitute an increasing share, from11.8 percent in 1959 to 19.4 percent in1989. Non-Russian Slavs decreased their
share from 22.5 percent to 19.5 percent,while other non-Muslims decreased from
11.0 percent to 10.3 percent. All four
groupings, however, grew in absolute sizein each intercensal period.
Panel D of Table 2 shows how much
each of the four groupings of nationalitiescontributed to the overall populationgrowth of the Soviet Union between the
last four census dates. Most noticeable are
the relative contributions of Muslims and
Russians. Between 1959 and 1970 Mus-lims contributed 31.7 percent of the popu-lation growth of the USSR and Russianscontributed 45.4 percent, but by 1979-89this contribution had reversed: Muslimscontributed 49.7 percent and Russians,32.6 percent. This reversal reflects the con-
tinuing high fertility rates of Muslim na-tionalities and the low fertility rates of Rus-sians, other Slavs, and other non-Muslims.
The differences in the growth rates ofnationalities underlie the differences in thenatural increase of Soviet regional popula-tions depicted in Figure 2d.’2 But a com-parison of growth rates by region and bynationality -compare panel C of Table 2with panel C of Table 3 - also makes clearthat use of regional data in place of ethnicgroup data often reduces the magnitude ofthe differences in demographic behavior.13In the period 1979-89, for example, theMuslim population grew at an average an-nual rate of 2.4 percent, while the popula-tion of the six Muslim republics grew at anannual rate of 2.0 percent. Similarly, thenumber of Russians grew at an averageannual rate of 0.5 percent, while the popu-lation of the RSFSR grew at a rate of 0.7
percent. The regional difference is smaller
10. The Muslim population of the USSR, for
example, consists of-in addition to the titular nation-alities of the six Muslim SSRs - the VolgaTatars, with6.6 million people in 1989; the Peoples of Dagestan,with 2.1 million; the Chechens, with 1.0 million; and21 more Muslim nationalities.
11. Estimation of the amount of ethnic reidentifi-
cation requires data on the age distribution of thepopulation by nationality. To date—Dec. 1989-nodata on age by nationality have been published foreither the 1979 or 1989 Soviet censuses.
12. In Figure 2d, we are able to depict rates ofnatural increase—births minus deaths—by region,because birth and death rates are reported for SSRs.In Table 2, we are not able to depict rates of naturalincrease of ethnic groups because birth and death rates
are not reported for nationalities. But the growth ratesgiven in the table’s panel C closely approximate therates of natural increase, since only a few nationalitieshave experienced substantial international migrationin recent decades.
13. For further illustrations of this general point,see Brian D. Silver, "Levels of Sociocultural Devel-
opment among Soviet Nationalities: A Partial Test ofthe Equalization Hypothesis," American PoliticalScience Review, 68:1618-37 (Dec. 1974).
164
NraJ<z<Wx
z
aWN3
N0Z
a
0cca0
N ZJm EH2FLUxHLL0Nu
NccW
u<cc4xu
W20N
E cD00
3~ -o<o c
0) ~mmconwmL2~ _~~ C<o ~U~ C04)a (0N
8%L,Cgom§j U U CC
N N N CD Wg n29
c
U U L N-~i’5 %0 <oM 0
E O?0~ L T V* C4)>cj LOW y~JM t-W L
,U 0W$#Z YOU’j C.0O© D
Q) OLt 0N
Z flD q~L C. > N > U)Q) C.? Sm« .coCY) 0) 0
’C NC Ld0 0 E CL 0l~>-cnc:
~S-i+-Q0 E t; ca ?’ a cn
m S &dquo;
EN cw ECC CLD .M °
a~cn :3Csc:3 CO
165
166
FIGURE 4
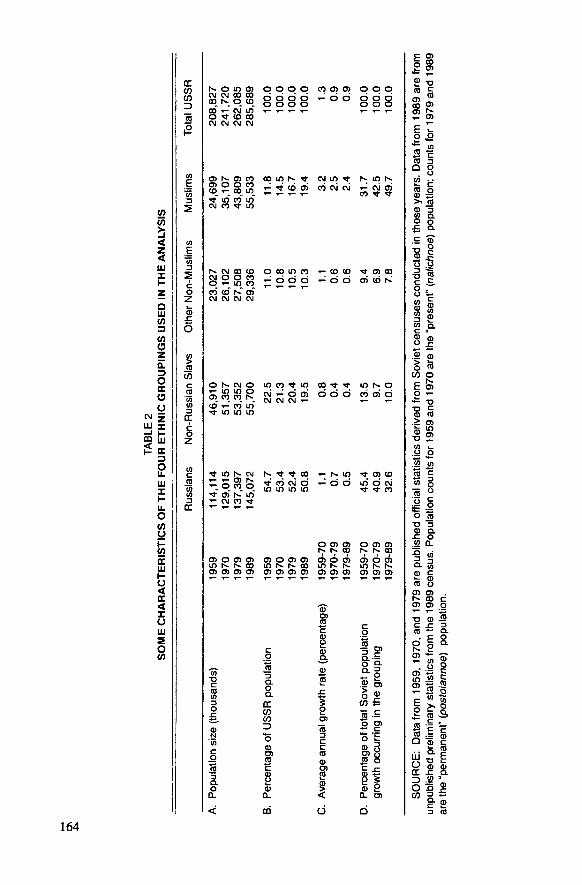
ESTIMATED RATES OF NET INTERCENSALIN-MIGRATION OF RUSSIANS TO REGIONS, 1959-89
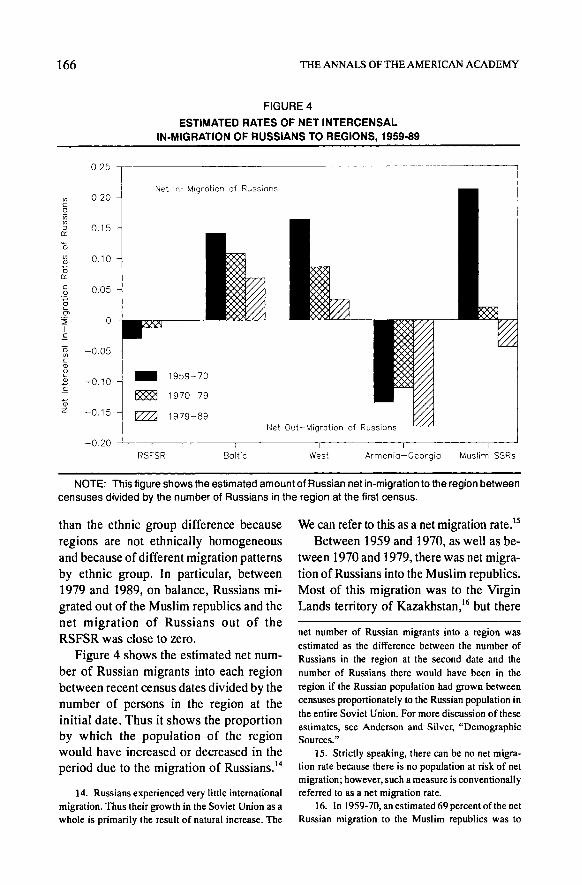
NOTE: This figure shows the estimated amount of Russian net in-migration to the region betweencensuses divided by the number of Russians in the region at the first census.
than the ethnic group difference because
regions are not ethnically homogeneousand because of different migration patternsby ethnic group. In particular, between1979 and 1989, on balance, Russians mi-
grated out of the Muslim republics and thenet migration of Russians out of theRSFSR was close to zero.
Figure 4 shows the estimated net num-ber of Russian migrants into each regionbetween recent census dates divided by thenumber of persons in the region at the
initial date. Thus it shows the proportionby which the population of the regionwould have increased or decreased in the
period due to the migration of Russians.14
We can refer to this as a net migration ratesBetween 1959 and 1970, as well as be-
tween 1970 and 1979, there was net migra-tion of Russians into the Muslim republics.Most of this migration was to the VirginLands territory of Kazakhstan,’6 but there
14. Russians experienced very little internationalmigration. Thus their growth in the Soviet Union as awhole is primarily the result of natural increase. The
net number of Russian migrants into a region wasestimated as the difference between the number ofRussians in the region at the second date and thenumber of Russians there would have been in the
region if the Russian population had grown betweencensuses proportionately to the Russian population inthe entire Soviet Union. For more discussion of these
estimates, see Anderson and Silver, "DemographicSources."
15. Strictly speaking, there can be no net migra-tion rate because there is no population at risk of netmigration; however, such a measure is conventionally referred to as a net migration rate.
16. In 1959-70, an estimated 69 percent of the netRussian migration to the Muslim republics was to
167
was a net influx of Russians into five of thesix Muslim republics in both the 1959-70and 1970-79 intercensal periods-the ex-ception was Azerbaijan, from which therewas net out-migration of Russians in bothperiods. Between 1979 and 1989, however,there was net out-migration of Russiansfrom all six Muslim republics.&dquo;
Figure 4 also shows that there was netout-migration of Russians from Armeniaand Georgia in all three intercensal periodsas well as net in-migration of Russians toboth the Baltic and the Soviet West in allthree periods. Russians were not the onlyinternal migrants; however, Russians,Ukrainians, and Belorussians composedthe bulk of those Soviet citizens whomoved across union-republic boundariesin response to new jobs.
In the 1950s and 1960s, a policy of theintermixing of different nationalities wasendorsed openly by central authorities, andrelocation of labor was one method of
achieving such mixing. This policy haslong been controversial in the non-Russianrepublics. The net result of the migrationpatterns by different ethnic groups in re-cent decades has been the increasing ethnichomogenization and, one might say, in-
digenization, of the Muslim republics, Ar-menia, and Georgia, and the decreasinghomogenization - increasing Russianiza-tion-of the Baltic and the Soviet West. In
September 1989, the Central Committee ofthe Communist Party of the Soviet Unionfor the first time formally acknowledged
the adverse consequences of this policy-in particular, its threat to the preservationof ethnic distinctiveness and its exacerba-tion of interethnic tensions.’8
DIFFERENCES IN REGIONAL AND
ETHNIC DEMOGRAPHIC PATTERNS
In the remainder of this article, we ex-plore several dimensions of Soviet demo-graphic behavior by region and by ethnicgroup. We turn now to infant mortality.
Infant mortality
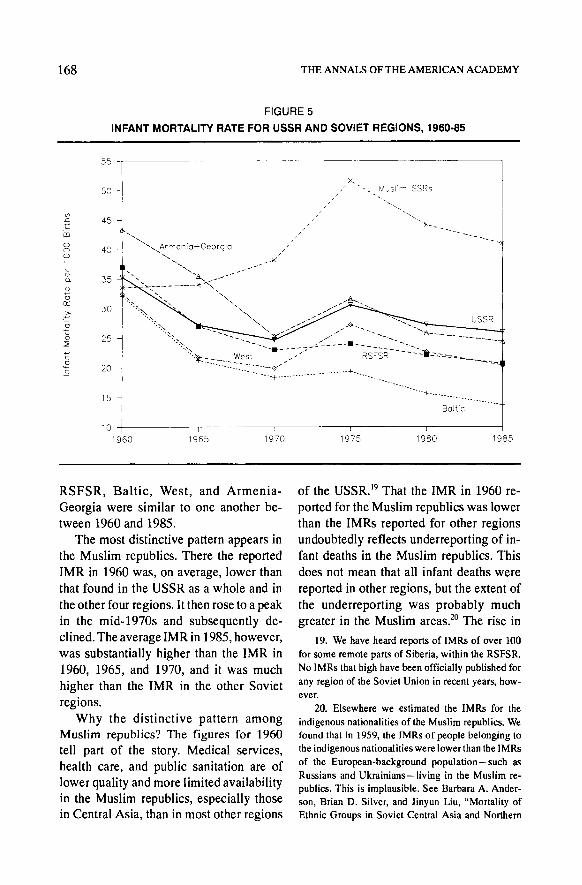
The IMR is often interpreted as an indi-cator of the quality of life in a society. Itreflects the effects of personal health andhygiene, diet, public health and sanitationprograms, and the quality and availabilityof medical services. Figure 5 shows thedifferences in the average IMRs for the
republics in each group at five-year inter-vals from 1960 to 1985. The IMR for theUSSR as a whole in 1985 was about thesame as it was in 1965. This contrasts withthe trend toward improvement in infantmortality in most other countries of theindustrial world.
The data for separate regional group-ings show different levels and trends ininfant mortality. In the RSFSR and the
Baltic, the IMR declined in each five-yearinterval except 1970-75. In the West alsothe IMR rose between 1970 and 1975 andwas lower in 1985 than in 1960 and 1965,but between 1965 and 1985 there was littledecline. The pattern in Armenia and Geor-gia is similar to that found in the West,except that the IMR in 1985 was muchlower than the IMR in 1965. In general, thepatterns of change in the IMRs in the
Kazakhstan; in 1970-79, an estimated 44 percent ofthe net Russian migration to these republics was toKazakhstan.
17. For further details on the ethnic patterns of
migration, see Brian D. Silver, "Population Redistri-bution and the Ethnic Balance in Transcaucasia," inNationalism and Sacial Change in Transcaucasia, ed.Ronald G. Suny (Ann Arbor: University of MichiganPress, 1983), pp. 376-96; Anderson and Silver, "De-mographic Sources."
18. See "Party’s Draft Platform on NationalitiesPolicy," Current Digest of the Soviet Press, 13 Sept.1989, pp. 1-8.
168
FIGURE 5
INFANT MORTALITY RATE FOR USSR AND SOVIET REGIONS, 1960-85
RSFSR, Baltic, West, and Armenia-Georgia were similar to one another be-tween 1960 and 1985.
The most distinctive pattern appears inthe Muslim republics. There the reportedIMR in 1960 was, on average, lower thanthat found in the USSR as a whole and in
the other four regions. It then rose to a peakin the mid-1970s and subsequently de-clined. The average IMR in 1985, however,was substantially higher than the IMR in1960, 1965, and 1970, and it was much
higher than the IMR in the other Sovietregions.Why the distinctive pattern among
Muslim republics? The figures for 1960tell part of the story. Medical services,health care, and public sanitation are oflower quality and more limited availabilityin the Muslim republics, especially thosein Central Asia, than in most other regions
of the USSR.19 That the IMR in 1960 re-ported for the Muslim republics was lowerthan the IMRs reported for other regionsundoubtedly reflects underreporting of in-fant deaths in the Muslim republics. Thisdoes not mean that all infant deaths were
reported in other regions, but the extent ofthe underreporting was probably muchgreater in the Muslim areas.2° The rise in
19. We have heard reports of IMRs of over 100for some remote parts of Siberia, within the RSFSR.No IMRs that high have been officially published forany region of the Soviet Union in recent years, how-ever.
20. Elsewhere we estimated the IMRs for the
indigenous nationalities of the Muslim republics. Wefound that in 1959, the IMRs of people belonging tothe indigenous nationalities were lower than the IMRsof the European-background population—such asRussians and Ukrainians—living in the Muslim re-publics. This is implausible. See Barbara A. Ander-son, Brian D. Silver, and Jinyun Liu, "Mortality ofEthnic Groups in Soviet Central Asia and Northern
169
the IMRs in the Muslim republics in lateryears probably reflects mostly improve-ments in the reporting of infant deaths, notworsening actual infant mortality. In otherwords, the actual IMRs in the Muslim re-
publics in 1960 were probably higher thanthe rates reported in the mid-1970s and
later.
Elsewhere we have argued that the risein reported infant mortality in the SovietUnion in the early 1970s was mostly anartifact of improvements in statistical re-cord keeping and the completeness of re-porting of infant deaths, especially in So-viet Central Asia. Both in Central Asia andelsewhere in the Soviet Union, new proce-dures introduced in the early 1970s fortabulating infant deaths, along with in-
creasing incentives for registering infantswho were at high risk of dying in infancy,could have raised the reported IMRs evenif the actual IMRs remained the same or
declined.2’ We think these new proceduresand incentives would have had this effectnot only in the Muslim republics but alsoin other parts of the Soviet Union.
This does not mean that all increases in
mortality reported in the 1960s and 1970sin the Soviet Union were an artifact of
improved reporting. The increase in re-
ported mortality of working-age males be-ginning in the mid-1960s probably re-
flected real worsening of the health ofSoviet males.22 Moreover, it is possible that
some of the increase in infant mortality wasalso real. There are many reports, for ex-
ample, of poor water quality in Central
Asia, perhaps intensified by the increasingpopulation density in rural areas.
Fertility rates
Part of the explanation of the high ratesof infant mortality among Soviet Muslimpopulations may be high fertility. Whenwomen have many children, especially inthe context of limited availability of pre-natal care or limited possibility of using theavailable services, then newborns are likelyto be at high risk of dying. Among someMuslim populations, such as Tadzhiks andTurkmenians, the frequency of marriagesbetween cousins is also a special risk factorfor infant mortality.
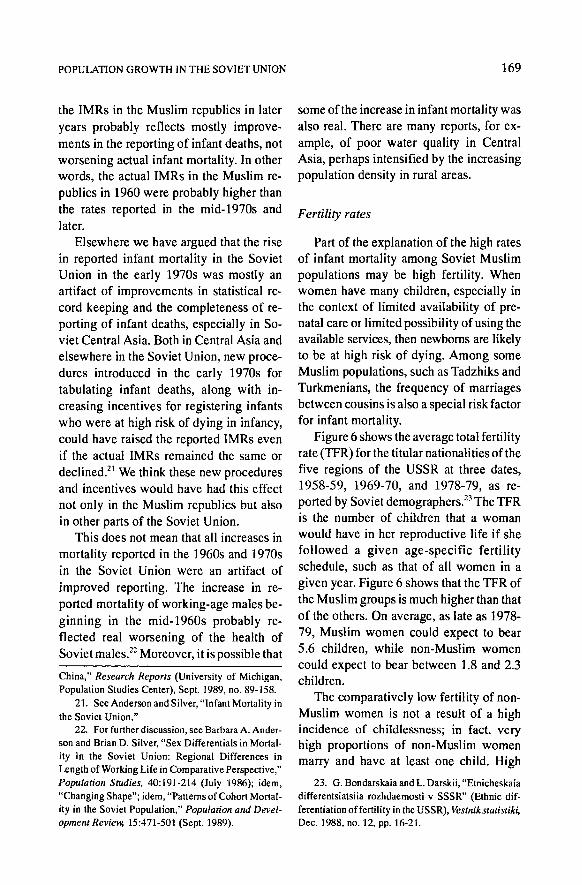
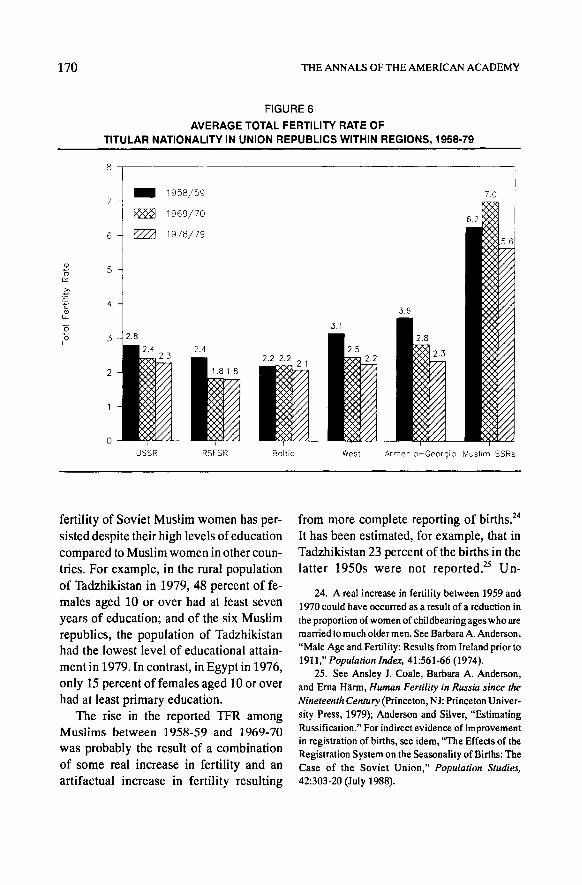
Figure 6 shows the average total fertilityrate (TFR) for the titular nationalities of thefive regions of the USSR at three dates,1958-59, 1969-70, and 1978-79, as re-
ported by Soviet demographers.23 The TFRis the number of children that a womanwould have in her reproductive life if shefollowed a given age-specific fertilityschedule, such as that of all women in agiven year. Figure 6 shows that the TFR ofthe Muslim groups is much higher than thatof the others. On average, as late as 1978-
79, Muslim women could expect to bear5.6 children, while non-Muslim womencould expect to bear between 1.8 and 2.3children.
The comparatively low fertility of non-Muslim women is not a result of a highincidence of childlessness; in fact, veryhigh proportions of non-Muslim womenmarry and have at least one child. High
China," Research Reports (University of Michigan,Population Studies Center), Sept. 1989, no. 89-158.
21. See Anderson and Silver, "Infant Mortality inthe Soviet Union."
22. For further discussion, see Barbara A. Ander-son and Brian D. Silver, "Sex Differentials in Mortal-
ity in the Soviet Union: Regional Differences in
Length of Working Life in Comparative Perspective,"Population Studies, 40:191-214 (July 1986); idem,"Changing Shape"; idem, "Patterns of Cohort Mortal-ity in the Soviet Population," Population and Devel-opment Review, 15:471-501 (Sept. 1989).
23. G. Bondarskaia and L. Darskii, "Etnicheskaiadifferentsiatsiia rozhdaemosti v SSSR" (Ethnic dif-ferentiation of fertility in the USSR), Vestnik statistiki,Dec. 1988, no. 12, pp. 16-21.
170
FIGURE 6
AVERAGE TOTAL FERTILITY RATE OFTITULAR NATIONALITY IN UNION REPUBLICS WITHIN REGIONS, 1958-79
fertility of Soviet Muslim women has per-sisted despite their high levels of educationcompared to Muslim women in other coun-tries. For example, in the rural populationof Tadzhikistan in 1979, 48 percent of fe-males aged 10 or over had at least sevenyears of education; and of the six Muslimrepublics, the population of Tadzhikistanhad the lowest level of educational attain-
ment in 1979. In contrast, in Egypt in 1976,only 15 percent of females aged 10 or overhad at least primary education.
The rise in the reported TFR amongMuslims between 1958-59 and 1969-70
was probably the result of a combinationof some real increase in fertility and anartifactual increase in fertility resulting
from more complete reporting of births.24It has been estimated, for example, that inTadzhikistan 23 percent of the births in thelatter 1950s were not reported .15 Un-
24. A real increase in fertility between 1959 and1970 could have occurred as a result of a reduction in
the proportion of women of childbearing ages who aremarried to much older men. See Barbara A. Anderson,"Male Age and Fertility: Results from Ireland prior to1911," Population Index, 41:561-66 (1974).
25. See Ansley J. Coale, Barbara A. Anderson,and Erna Härm, Human Fertility in Russia since theNineteenth Century (Princeton, NJ: Princeton Univer-sity Press, 1979); Anderson and Silver, "EstimatingRussification." For indirect evidence of improvementin registration of births, see idem, "The Effects of theRegistration System on the Seasonality of Births: TheCase of the Soviet Union," Population Studies,42:303-20 (July 1988).
171
derregistration persisted into the 1960sand 1970s but probably diminished inprevalence. 16
The strong ethnic differences in the
TFRs illustrate why the answer to the ques-tion, Is fertility in the Soviet Union high orlow? is, Both. At the same time, it is clearthat the rates are changing. As shown inFigure 6, they declined for all ethnic group-ings between 1969-70 and 1978-79. In
later years, for which we have data byregion but not by ethnic group, the TFRs ofMuslim areas continued to decline throughthe 1980s, but they rose slightly in thenon-Muslim areas. As a result, the TFR ofthe USSR population in 1986-87 was 2.51,compared to 2.27 in 1978-79.
High-order births
Another indicator of differences in fer-
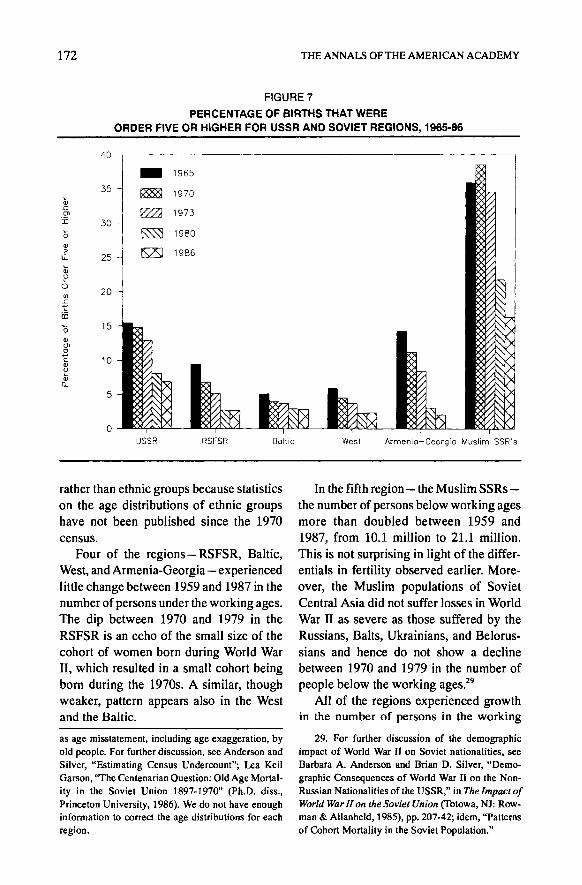
tility behavior within the Soviet Union isthe prevalence of high-order births. Fig-ure 7 shows the percentage of births thatare of fifth or higher order for variousyears for which data are available for So-viet republics.
If any single measure could testify to thesharp difference in the life situations of
women, and the comparative risks of infantmortality between regions and ethnicgroups, it is this one. In the 1960s and early1970s, more than 30 percent of all birthswere of fifth or higher order in the Muslimrepublics. Even in 1986, one of every six
births in the Muslim republics was fifthorder or higher.&dquo;
The percentage of high-order births hasdropped at successive dates in every re-gion, except for the increase between 1965and 1970 in the Muslim SSRs. This is
consistent with the pattern of change in theTFRs during the same time span.
Distribution by age
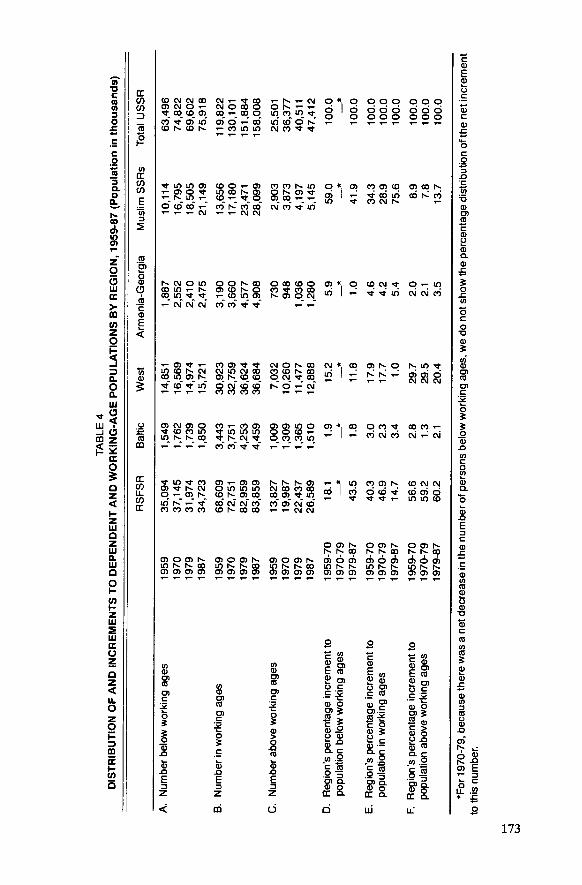
A major consequence of the differencesin fertility between regions and ethnicgroups is differences in the age distribu-tions of the population as well as differ-ences in the growth of segments of the agestructure. Of special interest is the size ofthe working-age population, as well as thepopulation below and above the workingages. By convention in Soviet labor statis-tics, the working ages are 16-59 for menand 16-54 for women, although this doesnot mean that all people enter the laborforce exactly at age 16 and retire at age 55or 60.
Panels A through C of Table 4 show foreach regional grouping the number of per-sons in the three age categories at the timeof the censuses of 1959,1970, and 1979, aswell as in 1987, which is not a census
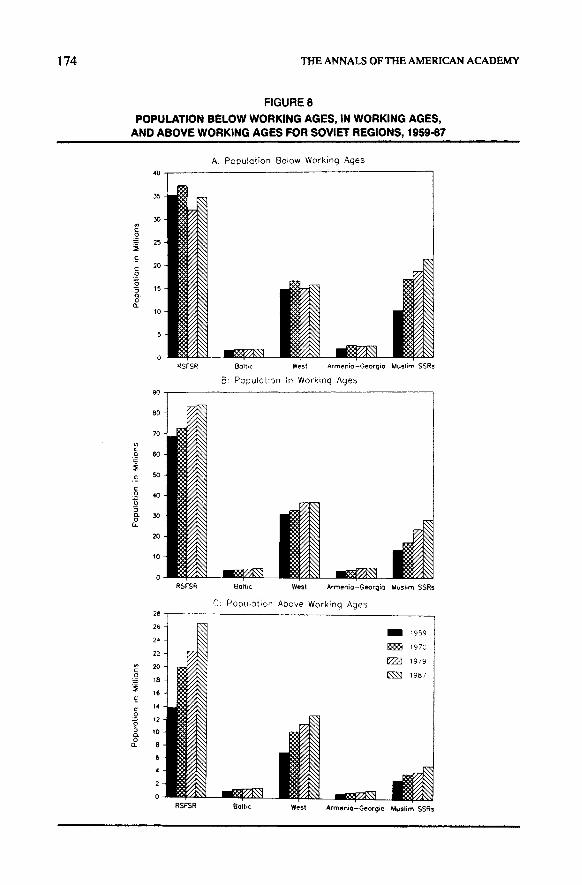
year.28 The data from these panels are sum-marized in Figure 8. We use data on regions
26. Coale, Anderson, and Härm, Human Fertil-ity in Russia; Barbara A. Anderson and Brian D.Silver, "Estimating Census Undercount from School-Enrollment Data: An Application to the Soviet Cen-suses of 1959 and 1970," Demography, 20:461-89(Nov. 1983); W. Ward Kingkade, An Evaluation ofSelected Soviet Population Statistics, CIR Staff Paperno. 9, U.S. Department of Commerce, Bureau of theCensus, Center for International Research, Nov. 1985.
27. This measure actually understates the differ-ence between Muslim and non-Muslim fertility, be-cause it does not take into account differences in the
age structures of the regional populations. Since theage distribution of women in the Muslim republics ismuch younger than the age distribution of women in
other regions, proportionately fewer Muslim womenwould be near the end of their childbearing years.
28. The latest date for which age data for theSoviet population have been published is 1987, anoncensus year. Age distributions in Soviet censusesare subject to error caused by undercounting of youngchildren, older adolescents, and young adults, as well
172
FIGURE 7
PERCENTAGE OF BIRTHS THAT WEREORDER FIVE OR HIGHER FOR USSR AND SOVIET REGIONS, 1965-86
rather than ethnic groups because statisticson the age distributions of ethnic groupshave not been published since the 1970census.
Four of the regions - RSFSR, Baltic,West, and Armenia-Georgia -experiencedlittle change between 1959 and 1987 in thenumber of persons under the working ages.The dip between 1970 and 1979 in theRSFSR is an echo of the small size of the
cohort of women born during World WarII, which resulted in a small cohort beingbom during the 1970s. A similar, thoughweaker, pattern appears also in the Westand the Baltic.
In the fifth region - the Muslim SSRs -the number of persons below working agesmore than doubled between 1959 and
1987, from 10.1 million to 21.1 million.This is not surprising in light of the differ-entials in fertility observed earlier. More-over, the Muslim populations of SovietCentral Asia did not suffer losses in WorldWar II as severe as those suffered by theRussians, Balts, Ukrainians, and Belorus-sians and hence do not show a declinebetween 1970 and 1979 in the number of
people below the working ages.&dquo;All of the regions experienced growth
in the number of persons in the workingas age misstatement, including age exaggeration, byold people. For further discussion, see Anderson andSilver, "Estimating Census Undercount"; Lea KeilGarson, "The Centenarian Question: Old Age Mortal-
ity in the Soviet Union 1897-1970" (Ph.D. diss.,Princeton University, 1986). We do not have enoughinformation to correct the age distributions for each
region.
29. For further discussion of the demographicimpact of World War II on Soviet nationalities, seeBarbara A. Anderson and Brian D. Silver, "Demo-graphic Consequences of World War II on the Non-Russian Nationalities of the USSR," in The Impact ofWorld War II on the Soviet Union (Totowa, NJ: Row-man & Allanheld, 1985), pp. 207-42; idem, "Patternsof Cohort Mortality in the Soviet Population."
173
NT!c
30
5e
10
;S3CL0aoo
CO6It)02EO_V111UJecmMz0
5a
0ILW
,oLU .J (~m ZH Q
0’%az<HzW(3ZWaWQ
0H
zui2W«0z
az<LL0z0P
m
EH5
-
ë0)E0
ê3.sQ)c
N
.5’0C.2YLY’5Q)
fezZQ)
UNc.
0L3o
LIf)’5C
0
Q)3Gs
v~C)e:
81302M
o8
(¡)9
’5
zEflc0.5cQ)
#muQ)’d
’sC
aIf)aImQ)
LY^‘WM
3u2.0a)
~ ..:o Q)
i1lil Er >
O C’&dquo; u. o .- If) e:+ 8 g £9
174
175
ages in each interval. The largest absolutegrowth occurred in the RSFSR-15.2 mil-lion. The sharpest rise in the RSFSR oc-curred between 1970 and 1979. The in-
crease in population in the working ages inthe Muslim republics between 1959 and1987 -14.4 million - nearly equaled thatof the RSFSR. In relative terms, the growthof the working-age population in the
Muslim republics-105.8 percent-faroutstripped the growth in the RSFSR-
22.2 percent.Every region experienced growth in the
number of persons above the working ages.In both absolute and relative terms, the
largest increase - 12.8 million, or 92.3 per-cent - occurred in the RSFSR. But the rel-
ative growth was quite substantial in all
regions except the Baltic. Even in the
Muslim republics the number of personsabove working age increased by 77.2 per-cent between 1959 and 1987. The growthof this number in the Baltic was probablyheld down by the fact that its populationwas relatively old even in 1959.
The Muslim republics are the only re-gion to experience substantial growth in allthree age segments between 1959 and1987. As a result, they are becoming anincreasingly large contributor to the netincrements to the Soviet population in theworking ages and above the working ages.As shown in panel E of Table 4, in the1959-70 and 1970-79 intercensal periods,the Muslim SSRs contributed about a thirdof the net additions to the working-agepopulation of the USSR. Between 1979and 1987, however, the Muslim SSRs con-tributed three-fourths of the net incrementto the working-age population of theUSSR.
This does not mean that three of everyfour workers first entering the labor forcecomes from a Muslim republic. Only aboutone-fourth of new entrants to the working
ages between 1979 and 1987 lived in a
Muslim republic.3° The net increment tothe working ages from a given region is thedifference between the number of peoplein that region entering the working agesand the number leaving the working ages,whether through reaching pension age orthrough death. The relatively young agecomposition of the populations of theMuslim republics means that they accountfor a very substantial share of the new
entrants plus survivors in the working ages,even larger than their contribution of 50percent of the net increment to the Soviet
population as a whole between 1979 and1989.
Another source of the increasing contri-bution of the Muslim republics to the work-ing ages and to the population over theworking ages is high and increasing adultmale mortality in the European part of theUSSR, especially between age 40 and 60.Adult male mortality was especially highin the RSFSR. In 1969-70, a male in theRSFSR who had survived to age 40 had
only a 75 percent chance of surviving toage 60. In Soviet Central Asia and Trans-
caucasia, a 40-year-old man in 1969-70had an 86 percent chance of living to age60. The level of adult male mortality in theRSFSR in 1969-70 was higher than in anyother developed country. In 1985-86, thechance that a 40-year-old male in the
RSFSR would live to his sixtieth birthdaywas still only 75 percent; however, theearlier worsening of adult male mortalityin the RSFSR had stopped.
In contrast, in 1985-86 males in Arme-nia experienced the lowest mortality of anyrepublic population in the 40-60 age range.In that year, a 40-year-old male in Armenia
30. Recall that, as shown in Figure 2a, only 32percent of births in 1987 occurred in the Muslim
republics. Moreover, only 25 percent of the 15- to19-year-olds in 1987 resided in the Muslim republics.
176
had an 86 percent chance of living to age60. The reported mortality in Armenia foradult males between the ages of 40 and 60was comparable to that in the Federal Re-public of Germany in 1981-82 or Japan in1969-70, although it was lower than that ofAmerican men in 1981-82.3’
CONCLUSION
One lesson from this analysis is that thestudy of Soviet demographic behavior re-quires sensitivity to differences in behaviorbetween regions and ethnic groups. Thesedifferences must be an important aspect ofany attempt to explain the trends in thebehavior and composition of the Sovietpopulation.
The ethnic differentials in rates of pop-ulation growth that we have shown makeclear why so many issues in social policyin the Soviet Union have different implica-tions for different ethnic groups. Pronatal-
ist policies in the USSR, aimed primarilyat the non-Muslim groups, exist alongsideprograms to reduce fertility among Muslimwomen. School enrollments are holdingsteady or increasing moderately in much ofthe USSR but growing rapidly in the
Muslim areas. Increasing shares of con-scripts to the armed forces and of newentrants to the labor force come from the
Muslim populations; decreasing sharescome from Russians and other non-Muslims.
Furthermore, a majority of the net incre-ment to the labor force comes from the
Muslim republics. This presents certainproblems for the development of the Sovieteconomy. The main problem is not theeducation and skill levels of populationfrom these republics. New entrants to theworking ages from the Muslim republicsare probably, on average, better educatedthan the workers who are leaving the laborforce through retirement or death. Instead,the problems relate to the location and mo-bility of the indigenous populations of theMuslim SSRs. The populations show littleinclination to move from their traditional
regions of settlement to areas that are ex-periencing labor shortages, and they usu-ally have poor command of the Russianlanguage and hence cannot move to justany job for which their technical or otherskills qualify them. Moreover, since non-indigenous populations seem to be depart-ing from the Muslim republics, there is
even less incentive for the members of the
titular nationality to leave their home re-public in search of work or career opportu-nities or to improve their facility in theRussian language.
The changing ethnic composition of So-viet regions - toward greater Russianiza-tion of the European republics and greaterindigenization of the non-Europeanones - is also important for understandingthe ethnic politics of the Soviet Union. Inthe Baltic republics and Moldavia, leadersof the Communist Party and of popular-front movements have sought to limit thein-migration of Russians in order to pre-serve the culture and language of the titularnationality and to assert greater local con-trol over the future economic and politicaldevelopment of their republics. If the pol-icy of economic and political perestroika(&dquo;restructuring&dquo;) continues to evolve to-ward greater local autonomy, then these
31. For further discussion, see Anderson and Sil-ver, "Sex Differentials"; idem, "Changing Shape."The Central Asian republics report fairly low adultmale mortality. We think that this is partially a resultof underreporting of mortality and overstatement ofage in Central Asia. See Anderson and Silver, "Chang-ing Shape."
177
non-Russian republics are likely to becomeless hospitable to in-migrants from nontitu-lar nationalities than they have been in thepast. In most non-European republics, out-migration of Russians and other non-
indigenous nationalities was under waywell before Mikhail Gorbachev came to
power in 1985. Further implementation ofperestroika is likely to help sustain thattendency.