growth and development of baby spinach (spinacia …
TRANSCRIPT

GROWTH AND DEVELOPMENT OF BABY SPINACH (Spinacia oleracea L.)
WITH REFERENCE TO MINERAL NUTRITION
by
LUFUNO ETHEL NEMADODZI
Submitted in accordance with the requirements for the degree of
MASTERS OF SCIENCE
in
AGRICULTURE
at the
University of South Africa
SUPERVISOR: PROFESSOR F. N. MUDAU
CO-SUPERVISORS: DR H. ARAYA AND MR M. C. MAKUNGU
January 2015

i
DECLARATION
I declare that Growth and development of baby spinach (Spinacia oleracea L.) with
reference to mineral nutrition is my own work and that all the sources that I have used
or quoted have been indicated and acknowledged by means of complete references. The
thesis was subjected to submission as per University policy.
Signed ……………………………… Date: ………………………….
NEMADODZI LUFUNO ETHEL
STUDENT No: 51892960

ii
ACKNOWLEDGEMENTS
First and foremost, I give thanks to God Almighty for His wisdom, and the endurance
given to me throughout my studies.
I would also like to extend my deepest gratitude to my supervisor, Prof F.N. Mudau, and
co-supervisors Dr H. Araya, and Mr M.C. Makungu for their unlimited patience, guidance,
tolerance and encouragement throughout my studies.
My special thanks and acknowledgement go to Prof M.M. Masafu and Dr C.A. Mbajiourgu
for their undivided attention and infinite encouragement, and for making me realise that
with hard work, determination and dedication to my studies, I can achieve. Words alone
cannot express how much I appreciate all that they have done for me.
I would also like to send my deepest gratitude to the Agriculture Research Council –
Vegetable and Ornamental Plant Institute (Roodeplaat) farm workers, Thabo Nkadimeng,
Lebo Phala, Obert Thatlale, Samuel Msiza, and Frank Mpete who assisted me without
hesitation throughout with my experiment. I would not have made it without all of them,
and will forever remain grateful for and humbled by their assistance.
I wish to acknowledge my research colleague, Mrs Zikalala Bongiwe, who was with me
through the experimental design and all the fieldwork. I will be forever be grateful for her
motivation whenever I wanted to give up.
I would also like to thank Dr Maboko Marthin from ARC-VOPI who opened his heart to me
and showed me how to write, interpret results and discuss my findings scientifically. I
could not have done this without him.
My heartfelt thanks to Dr Ngezimana Wonder, for his infinite patience throughout my
studies. He never once complained about me interrupting his work and generously
offered his help whenever I needed it.
Lastly, I would extend my deepest gratitude to the University of South Africa (UNISA) for
providing the funding that made it possible for me to further my studies.

iii
DEDICATION
I dedicate this thesis to my late grandmother, Essie Dzhivhuho, my dearest mom, Mrs
Nemadodzi Vhahangwele and my only sister, Lukoto Esther Mboneni. I thank them for
constantly reminding me that education is the key to success, for always encouraging me
to pursue my dreams, and for reminding me that perseverance and hard work always pay
off.
This thesis is also dedicated to my only child, Nemadodzi Eugene Tendani. May he follow
in my footsteps and never give up on his dreams, and may this thesis be a reminder that
with determination, dedication, hard work and perseverance, his dreams too can be
achieved.
This thesis is confirmation that it is never about where one comes from, but about where
one is going.

iv
ABSTRACT
Baby spinach is a relatively new crop in South Africa with both commercial significance
and reputed health benefits. It is known to assist in combating degenerative conditions
associated with ageing, such as heart disease, cardiovascular disease, Alzheimer’s
disease, cataracts and several forms of cancer. Three parallel NPK trials were conducted
to investigate the effects of nitrogen (N), phosphorus (P) and potassium (K) on the growth
and development of baby spinach. N and P treatments were arranged as (0, 45, 75, 105,
120 kg.ha -1 N and P), and K treatments were arranged as (0, 63, 85, 127, 148 kg.ha -1) in
a randomised complete block designed with four replicates. Results showed that yield,
dry matter, chlorophyll content and Leaf Area Index (LAI) were significantly increased by
increasing the N application, while K had a significant effect on the LAI but not on yield,
dry matter, chlorophyll content or stomatal conductance. Nitrogen treatments quadrupled
fresh yield, dry matter and chlorophyll content, reaching maximum impact at 75 kg.ha-1 N.
Phosphorus application showed significantly increased yields, dry matter and chlorophyll
content, reaching maximum impact at 75 kg.ha-1 P. Therefore, to achieve optimum growth
with N and P, 75 kg.ha-1 is recommended. The optimum rates of N, P and K were then
used to formulate a NPK combined trial which was arranged as 0, 30:30:40, 45:45:60,
60:60:70, 75:75:90 kg.ha-1 in a randomised complete block design with three replicates.
The results showed that maximum impact on yield, chlorophyll content, fresh and dry
matter was achieved when combined NPK was applied at 45:45:60.
Key words: Baby spinach, biomass, chlorophyll content, dry matter, mineral nutrition,
nitrate, stomatal conductance.

v
Table of contents
Page
Declaration ………………………………………………………………………
Acknowledgements …………………………………………………………….
Dedication ……………………………………………………………………….
Abstract ………………………………………………………………………….
Table of contents ……………………………………………………………….
List of plates …………………………………………………………………….
List of tables …………………………………………………………………….
i
ii
iii
iv
v
viii
ix
Chapter 1 Introduction
1.1 Background ………………………………………………………………...
1.2 Problem statement ………………………………………………………...
1.3 Motivation for the study …………………………………………………...
1.4 Study aim …………………………………………………………………..
1.5 Objectives ………………………………………………………………….
1.6 Hypotheses …………………………………………………………………
1.7 Ethical considerations ………………………………………………….…
Chapter 2 Literature review
2.1 Health benefits of baby spinach ………………………………….………
2.2 Composition of spinach ………………………………………….………..
2.2.1 Nutritional composition …………………………………….……….
2.2.2 Phytochemicals ……………………………………………………..
2.2.3 Chlorophyll content …………………………………………………
2.2.4 Amino acids and coenzymes ………………………………………
2.2.5 Carotenoids ………………………………………………………….
2.2.6 Flavonoids …………………………………………………………...
2.2.7 Antioxidants ………………………………………………………….
2.3 Other health benefits of baby spinach …………………………………..
2.3.1 Skin protection ………………………………………………………
2.3.2 Foetus development ………………………………………………..
2.3.3 Cardiovascular health ………………………………………………
2.3.4 Bone development ………………………………………………….
2.4 Factors affecting the growth of and nutrients in baby spinach ……….
1
2
2
3
3
3
3
4
4
4
5
5
6
7
7
8
9
9
10
10
10
10

vi
2.4.1 Climatic conditions ………………………………………………….
2.4.2 Edaphic factors ……………………………………………………...
2.4.3 Cultivars ……………………………………………………………...
2.4.4 Planting ………………………………………………………………
2.4.5 Irrigation methods …………………………………………………..
2.4.6 Fertilisation …………………………………………………………..
2.4.6.1 Nitrogen ……………………………………………………..
2.4.6.2 Phosphorus …………………………………………………
2.4.6.3 Potassium …………………………………………………..
2.4.7 Fertiliser application methods …………………………………….
2.4.8 Harvesting …………………………………………………………...
2.4.9 Postharvest handling ……………………………………………….
2.4.10 Storage ……………………………………………………………...
2.5 Summary …………………………………………………………………...
Chapter 3 Research design and methodology
3.1 Materials and methods ……………………………………………………
3.1.1 Experimental site ………………………………………………………..
3.1.2 Experimental design and treatment details …………………………..
3.1.3 Data collection …………………………………………………………...
3.1.3.1 Method of determining nitrogen …………………………………
3.1.3.2 Leaf tissue phosphorus concentrations ………………………..
3.1.3.3 Leaf tissue potassium concentrations ………………………….
3.1.3.4 Sample extraction for nitrate and nitrite ………………………..
3.1.3.5 Computation of protein N and protein ………………………….
3.1.3.6 ICP-OES determination of phosphorus and potassium ………
3.1.4 Statistical analysis ………………………………………………………
Chapter 4 Results and discussion
4.1 Analysis of data ……………………………………………………………
4.1.1 Response of biomass production to nitrogen nutrition ………....
4.1.2 Response of chlorophyll, stomatal conductance and Leaf Index Area
to nitrogen nutrition ……………………………………………..……
4.1.3 Response of biomass production to phosphorus nutrition ……..
4.1.4 Response of chlorophyll, stomatal conductance and Leaf Index Area
to phosphorus nutrition ………………………………………………
11
11
11
11
12
12
12
13
13
14
14
14
15
15
18
18
18
19
21
22
22
22
22
23
23
24
24
27
29
31

vii
4.1.5 Response of biomass production to potassium nutrition ……….
4.1.6 Response of chlorophyll, stomatal conductance and Leaf Index Area
to potassium nutrition ………………………………………………..
4.1.7 Response of biomass production to combined NPK nutrition ……..
4.1.8 Response of chlorophyll, stomatal conductance and Leaf Index Area
to combined NPK nutrition …………………………………………..
4.2 Discussion ………………………………………………………………….
4.2.1 Response of yield and dry matter to nitrogen nutrition …………
4.2.2 Response of chlorophyll, stomatal conductance and Leaf Area Index
to nitrogen nutrition …………………………………………………..
4.2.3 Response of fresh mass and dry mass to phosphorus nutrition …...
4.2.4 Response of chlorophyll, stomatal conductance and Leaf Area Index
to phosphorus nutrition ………………………………………………
4.2.5 Response of fresh mass and dry mass to potassium nutrition …….
4.2.6 Response of chlorophyll, stomatal conductance and Leaf Area Index
to potassium nutrition ………………………………………………..
4.2.7 Response of fresh mass and dry mass to NPK combination nutrition
Chapter 5 Conclusion and recommendations …………………………..
References ……………………………………………………………………..
Appendices
Appendix 1 Analysis of variance (ANOVA) for parameters of N, P, K and NPK
combined nutrition ……………………………………………………
Appendix 2 Ethical clearance ………………………………………………..
Appendix 3 Turn it in report ………………………………………………….
33
35
36
38
39
39
41
42
42
43
45
45
47
48
67
85
86

viii
List of plates
Page
Plate 1 Bed of baby spinach with 5 sub-plots and 5 different treatments of N,
P and K ………………………………………………………………...
Plate 2 Non-destructive method of measuring chlorophyll content using Spad
502 Chlorophyll Meter ………………………………………………..
Plate 3 Leaf Porometer used to determine stomatal conductance in the leaves
Plate 4 Non-destructive LAI-2200C Plant Canopy Analyzer ……………...
18
19
19
20

ix
List of tables
Page
Table 1 Biomass production parameters of baby spinach in response to
nitrogen nutrition ……………………………………………………..
Table 2 Physiological parameters of baby spinach in response to nitrogen
nutrition ………………………………………………………………..
Table 3 Biomass production parameters of baby spinach in response to
phosphorus nutrition …………………………………………………
Table 4 Physiological parameters of baby spinach in response to phosphorus
nutrition ……………………………………………………………….
Table 5 Biomass production parameters of baby spinach in response to
potassium nutrition …………………………………………………..
Table 6 Physiological parameters of baby spinach in response to potassium
nutrition ………………………………………………………………..
Table 7 Biomass production parameters of baby spinach in response to
combined NPK nutrition ……………………………………………..
Table 8 Physiological parameters of baby spinach in response to combined
NPK nutrition …………………………………………………………
26
28
30
32
34
35
37
38
1
CHAPTER 1
Introduction
1.1 Background
Baby spinach (Spinacia oleracea L.) belongs to the family Brassicaceae and is an
annual cool season, green leafy vegetable which is eaten raw (Conte et al. 2008).
Spinach is thought to be native to Southwest Asia where it was first cultivated by the
Persians. It is now cultivated throughout the world, with the exception of the tropics
(USDA, 2005). Depending on the cultivar, the leaves are small (usually no longer
than 6 cm), sweet tender and smoother than semi-savoy or savoy spinach
(Bergquist et al. 2005). Like other leafy greens, baby spinach has a high water
content and is harvested 35 days after planting (DAP) instead of the 40 days or
more required for normal spinach (Rico et al. 2007).
Baby spinach is more expensive than normal spinach and is sold loose rather than
in bunches. It is often used in salads because of its attractive flavour and delicate
texture. The stalks can also be eaten and should not be wasted (Bergquist et al.
2005).
Spinach is a long-day plant that is prone to bolting during summer (Bergquist et al.
2005) but this is not often a problem in the case of baby spinach as the leaves are
harvested early (Will et al. 1998).
High fruit and vegetable intake is known to have a positive impact on human health
and is linked to decreased risk of most of the degenerative diseases associated with
ageing, such as cardiovascular disease (Christen, 2000; Manach et al. 2005; Khaw
et al. 2001; and Arts & Hollman, 2005) Alzheimer’s disease (Commenges et al.
2000), cataracts (Brown et al. 1999), and several forms of cancer (Williamson, 1996;
Liu et al. 2000; Gandini et al. 2000; Liu et al. 2001; Joshipura et al. 2001; & Kang et
al. 2005).
The consumption of baby leaf vegetables such as rocket, lamb’s lettuce, headless
lettuce and spinach is increasing, and they are particularly in demand for mixed
salads, both as fresh market products and ready-to-use vegetables (Bergquist,
2006). The nutritional quality of vegetables can be affected by many pre- and post-

2
harvest factors (Kader, 2008). Fertilisation is one of the most practical and effective
pre-harvest agronomic practices to improve the yield and nutritional quality of crops
for human consumption (Arts & Hollman, 2005).
Baby spinach is a relatively new crop in South Africa where it is becoming
increasingly popular. It is known to be a healthy vegetable with relatively high levels
of bioactive compounds (Gil et al. 1999) such as vitamin C, vitamin A and minerals
(USDA, 2005). In addition to the health benefits mentioned above, baby spinach has
the advantage of a short culture time and shelf life (Bergquist, 2006), making it an
excellent model crop (Ninfali & Bacchioca, 2004). However, there is insufficient data
on the effects of agronomic practices, such as providing mineral nutrition, on the
growth and development of baby spinach.
The aim of this study was therefore to determine the recommended rates of nitrogen
(N), phosphorus (P) and potassium (K) mineral nutrition for optimum growth and
development of baby spinach. After optimum levels for N, P and K nutrition were
determined, the interactive effects of combined NPK nutrition were investigated.
1.2 Problem statement
Baby spinach is a relatively new crop in South Africa with both commercial
significance and reputed health benefits such as reducing the occurrence of various
forms of cancer, cholesterol, cardiovascular disease and osteoporosis in human
beings. The demand for baby spinach in South Africa currently exceeds supply. To
increase yield production, farmers are applying normal spinach fertiliser rates but
these are not recommended for baby spinach since they may have a negative effect
on both yield and health benefits. Data on the recommended application rates of
major nutrients such as N, P and K, and the combination NPK, are not readily
available in South Africa.
1.3 Motivation for the study
Vegetables which require minimum processing and are consumed fresh have
gained in importance and recognition in the worldwide vegetable market (Brecht et
al. 2004). The increase in demand for baby leaf vegetables has resulted in many
farmers gearing their production towards baby vegetables such as baby lettuce,
baby spinach and baby Swiss chard (Vernieri et al. 2006). Baby spinach is known to
have health benefits due to its relatively high levels of bioactive compounds,

3
antioxidants and phytochemicals (Gil et al. 1999). Its consumption is known to have
positive effects on human health and has been linked to decreased risk of most
degenerative diseases associated with ageing (Williamson, 1996), such as heart
disease (Liu et al. 2000), cardiovascular disease (Gandini et al. 2000), Alzheimer’s
disease (Liu et al. 2001) cataracts (Joshipura et al. 2001), and several forms of
cancer (Kang et al. 2005).
The production of baby leafy vegetables has been increasing in South Africa.
However, there is currently no information available in the country on recommended
fertiliser application rates for this crop. It is envisaged that this study will help
farmers understand the optimum fertiliser rates for growing baby spinach and will
contribute to job creation in alignment with the New Growth Path (NGP) Strategy of
the Department of Economic Development of South Africa and the National
Development Plan (Department of Economic Development, 2011), since the
cultivation and harvesting of baby spinach as well as other vegetables is labour
intensive.
1.4 Study aim
The aim of the study was to evaluate the effect of different N, P and K applications
on the growth and development of baby spinach, and, once optimum N, P, and K
fertiliser rates had been established, to investigate the interactive effect of combined
NPK nutrition on the growth and development of the plants.
1.5 Objectives
(1) To determine the effect of applications of N, P and K fertilisers on the growth
and development of baby spinach.
(2) To determine the effect of combined NPK on the growth and development of
baby spinach.

4
1.6 Hypotheses
(1) N, P and K fertilisers have no influence on the growth and development of
baby spinach.
(2) Combined NPK fertiliser has no effect on the growth and development of baby
spinach.
1.7 Ethical considerations
No ethical considerations were discerned in this project. (Appendix 2)

5
CHAPTER 2
Literature review
2.1 Health benefits of baby spinach
High intake of fruit and vegetables is known to have a positive effect on human
health and play a role in alleviating the progressive symptoms of most degenerative
diseases associated with ageing, such as heart disease, cardiovascular disease,
Alzheimer’s disease, cataracts and several forms of cancer (Williamson, 1996; Liu
et al. 2000; Gandini et al. 2000; Liu et al. 2001; Joshipura et al. 2001; & Kang et al.
2005). These benefits have been attributed to the high nutritional value and high
concentrations of bioactive compounds (ascorbic acid, flavonoids and carotenoids)
found in vegetables, partly due to the antioxidative action of some of these
compounds (Bergquist, 2006) as well as minerals and folate (Muller, 1997; & Davey
et al. 2000).
2.2 Nutritional composition of baby spinach
Baby spinach is high in vitamin K, an essential nutrient that contributes to bone
health (Sies, 1997). The major micronutrients in spinach are vitamin A (from beta
(β)-carotene) (Bergquist, 2006), vitamin C (Institute of Medicine, 2000), folate
(Lester & Crosby, 2002), and minerals such as calcium and iron (Zimmermann &
Zentgraft, 2005). Baby spinach plays a role in protecting the mucous membrane of
the stomach (Bergquist, 2006) and can therefore also act as an anti-ulcerative (Lee
& Kader, 2000).
The presence of minerals, vitamins, pigments, phytonutrients, and minerals such as
potassium, manganese, zinc, magnesium, iron and calcium makes baby spinach a
healthy crop for human consumption (Toledo et al. 2003). It is one of the most
nutrient-dense foods in existence, low in calories and high in vitamins (Sies, 1997).
One cup of this leafy green vegetable exceeds the daily dietary requirements for
vitamin K, vitamin A and protein (Lester & Crosby, 2002).
2.2.1 Phytochemicals
Baby spinach is high in β–carotene, a precursor molecule that can be converted into
vitamin A in the body (Edenharder et al. 2001). It is an extremely nutritious

6
vegetable, rich in both core nutrients and phytochemicals such as the carotenoids
(van het Hof et al. 1999; & Castenmiller et al. 1999), β-carotene (ATBC, 1994; and
Omenn et al. 1996), lutein (Bergquist, 2006), zeaxanthin (Demmig-Adams et al.
1996) and phenolic compounds (Borek, 1991). Lutein and zeaxanthin are
carotenoids that act as antioxidants in the body and also help reduce the risk of
cataracts and age-related macular degeneration (Brown et al. 1999). Epo
xanthophyllis which is found in the carotenoids in baby spinach protect against
prostate cancer (Kopsell et al. 2006).
A study in 2006 investigated the correlation between the risk of prostate cancer and
the intake of vegetable, including baby spinach, broccoli, cauliflower, cabbage,
Brussels sprouts, mustard greens, turnip greens, collards and kale. Of all the
vegetables, only baby spinach was found to provide significant protection against
aggressive prostate cancer, defined as Stage III or IV prostate cancer with a
Gleason score of at least 7 (Kopsell et al. 2006; & Asia et al. 2004).
Another study revealed that women who consumed baby spinach more than twice a
week were less likely to develop breast cancer than women who did not consume
any (Longnecker et al. 1997).
Studies of the role of normal spinach or spinach extracts in the development of
cancer in mice have also shown that the number of induced papillomas in a cancer
were reduced through the topical and oral administration of a water-soluble spinach
extracts (Nyska et al. 2001). Neoxanthin from spinach inhibited the proliferation of
prostate cancer cells in a laboratory study (Kopsell et al. 2006), and 13 flavonoids
from spinach showed anti-mutegenic activity in a bacteria-based model (Asia et al.
2004). Folate, tocopherol and chlorophyllin are constituents of spinach which are
useful in treating and prevention against a variety of cancers such as bladder, liver
and lung cancer (Edenharder et al. 2001).
2.2.2 Chlorophyll content
Some research suggests that chlorophyll binds to mutant DNA and prevents it from
proliferating, which is an important factor in prevention of cancer, when combined
with vitamin C content (Forman & Altman, 2004), chlorophyll may be used as a
parameter for fresh-cut vegetable quality evaluation (Ninfali & Bacchiocca, 2004).

7
2.2.3 Amino acids and coenzymes
Glutathione, an extremely important endogenous antioxidant synthesised within the
body, is relatively rare in foods but is found in baby spinach. One of its major
functions is to protect DNA from oxidation but it also detoxifies carcinogens, boosts
the immune system, supports liver health and reduces inflammation. The enzyme
glutathione, which is reductase dependent, is usually reduced back to ascorbic acid
and α-lipoic acid which are vital antioxidants largely synthesised in the body but also
present in some foods (Davey et al. 2000). Glutathione is a cysteine-containing
peptide found in most forms of aerobic life. Although it is not a dietary requirement, it
is synthesised in the cells from its constituent amino acids (Hamid et al. 2010). It is
important for energy metabolism and its antioxidant activity may provide protection
against chronic diseases. Another endogenous compound, coenzyme Q10, is a
critical component in energy metabolism (Demmig-Adams et al. 1996) but also acts
as an antioxidant in cell membranes and lipoproteins (Lopez-Ayerra et al. 1998).
The best food sources of protein are meat, fish and oils, but spinach is one of the
best vegetable sources (Rico et al. 2007). Blood cholesterol may be lowered by
consuming D-glucaric acid (Joseph et al. 2002).
Due to limited research, betaine is not a well-known compound. It is found in
microorganisms, plants and animals and is a significant component of many foods
including baby spinach (Sakamoto et al. 2002; & Zeisel et al. 2003). It is thought that
cardiovascular disease may be prevented by lowering the levels of homocystein
which is a compound associated with the development of heart disease (Joseph et
al. 2002). By reducing vascular risk factors, enhancing performance and protecting
internal organs, betaine has proven itself to be an important nutrient in the
prevention of chronic disease (Stuart & Graig 2004). Tokar & Berg (2002) found that
the accumulation of fat in the liver, which affects liver metabolism such that it can
contribute to the development of a number of diseases including coronary, cerebral,
hepatic, and vascular diseases, may be prevented or reduced by consuming
betaine. Studies of healthy and diabetic humans show that a high-fat diet leads to
hepatic steatosis (Abdelmalek et al. 2001) which can be prevented by the ingestion
of beatine (Zhu et al. 2003 & Neuschwander- Tetri, 2001).

8
2.2.4 Carotenoids
Carotenoids are yellow, orange or red pigments found in fruits, flowers and green
vegetables which are responsible for colour development (Muller, 1997), although
the colour of carotenoids is generally disguised by chlorophyll. Carotenoids are
tetraterpenoids, which are built upon a 5-carbon isoprenoid unit, and are
hydrophobic (Krinsky & Johnson, 2005). There are two groups of carotenoids, the
hydrocarbon carotenes and the oxygenated xanthophylls (Demmig-Adams et al.
1996). Carotenes, such as α- and β-carotene and lycopene, are predominantly
orange or red-orange pigments, whereas xanthophylls, such as lutein, viloaxanthin,
zeaxanthin, antheraxanthin and neoxanthin are primarily yellow (Asplund, 2002).
Carotenoids play a role in photosynthesis as accessory pigments absorbing light
energy and transforming it into chlorophyll (Demmig-Adams et al. 1996).
Carotenoids are easily absorbed in the body if accompanied by a small amount of
oil or fat in a meal (Hedges & Lister, 2007). A study conducted with humans
demonstrated that serum carotenoid concentrations as well as macular pigment
optical density (a possible predictor of macular degeneration) increased with an
increase in the consumption or intake of spinach carotenoids (Kopsell et al. 2006).
2.2.5 Flavonoids
Flavonoids are compounds with yellow to white or blue, and purple to red colours
which are often referred to as polyphenols (Lister, 1999 & Kris-Etherton et al. 2002).
Baby spinach contains more than a dozen flavonoid compounds with anti-
inflammatory and anti-cancerous properties which serve as antioxidants (Greenberg
et al. 1996 & Kolb et al. 2001).
Various factors such as food matrix, human intestinal micro-flora and flavonoid
structure determine the bioavailability of flavonoids (Manach et al. 2005). Studies
conducted on the epidemiology of flavonoids indicated that they lower the risk of
coronary heart disease and dementia (Hertog et al. 1995 and Knekt et al. 1996;
Commenges et al. 2000 & Neuhouser et al. 2004).
Factors such as genotype (Cieslik et al. 2006 and Kalt et al. 2001), growing
conditions (Cao et al. 1996), growth stage (Prior et al. 1998), postharvest handling
(Wang & Zheng 2001) and storage conditions (Kalt et al. 1999) determine the level
of flavonoid content in plants (Patil et al. 1995 & Howard et al. 2002). However,

9
baby spinach contains more than a dozen individual flavonoid compounds, which
work together as cancer fighting antioxidants (Houstis et al. 2006) by neutralising
free radicals in the body. A study conducted in Europe showed fewer cases of
breast cancer among women who ate baby spinach regularly (Kris-Etherton et al.
2002); (Le Marchad, 2002 & Neuhouser, 2004). Skin and stomach cancers in
laboratory animals were reduced by a diet with spinach extracts (Fico et al. 2000 &
Vogt & Gulz, 1994).
2.2.6 Antioxidants
Most of the flavonoid and carotenoid nutrients found in baby spinach that have anti–
inflammatory properties, provide antioxidant benefits (Lurie, 2003). Baby spinach is
an excellent source of other antioxidant nutrients such as vitamin C, vitamin E, β-
carotene, manganese, zinc and selenium, which help reduce the risk of numerous
health problems associated with oxidative stress (Lampe, 1999). Human blood
vessels are susceptible to damage from oxidative stress, but this may be reduced
by consuming baby spinach which contributes to reduced risk of several blood
vessel related problems, including atherosclerosis and high blood pressure (Teddy
& James, 2008).
A number of studies have shown that baby spinach has strong antioxidant activity
and high levels of antioxidant compounds such as phenolics and carotenoids (Fico
et al. 2000). Ascorbic acid reported in baby spinach is a well-known antioxidant and
enzyme co-factor with many roles in human health (Hedges & Lister, 2007).
One of the major health benefits attributed to two major compounds in baby
spinach, lutein and zeaxanthin, is that of protection against eye diseases such as
macular degeneration and the gradual loss of central vision associated with old age
(Teddy & James, 2008). According to research conducted at Oak Ridge National
Laboratory in 1993, consumption of baby spinach can lead to regaining two
pigments, inter alia Retinis pigmentosa, and preventing age-related macular
degeneration. Beta-carotene, lutein and xanthenes found in baby spinach are
beneficial for eyesight (Bird et al. 1995) and prevent vitamin A deficiency disease
(Seddon et al. 1992), itchy eyes (Bird et al. 1995) eye ulcers and dry eyes
(Neuhouser, 2004).

10
Epidemiological and laboratory studies have also shown that normal spinach,
spinach extracts and spinach compounds may delay or retard age-related loss of
brain function, reduce the extent of post-ischaemic stroke damage to the brain, and
protect against cancer through various different mechanisms (Hedges & Lister,
2007).
The study which involved feeding young rats a freeze-dried aqueous spinach extract
and observing changes related to mental function as they aged, showed that a diet
with spinach extracts retarded age-related decline the most. Although two groups of
rats had been fed other diets high in antioxidants (strawberry extracts or vitamin E
supplements), the beneficial effects were most pronounced in the spinach-fed group
(Joseph et al. 1998).
A further study demonstrated that various antioxidants found in baby spinach
extracts reversed the age-related decline of neuronal behavioural parameters
(Joseph et al. 1999).
Wang et al. (2005) reported that rats fed a diet supplemented with baby spinach
showed reduced symptoms of post-ischaemic stroke and brain damage. Lowered
blood pressure was noticed in spontaneously hypertensive rats fed peptides isolated
from leaf rubisco, which has been shown to have anti-cholinesterase (ACE)
inhibitory properties (Joseph et al. 1998).
Spinach has high potassium content and low sodium content (Lampe, 1999). This
mineral composition is very beneficial for patients with high blood pressure, as
potassium lowers blood pressure while sodium raises it. The folate present in
spinach may contribute to the maintenance of proper blood flow, relaxation of blood
vessels and reduced levels of hypertension (Yang et al. 2003).
2.3 Other health benefits of baby spinach
2.3.1 Skin protection
Various phytonutrients and pigments found in baby spinach have been shown to
protect the skin from harmful rays of the sun, including the Ulta-Violet rays. These
not only protect the skin but repair damaged genes to some extent, thereby
preventing skin cancer in the long run (Hedges & Lister, 2007).

11
2.3.2 Foetus development
A growing foetus needs the folate found in baby spinach for proper development of
the new nervous system. In its absence, the foetus is likely to suffer from defects
such as cleft palate or spina bifida (Bergquist et al. 2006). Pregnant mothers are
advised to consume the vitamin A found in baby spinach in larger quantities in order
to enhance lung development in the foetus (Halliwell & Gutteridge, 1989).
2.3.3 Cardiovascular health
Research conducted by Whole Foods indicated that baby spinach is an excellent
promoter of cardiovascular health. The antioxidant properties (water-soluble vitamin
C and fat-soluble β-carotene) work together to promote good cardiovascular health
by preventing the harmful oxidation of cholesterol, which is a danger to the heart
and arteries (Halliwell & Gutteridge, 1989). The magnesium in baby spinach
reduces blood pressure levels (Reams, 2002).
An anti-oxidant component of baby spinach, factor C0-Q10, plays an important role
in strengthening muscles, especially the heart muscle which continuously pumps
blood to all parts of the body. The C0-Q10 can be useful in the prevention and
treatment of many cardiovascular diseases such as hyperlipidemia, heart failure,
hypertension and coronary heart diseases (Halliwell & Gutteridge, 1989).
2.3.4 Bone development
The vitamin K found in baby spinach functions to retain calcium in the bone matrix,
resulting in bone mineralisation. Its role extends beyond supporting blood clotting to
include a role in bone metabolism, and it also offers potential protection against
osteoporosis (Shearer et al. 2004). Minerals such as manganese, copper,
magnesium, zinc and phosphorus also help in the building of strong bones, thus
helping to osteoporosis (Joseph et al. 2002).
2.4 Factors affecting the growth of and nutrients in baby spinach
The amount of core nutrients and other phytochemicals in food is determined by
factors such as climatic conditions, the plant variety or cultivar, agronomic issues
such as soil type, cultivation protocols such as irrigation, pest control, fertiliser use
and maturity at harvest, as well as processing practices such as harvesting, storage
and processing methods (Howard et al. 2002).

12
2.4.1 Climatic conditions
Baby spinach is a quick maturing, cool season vegetable crop. Seed germinates at
2° to 30°C, but 7°to 24°C is optimal (Bergquist, 2006). The plant grows in conditions
of 5° to 30°C, but growth is accelerated at 15° to 18°C (Meyer & Anderson, 1952).
Baby spinach can withstand low temperatures of -9° to -6°C without significant
damage (Conte et al. 2008). Freezing temperatures do damage small seedlings and
young plants, but more mature plants can tolerate sub-freezing temperatures for
weeks (Bergquist et al. 2005).
2.4.2 Edaphic factors
A variety of soils are used for spinach production, but in most regions sandy loam is
preferred (Abdelmalek et al. 2001). Baby spinach is particularly sensitive to
saturated soil conditions and is also moderately salt sensitive. Spinach grows best
in slightly acid to slightly basic soil (pH 6-7.5) but some very successful production
occurs in soils with a pH of above 8.0 (Nonnicke, 1989).
2.4.3 Cultivars
In California, the smooth or flat leaf spinach cultivars are grown almost exclusively,
although some semi-savoy varieties are also cultivated. All baby spinach cultivars
commercially grown in California are hybrids, primarily because resistance to
disease and bolting has been bred into the hybrids. Increasing day length,
maintaining high temperatures and ensuring adequate fertilisation and irrigation
keep bolting to a minimum (Joseph et al. 2002). The most common baby spinach
cultivars grown in South Africa are Ohio, Virofla, Corvette and Corvairt (Hygrotech
Seed Company, South Africa). The leaves are small (usually no longer than 6 cm),
sweet tender and smoother than semi-savoy or savoy spinach (Bergquist et al.
2005).
2.4.4 Planting
Baby spinach is direct seeded either into the soil or into planting trays. The
Californian industry is known for using very high seed planting densities and a large
number of seed lines per bed. In general, baby clipped spinach is only planted in 80
inch (203 cm) wide beds. Spinach seed is planted ½ to ¾ inch (1.2 to 1.9 cm) deep,
depending on the method of planting and the soil conditions (Patil et al. 1995). In
California, baby spinach is usually picked 35 days after planting (DAP) as opposed

13
to the 45 DAP for normal spinach (Bergquist, 2006). In South Africa, there is no data
that is used as recommendations for planting baby spinach due to the fact that it is
fairly a new crop.
2.4.5 Irrigation methods
Depending on initial soil conditions, 5-10 cm of water is applied by means of
sprinklers to moisten the soil for tillage and seedbed preparation. All baby spinach
fields in California are sprinkler irrigated to germinate the seed. Two to three
irrigations are required between seeding and emergence. Short sprinkler use is
recommended every 2 days until emergence to prevent the formation of a soil crust
and to replace moisture lost by evaporation (Joseph et al. 2002). Many studies have
reported that, with several species, water deficiency typically results in depressed
plant growth, decreased plant quality and decelerated maturation with low
marketable yield (Guichard et al. 2005; Ho, 1996b; and Miras-Avalos et al. 2013).
However, In South Africa, there is no data on irrigation guidelines that is used as
recommendations for planting baby spinach due to the fact that it is fairly a new
crop.
Baby spinach has a relatively shallow root system and thrives on frequent, short
irrigations that maintain a uniformly moist soil for maximum leaf production
(Bergquist, 2006). However, care must be taken to avoid saturated conditions as the
plants are sensitive to overwatering, particularly in the case of heavy soil textures.
Saturated conditions can contribute to soil-borne diseases and to abiotic rotting of
the roots, crown, and lower leaves (Bergquist, 2006).
2.4.6 Fertilisation
Baby spinach needs applications of the major fertilisers (N, P and K) at the right
time and in the right quantities to deliver the best yield. Fertiliser is a concentrated
form of food as compared with bulky conditioners and organic manures. Baby
spinach is moderately fertilised, and the fertiliser rate should be determined taking
soil type, recent cropping history and soil test results into account (Lucier et al.
2004).

14
2.4.6.1 Nitrogen
Baby spinach is a short season crop that is harvested when the crop is young. As a
result, the nutrient uptake is relatively low. For instance, the nitrogen (N) content of
baby spinach may vary between 20 and 40 pounds per acre (22 to 45 kg/ha) in
Californian soils (Gastal & Lemaire, 2002). Baby spinach is a medium to heavy
nitrogen feeder, and since the application of nitrogen encourages leaf growth, it is
useful for promoting the growth and development of baby spinach and other leafy
vegetables (Bergquist et al. 2006). The effects of N fertilisation on vegetable yields
have long been recognised and clearly demonstrated (Collins & McCoy, 1997; and
Blom-Zandstra, 1989). Nitrogen fertilisation increases foliage which reduces light
intensity around the plant, which in turn may affect the concentration of flavonoid
compounds (Mozafar, 1994 and Lee & Kader, 2000). Nitrogen is the most abundant
element in plants. It plays a role as a constituent of protein, nucleic acids,
chlorophyll and growth hormones (Barker et al. 1974). Adequate N application is
very important for optimising crop yields, but excessive applications may lead to
groundwater contamination (Jaynes et al. 2001). Nitrogen deficiency is
characterised by an immediate decrease in growth rate and a loss of chlorophyll
from the leaves so that they become light green progressing to yellow. Continuous
N stress may cause the entire plant to appear yellowish-green or yellow (Blom-
Zandstra, 1989).
2.4.6.2 Phosphorus
Phosphorus (P) applications should be determined on the basis of soil test results
for bicarbonate extractable phosphorus. Levels above 60 parts per million (ppm) are
adequate for spinach growth. In the case of soils with levels below this (particularly
in winter), pre-planting applications of 20-40 pounds per acre of P2O5 (22 to 45
kg/ha) are recommended in California. Baby spinach seedlings require phosphate
for healthy root growth (Colomb et al. 2000). Phosphorus is one of the indispensable
elements for plants, and the application of P fertiliser promotes root growth,
enhances utilisation of soil nutrients and water by the plants, and ultimately
increases crop yields (Gao et al. 1989 and Li et al. 1995). While P fertilisation is
essential for improving growth and increasing crop yields, excessive P can have a
negative effect on vegetable yields and quality (Jia et al. 1997). Although

15
phosphorus is indispensable for plants, plant responsiveness to P fertilisation
depends on the soil available P and on the crop species.
2.4.6.3 Potassium
Soil tests can also be used to determine Potassium (K) requirements. Soil with more
than 120 ppm of ammonium acetate exchangeable potassium has sufficient
quantities for a crop. Approximately 63-138 kg/ha is adequate for maintaining soil
fertility for fresh baby spinach in California; fertilisation rates above that level have
no impact on the yield and are considered economically wasteful. Flowering, fruiting
and good plant colour can be encouraged by applying potash (Britto & Kronzucker,
2008). Potassium is one of the principal plant nutrients required for crop yield and
quality (William, 2007). It plays a role in physiological processes, water retention,
photosynthesis, assimilation and enzyme activation. Potassium deficiency leads to a
reduction in the number and size of leaves produced (Britto & Kronzucker, 2008).
However, the total amount of potassium absorbed by the crop depends on the crop
grown, the amount of native soil K+, the amount of K fertiliser applied, potassium
availability in the soil, environmental conditions and the crop management practices
employed (Mullins & Burmester, 1998).
2.4.7 Fertiliser application methods
As a general rule, side dressing with a nitrogen fertiliser when the plants are one-
third grown is recommended. Baby spinach growth is slow in the beginning and
accelerates during the final 21 days before harvest (Bergquist, 2006).
2.4.8 Harvesting
Baby spinach has leaves which are relatively small (7.5-10cm) and it is harvested
35 days after planting. Harvested spinach can be kept in a polypropylene bag in a
cold room (USDA, 2005).
The timing of harvesting is important as the concentrations of bioactive compounds
can vary greatly through the course of the day due to variations in water content
(when concentrations are given on a fresh weight basis) or in light intensity
(Mozafar, 1994). Harvesting must be done with care to avoid mechanical injury to
the plants which may also have an impact on the concentrations of bioactive
compounds (Lucier et al. 2004).

16
2.4.9 Postharvest handling
Baby spinach is quite perishable and will yellow if stored at higher than the
recommended temperatures (0º-5ºC). However, the primary cause of postharvest
losses is decay associated with mechanical damage during harvest and postharvest
operations. The small surface-to-weight ratio and very high respiration rate of baby
spinach means that it must be cooled rapidly to prevent excessive weight loss and
wilting (Ferrante et al. 2004). After harvest, baby spinach is sensitive to ethylene
which increases yellowing and may result in leaf decay, and is also moderately
sensitive to freezing injury after harvest (Allende et al. 2004). Strong off-odours,
decay caused by breakage, and softening tissue are considered to be major
problems associated with baby spinach (Medina et al. 2012). Experience has shown
that tissue with a high respiratory rate and/or low energy reserves has a shorter
shelf life (Rico et al. 2007).
2.4.10 Storage
The recommended storage temperature for baby spinach is 0°-5° C, and it is usually
stored in polypropylene bags. In store displays, however, it is kept at higher
temperatures for a maximum storage time of 10 days (Lucier et al. 2004).
The limited storage time of leafy vegetables is due to their relatively high respiration
rates and large surface-to-volume ratio (Toledo et al. 2003; Wills et al. 1998; and
Rico et al. 2007). However, storability can be significantly improved by lowering
temperatures and increasing humidity, thereby modifying the surrounding
atmosphere (Wills et al. 1998). The advantage of storing at a lower temperature is
that it significantly slows down the loss of ascorbic acid and carotenoid content
(Kalt, 2005). However, the ascorbic acid content of spinach quickly decreases
during storage at ambient temperature (Beuscher et al. 1999), which may cause
freezing injury (Wills et al. 1998). Too low temperature decreases metabolic rates
and thereby fastens deterioration. The produce or crop will eventually wilt and
change in colour or decay due to low temperature.
2.5 Summary
High intake of fruit and vegetables is known to have a positive effect on human
health and helps to combat most of the degenerative diseases associated with
ageing, such as heart disease, cardiovascular disease, Alzheimer’s disease,

17
cataracts and several forms of cancer. These protective benefits have been
considered to be due to the high nutritional value and high concentrations of
bioactive compounds (ascorbic acid, flavonoids and carotenoids) found in
vegetables, partly as a result of the antioxidative action of some of these
compounds.
The presence of minerals, vitamins, pigments, phytonutrients and minerals like
potassium, manganese, zinc, magnesium, iron and calcium make baby spinach a
healthy crop. Various phytonutrients and pigments found in baby spinach have been
shown to protect the skin from harmful rays of the sun, including Ultra-Violet rays.
Growing foetuses need the folate found in baby spinach for the proper development
of the nervous system. Without it, a foetus is likely to suffer from defects such as
cleft palate or spina bifida.
Baby spinach needs applications of the major fertilisers (N, P and K) at the right
time and in the right quantities for optimal growth and development. Harvesting must
be done with care to avoid mechanical injuries that may negatively affect the
concentrations of bioactive compounds. The primary cause of postharvest losses is
decay associated with mechanical damage during harvest.
18
CHAPTER 3
Research design and methodology
3.1 Materials and methods
3.1.1 Experimental site
The trial was conducted at the Agricultural Research Council Vegetable and
Ornamental Plant Institute situated about 25 km north of central Pretoria on the
Moloto/KwaMhlanga Road (R573), GPS coordinates 25º 59” S; 28º 35” E. The farm
covers approximately 4000 ha, of which only 650 ha is under irrigation. Baby
spinach cultivar (cv.)
3.1.2 Experimental design and treatment details
Three parallel trials using N, P and K were arranged in a randomised complete
block design (RCBD) with 5 treatments, each replicated 4 times. In all the
experiments, the sub-plots were 2.2 x 2.2 m in size, comprising 3 rows with 10
plants each, making a total of 30 plants per sub-plot/treatment, with inter-row
spacing of 20 cm, and intra-row spacing of 10 cm as shown in Plate 1.
Baby spinach cv. Ohio was planted in the seedling trays filled with planting medium
on 9 March 2014. Germination took place 5 days later and transplanting was done
after 2 weeks when the plants each had 4 leaves. Nitrogen and phosphorus
treatments consisted of 0, 45 kg/ha, 75 kg/ha, 105 kg/ha; 120 kg/ha. Potassium
treatments consisted of 0; 63 kg/ha; 85 kg/ha; 127 kg/ha; 148 kg/ha. The fertilisers
were applied 2 weeks after planting. After parallel N, P and K trials, the combined
NPK trial was conducted, consisting of 5 treatments, viz. 0; 30:30:48 kg/ha;
45:45:63 kg/ha; 60:60:78 kg/ha; 75:75:93 kg/ha. The rates were based on the
recommended rates used in California where baby spinach is grown in abundance.
All the trials were repeated twice.
The experiment was conducted on virgin soil hence no soil analysis was done. Lime
ammonium nitrate (28% N kg/ha) was applied as the N fertiliser source, phosphorus
was supplied in the form of super phosphate (83% P kg/ha), and potassium was
supplied in the form of potassium chloride (50% K kg/ha). The baby spinach was

19
irrigated based on the soil moisture conditions for a period of 2.5 hours per irrigation
using sprinkler irrigation.
3.1.3 Data collection
Data plants (middle row plants) were sampled at 35 days after planting (DAP).
Parameters recorded were biomass production (fresh mass, dry mass, root length,
fresh root mass, dry root mass), chlorophyll content, stomatal conductance above,
stomatal conductance below, leaf area index (LAI), leaf protein percentage, total leaf
nitrogen/phosphorus/potassium and leaf nitrate.
Plate 1: Bed of baby spinach with 5 sub-plots and 5 different treatments of N, P and K
At harvest, the fresh mass was oven dried at 35ºC for 24 hours and then weighed
to determine the total biomass (dry matter). In the N, P and K treatments, the roots
were washed clean of soil particles, weighed and oven dried at 35˚C for 24 hours
after which the root dry mass was measured.
The chlorophyll content was measured using a non-destructive method with a Spad
502 Chlorophyll Meter designed by Minolta Camera Co. Ltd., Japan as shown in
Plate 2. Chlorophyll levels are a key indicator of plant health.
Stomatal conductance was measured by means of the steady state method using
the SC-1 Leaf Porometer designed by Decagon Devices USA as shown in Plate 3.

20
This determines stomatal conductance by measuring actual vapour flux from the
leaf through the stomates.
Plate 2: Non-destructive method of measuring chlorophyll content using Spad 502
Chlorophyll Meter
Plate 3: Leaf Porometer used to determine stomatal conductance in the leaves
21
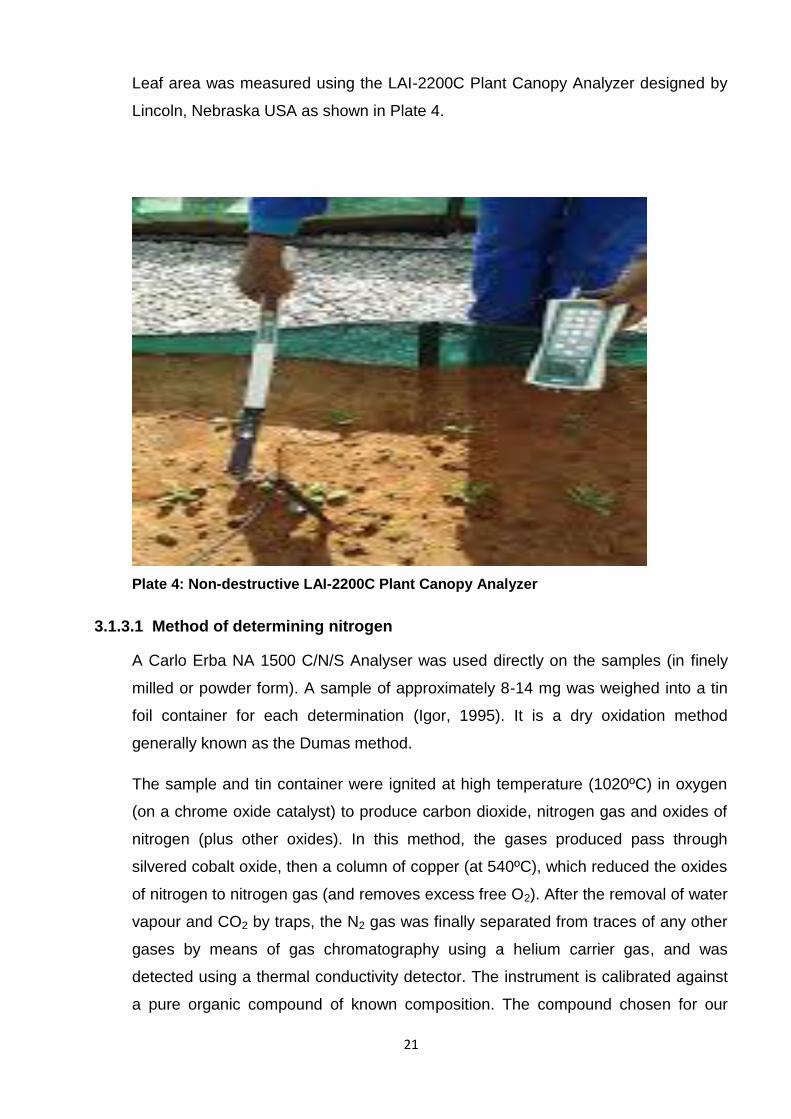
Leaf area was measured using the LAI-2200C Plant Canopy Analyzer designed by
Lincoln, Nebraska USA as shown in Plate 4.
Plate 4: Non-destructive LAI-2200C Plant Canopy Analyzer
3.1.3.1 Method of determining nitrogen
A Carlo Erba NA 1500 C/N/S Analyser was used directly on the samples (in finely
milled or powder form). A sample of approximately 8-14 mg was weighed into a tin
foil container for each determination (Igor, 1995). It is a dry oxidation method
generally known as the Dumas method.
The sample and tin container were ignited at high temperature (1020ºC) in oxygen
(on a chrome oxide catalyst) to produce carbon dioxide, nitrogen gas and oxides of
nitrogen (plus other oxides). In this method, the gases produced pass through
silvered cobalt oxide, then a column of copper (at 540ºC), which reduced the oxides
of nitrogen to nitrogen gas (and removes excess free O2). After the removal of water
vapour and CO2 by traps, the N2 gas was finally separated from traces of any other
gases by means of gas chromatography using a helium carrier gas, and was
detected using a thermal conductivity detector. The instrument is calibrated against
a pure organic compound of known composition. The compound chosen for our

22
calibration standard was the ethyl ester of 4-aminobenzoic acid, which contains
8,48% N. PeakNet software (Dionex Corporation, May 1998), with an external A/D
interface (UI20 Universal Interface, Dionex) was used for data collection, peak
integration, calibration and computation of concentrations (Dionex Corporation,
1998).
3.1.3.2 Leaf tissue phosphorus concentrations
Phosphorus was determined using method described by Mudau et al. 2005
3.1.3.3 Leaf tissue potassium concentrations
Potassium was determined using method described by Mudau et al. 2005
3.1.3.4 Sample extraction for nitrate and nitrite
A sub-sample of the sample was extracted with distilled water, using a 0.2 g sample
to 50 ml of water and shaken on a mechanical shaker for 30 minutes before filtering.
For the N control sample, only 0.096 g was used instead of 0.2 g as there was
insufficient sample available. The water extract solution was analysed using ion
chromatography which detects nitrate as well as most of the other major anions
(nitrite, chloride, fluoride, sulphate, etc.) by separating the anions on an ion
exchange column and detecting them with a conductivity detector. The nitrite was
below the detection limit for all samples. The nitrate N was calculated from the N
using a factor of 0.226, which is the mass of an N atom divided by the mass of NO3
(N atom + 3 O atoms) (Zasoski & Burau, 1977).
3.1.3.5 Computation of protein N and protein
The protein N was estimated by subtracting the nitrate N from the total N. This
estimate is expected to be slightly too high, because chlorophyll N, ammonium N
and any other possible forms of non-protein N (other than nitrate) have not been
excluded. While values for chlorophyll were available, these were on a mass/unit
area basis, not a mass/mass basis; therefore without the thickness and density of
the leaves, they could not be converted to a mass/unit mass basis. From the
estimate of non-protein N, the protein was estimated by using a factor of 6.25. This
is the default factor usually used for the conversion of N to protein when the correct
factor for the product of interest is unknown. It is based on the assumption that the

23
protein contains 16.0% N. However, this factor of 6.25 is more appropriate for meat
products. Many types of plant protein have a higher percentage of N than 16.0%, so
the best protein factor for many plant products is slightly less than 6.25, and for
some plant types, slightly below 6.0 (Jimenez & Ladha, 1993).
3.1.3.6 ICP-OES determination of phosphorus and potassium
An aliquot of the digest solution was used for the ICP-OES (Inductively Coupled
Plasma Optical Emission Spectrometric) determination of P and K. The ICP-OES is
a multi-element instrument. The instrument used (Varian Liberty Series II) is a
sequential instrument, where the elements are determined almost simultaneously,
with only a few seconds between each element. Each element was measured at an
appropriate emission wavelength, chosen for high sensitivity and lack of spectral
interference. The wavelengths used were P: 213.618 nm and K: 769.896 nm.
The instrument was set up and operated according to the procedures recommended
in the instrument manual. It was calibrated against a series of standard solutions,
containing all the elements of interest in the proportions found in typical leaf
samples. (Unpublished method developed by Mike Philpott at ARC-ISCW based on
the procedures recommended in the instrument manual (Liberty Series, 1997)).
3.1.4 Statistical analysis
Data were subjected to analysis of variance (ANOVA) using the Statistical Analysis
System Version 8.0 (SAS Institute, 2003) (See Appendix 1). In all the trials,
treatment sums of squares were partitioned into linear and quadratic polynomial
contrasts for all the variables to be measured. The mean separation was done using
Turkey’s test for the sake of completeness, despite the fact that the trials were
evaluating responses.

24
CHAPTER 4
Results and discussion
4.1 Results
4.1.1 Response of biomass production to nitrogen nutrition (Table 1)
Fresh mass
Nitrogen applied quadratically increased fresh mass, reaching maximum at 75
kg/ha. The difference between the highest and lowest mean values on fresh mass
was 33.38 g per plant.
Dry mass
The dry matter showed a similar trend to that of fresh mass, reaching maximum at
75kg/ha. The difference between the highest and lowest mean values was 7.96 g
per plant.
Root length
Nitrogen applied significantly increased root length (21.50 cm), reaching maximum
at 75 kg/ha. The difference between the highest and lowest mean values on root
length was 7.00 cm.
Fresh root mass and dry root mass
The application of different nitrogen levels did not have any significant effect on root
mass.
Leaf Protein N %
Nitrogen applied linearly increased the percentage protein content to 4.26% of the
baby spinach as compared to the control. The significant increases varied with the
applications of 0 to 45kg/ha. The difference between the highest and lowest values
was 2.90%.
Total Leaf N %
Percentage leaf nitrogen of the baby spinach showed a significant increase at 45
kg/ha. The difference between the highest value and lowest value was 3.2%.
Leaf Nitrate %
Where high nitrogen treatment was applied at 120 kg/ha, a significant percentage
increase in the nitrate content level of 1.33% was observed. The difference between
the highest and lowest values was 1.31%.

25
Leaf Protein %
All treatments linearly increased the percentage leaf protein contents compared to
the control. The difference between the highest and lowest leaf protein percentage
values was 18.3%.

26
Table 1: Biomass production parameters of baby spinach in response to nitrogen nutrition
Applied
nitrogen
(kg/ha)
Fresh
mass
(g) per
plant
Dry mass
(g)per
plant
Root
length
(cm)
Fresh
root
mass
(g)per
plant
Dry
root
mass
(g)per
plant
Leaf
protein
N %
Total
leaf
N %
Leaf
nitrate%
Leaf
protein
%*
0 12.43d 2.33c 14.50b 1.84a 0.460a 1.34b 1.34b 0.02b 8.3b
45 37.62ab 5.43b 16.00b 0.54a 0.150a 4.01a 4.01a 0.04b 25.0a
75 45.81a 10.29a 21.50a 0.47a 0.115a 4.26a 4.31a 0.23b 26.6a
105 27.89bc 10.20a 20.50a 0.92a 0.315a 4.22a 4.34a 0.57b 26.3a
120 21.49cd 8.91a 15.00b 0.37a 0.090a 4.22a 4.54a 1.33a 26.5a
LSD (5%) 13.501 3.049 3.268 2.185 0.563 2.56 2.56 0.020 15.70
Significance
level
0.0014 0.0003 0.0011 0.5918 0.5804 0.001 0.012 0.023 0.001
Response Q** Q** Q** NS NS L** L** L** L**
NS,*, **Linear or quadratic (Q) effects non-significant (ns) or significant at P ≤ 0.05 or 0.01.

27
4.1.2 Response of chlorophyll, stomatal conductance and Leaf Area Index to
nitrogen nutrition (Table 2)
Chlorophyll content
Nitrogen treatments ranging 0 to 75 kg/ha quadratically improved chlorophyll
content. The difference between the highest and lowest mean values for chlorophyll
was 286.7 nm.
Stomatal conductance - adaxial (upper)
Nitrogen treatments also improved the upper stomatal conductance. Plants not fed
with nitrogen did not open the stomatal conductance compared to those where
nitrogen treatments were applied. The difference between the highest and lowest
mean values was 382.7 mmol/m2/s-1.
Stomatal conductance - abaxial (lower)
The results showed a significant increase at very high levels of nitrogen application,
reaching maximum at 120 kg/ha. The difference between the highest value and
lowest mean values was 183.97 mmol/m2/s-1.
Leaf Area Index
There was a linear response to different levels of nitrogen, ranging from 0 to 120
kg/ha. The difference between the highest and lowest mean values was 1.35 per
plant.

28
Table 2: Physiological parameters of baby spinach in response to nitrogen
nutrition
Applied
nitrogen
(kg/ha)
Chlorophyll
content
(nm)
Stomatal
conductance
(upper)
(mmol/ m2/s)
Stomatal
conductance
(lower)
(mmol/m2/s)
Leaf Area
Index
0 151.08c 815.0b 743.73b 2.90b
45 338.38a 907.2a 819.48a 3.58a
75 437.78a 1197.7a 781.93a 3.78a
105 370.85a 937.5a 866.30a 4.08a
120 233.50b 865.3b 921.70a 4.25a
LSD (5%) 143.73 292.46 171.9 1.1227
Significance
level
0.0050 0.001 0.001 0.001
Response Q** Q** L** L**
NS,*, **Linear or quadratic (Q) effects non significant (ns) or significant at P ≤ 0.05,
0.01 or 0.001.

29
4.1.3 Response of biomass production to phosphorus nutrition (Table 3)
Fresh mass
The results showed that phosphorus application quadratically increased the fresh
mass of baby spinach, reaching maximum at 75 kg/ha. The significant increases
varied with the applications of 0 to 75 kg/ha P. The difference between the highest
and lowest mean values was 10.29 g per plant.
Dry mass
The results showed that phosphorus fertiliser application quadratically increased the
dry mass of baby spinach, reaching maximum of 75 kg/ha. The significant increases
varied with the applications of 0 to 75 kg/ha P. The difference between the highest
lowest mean values was 2.45 g per plant.
Root length
Different rates of phosphorus applied did not have a significant influence on the root
length of the baby spinach.
Fresh root mass and dry root mass
Applied phosphorus did not exhibit any significant influence on either fresh or dry
root mass.
Leaf Protein P %
The results showed that phosphorus applied linearly increased the leaf protein P
percentage in the baby spinach leaves. Significant increases varied with the
applications of 0 to 45 kg/ha. The difference between the highest and lowest leaf
protein percentages was 0.42%.
Total Leaf P %
Applied phosphorus treatments linearly increased total leaf phosphorus percentage
in the baby spinach. The difference between the highest total and lowest total leaf P
percentages was 2.17%.
Leaf Nitrate %
Different rates of phosphorus applied did not have a significant influence on the leaf
nitrate percentage of baby spinach.
Leaf Protein %
The results showed that phosphorus applied linearly increased the percentage leaf
protein in the baby spinach leaves from 45 kg/ha. The difference between the
highest and lowest leaf protein percentages was 13.5%.

30
Table 3: Biomass production parameters of baby spinach in response to phosphorus nutrition
Applied
phosphorus
(kg/ha)
Fresh mass
(g)per plant
Dry mass
(g) per
plant
Root
length
(cm)
Fresh root
mass (g)
per plant
Dry root
mass(g)
per plant
Leaf
protein
P %
Total leaf
P %
Leaf
nitrate
Leaf
protein
%*
0 3.54b 0.23b 7.75a 0.21a 0.09a 0.53b 2.13b 0.02a 13.30b
45 5.69b 0.15b 5.50a 0.24a 0.11a 0.97a 3.42ab 0.06a 21.30a
75 13.04a 2.69a 10.25a 0.23a 0.11a 0.95a 4.25a 0.09a 26.40a
105 12.94a 1.21b 8.25a 0.25a 0.06a 0.95a 4.22a 0.09a 26.30a
120 13.83a 1.24b 9.75a 0.42a 0.08a 1.13a 4.32a 0.14a 26.80a
LSD (5%) 4.56 1.29 4.92 0.30 0.08 0.44 1.00 7.00 8.21
Significance
level
0.0007 0.0070 0.2985 0.5865 0.6926 0.0001 0.001 0.001 0.001
Response Q** Q** NS NS NS L** L** NS L**
NS,*, **Linear or quadratic (Q) effects non significant (ns) or significant at P ≤ 0.05 or 0.01.

31
4.1.4 Response of chlorophyll, stomatal conductance and Leaf Area Index to
phosphorus nutrition (Table 4)
Chlorophyll content
All phosphorus treatments significantly increased the chlorophyll content of the baby
spinach. The significant increases ranged from 0 to 69.00 nm. The difference
between the highest and lowest mean values was 102.35 nm.
Stomatal conductance - adaxial (upper)
Adaxial stomatal conductance was not influenced by the different rates of
phosphorus application.
Stomatal conductance - abaxial (lower)
Applying phosphorus at 45 kg/ha significantly influenced the abaxial stomatal
conductance of the baby spinach by 71.70 mmol/m2/s.
Leaf Area Index
Applying phosphorus at 75 kg/ha significantly improved the leaf area of the baby
spinach as indicated in Table 4. The difference between the highest and lowest
mean values was 13.139.

32
Table 4: Physiological parameters of baby spinach in response to phosphorus
nutrition
Applied
phosphorus
(kg/ha)
Chlorophyll
content
(nm)
Stomatal
conductance
-
adaxial
(upper)
(mmol/m2/s)
Stomatal
conductance -
abaxial
(lower)
(mmol/m2/s)
Leaf Area
Index
0 62.78c 59.53a 65.00b 8.04b
45 69.00b
171.35a
72.05a
114.40a
71.70a 9.40b
75 64.93a 21.18a
105 90.45b 61.50a 42.23b 17.37a
120 95.28b 39.78a 53.40b 17.87a
LSD (5%) 26.66 77.67 28.244 6.1522
Significance
level
<.0001 0.3575 0.2329 0.0019
Response Q** NS Q** Q**
NS,*, **Linear or quadratic (Q) effects non significant (ns) or significant at P ≤ 0.05,
0.01 or 0.001

33
4.1.5 Response of biomass production to potassium nutrition (Table 5)
Fresh Mass
Different rates of potassium application did not significantly influence the fresh mass
of the baby spinach.
Dry mass
Different rates of potassium application did not significantly influence the dry mass
of the baby spinach.
Root length
Different rates of potassium application did not significantly influence the root length
of the baby spinach.
Fresh root mass and dry root mass
The application of potassium did not significantly influence fresh or dry root mass.
Leaf Protein K %
The application of potassium did not significantly influence the leaf protein K
percentage.
Total Leaf K %
The application of potassium caused a linear response in the total leaf potassium
percentage of the baby spinach from 63 kg/ha. The difference between the highest
total leaf K % and lowest total leaf K % was 0.58.
Leaf Nitrate %
Different rates of potassium application did not significantly influence the leaf nitrate
of the baby spinach.

34
Table 5: Biomass production parameters of baby spinach in response to potassium nutrition
Applied
potassium
(kg/ha)
Fresh
mass
(g)per
plant
Dry mass
(g)per
plant
Root
length
(cm)
Fresh root
mass
(g)per plant
Dry root
mass
(g)per
plant
Leaf
protein K
%
Total
Leaf K
%
Leaf
nitrate
%
Leaf
protein
%
0 1.25a 0.27a 8.000a 0.59a 0.26a 0.26a 1.74b 0.03a 10.8b
63 1.13a 0.26a 5.250a 0.37a 0.06a 0.36a 2.30a 0.08a 14.3a
85 3.69a 0.99a 9.500a 0.92a 0.16a 0.31a 2.32a 0.09a 14.4a
127 1.32a 0.24a 6.250a 0.43a 0.06a 0.15a 1.79b 0.04a 11.1b
148 1.65a 0.33a 6.000a 0.46a 0.07a 0.20a 1.83b 0.04a 11.4b
LSD (5%) 3.13 0.94 4.59 0.58 0.24 1.64 3.00 0.24
Significance
level
0.3979 0.3886 0.3118 0.2975 0.3136 0.003 0.001 0.3136
Response NS NS NS NS NS NS Q** NS Q**
NS,*, **Linear or quadratic (Q) effects non significant (ns) or significant at P ≤ 0.05 or 0.01.

35
4.1.6 Response of chlorophyll, stomatal conductance and Leaf Area Index to
potassium nutrition (Table 6)
Chlorophyll content
Different rates of potassium nutrition did not significantly influence the chlorophyll
content of the baby spinach.
Stomatal conductance adaxial (upper)
Different rates of potassium application did not significantly influence the stomatal
conductance adaxial of the baby spinach.
Stomatal conductance abaxial (lower)
Different rates of potassium application did not significantly influence the stomatal
conductance abaxial of the baby spinach.
Leaf Area Index
The application of potassium caused a quadratic response in the Leaf Area Index of
the baby spinach at 63 kg/ha. The difference between the highest and lowest mean
values was 0.57.
Table 6: Physiological parameters of baby spinach in response to potassium
nutrition
Applied
potassium
(kg)
Chlorophyll
content
(nm)
Stomatal
conductance
- adaxial
(upper)
(mmol/m2/s)
Stomatal
conductance
- abaxial
(lower)
(mmol/m2/s)
Leaf
Area
Index
0 80.05a 32.25a 36.93a 0.91b
63 66.30a 42.00a 38.00a 1.31a
85 81.73a 39.55a 39.28a 1.02a
127 48.28a 43.03a 41.38a 1.02a
148 53.78a 48.48a 47.43a 0.74b
LSD (5%) 48.51 17.35 15.13 0.36
Significance
level
0.49 0.40 0.59 0.58
Response NS NS NS Q**
NS,*, **Linear or quadratic (Q) effects non significant (ns) or significant at P ≤ 0.05,
0.01 or 0.001.

36
4.1.7 Response of biomass production to combined NPK nutrition (Table 7)
Fresh Mass
The combination of NPK significantly increased fresh mass compared to the control.
However, combined 45:45:60 and 75:75:90 kg/ha yielded more fresh mass,
reaching 8.40g. The difference between the highest and lowest mean values was
5.59 g per plant.
Dry mass
The application of NPK combination at 45:45:60 and 75:75:90 kg/ha increased the
dry matter of the baby spinach, achieving 6.29 g and 5.09 g respectively. The
difference between the highest and lowest mean values was 5.375 g per plant.
Root length
None of the treatments improved root length.
Fresh root mass and dry root mass
Neither fresh root mass nor dry root mass of the baby spinach were improved by the
application of combined NPK.
Leaf protein percentage
The application of combined NPK significantly improved percentage leaf protein
content (27.8%) at 30:30:40 kg/ha. Significant improvements varied with the 0 to
30:30:40 NPK applications. The difference between the highest and lowest leaf
protein percentages was 7.8%.
Leaf percentage N
The application of NPK combination at 45:45:60 showed a quadratic response to
leaf percentage N of baby spinach, achieving 4.51%. The difference between the
lowest mean value and highest mean value was 1.3%.
Leaf percentage P
Different rates of NPK combined application did not exhibit a significant influence on
the leaf percentage P of baby spinach.
Leaf percentage K
The application of combined NPK nutrition at 30:30:40 and 75:75:90 kg/ha showed
a quadratic response in the leaf percentage K of the baby spinach, achieving 5.90%
and 6.13% respectively. The difference between the highest and lowest leaf K
percentages was 2.68%.

37
Table 7: Biomass production parameters of baby spinach in response to combined NPK nutrition
Applied NPK
combined
(kg/ha)
Fresh
mass
(g)per
plant
Dry
mass
(g)per
plant
Root
length
(cm)
Fresh root
mass
(g) per
plant
Dry root
mass
(g) per
plant
Protein
%
Leaf
N %
Leaf
P %
Leaf
K %
0 2.81c 0.91b 8.00a 0.59a 0.26a 20.0b 3.21b 0.19b 3.45b
30:30:40 6.13b 1.81b 6.50a 0.38a 0.25a 27.8a 4.51a 0.45b 5.90a
45:45:60 9.08a 6.29a 7.75a 0.50ª 0.25ª 25.4a 4.10a 0.49b 5.79a
60:60:70 5.91b 1.88b 7.75a 0.45ª 0.39ª 26.5a 4.30a 0.60b 5.86a
75:75:90 8.40ab 5.09a 8.50a 0.60a 0.21a 27.1a 4.42a 0.53b 6.13a
LSD (5%) 2.72 1.89 3.10 0.26 0.23 6.8 1.3 0.45 1.55
Significance
level
0.0024 0.0001 0.7107 0.3668 0.5397 0.0001 0.003 0.012 0.023
Response Q** Q** NS NS NS Q** Q** NS Q**
Letters in the same column are not significantly different at P≤0.0001

38
4.1.8 Response of chlorophyll, stomatal conductance and leaf area index to
combined NPK nutrition (Table 8)
Chlorophyll content
Combined NPK applications did not exhibit a consistent trend in terms of chlorophyll
content.
Stomatal conductance - adaxial (upper)
High application rates of NPK (60:60:70 kg/ha) had a significant effect on the upper
stomatal conductance (38.65 mmol/m2/s) of the baby spinach. The difference
between the highest and lowest mean values was 13.38 mmol/m2/s.
Stomatal conductance - abaxial (lower)
Excessively high application of combined NPK (75:75:90 kg/ha) significantly
influenced stomatal conductance on the lower surface of the baby spinach leaves,
reaching 42.85 mmol/m2/s. The difference between the highest and lowest mean
values was 12.4 mmol/m2/s.
Leaf Area Index
No significant differences in leaf area were observed following applications of
combined NPK nutrition.
Table 8: Physiological parameters of baby spinach in response to combined NPK
nutrition
Applied NPK
combined
(kg/ha)
Chlorophyll
content
(nm)
Stomatal
conductance -
adaxial (upper)
(mmol/m2/s)
Stomatal
conductance -
abaxial (lower)
(mmol/m2/s)
Leaf
Area
Index
0 179.85ab 34.35b 35.68b 1.09a
30:30:40 156.30b
176.60ab
26.63b
25.28b
34.18b 0.84a
45:45:60 33.65b 1.11a
60:60:70 188.25a 38.65a 30.45b 0.95a
75:75:90 172.95ab 28.80b 42.85a 0.77a
Significance
Level
Response
0.1974
NS
0.0907
Q**
0.2551
Q**
0.6518
NS

39
Letters in the same column are not significantly different at P≤0.0001

40
4.2 Discussion
4.2.1 Response of yield and dry matter to nitrogen nutrition
The results of this study showed that fresh mass of baby spinach was negatively
affected by excessively high or excessively low nitrogen treatments. Nitrogen
application levels that were too high, at 120 kg/ha, or zero nitrogen application
resulted in a reduction in growth rate leading to smaller leaves. These results were
consistent with the findings of Soundy et al. (2001) who reported that nitrogen
deficiency reduced lettuce yields. Soundy & Cantliffe (2001) also reported that
increasing N concentrations resulted in increased shoot growth in lettuce plantlets.
Wang et al. (2000) reported that increased N fertiliser application by farmers
increased their lettuce yields by 200 kg/ha. Moreover, the results of this study
suggest that baby spinach cv. Ohio reached maximum yield at nitrogen levels of 75
kg/ha. These results were consistent with those of Collins & McCoy (1997) and
Stagnari et al. (2007), who reported that crop production and growth were promoted
by adequate supply of N. Luo et al. (2008) and Cooke et al. (2003) also found that N
fertilisation of native spinach at a rate of 200 kg/ha resulted in higher photosynthetic
rates, higher leaf chlorophyll concentrations and larger leaves. In contrast with our
findings, Hammad et al. (2007) reported an increase in fresh mass of spinach aerial
organs following high nitrogen application rates.
In the present experiment, the dry matter of baby spinach was significantly reduced
when nitrogen was not applied (the control) and when the nitrogen application rate
was very high (120 kg/ha), due to nitrogen deficiency and osmotic stress
respectively. Cantliffe (1992) and Magnifico et al. (1992) reported that spinach is
extremely responsive to nitrogen fertilisation which leads to fast vegetative growth.
These findings were similar to those of Elia et al. (1999), who suggested that a
decrease in dry matter content was caused by increased application of nitrogen
fertiliser. Santamaria et al. (1999) also stated that the reduction in dry matter content
could be attributed to the replacement of organic acids and sugars by nitrate caused
by increased nitrogen fertiliser applications. On the other hand, Schuphan (1969)
reported that the dry matter in spinach decreased with increasing amounts of
nitrogen fertiliser.
The root length of the baby spinach was significantly affected when an adequate
rate of nitrogen (at 75 kg/ha) was applied. These results were consistent with the

41
findings of Kamh et al. (2005) who reported that adequate application of nitrogen led
to an absolute increase in the roots of spinach of more than 50%. But, Novaes et al.
(2009) also found that high biomass production above the ground, induced by high
N nutrition, inhibited root growth and led to a decrease in the length of the root
(shoot root). Reidenbach & Horst (1997) indicated that the efficiency of nitrogen
uptake depended on root morphology and uptake ability in Brassica crops. Wiesler
& Horst (1994) and Oikeh et al. (1999) reported that better uptake of N from the soil
was easier in cultivars with a deeper root system and higher root density.
The results of this study showed that high nitrogen applications (at 120 kg/ha) had a
positive effect on the nitrate content found in the leaves of the baby spinach (1.33
mg/kg). These results were consistent with those of Briemer (1982); Elia et al.
(1999); Gulser (2005) and Hammad et al. (2007) who reported that high nitrogen
applications increased nitrate accumulation in vegetables. Pavlovic et al. (1996) and
Gastal & Lemaine (2002) found that spinach has a high concentration of nitrate.
Maynard et al. (1976) and Tei et al. (2000) also reported that baby spinach tends to
accumulate more NO3- than other vegetables because of its efficient uptake system
versus an inefficient reductive system. The level of nitrate in the leaves is significant
due to the fact that too high nitrate is detrimental to human if consumed.
However, Stagnari et al. (2007) reported the detrimental impact of nitrate found in
baby spinach on human health; it was found to induce methemoglobinemia which is
very harmful to babies. However, Gulser (2005) reported that nitrate content in the
leaves was determined by the cultivar or variety of spinach rather than the amount
of nitrogen applied. In Germany, a maximum of 791 mg nitrate-Nkg-1 is given as
acceptable nitrate content for fresh spinach (Hammad et al. (2007). The European
Commission (1997) issued a regulation stating that the maximum acceptable level
of nitrate accumulation in spinach was between 2500 and 3000 ppm on fresh weight
basis (Santamaria et al. 1998). The World Health Organisation (WHO, 2003)
recommends a level of 2500 mg/kg of nitrate in spinach, cabbage and lettuce. Cil
and Katkat, (1995) proposed 700 mg nitrate-Nkg-1 as the maximum for leafy and
root vegetables. The current study met the acceptable nitrate standard by achieving
1.33 mg/kg which is below the recommended rate.

42
4.2.2 Response of chlorophyll, stomatal conductance and Leaf Area Index to
nitrogen nutrition
The chlorophyll content of the baby spinach increased with increasing nitrogen
applications, reaching maximum at 75 kg/ha, while it significantly decreased at
application rates of 105-120 kg/ha. These findings were consistent with the results
reported by Van Lerser, (1999); James & Van Lerser (2001) and Kang & Van Lerser
(2002) who observed that a decrease in chlorophyll content resulted from low and
very high concentrations of N nutrition, due to lower N levels in the leaves.
Yellowing or loss of green colour, which is considered the major consequence of
chlorophyll degradation, was also observed with nitrogen levels that were too high
and with zero nitrogen. Nitrogen applications above 75 kg/ha lead to osmotic stress
and consequently to a decrease in N uptake, which may also affect the biosynthesis
of plant metabolites, including chlorophyll. These findings from the current research
indicated that adequate application of nitrogen fertilizers increased chlorophyll
content of baby spinach contradict those of Hortensteiner, (2006); Majunmadar et al.
(1991) and Ni et al. (2001) who reported that biotic and abiotic stresses such as
water stress, heat stress, insect feeding and ageing caused chlorophyll degradation.
Adaxial (upper) stomatal conductance in the baby spinach was not significantly
influenced by adequate application of nitrogen fertiliser level, only showing a slight
increase at 75 kg/ha. In this study, abaxial (lower) stomatal conductance started
showing an increase at the highest rate of nitrogen application (120 kg/ha). There
was no difference in the total stomatal conductance on both adaxial and abaxial leaf
surfaces between the different nitrogen treatments. The results of this study concur
with those of Cantin et al. (1997) and Samuelson (2000) who reported that
increased efficiency in water use by leaves, through decreased stomatal
conductance and increased net photosynthesis, was caused by nitrogen nutrition.
Whitehead & Hoxton (1952) also stated that more complex factors than the plant’s
response to fertilisation (such as temperature) may influence stomatal opening and
closing.
The results of the current study showed that the application of nitrogen did not have
any effect on the leaf area of baby spinach. Although increasing the nitrogen
application rates to 105 and 120 kg/ha slightly increased the leaf area, the change
was not significant. These results contradict those of Taylor et al. (1993) and Gastal

43
& Lemaire (2002) who reported that N application has an effect on cell division and
cell expansion which can lead to an increase in leaf area. Nitrogen nutrition strongly
affects the growth rate of young leaves, and has an effect on leaf area which can
lead to cell expansion and cell division. A major consequence of N deficiency in
plants is a decreased growth rate.
4.2.3 Response of fresh mass and dry mass to phosphorus nutrition
In this study, adequate phosphorus (at 75 kg/ha) and excessive phosphorus (at 120
kg/ha) proved to have a significant influence on the yield of baby spinach. These
results are in contrast to those of Maschner (1995) who stated that stunted plant
growth and cell and leaf reduction resulted from phosphorus deficiency. Jia et al.
(1997) stated that the yield and growth of vegetables were improved and increased
by supplying P, while too much P fertiliser could have a negative effect on vegetable
yield and quality. Azcon et al. (1996) supported the above finding that increased
growth, glutamine synthesis activity and protein content of lettuce was achieved by
the application of P at adequate rate of 16.4% and high rate of 25.1%.
Dry matter seemed to be significantly affected by an adequate supply of
phosphorus, reaching maximum at 75 kg/ha. These results were similar to those of
Khokar & Warsi (1987) who reported that the application of phosphorus resulted in
an increase in dry matter accumulation of up to 60% (Plenets et al. 2000).
4.2.4 Response of chlorophyll, stomatal conductance and Leaf Area Index to
phosphorus nutrition
An adequate supply of phosphorus at 75 kg/ha led to a significant increase in the
chlorophyll content of the baby spinach, while insufficient or excessive phosphorus
application resulted in reduced chlorophyll content. These results were similar to
those reported by Xu et al. (2007) who found a 40% reduction in chlorophyll and
protein content as a result of insufficient application of phosphorus. Sharma (1995)
also observed a higher rate of photosynthesis and chlorophyll content when
phosphorus was applied as compared to the control. These results agree with Sinha
et al. (1995) reported that P applications increased chlorophyll levels by 21% due to
an increase in the synthesis of chlorophyll a and b under adequate moisture
conditions (Nyborg et al. 1999).

44
The different rates of phosphorus did not have any significant influence on the leaf
area of the baby spinach, which consequently led to a low crop yield. This study
also showed that zero phosphorus reduced the leaf area of baby spinach, and
subsequently also the yield.
These results were consistent with those of Fredeen et al. (1989) who stated that
reduction in leaf expansion, number of leaves and leaf surface area are common
symptoms of phosphorus deficiency which often result in limited yield. Reymond et
al. (2006) also reported a significant effect of phosphorus on leaf area, although
preceded by an increase in root hydraulic conductance which resulted in an
increase in soil water extraction and consequently the maintenance of greater leaf
water potential under conditions of soil moisture deficit.
According to the results of this study, none of the different phosphorus application
rates had a significant influence on the upper stomatal conductance of the baby
spinach. These results differed from those reported by Longnecker (1994) who
found an increase in cell expansion of crops as a result of phosphorus application.
Garg et al. (2001) also reported that water deficits caused genotype variation in net
photosynthetic rate, and this was attributed to the relationship between carbon
dioxide concentration inside the leaf and the stomatal aperture.
The results of this study also showed no significant effect on the root length of baby
spinach by any of the phosphorus application rates. However, this was contrary to
reports by Borch et al. (1999); Miller et al. (2003) and Lynch et al. (2006) that
adventitious roots in many crops are regulated by over 70% by the availability of
phosphorus. Zhu et al. (2005a) reported that lateral roots play an important role in
phosphorus acquisition by increasing soil exploration, the absorptive surface of the
root system and phosphorus solubilisation. However, it should be noted that the
current study focused only on root length, without differentiating between lateral or
adventitious roots.
4.2.5 Response of fresh mass and dry mass to potassium nutrition
Our results showed that the application of K did not significantly increase or improve
biomass production. These results were consistent with the findings of Soundy et al.
(2001) who reported that application of K+ to lettuce did not have a significant effect
on fresh mass, dry mass, leaf area or other growth parameters. Tiwari et al. (1998)

45
also reported that the availability of K+ to plants is usually limited, which leads to
severely restricted plant growth and yield, although K+ is considered to be one of the
most abundant soil elements. Contrary to these results, Singh and Blanke, (2000)
reported that an increase in the chlorophyll content, root length, yield and dry matter
in Brassica oleracea crops resulted from an increase in K+ fertiliser. William (2007)
reported that a reduction in both the number of leaves produced and the size of
individual leaves were the common symptoms of potassium deficiency.
The potassium fertiliser applied did not have any significant influence on the
opening and closing of stomata. These results are consistent with those of Pervez et
al. (2004) and Benlloch-Gonzalez et al. (2010) who reported that, under well-
watered conditions, potassium application had no effect on stomatal conductance
whereas K+ starvation could favour stomatal opening and promote transpiration
under drought stress. Jin et al. (2011) and Tomemori et al. (2002) also reported
stomatal closure and inhibited photosynthetic rates in several crops as a result of K+
deficiency. Benlloch-Gonzalez et al. (2010) found that plants with low K+ status
could inhibit water stress which may consequently induce stomatal closure through
ethylene synthesis. Inhibitor (cobalt) and stomatal conductance could be
significantly reduced in K+ starved plants which could in turn inhibit the action of
abscicic acid (ABA) on stomata and delay stomata closure. ABA is an endogenous
anti-transpirant that reduces water loss through stomatal pores on the leaf surface
(Tomemori et al., 2002).
On the other hand, Maschner (1995); Schachtman & Shin (2007); and Wang & Wu
(2013) reported that plant growth and development is greatly influenced by high rate
of potassium applications. Conversely, Maschner (2012) also found that turgor
regulation within the guard cells during stomatal movement resulted from potassium
sufficiency in the plant. Bednarz et al. (1998) reported that at the onset of a
developing potassium deficiency, stomatal conductance was the principal factor
limiting photosynthesis, whereas when the K+ deficiency became more extreme,
non-stomatal or biochemical factors became the overriding reason for the decrease
in photosynthesis. Yadav et al. (1999) also reported that potassium played a
significant role in the opening and closing of stomatal cionductance under adequate
light conditions, the guard cells produced abundant ATP in photosynthetic
phosphorylation, thus supporting the active potassium uptake with sufficient energy
which resulted in high turgor pressure and caused the opening of the stomata.

46
Talbott & Zeiger (1996) observed that stomatal opening in the course of the day was
a two-phase process, with K+ promoting opening early in the day and then giving
way to sucrose as the principal driving osmotic force around midday. Berdnarz et al.
(1998); Huber, (1985) and Longstreth & Nobel (1980) observed a relationship
between stomatal aperture and plants with K+ guard cell concentration. Insufficient
levels of K+ in the leaf can lead to decreased stomatal conductance, which also
leads to decreased photosynthesis per unit leaf area (Berdnarz et al. 1998).
4.2.6 Response of chlorophyll, stomatal conductance and Leaf Area Index to
potassium nutrition
An increase in K+ was observed to have a significant effect on the Leaf Area Index
which reached maximum at 63 kg/ha of potassium. Similarly, Huber (1985) reported
that the symptoms of insufficient K+ levels often resulted in reduced leaf area
expansion, leading to reduced leaf size. Decreased leaf area often results in an
increase in the concentration of cellular components and nutrients on the leaf area
compared to leaves with adequate K+ levels. Zhao et al. (2001); Degl’Innocenti et
al. (2009); and Gerardeaux et al. (2010) also reported that reduction in leaf area is
caused by K+ deficiency. Jordan-Meille & Pellerin (2004) found that the decrease in
leaf area caused by a K+ deficiency often resulted in a reduction in biomass.
The results of the study also showed that when K+ was not applied (the control) and
when K+ applications were too high, there was a decline in leaf area, resulting in
small size leaves. These results concur with those reported by Cassman, (1998);
Ebelhar & Varsa (2000); Heckman & Kamprath (1995); Mullins et al. (1994); and
Pettigrew & Meredith, (1997) who found that reduction in plant stature was the first
visual and obvious symptom of insufficient levels of potassium in the plant.
Conversely however, Gwathmey & Howard (1998); and Pettigrew (2003) reported
that a reduction in canopy and sunlight interception were the factors that caused leaf
area reduction and consequently a reduction in the number of leaves.
4.2.7 Response of fresh mass and dry mass to NPK combined nutrition
There is little literature on the effects of combined NPK on baby spinach. This study
attempts to elucidate the interactive effects of NPK on biomass production and the
physiological response of baby spinach.

47
The results of the study showed that adequate applications of NPK (at 45:45:60
kg/ha) had a significant effect on the yield of baby spinach. Increasing the rates of
combined NPK did not have any further influence on the yield. These results were
consistent with the findings of various authors such as Collins & McCoy (1997); and
Stagnari et al. (2007), who reported that the yield of many crops was significantly
increased when nitrogen was applied at an adequate rate of 60 kg/ha. Jia et al.
(1997) and Azcon et al. (1996) stated that the application of phosphorus had a
positive effect on yield, and Singh & Blanke (2000) found an increase in chlorophyll
content, root length, yield and dry matter in Brassica oleracea crops as a result of
increased applications of K+ fertiliser. Elia et al. (1999) found a decrease in dry
matter content as a result of an increase in nitrogen fertiliser, and Khokar & Warsi
(1987) reported that phosphorus fertiliser resulted in an increase in the dry matter
accumulation.

48
CHAPTER 5
CONCLUSION AND RECOMMENDATIONS
The growth and development of baby spinach is dependent on the adequate application
of nitrogen (N), phosphorus (P) and potassium (K) fertilisers, correct spacing and
irrigation. Correct harvesting techniques and careful postharvest handling are also
important in preventing damage that may negatively affect production and yield.
Different cultivars of baby spinach perform differently in terms of yield; the current study
focused on the Ohio cultivar.
It can be concluded that the growth and development of baby spinach were significantly
affected by the fertilisers applied as well as fertiliser rates. The results also suggest that
adequate application of nitrogen and phosphorus fertiliser at 75 kg/ha improves plant
growth parameters significantly, leading to a quadratic effect on yield, dry matter,
chlorophyll content and leaf area. It was also observed that different rates of potassium
application had a negative effect on the yield, dry matter, stomatal conductance and
chlorophyll content of baby spinach, but not on leaf area. Combined NPK fertilisers
applied at a rate of 45:45:60 kg/ha had a significant effect on the yield as well as dry
matter of baby spinach. No application and very high rates had negative effects on baby
spinach growth.
Based on the findings of this study, the recommended fertilisers for optimum yield, dry
matter, chlorophyll, leaf area and stomatal conductance in baby spinach are nitrogen and
phosphorus applied at a rate of 75 kg/ha. At this stage, no recommendations can be
made in terms of potassium. In the case of combined NPK fertilisers, a rate of 45:45:60
kg/ha is recommended. The price of the combined fertilizers should be affordable to the
farmers because of the size of the bag, the smaller the bag, the smaller the price
Further studies to determine the economic impact of these rates should be conducted.

49
REFERENCES
Abdelmalek, M.F., Angulo, P., Jorgensen, R.A., Sylvestre, P.B., & Lindor, K.D., (2001).
Betaine a promising new agent for patients with nonalcoholic steatohepatitis:
Results of a Pilot Study. American Journal of Gastroenterology. 96: 2711-2717.
Allende, A., Luo, Y., McEvoy, J.L., Artes, F., & Wang, C.Y., (2004). Microbial and quality
changes in minimally processed Baby spinach leaves stored under super
atmospheric oxygen and modified atmosphere conditions. Postharvest Biology and
Technology. 33: 51-59.
Arts, I.C.W., & Hollman, P.C.H., (2005). Polyphenols and disease risk in epidemiologic
studies. American Journal of Clinical Nutrition. 81: 317S-325S.
Asia, A., Terasaki, M., & Nagao, A., (2004). An epoxide-furanoid rearrangement of
spinach neoxanthin occurs in the gastrointestinal tract of mice and in vitro: formation
and cytostatic activity of neochrome stereoisomers. Journal of Nutrition. 134: 2237-
2234.
Asplund, K., (2002). Antioxidant vitamins in the prevention of cardiovascular disease: a
systematic review. Journal of Internal Medicine. 251: 372-392.
ATBC (1994). The alpha tocopherol beta carotene cancer prevention study group. The
effect of vitamin E and beta carotene on the incidence of lung cancer and other
cancers in male smokers. New England Journal of Medicine. 330: 1092-1035.
Azcon, R., Gomez, M., & Tobar, R., (1996). Physiological and nutritional responses by
Latuca sativa L. to nitrogen sources and mycorrhizal fungi under drought conditions.
Biology and Fertility of Soils. 22: 156-161.
Barker, A.V., Maynard, D.N., & Mills, H.A., (1974). Variations in nitrate accumulation
among spinach cultivars. Journal of American Society of Horticultural Science. 99:
132-134.
Bednarz, C.W., Oosterhuis, D.M., & Evans, R.D., (1998). Leaf photosynthesis and carbon
isotope discrimination of cotton in response to potassium deficiency. Environmental
and Experimental Botany. 39: 131-139.
50
Benlloch-Gonzalez, M., Romera, J., Cristescu, S., Harren, F., Fournier, J.M., &
Benlloch, M., (2010). K+ starvation inhibits water-stress-induced stomatal closure
via ethylene synthesis in sunflower plants. Journal of Experimental Botany. 61:
1139-1145.
Bergquist, S., (2006). Bioactive Compounds in Baby spinach (Spinacia oleracea L.)
Effects of Pre- and Postharvest Factors, Journal of Science of Food and Agriculture.
86: 346-355.
Bergquist, S.,Ulla, E.G., Pia, K., & Marie E.O., (2005). Flavonoids in Baby spinach
(spinacia oleracea L.) Changes during plant Growth and Storage. Journal of
Agricultural food chemistry. 53: 9459-9464.
Bird, A.C., Bressler, N.M., & Bressler, S.B., (1995). An international classification and
grading system for age-related maculopathy and age related macular degeneration.
Journal of Ophthalmology. 39: 367-74.
Blom-Zandstra, M., (1989). Nitrate accumulation in vegetables and its relationship to
quality. Annual Applied Biology. 115: 553-561.
Borch, K., Bouma, T.J., Lynch, J.P., & Brown, K.M., (1999). Ethylene: a regulator of root
architectural responses to soil phosphorus availability. Plant, Cell and Environment.
22: 425-431.
Borek, C., (1991). Antioxidants and cancer, science and medicine. The baby-boomer’s
guide New Canaan Connecticus Keats Publishing. 4: 51-61.
Brecht, K.K., Saltveit, M.E., Talcott, S.T., Schneider, K.R., Felkey, K., & Bartz, J.A.,
(2004). Fresh-cut vegetables and fruits. Journal of Horticulture Revision. 30: 185-
246.
Briemer, T., (1982). Environmental factors and culture measures affecting the nitrate
content of spinach. Fertility Residual. 3: 191-291.
Britto, D.T., Kronzucker, H.J., (2008). Cellullar mechanisms of potassium transport in
plants. Journal of Physiology of Plant. 133: 637-650.
Brown, L., Rimm, E.B., Seddon, J.M., Giovannucci, E.L., Chasan-Taber, L., Spiegelman,
D., Willett, W.C., A & Hankinson, S.E. (1999). A prospective study of carotenoid

51
intake and risk of cataract extraction in US men. American Journal of Clinical
Nutrition. 70: 517-524.
Beuscher, R., Howard, l., & Dexter, P., 1999). Postharvest enhancement of fruits and
vegetables for improved human health. Journal of Horticultural Science. 34: 1167-
1170.
Cantin, D., Tremblay, M.F., Lechowicz, M.J., & Potvin, C., (1997). Effects of CO2
enrichment, elevated temperature, and nitrogen availability on the growth and gas
exchange of different families of jack pine seedlings. Canadian Journal of Science.
27: 510-520.
Cantliffe, D., (1992). Nitrate accumulation in vegetable crops as affected by photoperiod
and light duration (beets, radish, spinach, beans). Journal of Horticultural
Science.97: 414-418.
Cao, G., Sofic, E., & Prior, R.L., (1996). Antioxidant capacity of tea and common
vegetables. Journal Agricultural and Food Chemistry. 44: 3426-3431.
Cassman, K.G., (1998). Agronmoic management of potassium in the 21st century: can
plant physiology help? In: Oosterhuis, D.M. and Berkowitz, G.A. (Eds) Frontiers in
Potassium Nutrition: New Perspective on the Effects of potassium on Physiology of
Plants. Potash and Phosphate Institute, Norcross, GA; and Potash and Phosphate
Institute of Canada, Saskatoon, Canada. 165-174.
Castenmiller, J.M., Clivwe, E.W., Josef, P.H., Linssen, K., van het Hof, H., & Alphons,
G.J., (1999). The food matrix of spinach is a limiting factor in determining g the
bioavailability of β-carotene and to a lesser extent of lutein in humans. Journal of
food technology and nutritional Sciences. 63: 729-734.
Christen, Y., (2000). Oxidative stress and Alzheimer disease. American Journal of
Clinical Nutrition. 621S-629S.
Cieslik, E., Greda, A., & Adamus, W., (2006). Contents of polyphenols in fruit and
vegetables. Food Chemistry. 94: 135-142.

52
Cil, N., & Katkat, A.V., 1995). Nitrogen fertilizer types and effects of their excess amount
on yields, nitrate and mineral composition of spinach. Akalan Soil and Environment
Symposium. 2: 156-168.
Cooke, J.E.K., Brown, K.A., Wu, R., & Davis, J.M., (2003). Gene expression associated
with N-induced shifts in resource allocation in poplar. Plant, Cell and Environment.
26: 757-770.
Collins, M., & McCoy, J.E., (1997). Chicory production, forage quality, and response to
nitrogen fertilization. Agronomy Journal. 89: 232-238.
Colomb, B., Kiniry, J. R., & Debaeke, P., (2000).Effect of soil phosphorus on leaf
development and senescence dynamics of field-grown maize. Agronomy Journal.
92: 428-435.
Commenges, D., Scotet, V., Renaud, S., Jacqmin Gadda, H., Barberger Gateau, P., &
Dartiques, J. F., (2000). Intake of flavonoids and risk of dementia. European Journal
of Epidemiology. 16: 357-363.
Conte, A., Conversa, G., Scrocco, C., Brescia, I., Laverse, J., & Elia, A., (2008).
Influence of growing periods on the quality of baby spinach leaves at harvest and
during storage as minimally processed produce. Postharvest Biology and
Technology. 50: 190-196.
Davey, M.W., Van Montagu, M., Inze, D., Sanmartin, M., Kanellis, A., Smirnoff, N.,
Benzie, I.J.J., Strain, J.J., Favell, D., & Fletcher, J., (2000). Plant L-ascorbic acid:
chemistry, function, metabolism, bioavailability and effects of processing. Journal of
Food Science and Agriculture. 80: 825-860.
Degl’Innocenti, E., Hafsi, C., Guidi, L., & Navari-Izzo, F., (2009). The effect of salinity on
photosynthetic activity in potassium-deficient barley species. Journal of Plant
Physiology. 166: 1968-1981.
Demming-Adams, B., Gilmore, A.M., & Adams, W.W.I., (1996). In vivo functions of
carotenoids in higher plants. FASEB Journal. 10: 403-412.
Department of Economic Development. (2011). Tracking Local Economic Development
and Practice in South Africa.

53
Ebelhar, S.A., & Varsa, E.C., (2000). Tillage and potassium placement effects on
potassium utilization by corn and soybean. Community of Soil Science and Plant
Analogy. 31: 11-14.
Edenharder, R., Keller, G., Platt, K.L., & Unger, K.K., (2001). Isolation and
characterization of structurally novel antimutagenic flavonoids from spinach
(Spinacia oleracea). Journal of Agricultural and Food Chemistry. 49: 2767-2773.
Elia, A., Santamaria, P., & Serio, F., (1999). Nitrogen Nutrition, Yield and Quality of
Spinach. Journal of Food Science and Agriculture. 76: 341-346.
European Commision (EC)., (2004). Commission Regulation No. 655/2004 of 7 April
2004 amending Regulation (EC) No 466/2001 as regards nitrate in foods for infants
and young children. Journal Official of European community. 104: 48-49.
Ferrante, A., Incrocci, L., Maggini, R., Serra, G., & Rognoni, F., (2004). Colour changes
of fresh-cut leafy vegetables during storage. Journal of Food Agriculture and
Environmental Science. 2: 40-44.
Fico, G., Bilia, A. R., Morelli, I., & Tome, F., (2000). Flavonoid distribution in Pyracantha
coccinea plants at different growth phases. Biochemistry System of Ecology. 28:
673-678.
Forman, D., & Altman, D., (2004). Vitamins to prevent cancer: supplementary problems.
The Lancet. 364: 1193-1194.
Fredeen, A.L., Rao, I.M., & Terry, N., (1989). Influence of phosphorus nutrition on growth
and carbon partitioning in Glycine max (L.). Plant Physiology. 89: 225-230.
Gao, Z.M., Zhang, Y.D., Zhang, D.Y., Shi, R.H., & Zhang, M.F., (1989) Effects of N, P
and K on the accumulation of nitrate and the activity of nitrate reductase and
superoxidase in leafy vegetables. Acta Horticulture Science. 16: 293-298.
Gandini, S., Merzenich, H., Robertson, C., & Boyle, P., (2000). Meta-Analysis of studies
on breast cancer risk and diet: the role of fruit and vegetable consumption and the
intake of associated micronutrients. European Journal of Cancer. 36: 636-646.
Garg, B.K., Kathju, S., & Burman, U., (2001). Influence of water stress on water relations,
photosynthetic parameters and nitrogen metabolism of moth bean genotypes.
Biology of Plant. 44: 289-292.

54
Gastal, F., & Lemaire, G., (2002). N uptake and distribution in crops: An agronomical and
Eco physiological perspective. Journal of Experimental Botany. 53: 789-799.
Gerardeaux, E., Jordan-Meille, L., Constantin, J., Pellerin, S., & Dingkuhn, M., (2010).
Changes in plant morphology and dry matter partitioning caused by potassium
deficiency in Gossypium hirsutum (L.). Environmental of Experimental Botany. 67:
451-459.
Gil, M.I., Ferreres, F., & Tomas-Barberan, F.A., (1999). Effect of postharvest storage and
processing on the antioxidant constituents (flavonoids and vitamin c) of fresh cut
spinach. Journal of Agricultural and Food Chemistry. 47: 2213-2217.
Greenberg, B.M., Wilson, M.I., Gerhardt, K.E., & Wilson, K.E., (1996). Morphological and
physiological responses of Brassica napus to ultraviolet-B radiation:
photomodification of ribulose-1, 5-bisphosphate carboxylase/oxygenase and
potential acclimation processes. Journal of Plant Physiology. 148: 78-85.
Guichard, S., Leonardi, C., & Gary, C., (2005). Analysis of growth and water relations of
tomato fruits in relation to air vapor pressure deficit and plant fruit load. Journal of
Plant Growth Regulation. 24: 201-203.
Gulser, F., (2005). Effects of Ammonium Sulphate and Urea on No3- and No2
-
accumulation, nutrient contents and yield criteria in spinach. Journal of Horticulture
Science.106: 330-340.
Gwathmey, C.O., & Howard, D.D., (1998). Potassium effects on canopy light interception
and earliness of no-tillage cotton. Journal of Agronomy. 90: 144-149.
Halliwell, B., & Gutteridge, J.M.C., (1989). Free Radicals in Biology and Medicine. 2nd
edition. Oxford University Press. New York. 2: 232-237.
Hamid, A.A., Aiyelaagbe, O.O., Usman, L.A., Ameen, O.M., & Lawal, A., (2010).
Antioxidants: its medicinal and pharmacological applications. Review, Oyo State,
Nigeria. 135-148.
Hammad, S.A., Abou-Seeda, M.A., El-Ghamry, A.M., & Selim, E.M., (2007). Nitrate
Accumulation in Spinach Plants by Using N-Fertilizer Types in Alluvial Soil. Journal
of Applied Science Residual. 3: 511-518.

55
Hartug, W., & Heilmeier, H., (1993). Stomatal responses to abscisic acid in natural
environments. Interacting Stresses on Plants in a Changing Climate. 24: 525-442.
Heckman, J.R., & Kamprath, E.J., (1995). Potassium accumulation and soybean yield
related to potassium fertilizer rate and placement. Journal of Soil Science and Plant
Analogy. 26: 123-143.
Hedges, L.H., & Lister, C.E., (2007). Nutritional attributes of spinach, silver beet and
eggplant. Crop and Food Research Confidential Report No. 1928
Hertog, M .G. L., Kromhout, D., Aravanis, C., Blackburn, H., Buzina, R., Fidanza, F.,
Giampaoli, S., Jansen, A., Menotti, A., Nedeljkovic, S., Pekkrinen, M., Simic, B.
S.Toshima, H., Feskens, E. J.M., Hollman, P. C .C., & Katan, M. B., (1995).
Flavonoid intake and long-term risk of coronary heart disease and cancer in the
Seven Countries study. Journal of International Medicine. 155: 381-386.
Ho, L.C., (1996b). Tomato, New York: Marcel Dekker Incorporation. 8: 187-195.
Houstis, N., Rosen, E.D., & Lander, E.S., (2006). Reactive oxygen species have a causal
role in multiple forms of insulin resistance. Nature. 440: 944-948.
Hortensteiner, S., (2006). Chlorophyll degradation during senescene. Annual Revision of
Plant Biology. 57: 55-77.
Howard, L.R., Pandjaitan, N., Morelock, T., & Gil, M.I., (2002). Antioxidant capacity and
phenolic content of spinach as affected by genetics and growing season. Journal
Agricultural and Food Chemistry. 50: 5891-5896.
Huber, S.C., (1985). Role of potassium in photosynthesis and respiration. In: Munson,
R.D. (Ed) Potassium in Agriculture. ASA, CSSA and SSA, Madison, WI. 369-369.
Igor, M., (1995). Total nitrogen in plant material determined by means of dry combustion:
A possible alternative to determination by Kjeldahl digestion. Journal of Soil Science
and Plant analogy. 26: 2217-2229.
Institute of Medicine (2000). Dietary reference intake for vitamin C, vitamin E, selenium,
and carotenoids. National Academy Press. Washington, D.C. 228.

56
James E.C., & Van Lerser, M.W., (2001). Fertilizer concentration affects growth and
flowering of sub- irrigated petunias and begonias. Journal of Horticultural
Science.36: 40-44.
Jaynes, D.B., Colvin, T.S., Karlen, D.L., Cambardella, C.A., & Meek, D.W., (2001). Nitrate
loss in subsurface drainage as affected by nitrogen fertilizer rate. Journal of
Environmental Quality. 30: 1305-1314.
Jia, J.W., LI, W.Q., & Chen, B.C., (1997). Nutrient status and fertilization of protected
vegetable soils in Shandong Province. Journal of Vegetable Soil Fertility and
Rational Fertilization; Nanjing, China. 19: 73-75.
Jimenez, R.R., & Ladha, J.K., (1993). Automated elemental analysis: A rapid and reliable
but expensive measurement of total carbon and nitrogen in plant and soil samples.
Journal of Soil Science and Plant Analogy. 24: 1897-1924.
Jin, S.H., Huang, J.O., Li, X.O., Zheng, B.S., Wu, J.S., Wang, Z.J., Liu, G.H., & Chen, M.,
(2011). Effects of potassium supply on limitations of photosynthesis by mesophyll
diffusion conductance in Carya cathayensis. Journal of Tree Physiology. 31: 1142-
1151.
Jordan-Meille, L., & Pellrin, S., (2004). Leaf area establishment of maize (Zea Mays L.)
field crop under potassium deficiency. Journal of Plant Soil. 265: 75-92.
Joseph, J.A., Shukitt-Hale, B., Deisova, N.A., Prior, R.L., Cao, G., Martin, A., Taglialatela,
G., & Bickford, P.C., (1998). Long-term dietary strawberry, spinach, or vitamin E
supplementation retards the onset of age-related neuronal signal-transduction and
cognitive behavioural deficits. Journal of Neuroscience. 18: 8047-8055.
Joseph, J.A., Shukitt-Hale, B., Deisova, N.A., Bielinski, D., Martin, A., McEwen, J.J., &
Bickford, P.C., (1999). Reversals of age-related declines in neuronal signal
transduction, cognitive, and motor behavioural deficits with blueberry, spinach, or
strawberry dietary supplementation. Journal of Neuroscience. 19: 8114-8121.
Joseph, J.A., Nadeau, D.A., & Underwood, A., (2002). The color code: Journal of
revolutionary eating plan for optimum health. New York, Hypericon. 308.
Joshipura, K.J., Hu, F.B., Manson, J.E., Stamfer, M.J., Rimm, E.B., Soeizer, F.E., Colditz,
G., Ascherio, A., Rosner, B., Spiegelman, D., & Willett, W.C., (2001). The effect of

57
fruit and vegetable intake on risk for coronary heart disease. Annals of Internal
Medicine. 134: 1106-1114.
Kader, A.A., (2008). Flavour quality of fruits and vegetables. Journal Science of Food
Agriculture. 88: 1863-1868.
Kalt, W., Forney, C.F., Martin, A., & Prior, R.L., (1999). Antioxidant capacity, vitamin C &
D, phenolics, and anthocyanins after fresh storage of small fruits. Journal of
Agriculture and Food Chemistry. 47: 4368-4644.
Kalt, W., Ryan, D.A., Duy, J.C., Prior, R.L., Ehlenfeldt, M.K., & Van der Kloet, S.P.,
(2001). Interspecific variation in anthocyanins, phenolics, and antioxidant capacity
among genotypes of highbush and lowbush blueberries (Vaccinium Section
cyanococcus spp.). Journal of Agriculture and Food Chemistry. 49: 4761-4767.
Kalt, W., (2005). Effects of production and processing factors on major fruit and vegetable
antioxidants. Journal of Food Science. 70: 11-19.
Kamh, M., Wiesler, F., Ulas, A., and Horst, W.J., (2005). Root growth and N-uptake
activity of oilseed rape (Brassica napus L.) cultivars differing in nitrogen deficiency.
Journal of Experimental Botany. 52: 1091-1103.
Kang J.G., & Van Lerser, M.W., (2002). Nutrient solution concentration affects growth of
sub-irrigated bedding plants. Journal of Plant Nutrition. 25: 387-403.
Kang, J.H., Ascherio, A., and Grodstein, F., (2005). Fruit and vegetable consumption and
cognitive decline in aging women. Annals of Neurology.57: 713-720.
Khaw, K.T., Bingham, S., Welch, A., Luben, R., Wareham, N., & Oaks, S., (2001).
Relation between plasma ascorbic acid and mortality in men and women in EPIC-
Norfolk prospective study: a prospective population study. European Prospective
Investigation into Cancer and Nutrition. Lancet. 357: 657-663.
Khokar, R.K., & Warsi, A.S., (1987). Fertilizer response studies in gram. Indian Journal of
Agronomy. 32: 362-364.
Knekt, P., Jarvinen, R., Reunanen, A., & Maatela, J., (1996). Flavonoid intake and
coronary mortality in Finland: a cohort study. British Medical Journal. 312: 478-481.

58
Kolb, C.A., Käser, M.A., Kopecký, J., Zotz, G., Riederer, M. & Pfündel, E.E., (2001).
Effects of natural intensities of visible and ultraviolet radiation on epidermal
ultraviolet screening and photosynthesis in grape leaves. Plant Physiology. 127:
863-875.
Kopsell, D.A., Lefsrud, M.G., Kopsell, D.E., Wenzel, A.J., Gerweck, C., & Curran-
Celentano, J., (2006). Spinach cultigens variation for tissue carotenoid
concentrations influences human serum carotenoid levels and macular pigment
optical density following a 12-week dietary intervention. Journal of Agriculture and
Food Chemistry. 54: 7998-8005.
Krinsky, N.I., & Johnson, E.J., (2005). Carotenoid actions and their relation to health and
disease. Molecular Aspects of Medicine. 26: 259-516.
Kris-Etherton, P.M., Hecker, K.D., Bonanome, A., Coval, S.M., Binkoski, A.E., Hilert, K.F.,
Griel, A.E., & Etherton, T.D., (2002). Bioactive compounds in foods: their role in the
prevention of cardiovascular disease and cancer. American Journal of Medicine.
113: 71S-88S.
Lampe, J.W., (1999). Health effects of vegetables and fruits: assessing mechanisms of
action in human experimental studies. American Journal of Clinical Nutrition. 70:
475S-490S.
Le Marchand, L., (2002). Cancer preventive effects of flavonoids - a review. Biomedicine
and Pharmacotherapy.56: 296-301.
Lee, S.K., & Kader, A.A., (2000). Preharvest and postharvest factors influencing vitamin
C content of horticultural crops. Postharvest Biology and Technology. 20: 207-220.
Lester, G.E., and Crosby, K., (2002). Ascorbic acid, folic acid and potassium content in
postharvest green-fleshed honey dew muskmelons: Influence of cultivar, fruit size,
soil type and year. Journal of American Society of Horticulture Science. 127: 843-
847.
Li, S.Q., Li, S.X., & Tian, X.H., (1995). Interaction effects of water and fertilizers on wheat
yields and fertilizer efficiency. In The Principle of Relationship between Fertilizer
and Water of Dry Farming Land and Its Regulation Technology. 246-262.

59
Lister, C.E., (1999). The medicine of life. Vitamins and other bioactive food components.
Food Technology. 34: 18-35.
Liu, S., Lee, I.M., Ajani, U., Cole, S.R., Buring, J.E., & Manson, J.E., (2001). Intake of
vegetables rich in carotenoids and risk of coronary heart disease in men: the
physicians ‘health study. International Journal of Epidemiology. 30: 130-135.
Liu, S., Manson, J.E., Lee, I.M., Cole, S.R., Hennekens, C.H., Willett, W.C., & Buring,
J.E., (2000). Fruit and vegetable intake and risk of cardiovascular disease: the
women’s health study. American Journal of Clinical Nutrition. 72: 992-928.
Longnecker, N., (1994). Nutrient deficiency and vegetative growth, in A.S. Basra:
Mechanism of plant growth and improved productivity. Marcel Dekker, Boca Raton
FL. 137-172.
Longnecker, M.P., Newcomb, P.A., Mittendorf, R., Greenberg, E.R., & Wilett, W.C.,
(1997). Intake of carrots, spinach, and supplements containing vitamin A in relation
to risk of breast cancer. Journal of Cancer Epidemiology Biomarkers and
Prevention. 6: 887-892.
Longstreth, D.J., & Nobel, P.S., (1980). Nutrient influences on leaf photosynthesis.
Effects of nitrogen, phosphorus and potassium for Gossypium hirsutum L. Plant
Physiology. 65: 541-543.
Lopez-Ayerra, B., Murcia, M.A., & Garcia-Carmona, F., (1998). Lipid peroxidation and
chlorophyll levels in spinach during refrigerated storage and after industrial
processing. Food Chemistry. 61: 113-118.
Lucier, G., Allshouse, J., & Lin, B.H., (2004). Factors affecting Spinach Consumption in
the United States, Electronic Outlook Report from the Economic Research Service.
U.S. Department of Agriculture: Washington, DC.
Luo, Z.B., Calfapietera, C., Scarascia-Mugnozza, G., Liberloo, M., & Polle, A., (2006).
Carbon-based secondary metabolites and internal nitrogen pools in populus nigra
under free Air CO2 Enrichment (FACE) and nitrogen fertilisation. Journal of Plant
and Soil. 304: 45-57.
Lurie, S., (2003). Antioxidants. In: Hodges, D.M. (Ed.) Postharvest oxidative stress in
horticultural crops; New York: Food Products Press. 131-150.
60
Lynch, J.P., Ochoa, I.E., & Blair, M.W., (2006). QTL analysis of adventitious root
formation in common bean under contrasting phosphorus availability. Journal of
Crop Science. 46: 1609-1621.
Magnifico, V., Bianco, V.V., Sarli, A., De Boni, A., & Santamaria P., (1992). Results of
the second five year period of an intensive production schedule of four vegetable
crops for processing. I. Influence of herbicides and nutrition on crop yields. Journal
of Revised Agronomy. 26: 88-96.
Manach, C., Williamson, G., Morand, C., Scalbert, A., & Remesy, C., (2005).
Bioavailability and bioefficacy of polyphenols in humans. I. Review of 97
bioavailability studies. American Journal of Clinical Nutrition. 81: 230-242.
Majunmdar, S., Ghosh, S., Glick, B.R., & Dumbrof, E.B., (1991). Activities of
chloprophyllase, phosphoenolpyruvate carboxylase and ribulose-1, 5-bisphosphate
carboxylase in the primary leaves of soybean during senescence and drought.
Journal of Physiology of Plant. 81: 473-480.
Maschner, P., (2012). Maschner’s Mineral Nutrition of higher Plants, 3rd edition. Academic
Press: London, United Kingdom.178-189.
Marschner, H., (1995). Mineral Nutrition of Higher Plants. 2nd Edition. Academic Press;
San Diego, California, USA. 9:15-20.
Maynard, D.N., Barker, A.V., Minotti, P.L., and Peck, H.H., (1976). Nitrate accumulation in
vegetable. Advanced Agronomy. 28: 71-118.
Medina, M.S., Tudela, J.A., Marín, A., Allende, A., & Gil, M.I., (2012). Short postharvest
storage under low relative humidity improves quality and shelf life of minimal
processed Baby spinach. Postharvest Biology and Technology. 67: 1–9.
Meyer. B.S., & Anderson, D.B., (1952). Nitrogen metabolism of Plant Physiology. 501-
524.
Miller, C.R., Ochoa, I., Nielsen, K.L., Beck, D., & Lynch, J.P., (2003). Genetic variation for
adventitious rooting in response to low phosphorus availability: potential utility for
phosphorus acquisition from stratified soils. Functional Plant Biology. 30: 973-985.

61
Miras-Avalos, J.M., Alcobendas, R., Alarcon, J.J., Valsesia, P., Genard, M., & Nicolas, E.,
(2013). Assessment of the water stress effects on peach fruit quality and size using
a fruit tree model. Journal of Agriculture and Water Management. 128: 1-12.
Moll, R.H., Kamprath, E.J., & Jackson, W.A., (1982). Analysis and interpretation of factors
which contribute to efficiency of N utilization. Agronomy Journal. 74: 562-564.
Mozafar, A., (1994). Plant Vitamins: Journal of Agronomic, Physiological and Nutritional
Aspect. 320-323.
Mudau, N. F., Soundy, P., and Du Toit, E. S., (2005). Plant growth and development of
bush tea as affected by nitrogen, phosphorus, and potassium
nutrition. HortScience, 40: 1898-1901.
Müller, H., (1997). Determination of the carotenoid content in selected vegetables and
fruit by HPLC and photodiode array detection. Zeitschrift für Lebensmittel-
Untersuchung und -Forschung A. 204: 88-9.
Mullins, G.L & Burmester, C.H., (1998). Potassium uptake by crops during the season. In:
Oosterhuis, D.M., & Berkowits, G.A. (Eds) Frontiers in Potassium Nutrition: New
Perspectives on the Effects of Potassium on Physiology of Plants. Journal of
Agronomy. 20: 123-132.
Mullins, G.L., Reeves, D.W., Burmester, C.H., & Bryant, H.H., (1994). In-row subsoiling
and potassium placement effects on root growth and potassium content of cotton.
Journal of Agronomy. 86: 136-139.
Neuhouser, M.L., (2004). Dietary flavonoids and cancer risk: Evidence from human
population studies. Journal of Nutrition and Cancerian International. 50: 1-7.
Neuschwander-Tetri, B.A., (2001). Betaine: an old therapy for a new scourge. Journal of
Gastroenterol. 96: 2534-6.
Ni X., Quinsenberry, S, S., Markwell, J., Heng-Moss, T., Higley L., & Baxendale, F.,
(2001). In vitro enzymatic chlorophyll catabolism in wheat eliciuted by cereal aphid
feeding. Entomology Experimental Applied. 101: 159-166.
Ninfali, P., & Bacchiocca, M., (2004). Parameters for the detention of post-harvest quality
in fresh or transformed horticultural crops. Food Agriculture and Environment. 2:
122-127.

62
Nonnicke, I.L., (1989). Vegetable production, Van Nostrand Runhold. 476-484.
Novaes, E., Osorio, L., Drost, D.R., Miles, B.L., Boaventura-Novaes, C.R., Benedict, C.,
Dervinis, C., Yu, Q., Sykes, R., & Davis, M., (2009). Quantitative genetic analysis of
biomass and wood chemistry of populous under different nitrogen levels. New
Phytology. 182: 878-890.
Nyborg, M., Malhi, S. S., Mumey, G., Penney, D. C., & Laverty, D. H., (1999). Economics
of phosphorus fertilization of barley as influenced by concentration of extractable
phosphorus in the soil. Communal of Soil Science and Plant Analogy. 30: 1789-
1795.
Nyska, A., Lomnitski, L., Spalding, J., Dunson, D.B., Goldsworthy, T.L., Grossman, S.,
Bergaman, M., & Boorman, G., (2001). Topical and oral administration of the natural
water-soluble antioxidant from spinach reduces the multiplicity of papillomas in the
Tg.AC mouse model. Toxicology Letters. 122: 33-44.
Oikeh, S.O., Kling, J.G., Horst, W.J., Chuide, V.O., & Carsky, R.J., (1999). Growth and
distribution of maize roots under nitrogen fertilization in plinthite soil. Field Crops
Research. 62: 1-13.
Omenn, G.S., Goodman, G.E., Thornquist, M.D., Balmes, J., Cullen, M.R., Glass, A.,
Keogh, J.P., Meyskens, F.L., Jr, Valanis, B., Williams, J.H., JrBarnhart, S., &
Hammar, S., (1996). Effects of a combination of beta carotene and vitamin A on
lung cancer and cardiovascular disease. Journal of Nutritional Science. 334: 1150-
1155.
Patil, B.S., Pike, L.M., & Hamilton, B.K., (1995). Changes in quercetin concentration in
onion (Allium cepa L.) owing to location, growth stage and soil type. New
Phytolology. 130: 349-355.
Pavlovic, R., Petrovic, S., & Stevanovic, D., (1996). The influence of cultivar and
fertilization on yield and N03-N accumulation in spinach leaf. Acta Horticulturae. 456:
269-273.
Plenets, D., Mollier, A., & Pellerin, S.I., (2000). Growth analysis of maize field crops under
phosphorus deficiency. II. Radiation use efficiency, biomass accumulation and yield
components. Journal of Plant Soil. 224: 259-272.

63
Pervez, H., Ashraf, M., & Makhdum, M.I., (2004). Influence of potassium nutrition on gas
exchange characteristics and water relations in cotton (Gossypium hirsutum L.)
Photosynthetic. 42: 251-255.
Pettigrew, W.T., & Meredith, W.R., Jr (1997). Dry matter production, nutrient uptake, and
growth of cotton as affected by potassium fertilization. Journal of Plant Nutrition. 20:
531-548.
Pettigrew, W.T., (2003). Relationship between insufficient potassium and crop maturity in
cotton. Journal of Agronomy. 95: 1323-1329.
Prior, R.L., Cao, G., Martin, A., Sofic, E., McEwen, J., O’Brien, C., Lischiner, N.,
Ehlenfeldt, M., Kalt, W., Krewer, G., & Mainland, C.M., (1998). Antioxidant capacity
as influenced by total phenolic and anthocyanin content, maturity, and variety of
Vaccinium species. Journal of Agriculture and Food Chemistry. 46: 2686-2693.
Rico, D., Martin-Diana, A.B., Barat, J.M., & Barry-Ryan, C., (2007). Extending and
measuring the quality of fresh-cut fruit and vegetables: A review. Trends Food
Science of Technology Journal. 18: 373-386.
Reams, S.M., (2002). Patient education, foods high in magnesium. Journal of renal
nutrition. 12: 60-64.
Reidenbach, G., & Horst, W.J., (1997). Nitrate-uptake capacity of different root zones of
Zea mays (L.) in vitro and in situ. Journal of Plant and Soil. 196: 295-300.
Reymond, M., Svistoonoff, S., Loudet, O., Nussaume, L., & Desnos, T., (2006).
Identification of QTL controlling root growth response to phosphate starvation in
Arabidopsis thaliana. Journal of Plant, Cell and Environment. 29: 115-125.
Sakamoto, A., Nishimura, Y., Ono, H., & Sakura, N., (2002). Betaine and homocysteine
concentrations in foods. Pediatrician Introduction Journal. 44: 409-13.
Samuelson, L.J., (2000). Effects of nitrogen on leaf physiology and growth of different
families of loblolly and slash pine. Journal of Plant Physiology. 19: 95-107.
Santamaria, P., Elia, A., Parente, A., & Serio, F., (1998). Fertilization strategies for
lowering nitrate accumulation in leafy vegetables: chicory and rocket salad case.
Journal of Plant Nutrition. 21: 1791-1803.

64
Santamaria, P., Elia, A., Serio F., & Todaro, E., (1999). A survey of Nitrate and Oxalate
content in fresh vegetables. Journal of Science of Food and Agriculture. 79: 1882-
1888.
Seddon, J.M., Ajani, U.A., & Spertudo, R.D., (1992). Risk factors for age related macular
degeneration. The eye disease case control study group. Journal of Arch
Ophthalmology. 110: 1701-1708.
Schachtman, D.P., & Shin, R., (2007). Nutrient sensing and signaling: PKS. Annual
Revised Plant Biology Journal. 58: 47-69.
Schuphan, W., (1969). Bildung von Nitrat und Nitrit im pflanzlichen Stoffwechsel. Journal
of Plant Disorder and Nutrient Deficiencies. 11: 120-132.
Sharma, P.N., (1995). Water relations and photosynthesis in phosphorus deficient
mulberry plants. Indian Journal of Plant Physiology. 38: 298-300.
Shearer, M.J., Vermeer, C., & Zitterman, A., (2004). Beyond deficiency: potential benefits
of increased intakes of vitamin K for bone and vascular health. Journal of European
Clinic nutrition. 43: 325-225.
Sies, H., (1997). Oxidative stress: oxidants and antioxidants. Journal of Experiential.
Physiology. 82:291-295.
Singh, P., & Blanke, M.M., (2000). Deficiency of potassium but not phosphorus enhances
root respiration. Journal of Plant Growth Regulator. 32: 77-81.
Sinha, R.B., Sakal, R., & Kumar, S., (1995). Sulphur and phosphorus nutrition of winter
maize in calcareous soil. Indian Journal of Social and Soil Science. 43: 413-418.
Soundy, P., Cantliffe D.J., Hochmuth G.J., & Stofella P.J., (2001). Nutrient requirements
for lettuce transplants using a floatation irrigation system. I. Phosphorus. Journal of
Horticulture Science. 36: 1066-1070.
Soundy, P., & Cantlife, D.J., (2001). Improving lettuce transplant quality in response to
nitrogen nutrition in a floation production production system. Journal of Horticulture
Science. 114: 294-303.

65
Stagnari, F., Di Bitetto, V., & Pisante, M., (2007). Effects of N fertilizers and rates on yield,
safety and nutrients in processing spinach genotypes. Journal of Horticulture
Science. 114: 224-233.
Stuart, A., & Craig. S., (2004). Betaine in human nutrition. The American Journal of
Clinical Nutrition. 80: 539-549.
Talbott, L.D., & Zeiger, E., (1996). General role of potassium and sucrose in guard cell
osmoregulation. Journal of Plant Physiology. 111: 1051-1057.
Taylor, G., Macdonald, A.J.S., Stadenberg, I., & Free-Smith, P.H., (1993). Nitrate supply
and the biophysics of leaf growth in Salix viminalis. Journal of Experiential Botany.
44: 155-164.
Teddy, E.M & James, C.C., (2008). Vegetables handbook of plant breeding. 1: 189-218.
Tei, F., Benincasa P., & Guiducci, M., (2000). Effect of nitrogen availability on growth and
nitrogen uptake in lettuce. Journal of Acta Horticulturae. 533: 385-392.
Tiwari, H.S., Agarwal, R.M., & Bhatt, R.K., (1998). Photosynthesis, stomatal resistance
and related characters as influenced by potassium under normal water supply and
water stress conditions in rice (Oryza sativa L.). Indian Journal of Plant Physiology.
3: 314-316.
Tomemori, H., Hamamura, K., & Tanabe, K., (2002). Interactive effects of sodium and
potassium on the growth and photosynthesis of spinach and komatsuna. Journal of
Plant Production Science. 5: 281-285.
Tokar, J.L., & Berg, C.L., (2002). Therapeutic options in nonalcoholic fatty liver disease.
Current Treatment Options Gastroenterol. 5: 425–36.
Toledo, M.E.A., Ueda, Y., Imahori, Y., & Ayaki, M., (2003). L-ascorbic acid metabolism in
spinach (Spinacia oleracea L.) during postharvest storage in light and dark. Journal
of Postharvest Biology and Technology. 28: 47-57.
USDA, (2005). U.S. Department of Agriculture, Agricultural Research Service. USDA
National Nutrient Database for Standard Reference, Washington DC; Release 18.
Van Lerser, M.W., (1999). Fertilizer concentration affects growth and nutrient composition
of sub-irrigated pansies. Journal of Horticulture Science. 34: 660-663.

66
Varian Liberty Series II (1997). Hardware operation manual.
Vernieri, P., Borghesi, E., Tognoni, F., & Ferrante, A., (2006). Use of biostimulants for
reducing nutrient solution concentration in floating system. Journal of Acta
Horticulture. 718: 477-484.
Vogt, T., & Gulz, P.G., (1994). Accumulation of flavonoids during leaf development in
Cistus laurifolius. Journal of Phytochemistry. 36: 591-597.
Wang, Y., Chang, C.F., Chou, J., Chen, H.L., Deng, X., Harvey, B.K., Cadet, J.L., &
Bickford, P.C., (2005). Dietary supplementation with blueberries, spinach, or
spirulina reduces ischemic brain damage. Journal of Experimental Neurology.193:
75-84.
Wang, S.Y., & Zheng, W., (2001). Effect of plant growth temperature on antioxidant
capacity. Journal of Agriculture and Food Chemistry. 49: 4977-4982.
Wang, R., Guegler, K., LaBrie, S.T., & Crawford, N.M., (2000). Genomic analysis of a
nutrient response in Arabidopsis reveals diverse expression patterns and novel
metabolic and potential regulatory genes induced by nitrate. Plant Cell. 12: 1491-
1509.
Wang, Y., & Wu, W.H., (2013). Potassium transport and signalling in higher plants.
Annual Revised Plant Biology. 64: 451-476.
Whitehead, E. J., & Hoxton, A.L., (1952). Nitrate poisoning. Acta Agriculture
Scandinavica. 424: 24.
Wiesler, F., & Horst, W.J., (1994). Root growth and nitrate utilization of maize cultivars
under field conditions. Journal of Plant and Soil. 163: 267-277.
William, T.P., (2007). Potassium influences on yiled and quality production for maize,
wheat, soybean and cotton. Physiologia Plantarum. 133: 670-681.
Williamson, G., (1996). Protective effects of fruit and vegetables in the diet. Journal of
Nutrition and Food Science. 96: 6-10.
Wills, R., McGlasson, B., Graham, D., & Joyce, D., (1998). Postharvest: an introduction to
the physiology and handling of fruit, vegetables and ornamentals. 4th edition. CAB
International. Wallingford Oxon, UK. 230-234.
67
World Health Organization, (2003). Journal of Diet, nutrition and the prevention of
chronic diseases. Report of a Joint FAO/WHO Expert Consultation. WHO Technical
Report Series No. 916. Geneva, Switzerland.
Xu, H.X., Weng, X.Y., & Yang, Y., (2007). Effect of phosphorus deficiency on the
photosynthetic characteristics of rice plants. Russian Journal of Plant Physiology.
54: 741-748.
Yadav, D.S., Goyal, A.K., & Vats, B.K., (1999). Effect of potassium in Eleusine coracana
(L.) Gaertn. Under moisture stress conditions. Journal of Potassium
Research.15:131-134.
Yang, Y.J., Marczak, E.D., Yokoo, M., Usui, H., & Yoshikawa, M., (2003). Isolation and
antihypertensive effect of angiotensin I-converting enzyme (ACE) inhibitory peptides
from spinach Rubisco. Journal of Agriculture and Food Chemistry. 51: 4897-4902.
Zazoski, R.J., & Burau, R.G., (1977). A rapid Nitric-Perchloric Acid Digestion Method for
Multi-Element Tissue Analysis. Journal of Soil Science and Plant Analogy. 8: 425-
436.
Zeisel, S.H., Mar, M.H, Howe, J.C., & Holden, J.M., (2003). Concentrations of choline-
containing compounds and betaine in common foods. Journal of Nutrition.133:1302-
1307.
Zhao, D., Oosterhuis, D.M., & Berdarz, C.W., (2001). Influence of potassium deficiency
on photosynthesis, chlorophyll content, and chloroplast ultrastructure of cotton
plants. Journal of Photosynthentica. 39:103-109.
Zimmermann, P., & Zentgraf, U., (2005). The correlation between oxidative stress and
leaf senescence during plant development. Journal of Cellular and Molecular
Biology. 10: 515-534.
Zhu, X., Song, J., Mar, M.H., Edwards, L.J., & Zeisel, S.H., (2003).
Phosphatidylethanolamine N–methyltransferase (PEMT) knockout mice have
hepatic steatosis and abnormal hepatic choline metabolite concentrations despite
ingesting a recommended dietary intake of choline. Journal of Biochemistry. 370:
987-93.

68
Zhu, J.M., Kaeppler, S.M., & Lynch, J.P., (2005a). Mapping of QTL controlling root hair
length in maize (Zea mays L.) under phosphorus deficiency. Journal of Plant and
Soil. 270: 299-310.

69
APPENDIX 1
Analysis of variance (ANOVA) for parameters of N, P, K and NPK combined
nutrition
ANOVA for fresh mass in response to nitrogen
Source DF Sum of Squares Mean Square F Value Pr>F
Model 7 3167.791510 452.541644 5.89 0.0038
Error 12 921.568570 76.797381
TRT 4 2756.267230 689.066808 8.97 0.0014
BLOCK 3 411.524280 137.174760 1.79 0.2033
Corrected
Total
19 4089.360080
ANOVA for dry mass in response to nitrogen
Source DF Sum of Squares Mean Square F Value Pr>F
Model 7 207.6550700 29.6650100 7.57 0.0013
Error 12 47.0043300 3.9170275
TRT 4 192.1973500 48.0493375 12.27 0.0003
BLOCK 3 15.4577200 5.1525733 1.32 0.3149
Corrected
Total
19 254.6594000
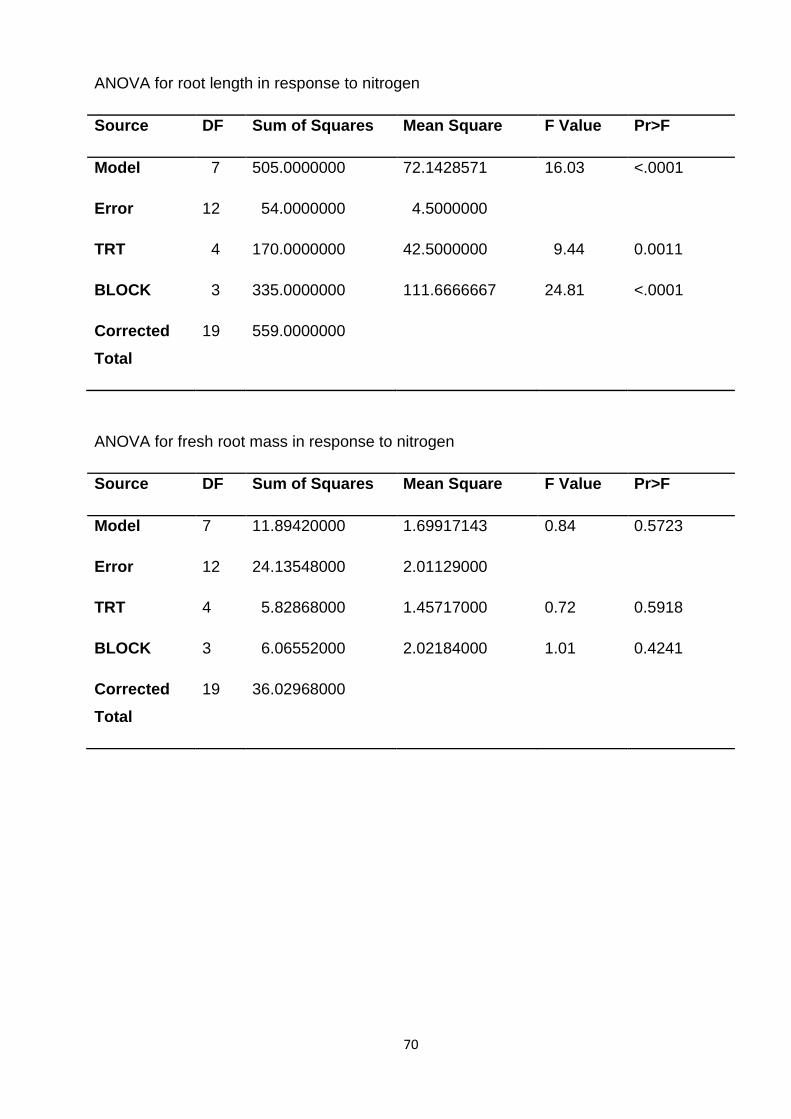
70
ANOVA for root length in response to nitrogen
Source DF Sum of Squares Mean Square F Value Pr>F
Model 7 505.0000000 72.1428571 16.03 <.0001
Error 12 54.0000000 4.5000000
TRT 4 170.0000000 42.5000000 9.44 0.0011
BLOCK 3 335.0000000 111.6666667 24.81 <.0001
Corrected
Total
19 559.0000000
ANOVA for fresh root mass in response to nitrogen
Source DF Sum of Squares Mean Square F Value Pr>F
Model 7 11.89420000 1.69917143 0.84 0.5723
Error 12 24.13548000 2.01129000
TRT 4 5.82868000 1.45717000 0.72 0.5918
BLOCK 3 6.06552000 2.02184000 1.01 0.4241
Corrected
Total
19 36.02968000

71
ANOVA for dry root mass in response to nitrogen
Source DF Sum of Squares Mean Square F Value Pr>F
Model 7 0.94628000 0.13518286 1.01 0.4689
Error 12 1.60180000 0.13348333
TRT 4 0.39708000 0.09927000 0.74 0.5804
BLOCK 3 0.54920000 0.18306667 1.37 0.2986
Corrected
Total
19 2.54808000
ANOVA for chlorophyll in response to nitrogen
Source DF Sum of Squares Mean Square F Value Pr > F
Model 7 254251.7430 36321.6776 3.89 0.0192
Error 12 112106.1890 9324.1824
TRT 4 243952.3870 60988.0968 6.53 0.0050
BLOCK 3 10299.3560 3433.1187 0.37 0.7778
Corrected
Total
19 366357.9320

72
ANOVA for upper stomatal conductance in response to nitrogen
Source DF Sum of Squares Mean Square F Value Pr > F
Model 7 380591.5575 54370.2225 1.51 0.2534
Error 12 432411.6000 36034.3000
TRT 4 354383.9400 88595.9850 2.46 0.1020
BLOCK 3 26207.6175 8735.8725 0.24 0.8651
Corrected
Total
19 813003.1575
ANOVA for lower stomatal conductance in response to nitrogen
Source DF Sum of Squares Mean Square F Value Pr>F
Model 7 127362.0925 18194.5846 1.46 0.2688
Error 12 149398.8850 12449.9071
TRT 4 78138.93500 19534.98375 1.57 0.2452
BLOCK 3 49222.15750 16407.38583 1.32 0.3141
Corrected
Total
19 276760.9775

73
ANOVA for Leaf Area Index (LAI) in response to nitrogen
Source DF Sum of Squares Mean Square F Value Pr>F
Model 7 5.60094135 0.80013448 1.51 0.2540
Error 12 6.37198920 0.53099910
TRT 4 4.41228680 2.08 2.08 0.1470
BLOCK 3 1.18865455 0.75 0.75 0.5451
Corrected
Total
19 11.97293055
ANOVA for fresh mass in response to phosphorus
Source DF Sum of Squares Mean Square F Value Pr>F
Model 7 382.6431300 57.6633043 6.25 0.0030
Error 12 104.9649500 8.7470792
TRT 4 370.9469300 92.7367325 10.60 0.0007
BLOCK 3 11.6962000 3.8987333 0.45 0.7248
Corrected
Total
19 487.6080800

74
ANOVA for dry matter in response to phosphorus
Source DF Sum of Squares Mean Square F Value Pr>F
Model 7 18.97504000 2.71072000 3.85 0.0199
Error 12 8.44244000 0.70353667
TRT 4 16.81968000 4.20492000 5.98 0.0070
BLOCK 3 2.15536000 0.71845333 1.02 0.4176
Corrected
Total
19 27.41748000
ANOVA for root length in response to phosphorus
Source DF Sum of Squares Mean Square F Value Pr>F
Model 7 138.0000000 19.7142857 1.94 0.1503
Error 12 122.2000000 10.1833333
TRT 4 56.20000000 14.05000000 1.38 0.2985
BLOCK 3 81.80000000 27.26666667 2.68 0.0943
Corrected
Total
19 260.2000000

75
ANOVA for fresh root mass in response to phosphorus
Source DF Sum of Squares Mean Square F Value Pr>F
Model 7 1.14912500 0.16416071 4.35 0.0127
Error 12 0.45253000 0.03771083
TRT 4 0.11063000 0.02765750 0.73 0.5865
BLOCK 3 1.03849500 0.34616500 9.18 0.0020
Corrected
Total
19 1.60165500
ANOVA for dry root mass in response to phosphorus
Source DF Sum of Squares Mean Square F Value Pr>F
Model 7 0.09225000 0.01317857 4.35 0.0128
Error 12 0.03635000 0.00302917
TRT 4 0.00685000 0.00171250 0.57 0.6926
BLOCK 3 0.08540000 0.02846667 9.40 0.0018
Corrected
Total
19 0.12860000

76
ANOVA for chlorophyll in response to phosphorus
Source DF Sum of Squares Mean Square F Value Pr>F
Model 7 36451.34100 5207.33443 17.39 <.0001
Error 12 3592.36100 299.36342
TRT 4 30104.74700 7526.18675 25.14 <.0001
BLOCK 3 6346.59400 2115.53133 7.07 0.0054
Corrected
Total
19 40043.70200
ANOVA for upper stomatal conductance in response to phosphorus
Source DF Sum of Squares Mean Square F Value Pr>F
Model 7 14657.86300 2093.98043 0.82 0.5863
Error 12 30498.24700 2541.52058
TRT 4 12278.30500 3069.57625 1.21 0.3575
BLOCK 3 2379.55800 793.18600 0.31 0.8163
Corrected
Total
19 45156.11000

77
ANOVA for lower stomatal conductance in response to phosphorus
Source DF Sum of Squares Mean Square F Value Pr>F
Model 7 5588.721000 798.388714 2.38 0.0900
Error 12 4032.929000 336.077417
TRT 4 2176.575000 544.143750 1.62 0.2329
BLOCK 3 3412.146000 1137.382000 3.38 0.0541
Corrected
Total
19 9621.650000
ANOVA for Leaf Area Index in response to phosphorus
Source DF Sum of Squares Mean Square F Value Pr>F
Model 7 574.8939522 82.1277074 5.15 0.0066
Error 12 191.3527944 15.9460662
TRT 4 526.3385088 131.5846272 8.25 0.0019
BLOCK 3 48.5554434 16.1851478 1.01 0.4201
Corrected
Total
19 766.2467466

78
ANOVA for fresh mass in response to potassium
Source DF Sum of Squares Mean Square F Value Pr>F
Model 7 26.05603000 3.72229000 0.90 0.5365
Error 12 49.61925000 4.13493750
TRT 4 18.29703000 4.57425750 1.11 0.3979
BLOCK 3 7.75900000 2.58633333 0.63 0.6122
Corrected
Total
19 7.75900000
ANOVA for dry mass in response to potassium
Source DF Sum of Squares Mean Square F Value Pr>F
Model 7 2.73720500 0.39102929 0.05 0.4488
Error 12 4.47489000 0.37290750
TRT 4 1.68347000 0.42086750 1.13 0.3886
BLOCK 3 1.05373500 0.35124500 0.94 0.4509
Corrected
Total
19 7.21209500

79
ANOVA for root length in response to potassium
Source DF Sum of Squares Mean Square F Value Pr>F
Model 7 53.5000000 7.6428571 0.86 0.5616
Error 12 106.5000000 8.8750000
TRT 4 47.50000000 11.87500000 1.34 0.3118
BLOCK 3 6.00000000 2.00000000 0.23 0.8769
Corrected
Total
19 160.0000000
ANOVA for fresh root mass in response to potassium
Source DF Sum of Squares Mean Square F Value Pr>F
Model 7 0.87177660 0.12453951 0.89 0.5438
Error 12 1.68152160 0.14012680
TRT 4 0.77511520 0.19377880 1.38 0.2975
BLOCK 3 0.09666140 0.3222047 0.23 0.8738
Corrected
Total
19 2.55329820

80
ANOVA for dry roots mass in response to potassium
Source DF Sum of Squares Mean Square F Value Pr>F
Model 7 0.20034500 0.02862071 1.19 0.3790
Error 12 0.28963000 0.02413583
TRT 4 0.12865000 0.03216250 1.33 0.3136
BLOCK 3 0.07169500 0.02389833 0.99 0.4303
Corrected
Total
19 0.48997500
ANOVA for chlorophyll in response to potassium
Source DF Sum of Squares Mean Square F Value Pr > F
Model 7 4169.19050 595.59864 0.60 0.7448
Error 12 11896.32700 991.36058
TRT 4 3633.565000 908.391250 0.92 0.4857
BLOCK 3 535.625500 178.541833 0.18 0.9078
Corrected
Total
19 16065.51750

81
ANOVA for upper stomatal conductance in response to potassium
Source DF Sum of Squares Mean Square F Value Pr> F
Model 7 1170.873000 167.267571 1.32 0.3212
Error 12 1522.315000 126.859583
TRT 4 558.4930000 139.6232500 1.10 0.4003
BLOCK 3 612.3800000 204.1266667 1.61 0.2391
Corrected
Total
19 2693.188000
ANOVA for lower stomatal conductance in response to potassium
Source DF Sum of Squares Mean Square F Value Pr>F
Model 7 589.626000 84.232286 0.87 0.5538
Error 12 1157.674000 96.472833
TRT 4 276.8100000 69.2025000 0.72 0.5962
BLOCK 3 312.8160000 104.2720000 1.08 0.3942
Corrected
Total
19 1747.300000

82
ANOVA for Leaf Area Index (LAI) in response to potassium
Source DF Sum of Squares Mean Square F Value Pr>F
Model 7 1.62758410 0.23251201 4.25 0.0139
Error 12 0.65655810 0.05471317
TRT 4 0.67715670 0.16928918 3.09 0.0576
BLOCK 3 0.95042740 0.31680913 5.79 0.0110
Corrected
Total
19 2.28414220
ANOVA for fresh mass in response to NPK interaction
Source DF Sum of Squares Mean Square F Value Pr>F
Model 7 128.5904200 18.3700600 5.90 0.0038
Error 12 37.3830000 3.1152500
TRT 4 97.55452000 24.38863000 7.83 0.0024
BLOCK 3 31.03590000 10.34530000 3.32 0.0568
Corrected
Total
19 165.9734200
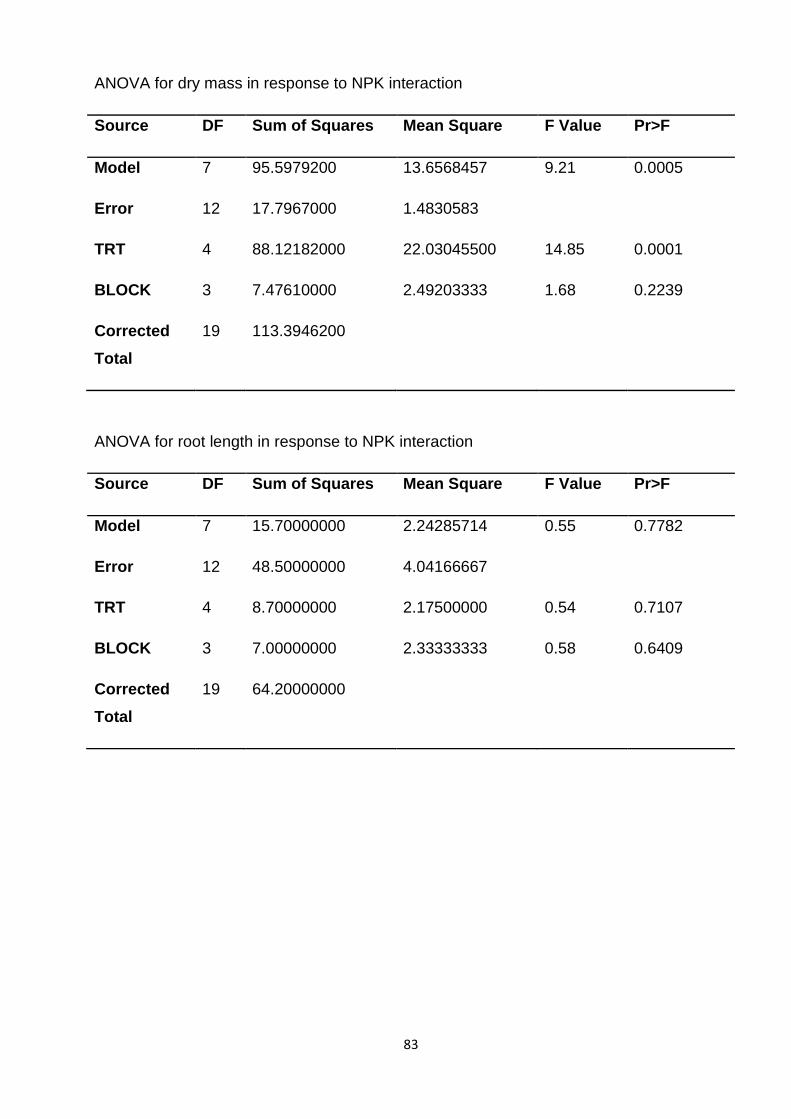
83
ANOVA for dry mass in response to NPK interaction
Source DF Sum of Squares Mean Square F Value Pr>F
Model 7 95.5979200 13.6568457 9.21 0.0005
Error 12 17.7967000 1.4830583
TRT 4 88.12182000 22.03045500 14.85 0.0001
BLOCK 3 7.47610000 2.49203333 1.68 0.2239
Corrected
Total
19 113.3946200
ANOVA for root length in response to NPK interaction
Source DF Sum of Squares Mean Square F Value Pr>F
Model 7 15.70000000 2.24285714 0.55 0.7782
Error 12 48.50000000 4.04166667
TRT 4 8.70000000 2.17500000 0.54 0.7107
BLOCK 3 7.00000000 2.33333333 0.58 0.6409
Corrected
Total
19 64.20000000

84
ANOVA for fresh root mass in response to NPK interaction
Source DF Sum of Squares Mean Square F Value Pr>F
Model 7 0.20165000 0.02880714 0.99 0.4794
Error 12 0.34765000 0.02897083
TRT 4 0.13715000 0.03428750 1.18 0.3668
BLOCK 3 0.06450000 0.02150000 0.74 0.5472
Corrected
Total
19 0.54930000
ANOVA for dry root mass in response to NPK interaction
Source DF Sum of Squares Mean Square F Value Pr>F
Model 7 0.20004500 0.02857786 1.32 0.3221
Error 12 0.26053000 0.02171083
TRT 4 0.07075000 0.01768750 0.81 0.5397
BLOCK 3 0.12929500 0.04309833 1.99 0.1701
Corrected
Total
19 0.46057500

85
ANOVA for chlorophyll in response to NPK interaction
Source DF Sum of Squares Mean Square F Value Pr>F
Model 7 3413.869050 487.695579 1.56 0.2365
Error 12 3741.269530 311.772461
TRT 4 2221.267430 555.316857 1.78 0.1974
BLOCK 3 1192.601620 397.533873 1.28 0.3272
Corrected
Total
19 7155.138580
ANOVA for upper stomatal conductance in response to NPK interaction
Source DF Sum of Squares Mean Square F Value Pr>F
Model 7 1243.069000 177.581286 3.64 0.0243
Error 12 585.699000 48.808250
TRT 4 504.6530000 126.1632500 2.58 0.0907
BLOCK 3 738.4160000 246.1386667 5.04 0.0173
Corrected
Total
19 1828.768000

86
ANOVA for lower stomatal conductance in response to NPK interaction
Source DF Sum of Squares Mean Square F Value Pr>F
Model 7 678.371000 96.910143 1.75 0.1875
Error 12 663.457000 55.288083
TRT 4 338.5430000 84.6357500 1.53 0.2551
BLOCK 3 339.8280000 113.2760000 2.05 0.1607
Corrected
Total
19 1341.828000
ANOVA for Leaf Area Index in response to NPK interaction
Source DF Sum of Squares Mean Square F Value Pr>F
Model 7 1.88252500 0.26893214 1.87 0.1630
Error 12 1.72756320 0.14396360
TRT 4 0.36157920 0.09039480 0.63 0.6518
BLOCK 3 1.52094580 0.50698193 3.52 0.0489
Corrected
Total
19 3.361008820