growing appetite for a healthy and sustainable diet ... · pdf filegrowing appetite for a...
TRANSCRIPT

Growing appetite for a healthy and sustainable diet:Soyfood production and consumption in Europe
2014
Introduction • 3
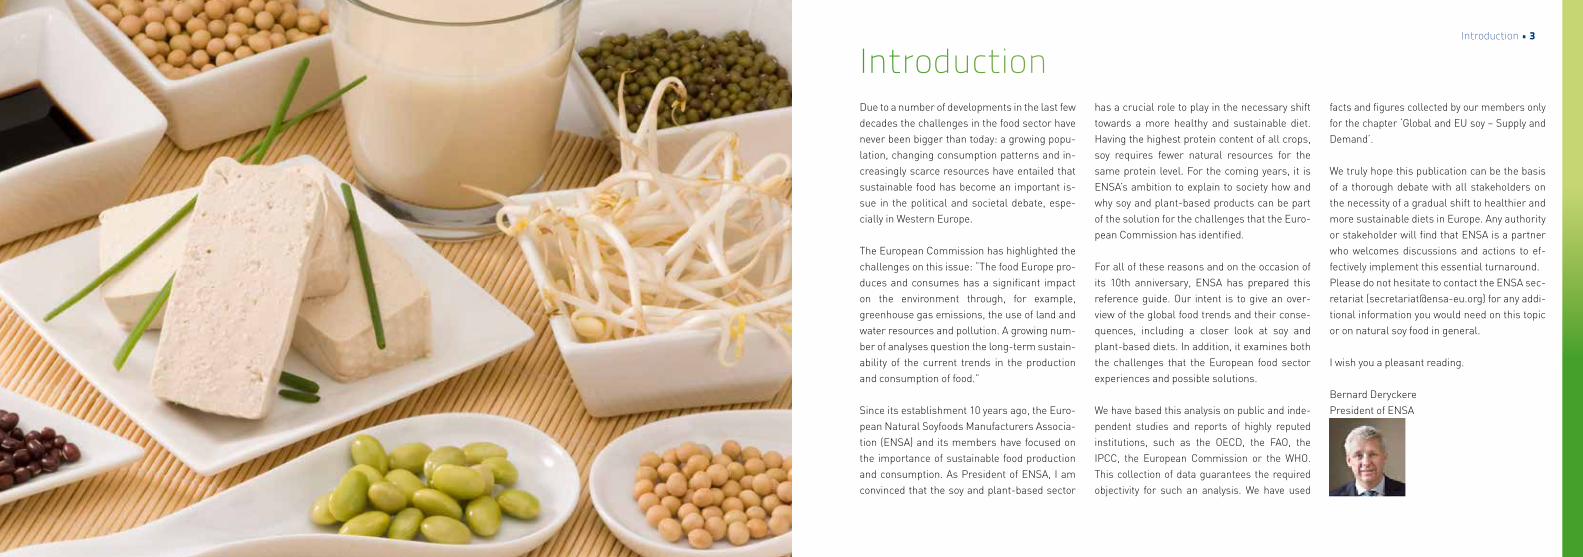
Due to a number of developments in the last few decades the challenges in the food sector have never been bigger than today: a growing popu-lation, changing consumption patterns and in-creasingly scarce resources have entailed that sustainable food has become an important is-sue in the political and societal debate, espe-cially in Western Europe.
The European Commission has highlighted the challenges on this issue: “The food Europe pro-duces and consumes has a significant impact on the environment through, for example, greenhouse gas emissions, the use of land and water resources and pollution. A growing num-ber of analyses question the long-term sustain-ability of the current trends in the production and consumption of food.”
Since its establishment 10 years ago, the Euro-pean Natural Soyfoods Manufacturers Associa-tion (ENSA) and its members have focused on the importance of sustainable food production and consumption. As President of ENSA, I am convinced that the soy and plant-based sector
has a crucial role to play in the necessary shift towards a more healthy and sustainable diet. Having the highest protein content of all crops, soy requires fewer natural resources for the same protein level. For the coming years, it is ENSA’s ambition to explain to society how and why soy and plant-based products can be part of the solution for the challenges that the Euro-pean Commission has identified.
For all of these reasons and on the occasion of its 10th anniversary, ENSA has prepared this reference guide. Our intent is to give an over-view of the global food trends and their conse-quences, including a closer look at soy and plant-based diets. In addition, it examines both the challenges that the European food sector experiences and possible solutions. We have based this analysis on public and inde-pendent studies and reports of highly reputed institutions, such as the OECD, the FAO, the IPCC, the European Commission or the WHO. This collection of data guarantees the required objectivity for such an analysis. We have used
facts and figures collected by our members only for the chapter ‘Global and EU soy – Supply and Demand’.
We truly hope this publication can be the basis of a thorough debate with all stakeholders on the necessity of a gradual shift to healthier and more sustainable diets in Europe. Any authority or stakeholder will find that ENSA is a partner who welcomes discussions and actions to ef-fectively implement this essential turnaround. Please do not hesitate to contact the ENSA sec-retariat ([email protected]) for any addi-tional information you would need on this topic or on natural soy food in general.
I wish you a pleasant reading.
Bernard Deryckere President of ENSA
Introduction
4 • Contents Contents • 5
Introduction 2
A sustainable global food supply to feed a growing population 7
Population growth and higher daily intake lead to increased global food consumption 8
Global consumption patterns have changed to a more Western, resource-intensive diet 10
The first challenge: Provide enough food to live up to increasing demand 12
- Growth of net agricultural output is slowing down 14
The second challenge: Increase food production with constant inputs 16
- Restrictions for agricultural land expansion 18
- Water scarcity becomes a global issue 20
- Energy: Food sector should rely more on low-carbon energy systems and become energy efficient 22
The third challenge: Minimize CO2 emissions from agriculture to mitigate climate change 24
The fourth challenge: Encourage a healthy diet to counteract obesity 26
Global and EU soy – supply and demand 29
Soy is the leading oilseed in the world 30
Growing EU soy production but EU remains large importer 32
EU production of soy is entirely free of Genetically Modified Organisms (GMOs) 34
Soybeans are increasingly processed into animal feed 36
The soyfood sector has grown but remains a niche market compared to the reference dairy market 38
A diversifying offer of plant-based products 40
What role for soy- and plant-based diets to feed the increasing population? 43
Soy products are more resource-efficient than animal based products 44
Less land is needed for plant-based food production 46
Water inputs are lower for plant based foods 48
The impact of plant-based foods on Green House Gas (GHG) emissions is lower 50
Plant-based foods are part of a healthy, balanced diet 52
Soy is a high quality protein source of vegetal origin 54
Saturated fat intake is lower with soy- and plant-based diets 56
Soyfood and EU policy 59
The EU must provide the right conditions for the supply of GM-free soybeans and the marketing of GM-free soyfoods
60
Soy and plant-based diets should be promoted by public authorities at the EU and national levels 62
Taxation should provide a level-playing-field 64
With a clear labeling policy, the health and sustainability benefits of plant-based foods could be endorsed 66
Looking forward: 10 wishes for the next 10 years 69
Looking forward: 10 wishes for the next 10 years 70
About ensa 72
References 74
Table of content

A sustainable global food supply to feed a growing population
8 • A sustainable global food supply A sustainable global food supply • 9
9,5
9
8
7
6
5
4
3
2
1
0
Population growth and higher daily intake lead to increased global food consumptionUnprecedented and sustained growth in global population
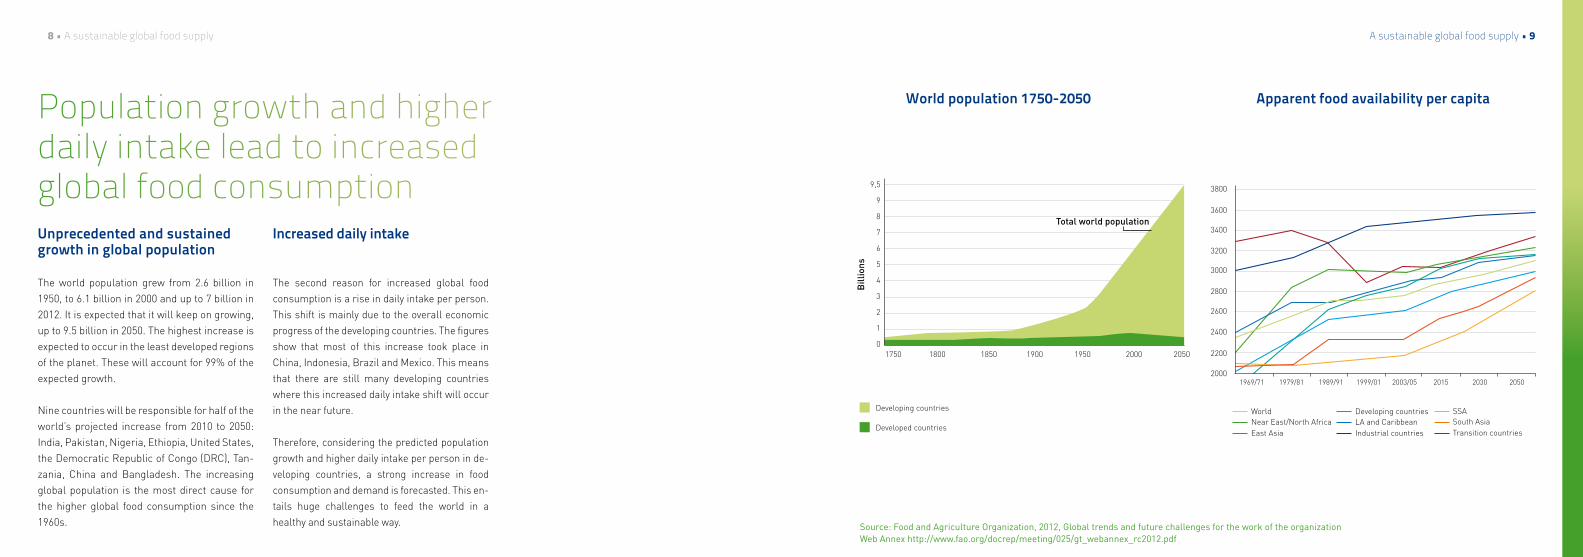
The world population grew from 2.6 billion in 1950, to 6.1 billion in 2000 and up to 7 billion in 2012. It is expected that it will keep on growing, up to 9.5 billion in 2050. The highest increase is expected to occur in the least developed regions of the planet. These will account for 99% of the expected growth.
Nine countries will be responsible for half of the world’s projected increase from 2010 to 2050: India, Pakistan, Nigeria, Ethiopia, United States, the Democratic Republic of Congo (DRC), Tan-zania, China and Bangladesh. The increasing global population is the most direct cause for the higher global food consumption since the 1960s.
Increased daily intake
The second reason for increased global food consumption is a rise in daily intake per person. This shift is mainly due to the overall economic progress of the developing countries. The figures show that most of this increase took place in China, Indonesia, Brazil and Mexico. This means that there are still many developing countries where this increased daily intake shift will occur in the near future.
Therefore, considering the predicted population growth and higher daily intake per person in de-veloping countries, a strong increase in food consumption and demand is forecasted. This en-tails huge challenges to feed the world in a healthy and sustainable way.
World population 1750-2050
1969/71 1979/81 1989/91 1999/01 2003/05 2015 2030 2050
3800
3600
3400
3200
3000
2800
2600
2400
2200
2000
World Developing countriesNear East/North Africa LA and CaribbeanEast Asia Industrial countries
SSASouth AsiaTransition countries
1750 1800 1850 1900 1950 2000 2050
Bill
ions
Developing countries
Developed countries
Apparent food availability per capita
Source: Food and Agriculture Organization, 2012, Global trends and future challenges for the work of the organization Web Annex http://www.fao.org/docrep/meeting/025/gt_webannex_rc2012.pdf
Total world population

10 • A sustainable global food supply A sustainable global food supply • 11
Global consumption patterns have changed to a more Western, resource-intensive diet
Per capita consumption of major food items in developing countries 1961 - 2005
Shift towards livestock products
Aside from the increased daily intake, there is also a change in consumption of major food items: over the last decades, there was a shift towards more livestock products (meat, eggs, milk). This shift occurred mainly in developing countries as most of the developed countries had already completed the transition to such diets.
According to the FAO, the share of consumption of livestock products in developed countries has reached 48% of the total food consumption (i.e. dietary energy supply). This percentage has been stable for several decades and is not ex-pected to further increase.
Evolution in developing countries
Currently, meat, eggs and milk provide 29% of the total food consumption in the developing countries. Three decades ago, this was only 20%. Since the early 1960’s, the consumption per capita has almost doubled for milk, more than tripled for meat and increased by a factor five for eggs.
According to the FAO1, it is expected that the share of livestock production in total world food production will increase from 36% in 2005, to 39% in 2050. This results predominantly from a rise in this share from 30% to 35% in the devel-oping countries.
100
200
300
400
500
1960 1970 1980 1990 2000 2010
Roots and tubers
Meat
Eggs
Milk
Cereals
Source: Food and Agriculture Organization, 2012, Global trends and future challenges for the work of the organization Web Annex http://www.fao.org/docrep/meeting/025/gt_webannex_rc2012.pdf

12 • A sustainable global food supply A sustainable global food supply • 13
Food Security Risk Index 2013
Food security
Food security is a crucial element in any food policy: after the second World War, it was the main reason to introduce the European Com-mon Agriculture Policy in 1957. Today food secu-rity remains a leading challenge at global level with over 800 million people suffering from chronic hunger and a rapidly increasing popula-tion, providing enough food for the world is a key objective.
According to the OECD2, agricultural production will have to increase by at least 60 per cent over the next 40 years to meet an additional con-sumption of 940 million tonnes of cereals and 200 million tonnes of meat a year.
Already a global problem
At this very moment, with a global population of 7 billion people, there are numerous countries where food security is at risk. The Food Security Risk Index is a barometer identifying the countries which may be vulnera-ble to food shortages and societal unrest result-ing from these shortages. In 2013, the highest risks for food insecurity are in developing countries. As most of the popula-tion growth is expected in these regions, this risk will only increase. Food security challenges also remain considerable in emerging econo-mies, such as Brazil, Russia, India or China (BRICs).
Since some developed countries are classified in the ‘medium risk zone’ food security is a global issue which goes beyond the developed/developing country divide.
Source: Food Security Risk Index 2013 Maplecroft
Haiti
Somalia
DR congo Burundi
Chad
Ethiopia
Afghanistan
South sudan
Comoros
Eritrea
Legend
Extreme Risk High Risk Medium Risk Low Risk No data
0 - 2,5 > 2,5 - 5 > 5 - 7 > 7,5 - 10
The first challenge: Provide enough food to live up to increasing demand

14 • A sustainable global food supply A sustainable global food supply • 15
Growth of net agricultural output is slowing down
Average annual growth in net agricultural output to slow
Lower expectations
To adequately assess the food security chal-lenge, the growth potential of the agricultural production needs to be taken into account.
Global agricultural output grew by 2.1% per an-num over the last decade, led by growth in the BRIC countries (Brazil, China, India and the Rus-sian Federation).
However, the OECD expects that globally there will be a slower output growth of agricultural production in the coming decade, both in the de-veloped and the developing countries.
Particular challenge for developing countries
Between 2013 and 2022, the global agricultural production is projected to increase by 1.5% an-nually, compared to 2.1% in the previous decade.
In particular, the developing countries and the BRICs are expected to enter a period of consid-erably lower yield and production growth for most crops. In the BRIC countries for example, the annual growth rate will more than halve. In the developed countries, the average annual growth will be almost stable.
Although the agricultural production and yields will still rise: in the long term, it is very unlikely that this growth will keep up with the population growth.
Source: OECD/FAO (2013), OECD-FAO Agricultural Outlook 2013-2022 Highlights, OECD Publishing. http://www.oecd.org/site/oecd-faoagriculturaloutlook/highlights-2013-EN.pdf
Per cent growth 2003-12 and 2013-22
World Developed countries Least developed countries BRIC Other developing countries
2003-12
2013-22
0%
0,5%
1%
2%
4%
3%
1,5%
2,5%
3,5%
4,5%

16 • A sustainable global food supply A sustainable global food supply • 17
The second challenge: Increase food production with constant inputs
Average growth rate in agricultural productivity since the mid-1990s
A future with fewer resources
The required natural resources for agricultural production, such as land, energy and water, are limited quantity. Growing population does raise concerns about the additional land and other re-sources that will be needed for the additional production. Up to now, increased production has been mostly obtained by the increased use of resources and factors of production – land, capital and variable inputs (such as fertilisers) – as well as by higher productivity of those inputs. In many regions, it is already very difficult to fur-ther exploit the resource base in a sustainable way. The shift towards higher agricultural out-puts based on a sustainable and stable use of natural resources is unavoidable.
Total Factor Productivity Therefore, the total factor productivity (TFP) needs to increase. The TFP measures the ratio of total commodity output (the sum of all crop and livestock products) to total inputs used in production, including all land, labour, capital, and materials.
However, the TFP does not take into account the effects of e.g. loss of biodiversity or greenhouse gas emissions. Policymakers need to take these environmental considerations into account as well. They have to promote the type of food pro-duction which consumes the smallest amount of resources and has the lowest impact on the en-vironment.
Source: K. fuglie, “Productivity Growth and Technology Capital in the Global Agricultural Economy”, in Productivity Growth in Agriculture: An international Perspective, ed. K. Fuglie, S.L. Wang, and V. Eldon Ball (Oxfordshire, England: CAB International, 2012). Note: Growth rates are annual from 1995 to 2007 or 2009, depending on data availability.
Average annual TFP growth
> 3%
1-3%
> 1%

18 • A sustainable global food supply A sustainable global food supply • 19
Restrictions for agricultural land expansion
World vulnerable areas regarding land availability and quality
Strong competition for land use
Land use is the first main production factor which will come under pressure when addi-tional food needs to be produced. There are a range of countries where land availability has reached or is about to reach its limit. The OECD gave an overview of vulnerable areas regarding land availability and quality. Large areas in ma-jor countries such as the USA, Brazil or China figure on this list.
Looking at the global land availability, there are still some land resources available. However, despite the potential to expand agricultural land use, there is strong competition for much of this land. These areas are also used for urban growth, industrial development, environmental reserves and recreational use. Other areas are not readily accessible or are of poorer quality and therefore not adequate for agricultural use.
Risk of land quality depletion
But even if there is suitable land of high quality, there is a high risk for land quality depletion. If the same land is used repeatedly and intensively, its quality will deteriorate. On top of that, the capacity to increase land-use for agriculture is closely linked to availability of water supplies. Some ar-eas cannot be used for agriculture as irrigation is impossible.
Source: OECD/FAO (2012), OECD-FAO Agricultural Outlook 2012-2021, OECD Publishing and FAO. http://dx.doi.org/10.1787/agr_outlook-2012-en
Circles highlight vulnerable areas

20 • A sustainable global food supply A sustainable global food supply • 21
GermanyBelgiumFinland
LithuaniaIrelandAustria
SwitzerlandNorwayFrance
former CSFRIceland
The NetherlandsPoland
HungarySwedenUkraine
UKLuxembourg
BulgariaPortugalBelarus
RomaniaGreece
ItalyDenmark
SpainAlbania
Malta
0% 50% 100%
Water scarcity becomes a global issue
Water use under pressure worldwide
A second production factor that affects our abil-ity to produce more food is water. At present, agriculture accounts for over 70% of water use globally, but both the absolute amount of water available for agriculture and its share are ex-pected to decline. After all, water is also used for industry or household activities, which are also expected to intensify: the OECD predicts that the water used for agriculture will only rep-resent 40% of the total water use by 2050.
Similar to land availability, there are an increas-ing number of countries or regions, reaching critical levels of the availability of fresh water resources. In countries such as the USA, Aus-tralia but also the Southern European countries the situation is already problematic.
Major regional differences in the EU
In Europe, agriculture absorbs smaller but still significant amounts of water, accounting for around 26 % of total water use. However, this share varies remarkably between the different Member States. In some Southern European countries, such as Spain, Italy or Greece it can reach up to 60 % and irrigation of crops accounts for virtually all agricultural water use. In North-ern European countries, such as Germany, Bel-gium or Finland water use is predominantly used for industrial means.
To make sure that enough water is available for the increase in food production, it is essential that water is used in a smart way by all sectors, including agriculture.
Source: OECD/FAO (2012), OECD-FAO Agricultural Outlook 2012-2021, OECD Publishing and FAO. http://dx.doi.org/10.1787/agr_outlook-2012-enSource: European Environment Agency, Water Stress in Europe – can the challenge be met?, 1999, http://www.eea.europa.eu/publications/92-9167-025-1
Industry Households Agriculture
World vulnerable areas with respectto freshwater availability
Water use in Europe
Circles highlight vulnerable areas

22 • A sustainable global food supply A sustainable global food supply • 23
Energy: food sector should rely more on low-carbon energy systems and become energy efficient
Energy in the entire value chain
Alongside land and water, it is also important to take into account the availability of energy for food production. Energy is not only needed for ag-ricultural production but also for transport, pro-cessing, packaging and storage, amongst other uses.
According to the FAO, the food sector currently accounts for around 30% of the world’s total en-ergy consumption. Developed countries use a greater portion of this energy for processing and distributing food. In Developing countries, the highest share goes to retail, preparation and cooking.
Source: Food and Agriculture Organization, 2011, Energy-Smart food for people and climate Issue Paper http://www.fao.org/docrep/014/i2454e/i2454e00.pdf
100%
90%
80%
70%
60%
50%
40%
30%
20%
10%
0%
High-GDPcountries~50EJ/yr
Low-GDPcountries~45 EJ/yr
Globaltotal~95 EJ/yr
Globaltotal~9.7 Gt CO2-eq
Direct and indirect energy inputs Greenhouses gas emissions
Retail, preparation and cooking
Processing and distribution
Fisheries production
Livestock production
Cropping production
Carbon dioxide CO2
Methane CH4
Nitrous oxide N2O
Also, because it is expected that the energy costs will steadily rise over time, it is important that agriculture becomes a ‘smart user’ of en-ergy and adapts to the challenges of a society with fewer resources.
Reduced energy intensity
Becoming ‘energy-smart’ means providing and using sustainable energy for the food sector and generating sustainable energy from the sector. According to the FAO3, it will require a fundamental transformation along the food chain comprising:
• Increasing the efficiency of direct and indirect energy use so that the energy intensity (MJ/kg of food produced) decreases;
• Relying more on low-carbon energy systems and using energy more efficiently;
• Improving access to modern energy services.
Energy inputs vs Greenhouse gas Emissions for food sector
24 • A sustainable global food supply A sustainable global food supply • 25
The third challenge: Minimize CO2 emissions from agriculture to mitigate climate change
Global greenhouse gas emissions by source
Agriculture is a major contributor
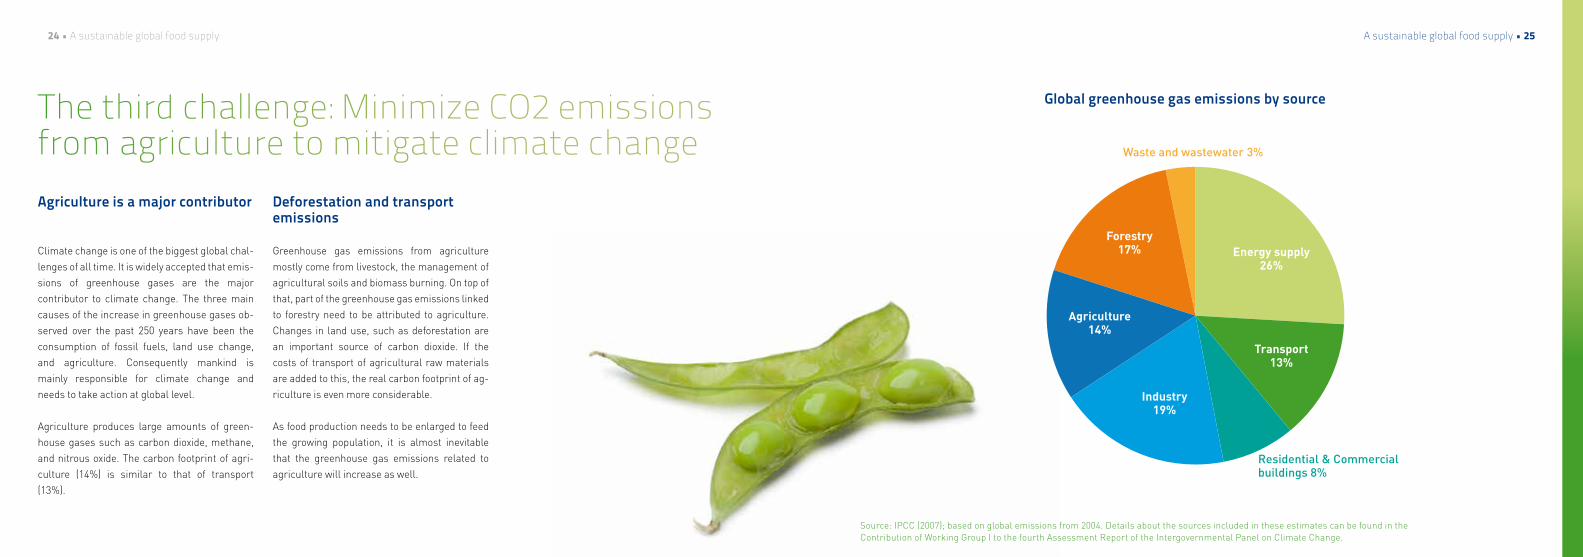
Climate change is one of the biggest global chal-lenges of all time. It is widely accepted that emis-sions of greenhouse gases are the major contributor to climate change. The three main causes of the increase in greenhouse gases ob-served over the past 250 years have been the consumption of fossil fuels, land use change, and agriculture. Consequently mankind is mainly responsible for climate change and needs to take action at global level.
Agriculture produces large amounts of green-house gases such as carbon dioxide, methane, and nitrous oxide. The carbon footprint of agri-culture (14%) is similar to that of transport (13%).
Deforestation and transport emissions Greenhouse gas emissions from agriculture mostly come from livestock, the management of agricultural soils and biomass burning. On top of that, part of the greenhouse gas emissions linked to forestry need to be attributed to agriculture. Changes in land use, such as deforestation are an important source of carbon dioxide. If the costs of transport of agricultural raw materials are added to this, the real carbon footprint of ag-riculture is even more considerable.
As food production needs to be enlarged to feed the growing population, it is almost inevitable that the greenhouse gas emissions related to agriculture will increase as well.
Waste and wastewater 3%
Residential & Commercial buildings 8%
Source: IPCC (2007); based on global emissions from 2004. Details about the sources included in these estimates can be found in the Contribution of Working Group I to the fourth Assessment Report of the Intergovernmental Panel on Climate Change.
Forestry17%
Agriculture14%
Industry19%
Transport13%
Energy supply26%

26 • A sustainable global food supply A sustainable global food supply • 27
The fourth challenge: Encourage a healthy diet to counteract obesityOverweight and obesity
According to the WHO, there are at least 2.8 million people worldwide who die each year as a result of being overweight or obese. Over-weight is defined as a Body Mass Index (BMI, a measure of weight relative to height) of 25 or more and obesity as defined by a BMI of 30 or more. Overweight and obesity lead to adverse meta-bolic effects on blood pressure, cholesterol and triglycerides levels or insulin resistance. More importantly, mortality rates increase consider-ably the more overweight people are, as meas-ured by BMI.
Global increase of overweight populations
The prevalence of overweight and obesity is the highest in America (62% of the population is overweight and 26% is obese) and lowest in South East Asia (14% are overweight and 3% are obese). On the European continent, 55% of the population is overweight and 22% of the popula-tion is obese. The prevalence of obesity in-creased in all regions between 1980 and 2008.
From these figures, it is clear that the daily in-take in certain regions increased more than what was needed for a normal functioning body. Policy makers cannot stand on the side-lines and need to focus on the promotion of a bal-anced and healthy diet for their populations.
Source: WHO – Obesity: situation and Trends
1980 2008 1980 2008 1980 2008 1980 2008 1980 2008 1980 2008 1980 2008
Age-standardized precalence (%) of obesity (BMI >kg/m2) among adults aged 20 years and over by WHO region,
1980 and 2008.
Americas Region
South East Asia Region
European Region
Eastern Mediterranean
Region
Western Pacific Region
African Region
Global
% obese (BMI 30+), ages 20+, age std
% overweight (BMI 25+), ages 20+, age stdMen Women Both sexes
50
40
10
0
20
30
60
50
40
10
0
20
30
60
Men Women Both sexes
African Region
Americas Region
Western Pacific Region
European Region
South East Asia Region
Eastern Mediterranean
Region
African Region
Americas Region
Western Pacific Region
European Region
South East Asia Region
Eastern Mediterranean
Region
0%
5%
10%
15%
20%
25%
30%
% o
f pop
ulat
ion
% o
f pop
ulat
ion
Global and EU soy supply and demand

30 • Global and EU soy – supply and demand Global and EU soy – supply and demand • 31
Soy is the leading oilseed in the world
World soybean production
World major oilseeds production
250000
200000
50000
02006/2007 2007/2008 2008/2009 2009/2010 2010/2011
100000
150000
300000
2011/2012 2012/2013
250000
200000
50000
0
100000
150000
Source: Soya & Oilseed Bluebook 2013, Soyatech
Global production
Compared the other oilseeds such as cotton-seed, peanut, sunflower seed, rapeseed, copra and palm kernel, soybean is the leading oilseed in the world. The global soybean production in 2011/2012 represented 52% of the global oil-seed production.
Major producers of soybean are the United States (82 million tonnes in 2012/13), Brazil (82 million tonnes in 2012/13) and Argentina (50 mil-lion tonnes in 2012/13)4. These 3 countries repre-sent almost 80% of the global soybean production. In particular, production in Brazil has expanded over the last years. Although the European Union is a minor producer of soy-beans, its production has also increased.
Expansion of soy production Although more stable over the last few years, there has been a rapid expansion of soy pro-duction since the late 1990’s, from 155 million tons in the 1998/1999 season to 236 million tons in the 2011/2012 season – a 73% increase in just over 10 years 5/6.
The worldwide soybean production is likely to increase further due to the growth of the global population and to the change in food consump-tion habits of the population. As soy is a major feedstock, the transition to the consumption of more livestock products increases the demand for soy.
Soybean Cottonseed Peanut Sunflowerseed Rapseed Copra Palm kernel
1000
Met
ric
Tons
1000
Met
ric
Tons

32 • Global and EU soy – supply and demand Global and EU soy – supply and demand • 33
Growing EU soy production, but EU remains large importer
Soybean cultivation in the EU
The production of soybeans in the EU has been increasing steadily over the last few years from a low base. Since 2007, the European soybean production has increased with 54%.
There is an increasing support for the produc-tion of soybeans in Europe as it is a nitro-gen-fixing crop, which improves the quality of the soil, in particular in a crop rotating system.
In 2011, total EU production peaked at only 1.3 million tonnes, the main producers being Italy (45%), Romania (12%), Croatia (12%) and France (10%). Together, they account for 80% of the EU cultivation area of soy.
Imports remain indispensable though
However, the production of soybeans in the EU is very limited compared to the total demand. Therefore, large quantities of soy are imported every year in the EU representing 94% of total soy in EU in 2010.
Europe is the second largest importer of soy-beans globally and mainly relies on Brazil rep-resenting 64 % of soybean imports.
Source: Soya & Oilseed Bluebook 2013, Soyatech
Eu Soybean production
20000
15000
10000
5000
02006 2007 2008 2009 2010
Eu Soy Production
Eu Soy Import
1400
1000
800
200
0
400
600
1200
2006/2007 2007/2008 2008/2009 2009/2010 2010/2011 2011/2012
EU soy production vs EU soy import
1000
Met
ric
Tons
1000
Met
ric
Tons

34 • Global and EU soy – supply and demand Global and EU soy – supply and demand • 35
EU production of soy is entirely free of Genetically Modified Organisms (GMOs)Soy production is GM-free in Europe
Genetically modified (GM) soy is widespread around the world: 81% of global soy production is genetically modified7. However, GM soy cannot be cultivated in the EU. As a result, all soybeans produced in the EU, regardless of their end us-age, are GM-free.
ENSA members are committed to providing only GM-free soyfoods and put a lot of efforts in their supply chain to guarantee this. Nevertheless, it remains challenging to source GM-free soy and produce natural soyfood products which are free of GMO.
This is why ENSA members support initiatives aimed at developing the cultivation of GM-free soy in Europe such as the Danube-Soya initiative.
No consumer acceptance for GMOs
According to a Eurobarometer survey, 58% of the EU population is opposed to the use of GMOs. Only 21% is in favour and another 21% is not knowledgeable about the issue or has no opinion.
Therefore, ENSA members have a strong com-mitment and a strict traceability system in place to guarantee that all of their products are GM-free, irrespectively of whether they are soy-beans produced in the EU or abroad.
Source: Eurobarometer 2008: Are you personally in favour or opposed to the use of GMO’s?
Opposed In favour DKI have never heard of GMDs (SPONTANEOUS)
4% 6% 1% 4% 7% 7% 10% 10% 13% 4% 8% 7% 8% 10% 5% 8% 12% 11% 10% 11% 10% 16% 15% 18% 22% 20% 22% 19%
4%6%
4% 6%2%
10%
13%
14%3%8%
7% 6%
11%
5% 12% 11%3%9%
13%
16%
5%
34%23%21%
23%
16%
2% 4%
20% 22%19%
7%30%
10%
12%21%
22%
17% 35%
29%
18%
12%
25%
16%
11%
19%
24%
26%27%
19%
17%
18%
15% 14% 15%
17%82% 81%
77%75%
72%72% 71% 71% 70% 70%68% 67%
66% 65%62% 62%
58%55% 55%
51% 50% 50% 49%
43%41%
31%28% 28%
EU27 BE BGDE DK CZEE IEFR ESEL ITLTLVCY LUHU AT NL MTPLSI RO PTSKFI UKSE
Eurobarometer: Are you personally in favour or opposed to the use of GMO's?

36 • Global and EU soy – supply and demand Global and EU soy – supply and demand • 37
Global soybean application
Source: Soya & Oilseed Bluebook 2013, Soyatech
Soybeans are increasingly processed into animal feed
Food, Feed, Fuel?
Of the 268 million tonnes of soybeans globally produced (2012/2013), only 6% was used di-rectly as food for human consumption.
Food uses of soybeans include traditional soy foods such as soy drinks and tofu as well as more recent innovations such as meat alterna-tives and soy-based variations to yogurts and cream.
More soy for direct human consumption? Currently about 68% of the global soy produc-tion is used in animal feed, mainly for cattle but also for poultry and pigs as well as for fish.
Around 16% is used for soybean oil, of which 95% is primarily used as edible oil for human consumption. 8% is used for other industrial ap-plications such as adhesives, coatings and printing inks, lubricants, plastics or specialty products. Soybean production is also being stimulated by the increased use of biodiesel in the context of the search for alternative sources of energy.
The most efficient use of the soy protein is for direct human consumption. The proportion of soybeans used in food should therefore increase in the future.
Protein meal (animal feed)
Soybean oil
“Waste” crush
Food
Other industrial application
68%
16%
2%
6%
8%

38 • Global and EU soy – supply and demand Global and EU soy – supply and demand • 39
The soyfood sector has grown but remains a niche market compared to the reference dairy marketGrowing sector
Between 2008 and 2012, the turnover of the EU soyfood industry represented by ENSA in-creased by 18%. The sector today has a com-bined turnover of about 550 million euros.
This sustained growth relies on: • A greater awareness among European con-
sumers of the environmental and health benefits of soy and plant-based products as part of a daily diet;
• Continuous innovations to diversify the offer of soy products and other plant-based prod-ucts in Europe;
• High-quality standards in the production of EU soyfoods guaranteeing safe, nutritious and tasty products.
Still small compared to dairy
Despite its strong growth, the soyfood market re-mains very small compared to the dairy market, with a market share of about 2% of the total dairy market in volume.
Source: European Natural Soyfoods Manufacturers Association
0
100
200
400
600
300
500
Annual aggregate turnover of ENSA members
2008 2012
Turn
over
(Mio
eur
o)
+18%

40 • Global and EU soy – supply and demand Global and EU soy – supply and demand • 41
A diversifying offer of plant-based products
Soy and plant-based market (non dairy) 2012
Other plant-based products
The market for soy and other plant-based prod-ucts manufactured in Europe increased by 22% over the past 5 years.
In recent years new plant-based products have been introduced on the market such as, almond milk, rice drinks, oat drinks, coconut drinks, and hazelnut drinks.
The share of soydrinks remains the highest at 58%, with other plant-based drinks growing to 10%.
A wide range of products
There are soy-based alternatives to virtually any animal protein product.
The following soy products can be found in most of the European supermarkets or in spe-cialised health shops: soy drinks (natural or flavoured), soy-based variations to yogurt, soy desserts, soy-based margarine, soy-based cu-linary cream, tofu and soy meat replacers in the shape of burgers, minced or sausage.
Source: AC Nielsen
Soy drink
Other plant-based drink
Plant-based alternatives to yogurts
Desserts
Plant-based alternatives to cream
58%
10%
21%
8%
3%

What role for soy- and plant-based diets to feed the increasing population?

44 • Role for soy- and plant-based diets Role for soy- and plant-based diets • 45
Soy products are more resource-efficient than animal based productsRethink the consumption of protein
The sustainable production and consumption of products of animal origin, i.e. the main source of proteins, is the biggest sustainability challenge for the agriculture and food sector, with the live-stock sector accounting for e.g. 18% of the global GHG emissions8.
Protein crops are currently fed to animals, that are then indirectly fed to people as dairy or meat.However, it would be more efficient to use these crops directly for human consumption: a recent study9 indicates that if food was grown exclu-sively for direct human consumption, taking into account the current mix of crop uses, an addi-tional 4 billion people in the world could be fed.
To achieve a more sustainable consumption of protein, it would require:
• Cutting out one third of consumption com-pletely in the Western world: this is the amount generally over-eaten;
• Replacing one third of animal protein with plant-based protein;
• Replace the remaining third of animal protein with protein from free range animals10.
Resource-efficient, plant-based food
Plant-based products are consumed in the same way and at the same consumption mo-ments as dairy and meat products. In particu-lar, soy is a source of high quality protein containing all essential amino-acids, making soyfoods fully-fledged alternatives to dairy and meat products.
When comparing the environmental impact of animal and soy products in terms of land, water and CO2 emissions, soy products consistently outperform animal products.
Comparison of CO2-eq emissions, land and water use between soy drink and cow milk
Comparison of CO2-eq emissions, landand water use between soy meat variations and beef
Soy
Milk x5
Milk x 2.5
Soy
Soy
Milk x 3
Soy
Soy
Beef x 10
Beef x 20
Beef x 45
Soy
CO2-eq emissions
Water use
Land use
CO2-eq emissions
Water use
Land use
Source: Ecofys, University of Twente (2009, 2012)
46 • Role for soy- and plant-based diets Role for soy- and plant-based diets • 47
161
120
9687
3735
209
Source: FAO/WHO/Unicef Protein Advisory Group (2004)
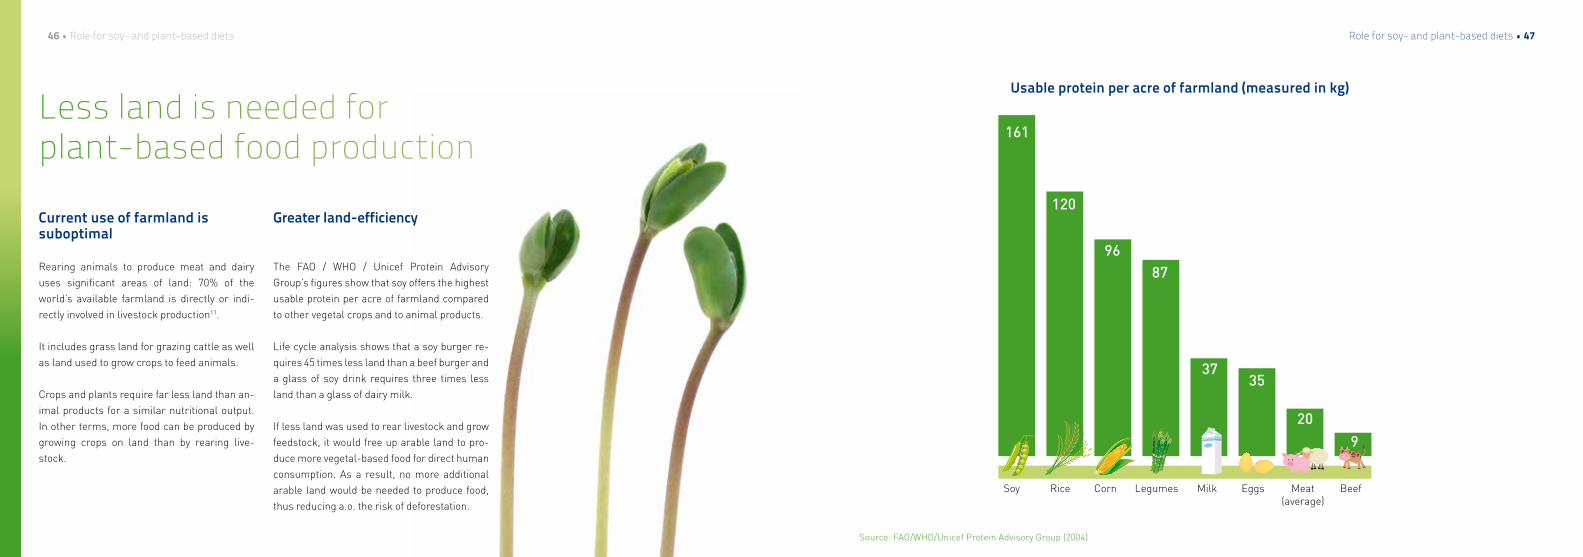
Current use of farmland is suboptimal
Rearing animals to produce meat and dairy uses significant areas of land: 70% of the world’s available farmland is directly or indi-rectly involved in livestock production11.
It includes grass land for grazing cattle as well as land used to grow crops to feed animals.
Crops and plants require far less land than an-imal products for a similar nutritional output. In other terms, more food can be produced by growing crops on land than by rearing live-stock.
Greater land-efficiency
The FAO / WHO / Unicef Protein Advisory Group’s figures show that soy offers the highest usable protein per acre of farmland compared to other vegetal crops and to animal products.
Life cycle analysis shows that a soy burger re-quires 45 times less land than a beef burger and a glass of soy drink requires three times less land than a glass of dairy milk.
If less land was used to rear livestock and grow feedstock, it would free up arable land to pro-duce more vegetal-based food for direct human consumption. As a result, no more additional arable land would be needed to produce food, thus reducing a.o. the risk of deforestation.
Less land is needed for plant-based food production
Usable protein per acre of farmland (measured in kg)
Soy Rice Corn Legumes Milk Eggs Meat(average)
Beef

48 • Role for soy- and plant-based diets Role for soy- and plant-based diets • 49
Water in the food chain
Water input is essential at all stages of the food production: to grow crops, to let livestock drink, to incorporate in drinks’ recipes, to wash raw food, to clean equipment, to cook…
However, a significant amount of water is used at the agricultural production stage, especially in the livestock sector according to figures from STOA. If the actual amount of water that is drunk directly by livestock is very small (1.3% of total water use in agriculture)12, this volume in-creases dramatically (reaching up to 43 000 li-tres per kg of beef) when the water used to produce the feed stock is taken into account.
Water and plant-based food When the crops are used directly for human consumption instead of being fed to animals, the conversion factor water input/food output naturally increases. A plant-based diet re-quires on average 2.9 times less water than an animal-based diet13. Life cycle analysis shows that a soy burger re-quires 20 times less water than a beef burger and a glass of soy drink requires two and a half times less water than a glass of dairy milk.
As water becomes scarce, a more efficient use of water in the food production system is an im-perative, which requires rethinking the con-sumption of water-intensive foodstuffs.
Water inputs are lower for plant-based foods
Agricultural Water Requirement in liter/kg
Livestock/Crop Litre/kg
Cattle beef 12,560 - 43,000
Sheep 4,500 - 6,100
Pig 4,460 - 5,906
Eggs 2,700 - 4,657
Poultry 2,390 - 4,500
Soy bean 1,800 - 3,200
Rice 1,800 - 3,600
Wheat 900 - 2000
Dairy cattle 560 - 1000
Maize 450 - 900
Vegetables 190 - 1,160
Apples 500 - 700
Oranges 500
Potato 105 -500
Source: European Parliament Science and Technology Options Assessment

50 • Role for soy- and plant-based diets Role for soy- and plant-based diets • 51
The impact of plant-based foods on Green House Gas (GHG) emissions is lowerLower energy input
Soy is a very efficient crop to produce in terms of energy when compared to animal sources of pro-tein. The reason is that a lot of energy, in particu-lar linked to the use of fertilisers is required to produce the crops used to feed animals. By using these crops for direct human consumption, more food can be produced with the same energy input.
According to the University of Chicago, produc-ing soyfood is 20 times more energy-efficient than producing dairy and 65 times more than beef.
Fewer GHG emissions
The GHG emissions from different sources of pro-tein vary greatly, with beef production being the biggest contributor (6.25 – 370kg of CO2-eq/kg) ac-cording to STOA. Other types of meat such
as poultry (1.1-4.6kg of CO2-eq/kg) have a smaller impact on the climate, with a smaller footprint in terms of GHG emissions. GHG emis-sions from animal by-products such as milk (0.41 – 1.38kg of CO2-eq/kg) are lower than meat but still higher than plant-based products.
A litre of soy drink emits on average five times less carbon dioxide (CO2) equivalents than a litre of cow’s milk. A soy burger generates 10 times less carbon dioxide (CO2) equivalents per kilo-gram than a beef burger.
Energy efficiency in production (measured in kcal)
Source: FAO/WHO/Unicef Protein Advisory Group European Parlament Science and Technology Options Assessment
Ranges of GHGe from various food products(kg carbon dioxide equivalents* per kg Product)
415.0 20,618,1
11,2 6,43,7
Soy
MilkChicken
EggsBeef
Porc
6,25 -
37,0
7,6 -
17
3,6 -
5,4 1,1 -
4,6
1,70,41
- 1,36 0,934 0,8 0,5 0,45 0,4 0,32 0,25 0,24
0,17-
0,24
Cattlebeef
Sheep Pigs Poultry Oilseed rape
Cattle (dairy)
Soybean meal
Bread Onions/ Cabbages
Bananas Rice Wheat Oranges Apples Potato
* Carbon Diocide equivalents is a measure used to compare the emissions from various greenhouse gases based upon their global warming potential.
Maximum range
Minimum range
52 • Role for soy- and plant-based diets Role for soy- and plant-based diets • 53
Plant-based foods are part of a healthy, balanced diet.
Dietary guidelines…
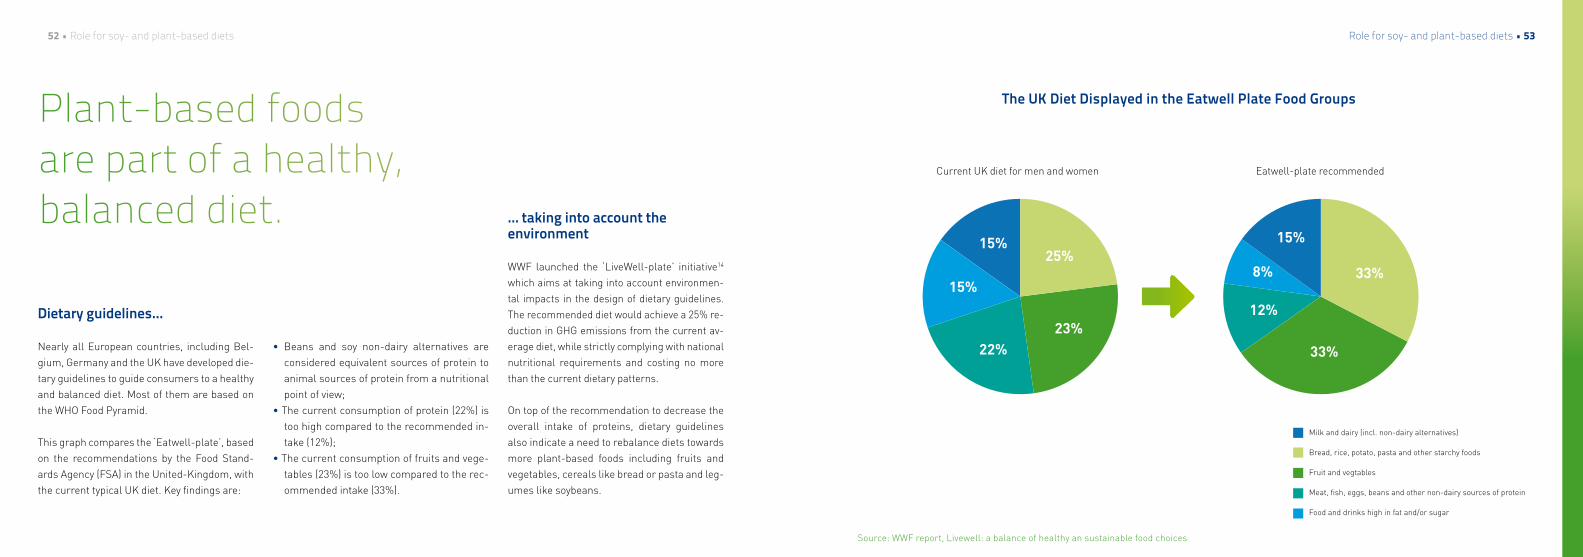
Nearly all European countries, including Bel-gium, Germany and the UK have developed die-tary guidelines to guide consumers to a healthy and balanced diet. Most of them are based on the WHO Food Pyramid.
This graph compares the ‘Eatwell-plate’, based on the recommendations by the Food Stand-ards Agency (FSA) in the United-Kingdom, with the current typical UK diet. Key findings are:
• Beans and soy non-dairy alternatives are considered equivalent sources of protein to animal sources of protein from a nutritional point of view;
• The current consumption of protein (22%) is too high compared to the recommended in-take (12%);
• The current consumption of fruits and vege-tables (23%) is too low compared to the rec-ommended intake (33%).
… taking into account the environment WWF launched the ‘LiveWell-plate’ initiative14 which aims at taking into account environmen-tal impacts in the design of dietary guidelines. The recommended diet would achieve a 25% re-duction in GHG emissions from the current av-erage diet, while strictly complying with national nutritional requirements and costing no more than the current dietary patterns.
On top of the recommendation to decrease the overall intake of proteins, dietary guidelines also indicate a need to rebalance diets towards more plant-based foods including fruits and vegetables, cereals like bread or pasta and leg-umes like soybeans.
Source: WWF report, Livewell: a balance of healthy an sustainable food choices
Milk and dairy (incl. non-dairy alternatives)
Bread, rice, potato, pasta and other starchy foods
Fruit and vegtables
Meat, fish, eggs, beans and other non-dairy sources of protein
Food and drinks high in fat and/or sugar
The UK Diet Displayed in the Eatwell Plate Food Groups
15%
8%
12%
33%
33%
15%
15%
22%23%
25%
Eatwell-plate recommendedCurrent UK diet for men and women

54 • Role for soy- and plant-based diets Role for soy- and plant-based diets • 55
SOY FLOAR
Soy is a high quality protein source of vegetal originThe right protein intake
In Western countries, there is an over-consump-tion of animal protein compared to what the body needs. European citizens (EU-27) eat an average of 73kg of meat per year or 200g per day15. This is largely above the dietary needs for proteins as nutritionists agree that a human being only needs 90g of meat per day16.
By contrast, a low protein intake remains a cause of malnutrition in many areas of the world. Soy-beans contain about 40% of protein. The typi-cal protein content of a soy drink is more than 3%, which is similar to the typical protein content of cow's milk.
The protein content of soy meat-variations can be as high as 20,5g of protein per 100g, which is similar to beef (between 18 and 22g per 100g)17.
The best vegetal source of protein
Soyfoods are fully-fledged alternatives to ani-mal protein sources because they offer a “com-plete” protein profile: the soy protein contains all the essential amino-acids that must be pro-vided to the human body.
Whereas other plant-based foods can also bring protein to the diet, only soy fully compares with foodstuffs of animal origin from a nutri-tional point of view.
Source: Nubel and http://www.scienceofhealthindex.com/v.html
Protein content per 100g
Beef Veal Lamb Sheep ChickenPork Milk
Soy flour
Soy drink
Soy Meatreplacers
AlmondsAlmondsdrink
Hazelnutdrink
Hazelnut Lentils Chickpeas RiceRicedrink
3,3
18,0-
22,819,5
-22,0
15,0-
20,8
19,5-
20,4
19,1-
22,4
19,2-
22,8
41,7
21,3
0,5
14,0
0,3
8,8 8,4
2,60,1
3,0-
3,7
7,5-
20,5
Maximum range Minimum range
SOY
56 • Role for soy- and plant-based diets Role for soy- and plant-based diets • 57
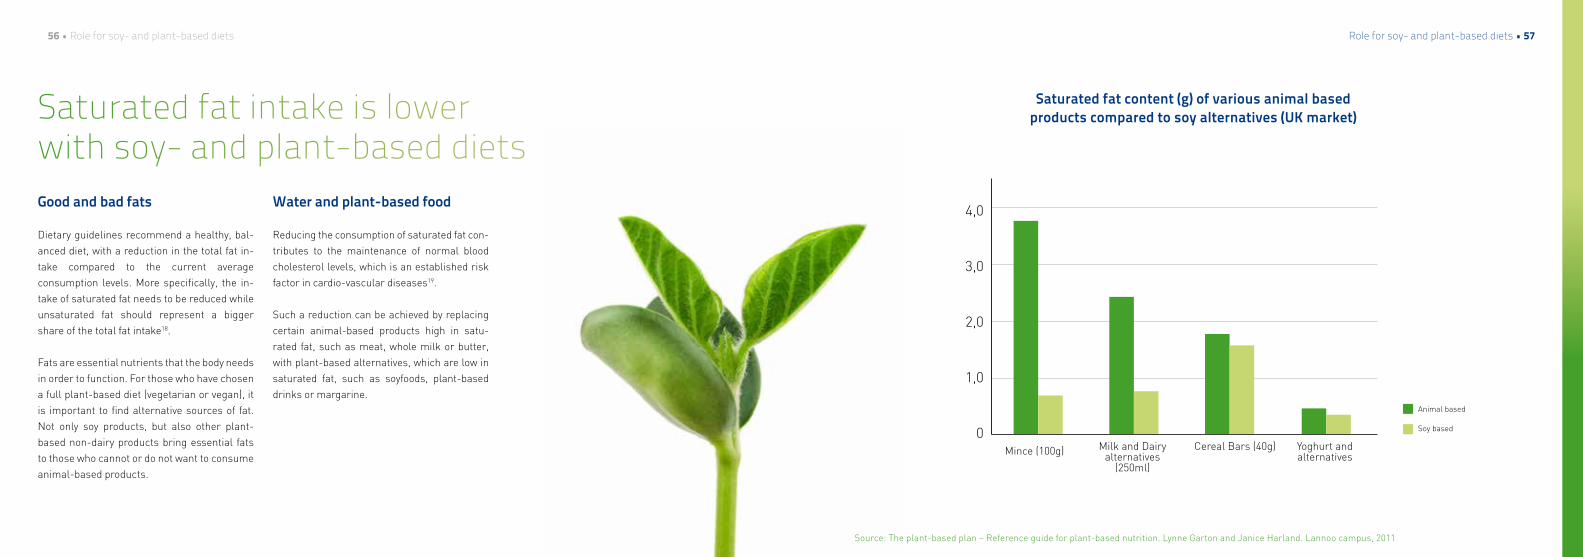
Saturated fat intake is lower with soy- and plant-based dietsGood and bad fats
Dietary guidelines recommend a healthy, bal-anced diet, with a reduction in the total fat in-take compared to the current average consumption levels. More specifically, the in-take of saturated fat needs to be reduced while unsaturated fat should represent a bigger share of the total fat intake18.
Fats are essential nutrients that the body needs in order to function. For those who have chosen a full plant-based diet (vegetarian or vegan), it is important to find alternative sources of fat. Not only soy products, but also other plant-based non-dairy products bring essential fats to those who cannot or do not want to consume animal-based products.
Water and plant-based food Reducing the consumption of saturated fat con-tributes to the maintenance of normal blood cholesterol levels, which is an established risk factor in cardio-vascular diseases19.
Such a reduction can be achieved by replacing certain animal-based products high in satu-rated fat, such as meat, whole milk or butter, with plant-based alternatives, which are low in saturated fat, such as soyfoods, plant-based drinks or margarine.
Source: The plant-based plan – Reference guide for plant-based nutrition. Lynne Garton and Janice Harland. Lannoo campus, 2011
Animal based
Soy based
Saturated fat content (g) of various animal based products compared to soy alternatives (UK market)
4,0
3,0
2,0
1,0
0Mince (100g) Milk and Dairy
alternatives (250ml)
Cereal Bars (40g) Yoghurt andalternatives

Soyfood and EU policy
60 • Soyfood and EU Policy Soyfood and EU Policy • 61
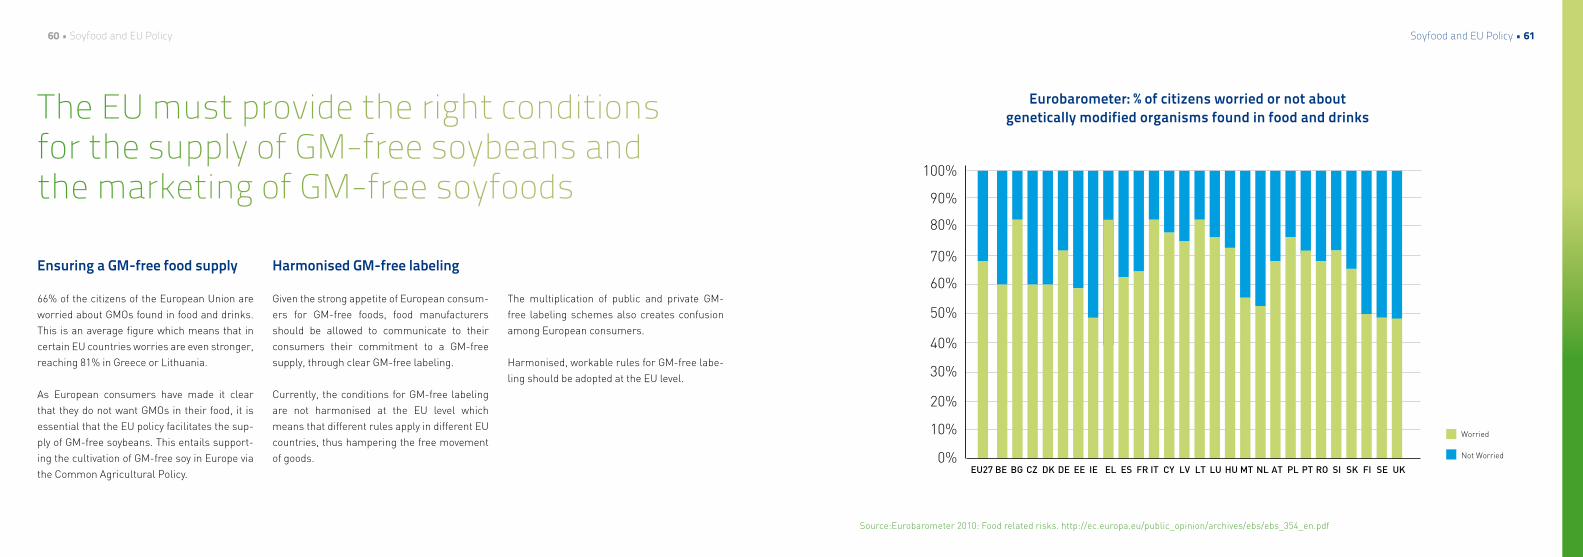
The EU must provide the right conditions for the supply of GM-free soybeans and the marketing of GM-free soyfoods
Ensuring a GM-free food supply
66% of the citizens of the European Union are worried about GMOs found in food and drinks. This is an average figure which means that in certain EU countries worries are even stronger, reaching 81% in Greece or Lithuania.
As European consumers have made it clear that they do not want GMOs in their food, it is essential that the EU policy facilitates the sup-ply of GM-free soybeans. This entails support-ing the cultivation of GM-free soy in Europe via the Common Agricultural Policy.
Harmonised GM-free labeling
Given the strong appetite of European consum-ers for GM-free foods, food manufacturers should be allowed to communicate to their consumers their commitment to a GM-free supply, through clear GM-free labeling.
Currently, the conditions for GM-free labeling are not harmonised at the EU level which means that different rules apply in different EU countries, thus hampering the free movement of goods.
The multiplication of public and private GM-free labeling schemes also creates confusion among European consumers.
Harmonised, workable rules for GM-free labe-ling should be adopted at the EU level.
Eurobarometer: % of citizens worried or not about genetically modified organisms found in food and drinks
Source:Eurobarometer 2010: Food related risks. http://ec.europa.eu/public_opinion/archives/ebs/ebs_354_en.pdf
70%
50%
40%
10%
0%EU27
20%
30%
60%
80%
90%
100%
BE BG DEDKCZ EE IE FRESEL IT LTLV LU HU ATNLMT PL SIROPT SK FI UKSE
Worried
Not Worried
CY

62 • Soyfood and EU Policy Soyfood and EU Policy • 63
Soy and plant-based diets should be promoted by public authorities at the EU and national levels
Food pyramid / Environmental pyramid
Source: Barilla Center for Food & Nutrition: the Double Food-Environmental Pyramid
Good for health, good for the planet
Plant-based diets are not only better for the planet, but also for health. This is illustrated by the Double Food – Environmental Pyramid model of the Barilla Center for Food & Nutrition.
The “Double Food-Environmental Pyramid” shows that the foods which should be con-sumed the most from a dietary point of view (e.g. fruits and vegetables at the base of the pyramid), are also those that have the lowest environmental impact. On the other hand, foods that should be consumed in small quan-tities, like meat or cheese, are those with a higher environmental impact.
Consumer behaviours It is a challenge to convince consumers to change their eating habits and adopt a more sustainable diet. This cannot be done overnight and requires a mix of policy actions to promote sustainable food and plant-based diets.
Although certain initiatives, like the WWF ‘Livewell plate’, are already supported by the European Commission, the European Union should more strongly support the promotion of sustainable di-ets, by delivering clear guidelines to European consumers on what constitutes a sustainable diet. Local initiatives such as the VeggieThursday in the Belgian city of Ghent or meat-free Monday in the UK should be replicated.
Greater coherence is also needed in all EU poli-cies in order to enhance the effectiveness of EU action around the promotion of sustainable diets.

64 • Soyfood and EU Policy Soyfood and EU Policy • 65
Level-playing field
Because soy products are alternatives to ani-mal-based products in terms of usage and are used at the same consumption moments, it is first of all a matter of fair competition that they are treated equally in terms of taxation.
Currently, there is a clear discrimination in terms of VAT in several EU member states in favour of dairy products.
Milk and dairy products are subject to the so-called “super reduced rate” of VAT in countries like Austria, Germany, Italy, Portugal, Spain and Sweden. At the same time, soy foods and drinks do not benefit from the same exemption and are taxed at much higher rates.
In addition, soy and plant-based drinks are, in certain Member States, covered by excise duties
on soft drinks whereas milk and dairy drinks are rightly exempted from these national taxes be-cause of their nutritional benefits. Soy and plant-based drinks should benefit from a simi-lar exemption as they are not soft-drinks and also have nutritional benefits.
VAT rates per country – December 2012
Country VAT rate cow milk
VAT rate soy drink
Austria 10% 20%
Belgium 6% 6%
Finland 14% 14%
France 5.5% 5.5%
Germany 7% 19%
Italy 4%* 21%
Netherlands 6% 6%
Portugal 6% 23%
Spain 4% 10%
Sweden 6% 12%
UK 0% 0%
Taxation should provide a level-playing-field
* 10% for UGT milk

66 • Soyfood and EU Policy Soyfood and EU Policy • 67
With a clear labeling policy, the health and sustainability benefits of plant-based foods could be endorsedMilk denomination
In the European Union, the term ‘milk’ is a pro-tected denomination reserved for animal mammary secretions. As a result, it is not pos-sible for soyfood manufacturers to call their product ‘soymilk’, despite the fact that it is commonly used by consumers, the media and the scientific community.
Nutrient criteria
The EU labeling policy should allow consumers to easily compare products which are alterna-tives to each other from a nutritional point of view, but also from a usage point of view. Soy products should consistently be provided with the same conditions as similar animal products.
In particular in nutrient profiling schemes (be it for the use of health claims or advertising regu-lation), soy products should be in the same food categories as similar animal products.
Lactose-free labelingIt is essential to accurately inform consumers about the specificities of soyfoods, in particular the fact that they are naturally free from lactose. Given the prevalence of lactose-intolerance among Europeans, it is important that they easily find products which are suitable for their needs. ENSA calls for the harmonisation at the EU level of the conditions for lactose-free labeling, which would allow products which are naturally free from lactose, like soyfoods, to be labeled as such.
Worldwide prevalence of lactose intolerance in recent populations
Source: Food Intolerance Network. http://www.food-intolerance-network.com/food-intolerance/lactose-intolerance/basic-information.html
0-15%
15-30%
30-60%
60-80%
80-100%

Looking forward: 10 wishes for the next 10 years

70 • Conclusion Conclusion • 71
Looking forward: 10 wishes for the next 10 years
8. Reinforce the coherence and consistency of the different EU policies, to ensure that the need to promote more sustainable food production and consumption is taken into account in all EU policy areas.
9. Continue supporting scientific research in the area of food to provide EU consumers with safe, nutritious and resource-efficient food.
10. Convey ENSA’s messages, knowledge and expertise beyond its existing circle of stakeholders.
Sustainable food production
1. Further develop the production of high-quality GM-free soybeans in Europe. 2. Ensure that worldwide production of soy is sustainable by supporting a GM-free pro-
duction outside of the EU and by continuing to oppose deforestation. 3. Achieve a rebalancing in the use of soybeans towards a higher relative share for hu-
man consumption, which is the most resource-efficient use of soy. 4. Acknowledge that the issue of food security will require a mix of solutions: increasing
agricultural productivity, making the livestock sector more sustainable and reducing the intake of animal protein are equally important.
Sustainable food consumption
5. Make European consumers more aware of the environmental impact of their food consumption and rethink their current eating habits, without patronising them but by providing easy solutions.
6. Rebalance diets towards more plant-based food to reduce the environmental foot-print of food consumption while improving human health.
7. Ensure that soy products are considered as fully-fledged alternatives to animal products and are subject to the same marketing conditions.
Sustainable food policy-making

72 • About ensa About ensa • 73
About EnsaEstablished in January 2003, ENSA represents the
interests of Natural Soyfood Manufacturers.
The term "natural" refers to the traditional produc-
tion process used by ENSA members to produce
non-dairy plant based foods such as soy drinks,
desserts, variation to cream, variations to yoghurt,
meat alternatives and more, using whole soybeans
without any genetically modified material.
The founding principles of ENSA combine the belief
in natural soy products and the use of sound sci-
ence. ENSA seeks to raise awareness among EU
citizens and promote the consumption of natural
soy and plant-based products, which is an integral
part of a healthy, balanced lifestyle.
ENSA is an association of internationally operating
companies, ranging from large corporations to
small, family-owned businesses.
List of abreviationsBRIC Brazil, Russia, India, China
BMI Body Mass Index
ENSA European Natural Soyfoods Manufacturers Association
EU European Union
FAO Food and Agriculture Organisation (United Nations)
GHG Green House Gas
GMO Genetically Mondified Organism
IPCC Intergovernmental Panel on Climate Change
OECD Organisation for Economic Co-operation and Development
STOA Science and Technology Options Assessment
TFP Total Factor Productivity
VAT Value-Added Tax
WWF World Wide Fund for Nature
WHO World Health Organisation

74 • References
References 1 World agriculture towards 2030/2050: the 2012 revision, FAO, Nikos Alexandratos and Jelle Bruinsma, ESA Working Paper No. 12-03,
June 2012 http://www.fao.org/docrep/016/ap106e/ap106e.pdf2 OECD in conjunction with the FAO recently published the Agricultural Outlook 2012-20213 Energy-smart food for people and climate, FAO issue paper, 2011 http://www.fao.org/docrep/014/i2454e/i2454e00.pdf4 USDA. World Agricultural Production 2013 http://usda01.library.cornell.edu/usda/current/worldag-production/worldag-production-07-11-2013.pdf5 Oilworld.de6 Soya and Oilseed Bluebook 2013 Soyatech7 James, Clive. 2012. Global status of commercialized biotech/GM crops: 2012. ISAAA Brief N 448 FAO, Livestock’s Long Shadow (2006)9 Emily S Cassidy et al (2013). Redefining agricultural yields: from tonnes to people nourished per hectare. Environ. Res. Lett. 8 http://iopscience.iop.org/1748-9326/8/3/034015/10 SAC Position paper sustainable diet11 FAO, Livestock’s long shadow, 200612 Marlow, H.J. et al., Diet and the environment : does what you eat matter ? American Journal of Clinical Nutrition, 2009. 89(5): p 1699S-1703S.13 Marlow, H.J. et al., Diet and the environment : does what you eat matter ? American Journal of Clinical Nutrition, 2009. 89(5): p 1699S-1703S.14 http://livewellforlife.eu/15 Eurostat PocketBook “Food: from farm to fork statistics” 2008, European Commission16 McMichaels A. & Bambrick H., Meat consumption trends and health: casting a wider risk assessment net. Public Health Nutrition Journal (2005) 8, 4, pp 348-35617 Nubel database Belgium18 EFSA Scientific Opinion on Dietary Reference Values for fat, 2010 (http://www.efsa.europa.eu/fr/efsajournal/pub/1461.htm) 19 http://www.efsa.europa.eu/en/efsajournal/doc/2062.pdf
