· pdf filegregg m. dixon senior vice president of marketing and sales kevin j. bligh chief...
TRANSCRIPT

Corporate Offi ce
EnerNOC, Inc.101 Federal Street, Suite 1100Boston, Massachusetts 02110Phone: 617.224.9900Fax: 617.224.9910
Transfer Agent
American Stock Transfer and Trust Company59 Maiden LanePlaza LevelNew York, New York 10038Phone: 800.937.5449
Legal Counsel
Mintz, Levin, Cohn, Ferris, Glovsky and Popeo, P.C.One Financial CenterBoston, Massachusetts 02111Phone: 617.542.6000
Common Stock Information
Our common stock is listed on The Nasdaq Global Market under the symbol “ENOC”.
Independent Registered Public
Accounting Firm
Ernst & Young200 Clarendon StreetBoston, Massachusetts 02116
Board Members
Timothy G. HealyChairman of the Board andChief Executive Offi cer
David B. BrewsterPresident and Director
Richard DieterDirector, Audit Committee Chair
T.J. GlauthierDirector, Compensation Committee Chair
Arthur Coviello Lead Independent Director,Mergers and Acquisitions Committee Chair
Susan F. TierneyDirector, Nominating and Governance Committee Chair
Executive Team
Timothy G. HealyChairman of the Board andChief Executive Offi cer
David B. BrewsterPresident and Director
David M. SamuelsExecutive Vice President
Gregg M. DixonSenior Vice President of Marketing and Sales
Kevin J. BlighChief Accounting Offi cer
EnerNOC, Inc. Headquarters101 Federal Street Suite 1100Boston, MA 02110Offi ce: 617.224.9900Fax: 617.224.9910
www.enernoc.com
EnerNOC, Inc. is headquartered in Boston, MA, United States, with wholly-owned subsidiaries in Canada (EnerNOC Ltd.), the United Kingdom (EnerNOC UK Limited), New Zealand (EnerNOC New Zealand Limited), and Australia (EnerNOC Pty Ltd, ABN 49 104 710 278). EnerNOC UK Limited is a company incorporated in England and Wales with company number 06937931, VAT number GB980145422 and whose registered offi ce is located at Alder Castle, 4th Floor, 10 Noble Street, London EC2V 7JX. A list of directors is available for inspection at our offi ces.
©2012 EnerNOC, Inc. All rights reserved. No text can be reprinted without permission.
Annual Report 2011
41057.indd 1-341057.indd 1-3 4/4/12 2:08 AM4/4/12 2:08 AM

Corporate Offi ce
EnerNOC, Inc.101 Federal Street, Suite 1100Boston, Massachusetts 02110Phone: 617.224.9900Fax: 617.224.9910
Transfer Agent
American Stock Transfer and Trust Company59 Maiden LanePlaza LevelNew York, New York 10038Phone: 800.937.5449
Legal Counsel
Mintz, Levin, Cohn, Ferris, Glovsky and Popeo, P.C.One Financial CenterBoston, Massachusetts 02111Phone: 617.542.6000
Common Stock Information
Our common stock is listed on The Nasdaq Global Market under the symbol “ENOC”.
Independent Registered Public
Accounting Firm
Ernst & Young200 Clarendon StreetBoston, Massachusetts 02116
Board Members
Timothy G. HealyChairman of the Board andChief Executive Offi cer
David B. BrewsterPresident and Director
Richard DieterDirector, Audit Committee Chair
T.J. GlauthierDirector, Compensation Committee Chair
Arthur Coviello Lead Independent Director,Mergers and Acquisitions Committee Chair
Susan F. TierneyDirector, Nominating and Governance Committee Chair
Executive Team
Timothy G. HealyChairman of the Board andChief Executive Offi cer
David B. BrewsterPresident and Director
David M. SamuelsExecutive Vice President
Gregg M. DixonSenior Vice President of Marketing and Sales
Kevin J. BlighChief Accounting Offi cer
4/4/12 2:08 AM4/4/12 2:08 AM

Dear Shareholders,
In 2011, EnerNOC marked ten years of energy innovation by celebrating our fi rst decade as a company. We have many reasons to be proud of our accomplishments. EnerNOC has grown from a small player operating in a single U.S. energy market in 2001 to the global leader in the multi-billion dollar demand response industry today. At the same time, EnerNOC has captured a rapidly growing stake in the even larger energy effi ciency market, attracting a customer base that includes some of the most innovative and forward-thinking businesses and organizations on the planet.
While 2011 gave us reason to celebrate, we remained relentlessly focused on refi ning and improving our business. Over the past year, we expanded our stake in existing markets and entered promising new ones. We signed more utility contracts than in any prior year and continued to invest in our technology platform. 2011 brought about record levels of demand response participation in the world’s largest energy markets and delivered an historic decision from the Federal Energy Regulatory Commission in Order 745, which fi nally puts demand on equal footing with supply in our nation’s wholesale energy markets. The electricity industry is changing rapidly, and as a disruptive force in the marketplace, we believe that EnerNOC is poised to thrive.
Within our core business of demand response, we added more than 1,800 megawatts to our portfolio in 2011, more than in any prior year. This rapid growth emphasizes demand response’s speed to market, one of the qualities that makes this resource so attractive. Our demand response portfolio was dispatched by grid operators and utilities more than 360 times in 2011, nearly a dispatch for every day of the year. Even as we experienced this record level of activity, we were again able to deliver greater than 100 percent average performance. This track record of success has been a major driver of our leadership in the industry.
We also achieved substantial growth in our energy effi ciency and other energy management businesses in 2011. In total, our non-demand response revenues increased 77 percent year-over-year, to over $27 million. We secured several large multi-site contracts with premier customers in important market sectors, including government, education, and commercial property. We have more revenue still to be recognized on existing opportunities, as well as a signifi cant amount of new business in the pipeline. As a result, we continue to consider our non-demand response business, in particular energy effi ciency, a signifi cant growth engine for our business. We believe that we are well positioned to continue to expand our energy effi ciency customer base and profi ts steadily in the years ahead.
Chairman’s Letter
A History of Rapid Growth
Q1 Q2 Q3
2006
Q4 Q1 Q2 Q3
2007
Q4 Q1 Q2 Q3
2008
Q4 Q1 Q2 Q3
2009
Q4 Q1 Q2 Q3
2010
Q4 Q1 Q2 Q3
2011
Q4
As of December 31, 2011:
7,100 Megawatts under management
4,900 Commercial, industrial, and institutional (C&I) customers
11,400 C&I sites under management
Megawatts under management
Sites under management
410
1,113
2,057
3,566
5,300
7,100
8,600
6,500
4,000
2,195
823
11,400
41057.indd 4-641057.indd 4-6 4/4/12 2:08 AM4/4/12 2:08 AM

In 2011, we continued to grow EnerNOC–both geographically and by expanding our breadth of services–in part through a number of strategic acquisitions. In July, we acquired Energy Response, unlocking market opportunities in New Zealand and Australia, the latter of which is poised to become one of our largest markets by 2013. Through our acquisition of M2M Communications, we expanded our technology offerings and our presence in the agricultural demand response market, which has thousands of megawatts of potential in the U.S. and even more globally. We also fully integrated Global Energy Partners, signifi cantly increasing our range of offerings both to utilities and commercial, institutional, and industrial customers interested in cutting-edge demand response and energy effi ciency solutions.
These strategic acquisitions have complemented our continued leadership in demand response and energy effi ciency technology, which now supports sub-second response, plus and minus demand management, and innovative data collection capabilities. We launched our presence in Alberta where we are building a 150 megawatt program that delivers sub-second demand response to the system. We announced an innovative automated demand response (AutoDR) project with the Bonneville Power Administration in which we ramp demand up as well as down to help better integrate wind energy resources. We also crossed the 100 megawatt daily peak threshold for our frequency response portfolio in New Zealand. In short, we are managing and developing hundreds of megawatts of automated demand response in full-scale initiatives across the globe. In 2012, our engineers’ focus will be equally divided between expanding our leadership in demand response and continued energy effi ciency innovation, including automated fault detection and management.
Of course, 2011 also saw its share of challenges, particularly in PJM, where we took a leadership position in a year-long policy debate over the optimal way to measure demand
response performance in PJM’s capacity market. With that debate now behind us, we have adapted quickly to readjust our portfolio to accommodate the new rules and are working with affected customers to bring them our full suite of energy management offerings. We take the challenges of the past year as a sign that demand response has arrived as a mainstream resource, and we will continue to lead its developing role in the marketplace.
Other industries have experienced similar changes, and innovative, cost-effective solutions usually carry the day. Disruptive technologies are all around us, affecting how we communicate, travel, and entertain. From mobile phone service, to electronic booking, to on-demand media, we have moved time and again from limited, low-tech offerings to solutions that create more choice, better service, and lower costs. Demand response is in this disruptive category, and we have every reason to be confi dent in the continued expansion of this important technology.
Looking to the future, we see strong opportunities for long-term growth, overshadowed somewhat by our short-term outlook. We expect that known declines in capacity prices and other factors may slow our growth in 2012; however, it is important to note that in 2013 and 2014, those very same pricing headwinds turn into strong tailwinds when PJM pricing rebounds. This forward visibility remains a great strength of our business model, and we believe that our ongoing investments in 2011 have positioned us to take full advantage of those tailwinds in the future.
Overall, we are encouraged by what we achieved in 2011, but we are never satisfi ed. We remain fi rmly focused on delivering sustained growth and profi tability in all facets of our well-positioned energy management business, as we work to drive continued success into EnerNOC’s second decade and beyond.
Tim HealyChairman and CEOEnerNOC Inc.
EnerNOC has captured a rapidly growing
stake in the even larger energy effi ciency
market, attracting a customer base that
includes some of the most innovative
and forward-thinking businesses and
organizations on the planet.
41057.indd 4-641057.indd 4-6 4/4/12 2:08 AM4/4/12 2:08 AM

UNITED STATES SECURITIES AND EXCHANGE COMMISSIONWashington, D.C. 20549
FORM 10-K(Mark One)
È ANNUAL REPORT PURSUANT TO SECTION 13 OR 15(d)OF THE SECURITIES EXCHANGE ACT OF 1934For the fiscal year ended December 31, 2011
or
‘ TRANSITION REPORT PURSUANT TO SECTION 13 OR 15(d)OF THE SECURITIES EXCHANGE ACT OF 1934For the transition period from to
Commission file number 001-33471
EnerNOC, Inc.(Exact Name of Registrant as Specified in its Charter)
Delaware 87-0698303(State or Other Jurisdiction of
Incorporation or Organization)(IRS Employer
Identification No.)
101 Federal StreetSuite 1100
Boston, Massachusetts
02110(Zip Code)
(Address of Principal Executive Offices)
Registrant’s telephone number, including area code:(617) 224-9900
Securities registered pursuant to Section 12(b) of the Act:Title of Each Class Name of Each Exchange on Which Registered
Common Stock, $0.001 par value The NASDAQ Stock Market LLC(The NASDAQ Global Market)
Securities registered pursuant to Section 12(g) of the Act:None
Indicate by check mark if the Registrant is a well-known seasoned issuer, as defined in Rule 405 of the SecuritiesAct. Yes ‘ No È
Indicate by check mark if the Registrant is not required to file reports pursuant to Section 13 or Section 15(d) of theAct. Yes ‘ No È
Indicate by check mark whether the Registrant (1) has filed all reports required to be filed by Section 13 or 15(d) of the SecuritiesExchange Act of 1934 during the preceding 12 months (or for such shorter period that the Registrant was required to file such reports), and(2) has been subject to such filing requirements for the past 90 days. Yes È No ‘
Indicate by check mark whether the registrant has submitted electronically and posted on its corporate Web site, if any, every InteractiveData File required to be submitted and posted pursuant to Rule 405 of Regulation S-T (§ 232.405 of this chapter) during the preceding12 months (or for such shorter period that the registrant was required to submit and post such files). Yes È No ‘
Indicate by check mark if disclosure of delinquent filers pursuant to Item 405 of Regulation S-K (section 229.405 of this chapter) is notcontained herein, and will not be contained, to the best of Registrant’s knowledge, in definitive proxy or information statements incorporatedby reference in Part III of this Form 10-K or any amendment to this Form 10-K. È
Indicate by check mark whether the Registrant is a large accelerated filer, an accelerated filer, a non-accelerated filer or a smallerreporting company. See definitions of “large accelerated filer,” “accelerated filer” and “smaller reporting company” in Rule 12b-2 of theExchange Act. (Check one).Large accelerated filer ‘ Accelerated filer È Non-accelerated filer ‘ Smaller reporting company ‘
(Do not check if a smaller reporting company)
Indicate by check mark whether the Registrant is a shell company (as defined in Rule 12b-2 of the Exchange Act). Yes ‘ No È
The aggregate market value of the Registrant’s common stock held by non-affiliates of the Registrant as of June 30, 2011, the lastbusiness day of the Registrant’s second quarter of the fiscal year ended December 31, 2011, was approximately $319.4 million based uponthe last sale price reported for such date on The NASDAQ Global Market.
The number of shares of the Registrant’s common stock (the Registrant’s only outstanding class of stock) outstanding as of March 9,2012 was 28,134,697.
DOCUMENTS INCORPORATED BY REFERENCEPortions of the Registrant’s definitive proxy statement for its 2012 Annual Meeting of Stockholders, to be filed with the Securities and
Exchange Commission pursuant to Regulation 14A not later than 120 days after the end of the Registrant’s fiscal year ended December 31,2011, relating to certain information required in Part III of this Annual Report on Form 10-K are incorporated by reference into this AnnualReport on Form 10-K.


EnerNOC, Inc.
ANNUAL REPORT ON FORM 10-KFOR THE FISCAL YEAR ENDED DECEMBER 31, 2011
Table of ContentsPage
PART IItem 1. Business . . . . . . . . . . . . . . . . . . . . . . . . . . . . . . . . . . . . . . . . . . . . . . . . . . . . . . . . . . . . . . . . . . . 1
Item 1A. Risk Factors . . . . . . . . . . . . . . . . . . . . . . . . . . . . . . . . . . . . . . . . . . . . . . . . . . . . . . . . . . . . . . . . 14
Item 1B. Unresolved Staff Comments . . . . . . . . . . . . . . . . . . . . . . . . . . . . . . . . . . . . . . . . . . . . . . . . . . . . 35
Item 2. Properties . . . . . . . . . . . . . . . . . . . . . . . . . . . . . . . . . . . . . . . . . . . . . . . . . . . . . . . . . . . . . . . . . . 35
Item 3. Legal Proceedings . . . . . . . . . . . . . . . . . . . . . . . . . . . . . . . . . . . . . . . . . . . . . . . . . . . . . . . . . . . . 35
Item 4. Mine Safety Disclosures . . . . . . . . . . . . . . . . . . . . . . . . . . . . . . . . . . . . . . . . . . . . . . . . . . . . . . . 35
PART IIItem 5. Market for Registrant’s Common Equity, Related Stockholder Matters and Issuer Purchases
of Equity Securities . . . . . . . . . . . . . . . . . . . . . . . . . . . . . . . . . . . . . . . . . . . . . . . . . . . . . . . . . . 36
Item 6. Selected Financial Data . . . . . . . . . . . . . . . . . . . . . . . . . . . . . . . . . . . . . . . . . . . . . . . . . . . . . . . 37
Item 7. Management’s Discussion and Analysis of Financial Condition and Results of Operations . . 38
Item 7A. Quantitative and Qualitative Disclosures About Market Risk . . . . . . . . . . . . . . . . . . . . . . . . . . 75
Item 8. Financial Statements and Supplementary Data . . . . . . . . . . . . . . . . . . . . . . . . . . . . . . . . . . . . . 77
Item 9. Changes in and Disagreements With Accountants on Accounting and FinancialDisclosure . . . . . . . . . . . . . . . . . . . . . . . . . . . . . . . . . . . . . . . . . . . . . . . . . . . . . . . . . . . . . . . . . . 77
Item 9A. Controls and Procedures . . . . . . . . . . . . . . . . . . . . . . . . . . . . . . . . . . . . . . . . . . . . . . . . . . . . . . . 77
Item 9B. Other Information . . . . . . . . . . . . . . . . . . . . . . . . . . . . . . . . . . . . . . . . . . . . . . . . . . . . . . . . . . . . 80
PART IIIItem 10. Directors, Executive Officers and Corporate Governance . . . . . . . . . . . . . . . . . . . . . . . . . . . . . 80
Item 11. Executive Compensation . . . . . . . . . . . . . . . . . . . . . . . . . . . . . . . . . . . . . . . . . . . . . . . . . . . . . . 80
Item 12. Security Ownership of Certain Beneficial Owners and Management and Related StockholderMatters . . . . . . . . . . . . . . . . . . . . . . . . . . . . . . . . . . . . . . . . . . . . . . . . . . . . . . . . . . . . . . . . . . . . 81
Item 13. Certain Relationships and Related Transactions, and Director Independence . . . . . . . . . . . . . . 81
Item 14. Principal Accounting Fees and Services . . . . . . . . . . . . . . . . . . . . . . . . . . . . . . . . . . . . . . . . . . 81
PART IVItem 15. Exhibits, Financial Statement Schedules . . . . . . . . . . . . . . . . . . . . . . . . . . . . . . . . . . . . . . . . . . 81
Signatures . . . . . . . . . . . . . . . . . . . . . . . . . . . . . . . . . . . . . . . . . . . . . . . . . . . . . . . . . . . . . . . . . . . . . . . . . . . . . 82
Appendix A Consolidated Financial Statements . . . . . . . . . . . . . . . . . . . . . . . . . . . . . . . . . . . . . . . . . . . . . . . F-1
Report of Ernst & Young LLP, Independent Registered Public Accounting Firm . . . . . . . . . . F-2
Exhibit Index


This Annual Report on Form 10-K includes forward-looking statements within the meaning of Section 21Eof the Securities Exchange Act of 1934, as amended, and Section 27A of the Securities Act of 1933, as amended.For this purpose, any statements contained herein regarding our strategy, future operations, financial condition,future revenues, profits and profit margins, projected costs, market position, prospects, plans and objectives ofmanagement, other than statements of historical facts, are forward-looking statements. The words “anticipates,”“believes,” “estimates,” “expects,” “intends,” “may,” “plans,” “projects,” “will,” “would” and similarexpressions are intended to identify forward-looking statements, although not all forward-looking statementscontain these identifying words. We cannot guarantee that we actually will achieve the plans, intentions orexpectations expressed or implied in our forward-looking statements. Matters subject to forward-lookingstatements involve known and unknown risks and uncertainties, including economic, regulatory, competitive andother factors, which may cause actual results, levels of activity, performance or the timing of events to bematerially different than those exposed or implied by forward-looking statements. Important factors that couldcause or contribute to such differences include the factors set forth under the caption “Risk Factors” in Item 1Aof Part I of this Annual Report on Form 10-K. Although we may elect to update forward-looking statements inthe future, we specifically disclaim any obligation to do so, even if our estimates change, and readers should notrely on those forward-looking statements as representing our views as of any date subsequent to March 15, 2012.
Our trademarks include: EnerNOC, EnerNOC (expanded goods), ENERBLOG, Get More from Energy,Energy for Education, Capacity on Demand, PowerTrak, PowerTalk, Celerity Energy, DemandSMART,EnergySMART, SiteSMART, SupplySMART, One-Click Curtailment, Clean Green California, CarbonTrak andThe Greenest Kilowatt-Hour is the One Never Used.
Other trademarks or service marks appearing in this Annual Report on Form 10-K are the property of theirrespective holders.

PART I
Item 1. Business
We use the terms “EnerNOC,” the “Company,” “we,” “us” and “our” in this Annual Report onForm 10-K to refer to the business of EnerNOC, Inc. and its subsidiaries.
Company Overview
We are a leading provider of energy management applications, services and products for the smart grid,which include comprehensive demand response, data-driven energy efficiency, energy price and riskmanagement and enterprise carbon management applications, services and products. Our energy managementapplications, services and products enable cost effective energy management strategies for commercial,institutional and industrial end-users of energy, which we refer to as our C&I customers, and our electric powergrid operator and utility customers by reducing real-time demand for electricity, increasing energy efficiency,improving energy supply transparency, and mitigating carbon emissions.
We believe that we are the largest demand response service provider to C&I customers. As of December 31,2011, we managed over 7,100 megawatts, or MW, of demand response capacity across a C&I customer base ofapproximately 4,900 accounts and 11,400 sites throughout multiple electric power grids. Demand response is analternative to traditional power generation and transmission infrastructure projects that enables electric powergrid operators and utilities to reduce the likelihood of service disruptions, such as brownouts and blackouts,during periods of peak electricity demand, and otherwise manage the electric power grid during short-termimbalances of supply and demand or during periods when energy prices are high. We use our NetworkOperations Center, or NOC, and comprehensive demand response application, DemandSMART, to remotelymanage and reduce electricity consumption across a growing network of C&I customer sites, making demandresponse capacity available to electric power grid operators and utilities on demand while helping C&I customersachieve energy savings, improved financial results and environmental benefits. To date, we have receivedsubstantially all of our revenues from electric power grid operators and utilities, who make recurring payments tous for managing demand response capacity that we share with our C&I customers in exchange for those C&Icustomers reducing their power consumption when called upon.
We build on our position as a leading demand response services provider by using our NOC and energymanagement application platform to deliver a portfolio of additional energy management applications, servicesand products to new and existing C&I, electric power grid operator and utility customers. These additionalenergy management applications, services and products include our EfficiencySMART, SupplySMART, andCarbonSMART applications and services, and certain wireless energy management products. EfficiencySMARTis our data-driven energy efficiency suite that includes commissioning and retro-commissioning authorityservices, energy consulting and engineering services, a persistent commissioning application and an enterpriseenergy management application for managing energy across a portfolio of sites. SupplySMART is our energyprice and risk management application that provides our C&I customers located in restructured or deregulatedmarkets throughout the United States with the ability to more effectively manage the energy supplier selectionprocess, including energy supply product procurement and implementation, budget forecasting, and utility billmanagement. CarbonSMART is our enterprise carbon management application that supports and manages themeasurement, tracking, analysis, reporting and management of greenhouse gas emissions. Our wireless energymanagement products are designed to ensure that our C&I customers can connect their equipment remotely andaccess meter data securely, and include both cellular modems and an agricultural specific wireless technologysolution acquired as part of our acquisition of M2M Communications Corporation, or M2M, in January 2011.
Since inception, our business has grown substantially. We began by providing demand response services inone state in 2003 and have expanded to providing our portfolio of energy management applications, services andproducts in several regions throughout the United States, as well as internationally in Australia, Canada, NewZealand and the United Kingdom.
1

Significant Recent Developments
In February 2011, PJM Interconnection, or PJM, a grid operator customer, and Monitoring Analytics, LLC,the PJM market monitor, issued a joint statement concerning settlements in PJM’s capacity market, from whichwe derive a substantial portion of our revenues, for participants using a certain baseline methodology for themeasurement and verification of demand response. We refer to this as the PJM statement. The PJM statement,among other things, asserted that certain market practices in the PJM capacity market were no longer appropriateor acceptable and unilaterally implied that compensation should no longer be determined by actual measuredreductions in a C&I customer’s electrical load, unless the reductions are below that C&I customer’s peak demandfor electricity, or PLC, in the prior year. In March 2011, we filed for and were granted expedited declaratoryrelief with the Federal Energy Regulatory Commission, or FERC, which allowed us to continue to manage ourportfolio of demand response capacity in PJM as we had in the past and receive settlement in accordance with thethen current PJM market rules approved by FERC. However, PJM continued to take steps to modify the marketrules according to the PJM statement, including by filing proposed tariff changes with FERC.
In November 2011, FERC issued an order that addressed the PJM statement and clarified the rules related tothe measurement and verification of demand response resources in the PJM capacity market. We refer to this asthe FERC order. The FERC order, among other things, preserved PJM’s original market rules for the fullcompliance period of the 2011-12 delivery year, while accepting PJM’s proposed market rule changes goingforward, subject to certain conditions, including the requirement that PJM submit a compliance filing with FERCby January 3, 2012 that included the development of an interim mechanism to protect demand responsesuppliers’ reasonable reliance expectations regarding capacity compliance measurement and verification for the2012-13 delivery year through the 2014-15 delivery year and explained how PJM will treat the aggregation ofdemand response resources under its proposal. In addition, the FERC order encouraged further examination ofthe limitations of PLC and consideration of the development of a more dynamic baseline methodology applicableto demand response resources in the future.
In January 2012, PJM responded to the FERC order by making the compliance filing referred to above,which proposed the immediate implementation of PJM’s proposed market rules accepted in the FERC order. Werefer to this as the PJM proposal. We subsequently filed a protest requesting that FERC reject the PJM proposalas unjust and unreasonable for failure to meet the conditions set forth in the FERC order to establish an interimsettlement mechanism that protects the reasonable reliance expectations of demand response suppliers throughthe 2014-15 delivery year. We also requested that FERC order PJM to keep current settlement practices in placefor the 2012-13 delivery year and require PJM to propose an alternative mechanism that complies with FERC’sdirectives through the 2014-2015 delivery year. Subsequent to our protest filing, additional filings were made bycertain parties interested in the outcome of this matter. In February 2012, FERC issued an order substantiallyaccepting the PJM proposal, which resulted in the immediate implementation of PJM’s proposed market rulechanges regarding capacity compliance measurement and verification. As a result, our future PJM revenues andprofit margins will be significantly reduced and our future results of operations and financial condition will benegatively impacted. These impacts may be offset by our future growth in MWs in the PJM market.
In April 2011, we and one of our subsidiaries entered into a $75.0 million senior secured revolving creditfacility pursuant to a credit agreement with a certain financial institution and Silicon Valley Bank, or SVB, whichwas subsequently amended in June 2011, November 2011 and December 2011. We refer to this agreement as the2011 credit facility. In March 2012, we and one of our subsidiaries amended and restated the 2011 credit facility,which we refer to as the amended and restated 2011 credit facility, under which SVB became the sole lender, ourborrowing limit was decreased from $75.0 million to $50.0 million and certain of our financial covenantcompliance requirements were modified.
Strategy
Our strategy is to capitalize on our established track record, substantial operating experience and scalableand proprietary energy management platform, as well as our leading market position in the United States, tocontinue providing energy management applications, services and products to our C&I customers and electric
2

power grid operators and utilities. Our goal is to become the leading outsourced energy management serviceprovider for C&I, electric power grid and utility customers worldwide. Key elements of our strategy include:
Strengthen Demand Response Presence by Growing in Existing and New Regions in the UnitedStates. We will continue to actively pursue opportunities to provide demand response services to electric powergrid operators and utilities in markets in the United States through additional long-term contracts and openmarket program opportunities for demand response resources. To provide these demand response resources, weintend to enter into contracts with new C&I customers. We believe that our comprehensive demand responseapplication and services, the recurring payments that we provide to C&I customers and our national presence willenable us to continue to pursue rapid growth of our C&I customer base and strengthen our presence as a leader inproviding demand response services.
Expand Sales of our Portfolio of Additional Energy Management Applications, Services andProducts. We intend to continue to leverage our leadership role in the demand response market to deliver aportfolio of additional energy management applications, services and products to new and existing C&Icustomers, including our EfficiencySMART, SupplySMART and CarbonSMART applications and services, andcertain wireless energy management products. We will continue to develop our technology, including ourproprietary energy management application platform, which enables us to measure, manage, benchmark andoptimize C&I customers’ energy consumption and facility operations, and connect to electric power grid operatorand utility control rooms. We believe that our C&I customers will become increasingly aware of their energycosts and consumption and will look to advanced analytics and trusted third-party providers to help them bettermanage their overall energy expenditures. Therefore, we will continue to leverage the detailed energyinformation that we collect at our C&I customer sites to provide our EfficiencySMART application and servicesto help our C&I customers drive down operating costs associated with energy spend and help our electric powergrid operator and utility customers meet their energy efficiency targets. We will also continue to aggressivelypromote our SupplySMART application and services to our C&I customers to enable them to mitigate riskthrough competitive energy supply contracts and achieve energy cost savings. In addition, as a result of voluntaryor mandatory greenhouse gas reporting requirements, we anticipate that C&I customers will become increasinglyaware of their greenhouse gas emissions and will look to third-party providers to help them better calculate,track, report and manage their carbon emissions and associated costs and risks. We therefore will continue tooffer emissions tracking and trading support services to our C&I customers through our CarbonSMARTapplication.
In connection with our acquisition of M2M in January 2011, we expanded our technology platform toinclude certain agricultural specific wireless energy management products. We believe that these wireless energymanagement products will provide a significant opportunity to grow our C&I customer base in the agriculturalmarket for demand response.
Target Expansion by Entering International Markets. We also intend to expand our addressable marketby pursuing demand response and energy management opportunities in international markets. We are a leader inthe development, implementation and broader adoption of energy management applications, services andproducts for the smart grid and have built a national footprint in the United States. We believe we can achieve asimilar significant first-mover advantage internationally, principally in Australia, Canada, New Zealand and theUnited Kingdom. We believe that our scalable technology platform and proprietary operational processes arereadily adaptable to the international markets that we are targeting. We also believe that entering newinternational markets, including Europe and Asia, will provide a significant opportunity to grow our C&Icustomer base and provide a differentiated offering to C&I customers with international operations.
Actively Pursue Targeted Strategic Acquisitions. We intend to actively pursue selective acquisitions toreinforce our leadership position in the expanding energy management applications, services and products sector.This sector consists of a number of companies with technology offerings or customer relationships that presentattractive acquisition opportunities. We intend to look for opportunities to acquire technologies that wouldsupport and enhance our current energy management application platform. Customer relationship acquisitionswill focus on expansion into new geographic regions both in the United States and internationally. We have astrong track record of successfully integrating acquired companies to increase our customer base, entering new
3
geographic regions, improving our offerings and enhancing our technology. For example, in January 2011, weacquired Global Energy Partners, Inc., or Global Energy, a company specializing in the design andimplementation of utility energy efficiency and demand response programs, and M2M, a company specializing inwireless technology solutions for energy management and demand response.
Energy Management Applications, Services and Products
DemandSMART
Demand response is achieved when C&I customers reduce their consumption of electricity from the electricpower grid in response to a market signal, such as capacity constraints, price signals or transmission-levelimbalances. C&I customers can reduce their consumption of electricity by reducing demand (for example, bydimming lights, resetting air conditioning set-points or shutting down production lines) or they can self-generateelectricity with onsite generation (for example, by means of a back-up generator or onsite cogeneration). Ourdemand response capacity provides a more timely, cost-effective and environmentally-sound alternative tobuilding conventional supply-side resources, such as natural gas-fired peaking power plants, to meet periods ofpeak electricity demand.
We are a leader in the development, implementation and broader adoption of technology-enabled demandresponse services for the smart grid. Our DemandSMART application enables us to send control signals to, andreceive bi-directional communications from, an Internet-enabled network of broadly dispersed C&I customersites in order to initiate, monitor and complete demand response activity. Our robust and scalable technology andproprietary operational processes have the ability to automate demand response and simplify C&I customerparticipation by remotely reducing electricity usage in a matter of minutes, or send curtailment instructions to ourC&I customers to be manually implemented on site. The devices that we install at our C&I customer sitestransmit to us via the cellular network and Internet near real-time electrical consumption data on a 1-minute,5-minute, 15-minute or hourly basis. Our DemandSMART application analyzes the data from individual sitesand aggregates data for specific regions. When a demand response event occurs, our NOC automaticallyprocesses the notification coming from the electric power grid operator or utility. Our NOC operators then beginactivating procedures to curtail demand from the grid at our C&I customer sites. Our one-click curtailmentactivation sends signals to all C&I customer sites in the targeted geography where the event is occurring. Uponactivation of demand reduction, DemandSMART, which receives near real-time data from each C&I customersite, is able to determine on a near real-time basis whether the location is performing as expected. Signals arerelayed to our NOC operators when further steps are needed to achieve demand reductions at any given location.Each C&I customer site is monitored for the duration of the demand response event and operations are restoredto normal when the event ends.
DemandSMART is designed for the C&I customer market, which represents approximately 60% of theUnited States electricity consumption. We provide demand response capacity to electric power grid operators andutilities by contracting with C&I customers to reduce their electricity usage on demand. We receive most of ourrevenues from electric power grid operators and utilities, and we make payments to our C&I customers for bothcontracting to reduce electricity usage and actually doing so when called upon.
We provide our demand response services to electric power grid operators and utilities under long-termcontracts and pursuant to open market bidding programs. Our long-term contracts generally have terms of threeto ten years and predetermined capacity commitment and payment levels. Our open market bidding programopportunities are generally characterized by flexible capacity commitments and prices that vary by hour, day,month, or bidding period. Within these contracts and open market programs, we offer the following services toaddress the needs of electric power grid operators and utilities: (i) reliability-based demand response, (ii) price-based demand response, and (iii) short-term reserve resources referred to in the electric power industry asancillary services.
Reliability-Based Demand Response. We receive recurring capacity payments, which we share with ourC&I customers, from electric power grid operators and utilities for being on call, which means having availablepreviously registered demand response capacity that we have aggregated from our C&I customers, regardless of
4

whether we receive a signal to reduce consumption. When we receive a signal from an electric power gridoperator or utility customer, which we refer to as a dispatch signal, our DemandSMART applicationautomatically notifies our C&I customers that a demand reduction is needed and initiates processes that reduceelectrical consumption by our C&I customers in the targeted area. When we are called to implement a demandreduction, we typically receive an additional payment, which we share with our C&I customers, for the energythat we reduce. We refer to this as an energy payment. We are called upon to perform by electric power gridoperators and utilities during periods of high demand or supply shortfalls, otherwise known as capacitydeficiency events. By aggregating a large number of C&I customers to participate in these reliability-basedprograms, we believe that we have played a significant role over the past several years in helping to preventbrownouts and blackouts in some of the most capacity constrained regions in the United States. We currentlyprovide reliability-based demand response services to ISO New England, Inc., or ISO-NE, PJM, the New YorkIndependent System Operator, or New York ISO, and Ontario Power Authority, or OPA, among others.
Price-Based Demand Response. Our price-based demand response services enable C&I customers tomonitor and respond to wholesale electricity market price signals when it is cost-effective for them to do so. OurC&I customers use our DemandSMART application to register a “strike price” above which it may be economicalfor that customer to reduce its consumption of electricity. We receive an energy payment in the amount of thewholesale market price for the electricity that the C&I customer does not consume and share this payment with theC&I customer. If prices in a given market approach a given strike price, DemandSMART automatically notifies theC&I customer and initiates processes that reduce electrical consumption from the electric power grid. We currentlyparticipate in price-based demand response programs in the Mid-Atlantic and New England.
Ancillary Services. Demand response is utilized for short-term reserve requirements, referred to in theelectric power industry as ancillary services, including operating reserves. This service is called upon by electricpower grid operators and utilities during short-term contingency events such as the loss of a transmission line orlarge power plant. Through our technology, certain C&I customers are able to provide near instantaneous responsefor these short-term system dispatches, and often do so with negligible impact on their business operations. Electricpower grid operators and utilities rely on a reserve pool of these quick-start resources to provide short-term supportas needed during these contingency events. The goal of electric power grid operators and utilities is to get theseresources back into standby mode as quickly as possible after they are dispatched so that the reserve pool ofavailable capacity is replenished. An example of an ancillary services market in which we participate is PJM’sSynchronized Reserves Market, in which we were the first provider of demand response capacity.
With respect to our demand response services, we match obligation, in the form of MW that we agree todeliver to our electric power grid operator and utility customers, with supply, in the form of MW that we are ableto curtail from the electric power grid. We increase, and occasionally decrease, our obligation through openmarket programs, supplemental demand response programs, auctions or other similar capacity arrangements,open program registrations and bilateral contracts to account for changes in supply and demand forecasts in orderto achieve more favorable pricing opportunities. We increase our ability to curtail demand from the electricpower grid by deploying a sales team to contract with our C&I customers and by installing our equipment atthese customers’ sites to connect them to our network. When we are called upon by our electric power gridoperator or utility customers to deliver MW, we use our DemandSMART application to dispatch this network tomeet the demands of these customers. We refer to the above activities as managing our portfolio of demandresponse capacity.
EfficiencySMART
EfficiencySMART is our data-driven energy efficiency suite of applications and services that includescommissioning and retro-commissioning authority services, energy consulting and engineering services, apersistent commissioning application and an enterprise energy management application for managing energyacross a portfolio of C&I customer sites. We currently offer the following EfficiencySMART applications andservices:
• EfficiencySMART Commissioning includes traditional and/or new building commissioning services,such as investigation, testing and verification of energy efficiency strategies, and persistent
5
commissioning, which includes real-time persistent data collection and analysis to identify operationalinefficiencies.
• EfficiencySMART Insight provides our large, multi-site C&I customers with the ability to visualize nearreal-time energy usage, identify savings opportunities, and prioritize energy-related investments across aportfolio of meters and buildings across their organizations. EfficiencySMART Insight provides C&Icustomers with the ability to remotely host and monitor large portfolios of meters, compute and comparebaseline and benchmark data, identify the best and worst performing sites across a variety of energy usageand operational metrics, configure the rate engine for shadow billing analysis, set alerts on energy-relateddata streams and monitor demand levels.
• EfficiencySMART Services include a range of professional and consulting services, such as strategicenterprise planning, energy audits, engineering/design services, utility incentive reviews and savingsverification services.
We have an expanding portfolio of EfficiencySMART applications and services. We provide ourEfficiencySMART applications and services both directly to the C&I customer market and to utility customersunder long-term contracts as a mechanism for the utilities to meet either mandated or voluntary energy efficiencytargets in their service territory. Our EfficiencySMART applications and services are aimed at helping addressincreasingly complex energy challenges. We believe that the market opportunities for our EfficiencySMARTapplications and services are significant and will remain so as operational efficiency and energy savings aregiven increased priority by electric power grid operators, utilities and C&I customers.
SupplySMART
SupplySMART is our energy price and risk management application that provides our C&I customerslocated in restructured or deregulated markets throughout the United States with the ability to more effectivelymanage the energy supplier selection process, including energy supply product procurement and implementation.SupplySMART provides a framework for developing and implementing risk management strategies andexecuting purchasing strategies that provide maximum price transparency and structural savings on an ongoingbasis for our C&I customers. Using a competitive bid process, SupplySMART delivers recommendations onenergy price structures, terms and conditions from available competitive suppliers of energy commodities,including electricity, natural gas and refined products. SupplySMART includes a set of online features includingcentralizing, tracking, and presenting utility bill and enterprise-wide utility financial information, such as budgetsand forecasts, while assessing bill accuracy and savings opportunities. SupplySMART also includes an onlineprocurement tool that bids commodity purchases amongst competitive suppliers.
CarbonSMART
CarbonSMART is our enterprise carbon management application that supports and manages themeasurement, tracking, analysis, reporting and management of greenhouse gas emissions and mitigationstrategies. C&I customers use CarbonSMART to benchmark their carbon footprint, comply with voluntary ormandatory carbon reporting requirements, including standard reporting scopes, and drive carbon savingsactivities. CarbonSMART utilizes a highly flexible and scalable data model, which allows our C&I customers toinput a variety of fuel and emissions sources and automatically translate the resulting data into formats thatmatch the requirements of various mandatory or voluntary carbon accounting and carbon reporting programs. Inaddition, CarbonSMART provides templates for common energy efficiency measures, such as lighting upgrades,allowing C&I customers to model potential energy savings projects and examine cost effectiveness and margincarbon cost.
Other Products
We provide wireless products for energy management and demand response that are designed to ensure thatour C&I customers can connect their equipment remotely and access meter data securely. These products includecellular modems and an agricultural specific wireless technology solution acquired as part of to our acquisition ofM2M in January 2011.
6

Technology and Operations
Since inception, we have focused on delivering industry-leading, technology-enabled energy managementapplications, services and products. Our proprietary technology has been developed to be highly reliable andscalable and to provide a platform on which to design, customize, and implement our energy managementapplications, services and products. Our proprietary technology infrastructure is built on Linux, Java and Oracleand supports an open web services architecture. Our enterprise energy management application platform enablesus to efficiently scale our DemandSMART, EfficiencySMART, SupplySMART and CarbonSMART applicationsand services, and certain wireless energy management products in new geographic regions and rapidly grow thenumber of C&I customers in our network. Our energy management application platform leverages web servicesand wireless technologies that connect applications directly with other applications through a form of “loosecoupling,” which allows connections to be established across applications without customization. As a result,these connections can be established across firewalls without regard to technology platform or programminglanguage, making it easy to apply our technology across a broad range of C&I customers.
Our technology can be broken down into three primary components: the NOC, our energy managementapplication platform and the EnerNOC Site Server.
Network Operations Center
Our technology enables our NOC to automatically respond to signals sent by electric power grid operatorsand utilities to deliver demand reductions within targeted geographic regions. We can customize our technologyto receive and interpret many types of dispatch signals sent directly from an electric power grid operator or utilitycustomer to our NOC. Following the receipt of such a signal, our NOC automatically notifies specified C&Icustomer personnel of the demand response event. After relaying this notification to our C&I customers, weinitiate processes that reduce their electricity consumption from the electric power grid. These processes mayinclude dimming lights, shifting equipment to power save mode, adjusting heating and cooling set points andactivating a back-up generator. Demand reduction is monitored remotely with near real-time data feeds, theresults of which are displayed in our NOC through various data presentment screens. Each C&I customer site ismonitored for the duration of the demand response event and operations are restored to normal when the eventends. We currently participate in demand response programs across the United States, Australia, Canada, NewZealand and the United Kingdom, some of which require demand reductions within ten minutes or less.
Energy Management Application Platform and Operational Process
Our energy management application platform is our web-based enterprise software platform used forDemandSMART, EfficiencySMART, SupplySMART and CarbonSMART, as well as wireless energymanagement products, and is the underlying software that runs our NOC. It utilizes a modular web servicesarchitecture that is designed to allow application modules to be easily integrated into the platform. We believethat a key factor to successfully offering energy management applications, services and products is integratingdata from disparate sources and utilizing it to deliver customer-focused services utilizing open protocols.
Currently, our energy management application platform collects facility consumption data on a 1-minute,5-minute, 15-minute or hourly basis and integrates that data with near real-time, historical and forecasted marketvariables. We use our energy management application platform to measure, manage, benchmark and optimizeC&I customers’ energy consumption and facility operations. We use this data to help C&I customers analyzeconsumption patterns, forecast demand, measure real-time performance during demand response events,continuously monitor building management equipment to optimize system operation, model rates and tariffs andcreate energy scorecards to benchmark similar facilities. In addition, our energy management applicationplatform enables us to track our C&I customers’ greenhouse gas emissions by mapping their energy consumptionwith the fuel mix used for generation in their location, such as the proportion of coal, nuclear, natural gas, fuel oiland other sources used.
We have also deployed at certain of our DemandSMART C&I customer sites the industry’s first presence-enabled smart grid technology, which enables real-time communication through open, standards-based presence
7

technology between most Internet-enabled smart meters or devices and our NOC. The always-on, two-waypresence-based connection significantly enhances visibility into our demand response network and alsostreamlines the C&I customer site enablement process, allowing us to more efficiently equip C&I customers toparticipate in demand response programs. These devices are “firewall friendly” and can leverage existing C&Icustomer networks to facilitate secure, authenticated and encrypted communication, without the need to establisha virtual private network.
In 2011, we extended the capability of our energy management application platform to support a certaindemand response program in Canada by providing automatic and remote reductions of electricity from theelectric power grid in 0.2 seconds or less. We believe that this new key capability differentiates us from ourcompetitors and enhances our leadership position in the demand response industry.
The EnerNOC Site Server
We install a hardware device, called an EnerNOC Site Server, or ESS, at each C&I customer site to collectand communicate near real-time electricity consumption data and, in certain cases, enable remote control of aC&I customer’s electricity consumption. The ESS communicates to our NOC through the C&I customer’s LANor other internet connection. The ESS is an open, integrated system consisting of a central hardware deviceresiding inside a standard electrical box. The ESS allows our C&I customers to, among other things, respondquickly and completely to instructions from us to reduce electricity consumption.
Sales and Marketing
As of December 31, 2011, our sales and marketing team consisted of 204 employees. We organize our salesefforts by customer type. Our utility sales group sells to electric power grid operators and utilities, while ourcommercial and industrial sales group sells to C&I customers. Our utility sales group is responsible for securinglong-term contracts from electric power grid operators and utilities for our DemandSMART andEfficiencySMART applications, services and products. We actively pursue long-term contracts in bothrestructured markets and in traditionally regulated markets. Our commercial and industrial sales group sells ourenergy management applications, services and products to C&I customers. Our commercial and industrial salesgroup is located in major electricity regions throughout North America, including New England, New York, theMid-Atlantic, Texas, Florida, California, Idaho, and internationally in Australia, Canada, New Zealand and theUnited Kingdom.
Our marketing group is responsible for influencing all market stakeholders including customers, energyusers and policymakers, attracting prospects to our business, enabling the sales engagement process withmessaging, training and sales tools, and sustaining and expanding relationships with existing C&I customersthrough renewal and retention programs and by identifying cross-selling opportunities. This group researches ourcurrent and future markets and leads our strategies for growth, competitiveness, profitability and increasedmarket share.
Research and Development
As of December 31, 2011, our research and development team consisted of 73 employees. Our research anddevelopment team is responsible for developing and enhancing our existing energy management applications,services and products, as well as the engineering and design of new energy management applications, servicesand products. Our research and development expenses were approximately $14.3 million, $10.1 million and $7.6million for the years ended December 31, 2011, 2010 and 2009, respectively. During the years endedDecember 31, 2011, 2010 and 2009, we capitalized internal software development costs of $3.2 million, $6.8million and $4.2 million, respectively, and the amount is included as software in property and equipment atDecember 31, 2011. Included in the amounts above, we also capitalized $1.3 million and $1.5 million during theyears ended December 31, 2010 and 2009, respectively, related to a company-wide enterprise resource planningsystems implementation project which was placed into production in June 2011 and is being amortized over afive-year useful life.
8

Customers
C&I Customers
Our energy management applications, services and products provide cost effective energy managementstrategies for our C&I customers by reducing real-time demand for electricity, increasing energy efficiency,improving energy supply transparency, and mitigating emissions. One of our goals is to become the leadingoutsourced energy management service provider for C&I customers worldwide. Our commercial and industrialsales group primarily focuses their efforts on the following seven vertical markets: technology, education, foodsales and storage, government, healthcare, manufacturing/industrial and commercial real estate. The followingtable lists some of our C&I customers as of December 31, 2011 in each of the seven key vertical markets that ourcommercial and industrial sales group primarily targets for DemandSMART, EfficiencySMART,SupplySMART, CarbonSMART and wireless energy management products:Technology Education Food Sales and Storage Commercial Real Estate
AT&T Carnegie Mellon University SuperVALU SearsLevel 3 Communications The California State University Pathmark Morgan StanleyGeneral Electric Colorado State University Stop & Shop TransAmerica Pyramid PropertiesAdobe Systems Tennessee State University Shop Rite Beacon PropertiesGenentech Western Connecticut State University Whole Foods Markets Morguard Investments Limited
Memphis City Schools Stater Bros. Markets Washington Realty Investment Trust
Government Healthcare Manufacturing/Industrial
Commonwealth of Massachusetts Partners Healthcare Rio Tinto MineralsState of Vermont Adventist Hospital PfizerState of Connecticut Salford Royal NHS Foundation Trust Verso PaperCity of Boston, MA Hartford Hospital Kimberly-Clark, Inc.State of Rhode Island Genesis Healthcare Southeastern Container
Our contracts with C&I customers typically take two to four months to complete and have terms thatgenerally range between one and five years.
Grid Operator and Utility Customers
We have significantly grown our base of electric power grid operator and utility customers since inception.As of December 31, 2011, we provided our DemandSMART and EfficiencySMART applications and services toelectric power grid operator and utility customers in several regions throughout the United States, as well asinternationally in Australia, Canada, New Zealand and the United Kingdom. Our electric power grid operator andutility customers include ISO-NE, PJM, Southern California Edison Company, Tennessee Valley Authority,Australian Independent Market Operator Wholesale Electricity Market and OPA, among others.
Our contracts with electric power grid operator and utility customers typically take twelve toeighteen months to complete and, when successful, typically result in multi-million dollar contracts with termsthat generally range between three and ten years. We refer to these contracts as utility contracts. To date, we havereceived substantially all of our revenues from our electric power grid operator and utility customers forproviding our energy management applications, services and products.
Competition
We face competition from other providers of energy management service applications, services andproducts, advanced metering infrastructure service providers, and utilities and competitive electricity supplierswho offer their own energy management applications, services and products. We also compete with traditionalsupply-side resources, such as peaking power plants.
The industry in which we participate is fragmented. When competing for electric power grid operator andutility customers, we believe that the primary factors on which we compete are:
• the pricing of the demand response or energy efficiency services being offered; and
9

• the financial stability, historical performance levels and overall experience of the energy managementservice provider.
When competing for C&I customers, we believe that the primary factors on which we compete are:
• the level of demand response capacity payments shared with those C&I customers for their demandresponse capacity;
• the level of sophistication employed by the energy management service provider to identify and optimizeenergy management capabilities and opportunities; and
• the ability of the energy management service provider to service multiple sites across different geographicregions and to provide additional technology-enabled energy management applications, services andproducts.
Our primary competitors include energy management service providers Comverge, Inc, Exelon Corporation,Energy Curtailments Specialists and Hess, Inc. We believe that our operational experience and leadership in theclean and intelligent energy management applications, services and products sector gives us an advantage whencompeting for C&I, electric power grid operator, and utility customers. In addition, across our energymanagement application platform, we believe that we are unique in our ability to leverage real-time data acrossapplications to unlock the greatest amount of value and efficiency for our C&I customers, which we believepositions us favorably to win in competitive situations.
With respect to our competitors, some providers of advanced metering infrastructure services have added, ormay add, energy management applications, services and products like ours to their existing business. In addition,some advanced metering infrastructure service providers are substantially larger and better capitalized than weare and have the ability to combine demand response and additional energy management applications, servicesand products into an integrated offering to a large existing customer base.
Utilities and competitive electricity suppliers could and sometimes do also offer their own demand responseservices, which could decrease our base of potential C&I customers and could decrease our revenues. However,demand response programs, as administered by utilities alone, are bound to standard tariffs to which all C&Icustomers in the utility’s service territory must abide. Utilities must treat all rate class customers equally in orderto serve them under public utility commission-approved tariffs. In contrast, we have the flexibility to offercustomized energy management applications, services and products to different C&I customers. We believe thatwe also have technology and operational experience at the facility-level that both utilities and competitiveelectricity suppliers lack. We believe our technological advances differentiate us from our competitors andenhance our leadership position in the demand response industry. Furthermore, we believe that our energymanagement applications, services and products are complementary to utilities and competitive electricitysuppliers’ demand response efforts because we can help enlist C&I customers to their existing programs, reducetheir workload by serving as a single point of contact for an aggregated pool of C&I customers who choose toparticipate in their programs, and act to uphold or enhance C&I customer satisfaction. However, utilities andcompetitive electricity suppliers may offer energy management applications, services and products at pricesbelow cost or even for free in order to improve their customer relations or competitive positions, which woulddecrease our base of potential C&I customers and could decrease our revenues. For instance, utilities andcompetitive electricity suppliers are increasingly providing expertise to C&I customers relating to energy audits,demand reduction or energy efficiency measures.
We also compete with traditional supply-side resources such as natural gas-fired peaking plants. In somecases, utilities have an incentive to invest in these fixed assets rather than develop demand response as they areable to include the cost of fixed assets in their rate base and in turn receive a return on investment. In addition,some utilities have a financial disincentive to invest in demand response and even more so in energy efficiencybecause reducing demand can have the effect of reducing their sales of electricity. However, we believe that ourenergy management applications, services and products will continue to gain regulatory support as they are fasterto market, require no electric power generation, transmission or distribution infrastructure, and are more cost-effective and more environmentally sound than traditional alternatives.
10

Regulatory
We provide our energy management applications, services and products in restructured electricity marketsand in traditionally regulated electricity markets. Regulations within both types of markets impact how quicklycustomers may adopt our energy management applications, services and products, the prices we can charge andprofit margins we can earn, the MW we can enroll in certain programs, the timing with respect to when we beginearning revenue, and the various ways in which we are permitted or may choose to do business and accordingly,impact our assessments of which potential markets to most aggressively pursue. In addition, certain of ourcontracts with utilities are subject to regulatory approval, which regulatory approval may not be obtained on atimely basis, if at all.
The prices we can charge and revenues and profit margins we earn also can be affected by market policies,such as program rules that discount the value of demand response resources because they can only be availableduring a limited number of peak demand hours. This contrasts with other types of capacity resources that may beavailable 24 hours per day, every day of the week. Similarly, market rules and regulations defining whatconstitutes demand response can affect the amount of demand response capacity that we are able to enroll fromour C&I customers and the amounts that we need to pay them for their participation. For example, recent marketrule changes in the PJM region restrict our ability to receive capacity market compensation for load reductionsfrom a baseline level above a C&I customer’s prior year peak load, as compared to prior rules allowingcompensation for a full load drop. This rule change will significantly impact our future revenues, profit marginsand the number of MW that we could enroll in PJM’s demand response programs. Regulations applicable to theenergy management applications, services and products that we provide and the programs in which weparticipate also may change at any time and significantly impact the way that we conduct our business and ourresults of operations and financial condition. For example, in the event that market rules and regulations arechanged subsequent to our assuming a long-term obligation, such as winning a bid to provide demand responsecapacity in a forward capacity market, but prior to the year in which that capacity is required to be delivered, ourresults of operations and financial condition could be significantly and negatively impacted.
The policies regarding the measurement and verification of demand response resources, safety regulationsand air quality or emissions regulations often vary by jurisdiction and may affect how we do business. Forexample, some environmental agencies may limit the amount of emissions allowed from back-up generatorsutilized by C&I customers, even when back-up generators are strictly used to maintain system reliability. Forexample, in California, demand response capacity is generally not permitted to come from C&I customers whoactivate back-up generators in order to reduce their electric power grid usage. Therefore, all but one of ourcontracts with that state’s utilities limit the use of back-up generators. The exception is a contract that oursubsidiary, Celerity Energy Partners San Diego, LLC, or Celerity, entered into with San Diego Gas & Electric, orSDG&E, which allows use of back-up generators on which we install emissions control equipment. Measurementand verification policies of various markets influence how we modify the metering and control devices we installand data we record at each C&I customer site in those markets. In limited cases, we provide an interconnecteddemand response resource that exports power to the electric power grid for resale, such as in the case of thecontract between Celerity and SDG&E. In addition, under certain circumstances our demand response resourcesmay be used for other ancillary services, such as exporting power to the electric power grid as a short-termreserve resource. The export of power for resale or exporting power to the electric power grid for other ancillaryservices is subject to the requirements of the Federal Power Act and the direct regulation of FERC.
Intellectual Property
We utilize a combination of intellectual property safeguards, including patents, copyrights, trademarks andtrade secrets, as well as employee and third-party confidentiality and proprietary information agreements, toprotect our intellectual property. As of December 31, 2011, in the United States we held two patents, one ofwhich expires in 2024 and the other of which expires in 2022, and one published patent application pending. Wehave one issued patent in Australia. We also had three pending or published patent applications filed under thePatent Cooperation Treaty for Canada and one published application pending for Australia. Our patentapplications, and any future patent applications might not result in a patent being issued with the scope of the
11

claims we seek, or at all; and any patents we may receive may be challenged, invalidated or declaredunenforceable. We continually assess appropriate circumstances for seeking patent protection for those aspects ofour technology, designs and methodologies and processes that we believe provide significant competitiveadvantages.
As of December 31, 2011, we held numerous trademarks in the United States. Several of these trademarksare also registered in the European Community, Canada, Japan, China, Australia, and South Africa. In addition,we have a number of trademark applications pending in the United States, Canada, Japan and China.
With respect to, among other things, proprietary know-how that is not patentable and processes for whichpatent protection may not offer the best legal and business protection, we rely on trade secret protection andemploy confidentiality and proprietary information agreements to safeguard our interests. Many elements of ourenergy management applications, services and products involve proprietary know-how, technology or data thatare not covered by patents or patent applications, including technical processes, equipment designs, algorithmsand procedures. We have taken security measures to protect these elements. All of our employees have enteredinto confidentiality and proprietary information agreements with us. These agreements address intellectualproperty protection issues and require our employees to assign to us all of the inventions, designs, andtechnologies they develop during the course of employment with us. We also generally seek confidentiality andproprietary information protection from our customers and business partners before we disclose any sensitiveaspects of our technology or business strategies. We have not been subject to any material intellectual propertyclaims.
Seasonality
Peak demand for electricity and other capacity constraints tend to be seasonal. Peak demand tends to bemost extreme in warmer months, which may lead some demand response capacity markets to yield higher pricesfor capacity or contract for the availability of a greater amount of capacity during these warmer months. As aresult, our revenues can fluctuate from quarter to quarter based upon the seasonality of our demand responsebusiness in certain of the markets in which we operate, where payments under certain of our long-term contractsand pursuant to certain open market bidding programs in which we participate are higher or concentrated inparticular seasons and months. For example, in the PJM forward capacity market, which is a market from whichwe derive a substantial portion of our revenues, we have historically recognized demand response capacity-basedrevenue from PJM during the four-month delivery period of June through September. This typically resulted inhigher revenues in our second and third quarters as compared to our first and fourth quarters. Commencing in thefiscal year ending December 31, 2012, we will recognize demand response capacity-based revenue from PJM atthe end of the delivery period in September.
Employees
As of December 31, 2011, we had 599 full-time employees, including 204 in sales and marketing, 73 inresearch and development and 322 in general and administrative, including operations. Of these full-timeemployees, 291 were located in New England, thirteen were located in New York, 30 were located in theMid-Atlantic, 136 were located in California, 33 were located in Idaho, eleven were located in Canada, twelvewere located in Texas, seven were located in Illinois, four were located in Tennessee, ten were located in theUnited Kingdom, 26 were located in Australia, four were located in New Zealand and 22 were located in otherareas across the United States. We expect to grow our employee base, and our future success will depend in parton our ability to attract, retain and motivate highly qualified personnel, for whom competition is intense. Ouremployees are not represented by any labor unions or covered by a collective bargaining agreement and we havenot experienced any work stoppages. We consider our relations with our employees to be good.
Available Information
We were incorporated in Delaware on June 5, 2003 and have our corporate headquarters at 101 FederalStreet, Suite 1100, Boston, Massachusetts 02110. We operated as EnerNOC, LLC, a New Hampshire limited
12

liability company, from December 2001 until June 2003. We conduct operations and maintain a number ofdomestic and international subsidiaries. We also maintain ENOC Securities Corporation, a Massachusettssecurities corporation, to invest our cash balances on a short-term basis. Our Internet website address iswww.enernoc.com. Our Annual Reports on Form 10-K, Quarterly Reports on Form 10-Q, Current Reports onForm 8-K and amendments to those reports filed or furnished pursuant to Section 13(a) or 15(d) of the SecuritiesExchange Act of 1934, as amended, or the Exchange Act, are available free of charge through the investorrelations page of our Internet website as soon as reasonably practicable after we electronically file such materialwith, or furnish it to, the Securities and Exchange Commission, or the SEC.
13

Item 1A. Risk Factors
The statements contained in this section, as well as statements described elsewhere in this Annual Report onForm 10-K or in our other SEC filings, describe risks that could materially and adversely affect our business,financial condition and results of operations and the trading price of our securities. These risks are not the onlyrisks that we face. Our business, financial condition and results of operations could also be materially affectedby additional factors that are not presently known to us or that we currently consider to be immaterial to ouroperations.
Risks Related to Our Business
Our future profitability is uncertain and we may continue to incur net losses in the future.
As of December 31, 2011, we had an accumulated deficit of $81.1 million. For the year ended December 31,2011, we incurred a net loss of $13.4 million. Although we achieved profitability for the year endedDecember 31, 2010, with net income of $9.6 million, we incurred net losses for all other fiscal years since ourinception, including the year ended December 31, 2011, and we expect to incur additional operating losses in thenear term. Our operating losses have historically been driven by start-up costs, costs of developing ourtechnology including new product and service offerings, and operating expenses related to increased headcountand the expansion of the number of MW under our management. As we seek to grow our revenues and customerbase, we plan to continue to invest in our business and employee base in order to capitalize on emergingopportunities and expand our energy management applications, services and products, which will requireincreased operating expenses. We expect these increased operating expenses, as well as other factors, to cause usto incur net losses in the near term, and there can be no assurance that we will be able to grow our revenues atrates that will allow us to achieve profitability in the long term.
A substantial majority of our revenues are and have been generated from contracts with, and open marketprogram sales to, a limited number of electric power grid operator and utility customers, and the modificationor termination of these open market programs or sales relationships could materially adversely affect ourbusiness.
During the years ended December 31, 2011, 2010 and 2009, revenues generated from open market sales toPJM, an electric power grid operator customer, accounted for 53%, 60% and 52%, respectively, of our totalrevenues. The modification or termination of our sales relationship with PJM, or the modification or terminationof any of PJM’s open market programs in which we participate, could significantly reduce our future revenuesand profit margins and have a material adverse effect on our results of operations and financial condition. Forexample, beginning in June 2012, PJM will discontinue its Interruptible Load for Reliability program, or ILRprogram, which is a program in which we have historically been an active participant. The discontinuance of theILR program by PJM will reduce the flexibility that we currently have to manage our portfolio of demandresponse capacity in the PJM market and will negatively impact our future revenues and profit margins. Inaddition, in February 2012, FERC issued an order substantially accepting the PJM proposal, which resulted in theimmediate implementation of PJM’s proposed market rule changes regarding capacity compliance measurementand verification. As a result, our future revenues and profit margins will be significantly reduced and our futureresults of operations and financial condition will be negatively impacted, although these impacts may be offsetby our future growth in MWs in the PJM market.
Revenues generated from open market sales to ISO-NE, an electric power grid operator customer, accountedfor 13%, 18% and 29%, respectively, of our total revenues for the years ended December 31, 2011, 2010 and2009. The modification or termination of our sales relationship with ISO-NE, or the modification or terminationof any of ISO-NE’s open market programs in which we participate, could significantly reduce our futurerevenues and profit margins and have a material adverse effect on our results of operations and financialcondition.
14

If we fail to obtain favorable prices in the open market programs in which we currently participate or chooseto participate in the future, specifically in the PJM or ISO-NE market, our revenues, gross profits and profitmargins will be negatively impacted
In open market programs, electric power grid operators and utilities generally seek bids from companiessuch as ours to provide demand response capacity based on prices offered in competitive bidding. These pricesmay be subject to volatility due to certain market conditions or other events, and as a result the prices offered tous for this demand response capacity may be significantly lower than historical prices. For example, open marketauctions of capacity in the PJM and ISO-NE markets in which we currently participate have resulted in pricesthat are significantly lower than those achieved in prior periods. Accordingly, our revenues, gross profits andprofit margins will be significantly and adversely affected in 2012 as the lower capacity prices in the PJM andISO-NE markets take effect for that year. To the extent we are subject to other similar price reductions in thefuture, our revenues, gross profits and profit margins could be further negatively impacted. We also may besubject to reduced capacity prices or be unable to participate in certain open market programs for a period of timeto the extent that our bidding strategy fails to produce favorable results. In addition, adverse changes in thegeneral economic and market conditions in the regions in which we provide demand response capacity mayresult in a reduced demand for electricity, resulting in lower prices for capacity, both demand-side and supply-side, for the foreseeable future, which could materially and adversely affect our results of operations andfinancial condition.
Unfavorable regulatory decisions, changes to the market rules applicable to the programs in which wecurrently participate or may participate in the future, and varying regulatory structures in certain regionalelectric power markets could negatively affect our business and results of operations.
Unfavorable regulatory decisions in markets where we currently operate or choose to operate in the futurecould also significantly and negatively affect our business. For example, in February 2012 FERC issued an ordersubstantially accepting the PJM proposal, which resulted in the immediate implementation of PJM’s proposedmarket rule changes regarding capacity compliance measurement and verification. As a result, our futurerevenues and profit margins with respect to the PJM region will be significantly reduced and our future results ofoperations and financial condition will be negatively impacted, although these impacts may be offset by ourfuture growth in MWs in the PJM market. In addition, to the extent that PJM or any other grid operator or utilitycustomer is successful at modifying any program or market rules in the future in a manner adverse to ourbusiness, our future revenues and profit margins may be significantly reduced and our future results of operationsand financial condition could be further negatively impacted. Market rules could also be modified to change thedesign of a particular demand response program, which may adversely affect our participation in that program, ora demand response program in which we currently participate could be eliminated in its entirety and replacedwith a new, more challenging program. For example, the commencement of ISO-NE’s forward capacity marketin June 2010, included new program rules that changed measurement and verification methodologies andlowered prices for certain demand response resource types as compared to the ISO-NE program in effect prior toJune 2010. This rule change resulted in reduced participation by demand response resources and negativelyimpacted our revenues, profits and profit margins in 2010 and 2011. Any elimination or change in the design of ademand response program, including any supplemental program, in which we participate, especially in the PJMor ISO-NE markets where we have substantial operations, could adversely impact our ability to successfullymanage our portfolio of demand response capacity in that program and could have a material adverse effect onour results of operations and financial condition.
Regulators could also modify market rules in certain areas to further limit the use of back-up generators indemand response markets or could implement bidding floors or caps that could lower our revenue opportunities.A limit on back-up generators would mean that some of the demand response capacity reductions we aggregatefrom C&I customers willing to reduce consumption from the electric power grid by activating their own back-upgenerators during demand response events would not qualify as capacity, and we would have to find alternativesources of capacity from C&I customers willing to reduce load by curtailing consumption rather than bygenerating electricity themselves. In addition, the electric power industry is highly regulated. The regulatorystructures in regional electricity markets are varied and some regulatory requirements make it more difficult for
15

us to provide some or all of our energy management applications, services and products in those regions. Forinstance, in some markets, regulated quantity or payment levels for demand response capacity or energy make itmore difficult for us to cost-effectively enroll and manage many C&I customers in demand response programs.Further, some markets have regulatory structures that do not yet include demand response as a qualifyingresource for purposes of short-term reserve requirements known as ancillary services. As part of our businessstrategy, we intend to expand into additional regional electricity markets. However, unfavorable regulatorystructures could limit the number of regional electricity markets available to us for expansion.
The success of our business depends in part on our ability to develop new energy management applications,services and products and increase the functionality of our current energy management applications, servicesand products.
The market for our energy management applications, services and products is characterized by rapidtechnological changes, frequent new software introductions, Internet-related technology enhancements, uncertainproduct life cycles, changes in customer demands and evolving industry standards and regulations. We may notbe able to successfully develop and market new energy management applications, services and products thatcomply with present or emerging industry regulations and technology standards. Also, any new or modifiedregulation or technology standard could increase our cost of doing business.
From time to time, our customers have expressed a need for increased functionality in our energymanagement applications, services and products. In response, and as part of our strategy to enhance our energymanagement applications, services and products and grow our business, we plan to continue to make substantialinvestments in the research and development of new technologies. Our future success will depend in part on ourability to continue to design and sell new, competitive energy management applications, services and productsand enhance our existing energy management applications, services and products. Initiatives to develop newenergy management applications, services and products will require continued investment, and we mayexperience unforeseen problems in the performance of our technologies and operational processes, including newtechnologies and operational processes that we develop and deploy, to implement our energy managementapplications, services and products. In addition, software addressing our energy management applications,services and products is complex and can be expensive to develop, and new software and software enhancementscan require long development and testing periods. If we are unable to develop new energy managementapplications, services and products or enhancements to our existing energy management applications, servicesand products on a timely basis, or if the market does not accept our new or enhanced energy managementapplications, services and products, we will lose opportunities to realize revenues and obtain customers, and ourbusiness and results of operations will be adversely affected.
We depend on customers who are involved in the electric power industry for revenues and, as a result, ouroperating results have experienced, and may continue to experience, significant variability due to volatility inelectric power industry spending and other factors affecting the electric utility industry, such as seasonality ofpeak demand and overall demand for electricity.
We currently derive substantially all of our revenues from the sale of our demand response application andservices, directly or indirectly, to the electric power industry. Purchases of our demand response application andservices by electric power grid operators or utilities may be deferred, cancelled or otherwise negatively impactedas a result of many factors, including challenging economic conditions, mergers and acquisitions involving theseentities, fluctuations in interest rates and increased electric utility capital spending on traditional supply-sideresources. Sales of demand response capacity in open market bidding programs are particularly susceptible tovariability based on changes in the spending patterns of our electric power grid operator and utility customersand on associated fluctuating market prices for capacity.
In addition, peak demand for electricity and other capacity constraints tend to be seasonal. Peak demand inthe United States tends to be most extreme in warmer months, which may lead some demand response capacitymarkets to yield higher prices for demand response capacity or contract for the availability of a greater amount ofdemand response capacity during these warmer months. As a result, our demand response revenues may be
16

seasonal. For example, in the PJM forward capacity market, which is a market from which we derive asubstantial portion of our revenues, we historically recognized capacity-based revenue from PJM during the four-month delivery period of June through September. This has historically resulted in higher revenues in our secondand third quarters as compared to our first and fourth quarters. Commencing in the fiscal year endingDecember 31, 2012, we will recognize demand response capacity-based revenue from PJM at the end of thedelivery period in September. As a result of this seasonality, we believe that quarter to quarter comparisons ofour operating results are not necessarily meaningful and that these comparisons cannot be relied upon asindicators of future performance.
Further, occasional events, such as a spike in natural gas prices or potential decreases in availability, canlead electric power grid operators and utilities to implement short-term calls for demand response capacity torespond to these events, but we cannot be sure that such calls will occur or that we will be in a position togenerate revenues when they do occur. In addition, given the current economic slowdown and the relatedpotential reduction in demand for electricity, there can be no assurance that there will not be a correspondingreduction in the implementation of both supply and demand-side resources by electric power grid operators andutilities. We have experienced, and may in the future experience, significant variability in our revenues, on bothan annual and a quarterly basis, as a result of these and other factors. Pronounced variability or an extendedperiod of reduction in spending by electric power grid operators and utilities could negatively impact ourbusiness and make it difficult for us to accurately forecast our future sales.
An oversupply of electric generation capacity in certain regional electric power markets could negativelyaffect our business and results of operations.
A buildup of new electric generation facilities or reduced demand for electric capacity could result in excesselectric generation capacity in certain regional electric power markets. Excess electric generation capacity andunfavorable regulatory structures could lower the value of demand response services and limit the number ofeconomically attractive regional electricity markets that are available to us for expansion, which could negativelyimpact our business and results of operations.
The amended and restated 2011 credit facility contains financial and operating restrictions that may limit ouraccess to credit. If we fail to comply with covenants in the amended and restated 2011 credit facility, we maybe required to repay our indebtedness thereunder, which may have a material adverse effect on our liquidity.
Provisions in the amended and restated 2011 credit facility impose restrictions on our ability to, amongother things:
• incur additional indebtedness;
• create liens;
• enter into transactions with affiliates;
• transfer assets;
• make certain acquisitions;
• pay dividends or make distributions on, or repurchase, EnerNOC stock;
• merge or consolidate; or
• undergo a change of control.
In addition, we are required to meet certain financial covenants customary with this type of credit facility,including maintaining minimum earnings levels and a minimum specified ratio of current assets to currentliabilities. The amended and restated 2011 credit facility also contains other customary covenants. We may notbe able to comply with these covenants in the future. Our failure to comply with these covenants may result inthe declaration of an event of default and could cause us to be unable to borrow under the amended and restated2011 credit facility. In addition to preventing additional borrowings under the amended and restated 2011 creditfacility, an event of default, if not cured or waived, may result in the acceleration of the maturity of indebtednessoutstanding under the amended and restated 2011 credit facility, which would require us to pay all amountsoutstanding. In addition, in the event that we default under the amended and restated 2011 credit facility
17

while we have letters of credit outstanding, we will be required to post up to 105% of the value of the letters ofcredit in cash with SVB and a certain other lender to collateralize those letters of credit.
As of December 31, 2011, we were not in compliance with the financial covenant related to the achievementof minimum earnings levels required under the 2011 credit facility, but we obtained a waiver from SVB withrespect to such financial covenant and as a result, we were not required to post cash to collateralize ouroutstanding letters of credit. As of December 31, 2011, we were contingently liable for $31.6 million inconnection with outstanding letters of credit under the 2011 credit facility. If an event of default occurs, we maynot be able to cure it within any applicable cure period, if at all. If the maturity of our indebtedness is accelerated,we may not have sufficient funds available for repayment or we may not have the ability to borrow or obtainsufficient funds to replace the accelerated indebtedness on terms acceptable to us, or at all.
The expiration of our existing utility contracts without obtaining renewal or replacement utility contractscould negatively impact our business by reducing our revenues and profit margins, thereby having a materialadverse effect on our results of operations and financial condition.
We have entered into utility contracts with our electric power grid operator and utility customers in differentgeographic regions in the United States, as well as in Australia, Canada, New Zealand and the United Kingdom,and are regularly in discussions to enter into new utility contracts with electric power grid operators and utilities.However, there can be no assurance that we will be able to renew or extend our existing utility contracts or enterinto new utility contracts on favorable terms, if at all. If, upon expiration, we are unable to renew or extend ourexisting utility contracts and are unable to enter into new utility contracts, our future revenues and profit marginscould be significantly reduced, which could have a material adverse effect on our results of operations andfinancial condition.
An increased rate of terminations by our C&I customers, or their failure to renew contracts when they expire,would negatively impact our business by reducing our revenues and requiring us to spend more money tomaintain and grow our C&I customer base.
Our ability to provide demand response capacity under our utility contracts and in open market biddingprograms depends on the amount of MW that we manage across C&I customers who enter into contracts with usto reduce electricity consumption on demand. If our existing C&I customers do not renew their contracts as theyexpire, we will need to acquire MW from additional C&I customers or expand our relationships with existingC&I customers in order to maintain our revenues and grow our business. The loss of revenues resulting fromC&I customer contract terminations could be significant, and limiting C&I customer terminations is an importantfactor in our ability to return to profitability in future periods. If we are unsuccessful in limiting our C&Icustomer terminations, we may be unable to acquire a sufficient amount of MW or we may incur significantcosts to replace MW in our portfolio, which could cause our revenues to decrease and our cost of revenues toincrease.
We face pricing pressure relating to electric capacity made available to electric power grid operators andutilities and in the percentage or fixed amount paid to C&I customers for making capacity available, whichcould adversely affect our results of operations and financial condition.
The rapid growth of the energy management applications, services and products sector is resulting inincreasingly aggressive pricing, which could cause the prices in that sector to decrease over time. Our electricpower grid operator and utility customers may switch to other energy management applications, services andproducts providers based on price, particularly if they perceive the quality of our competitors’ products orservices to be equal or superior to ours. Continued decreases in the price of demand response capacity by ourcompetitors could result in a loss of electric power grid operator and utility customers or a decrease in the growthof our business, or it may require us to lower our prices for capacity to remain competitive, which would result inreduced revenues and lower profit margins and would adversely affect our results of operations and financialcondition. Continued increases in the percentage or fixed amount paid to C&I customers by our competitors formaking capacity available could result in a loss of C&I customers or a decrease in the growth of our business. It
18

also may require us to increase the percentage or fixed amount we pay to our C&I customers to remaincompetitive, which would result in increases in the cost of revenues and lower profit margins and wouldadversely affect our results of operations and financial condition.
We may not be able to identify suitable acquisition candidates or complete acquisitions successfully, whichmay inhibit our rate of growth, and acquisitions that we complete may expose us to a number of unanticipatedoperational and financial risks.
In addition to organic growth, we intend to continue to pursue growth through the acquisition of companiesor assets that may enable us to enhance our technology and capabilities, expand our geographic market, addexperienced management personnel and increase our service offerings. However, we may be unable toimplement this growth strategy if we cannot identify suitable acquisition candidates, reach agreement onpotential acquisitions on acceptable terms, successfully integrate personnel or assets that we acquire or for otherreasons. Our acquisition efforts may involve certain risks, including:
• an acquisition may involve unexpected costs or liabilities, may cause us to fail to meet our previouslystated financial guidance, or the effects of purchase accounting may be different from our expectations;
• problems may arise with our ability to successfully integrate the acquired businesses, which may result inus not operating as effectively and efficiently as expected, and may include:
• diversion of management time, as well as a shift of focus from operating the businesses to issues relatedto integration and administration or inadequate management resources available for integration activityand oversight;
• failure to retain and motivate key employees;
• failure to successfully manage relationships with customers and suppliers;
• failure of customers to accept our new energy management applications, services and products;
• failure to effectively coordinate sales and marketing efforts;
• failure to combine service offerings quickly and effectively;
• failure to effectively enhance acquired technology, applications, services and products or develop newapplications, services and products relating to the acquired businesses;
• difficulties and inefficiencies in managing and operating businesses in multiple locations or operatingbusinesses in which we have either limited or no direct experience;
• difficulties integrating financial reporting systems;
• difficulties in the timely filing of required reports with the SEC; and
• difficulties in implementing controls, procedures and policies, including disclosure controls andprocedures and internal controls over financial reporting, appropriate for a larger public company atcompanies that, prior to their acquisition, lacked such controls, procedures and policies, which mayresult in ineffective disclosure controls and procedures or material weaknesses in internal controls overfinancial reporting;
• we may not be able to achieve the expected synergies from an acquisition, or it may take longer thanexpected to achieve those synergies;
• an acquisition may result in future impairment charges related to diminished fair value of businessesacquired as compared to the price we paid for them;
• an acquisition may involve restructuring operations or reductions in workforce, which may result insubstantial charges to our operations; and
• future acquisitions could result in potentially dilutive issuances of equity securities, the incurrence of debt,or contingent liabilities, which could harm our financial condition.
19

In January 2011, we completed the acquisition of Global Energy and M2M, as well as another immaterialacquisition. In July 2011, we completed the acquisition of Energy Response Holdings Pty Ltd, or EnergyResponse. There can be no assurance that we will be able to successfully integrate these companies or any othercompanies, products or technologies that we acquire.
Failure of third parties to manufacture or install quality products or provide reliable services in a timelymanner or at all could cause delays in the delivery of our energy management applications, services andproducts, or could result in a failure to provide accurate data to our electric power grid operator and utilitycustomers, which could damage our reputation, cause us to lose customers and have a material adverse effecton our business results of operations and financial condition.
Our success depends on our ability to provide quality, reliable, and secure energy management applications,services and products in a timely manner, which in part requires the proper functioning of facilities andequipment owned, operated, installed or manufactured by third parties upon which we depend. For example, ourreliance on third parties includes:
• utilizing components that we or third parties install or have installed at C&I customer sites;
• relying on metering information provided by third parties to accurately and reliably provide customer datato our electric power grid operator and utility customers;
• outsourcing email notification and cellular and paging wireless communications that are used to notify ourC&I customers of their need to reduce electricity consumption at a particular time and to executeinstructions to devices installed at our C&I customer sites that are programmed to automatically reduceconsumption on receipt of such secure communications; and
• outsourcing certain installation and maintenance operations to third-party providers.
Any delays, malfunctions, inefficiencies or interruptions in these products, services or operations couldadversely affect the reliability or operation of our energy management applications, services and products, whichcould cause us to experience difficulty monitoring or retaining current customers and attracting new customers.Any errors in metering information provided to us by third parties, including electric power grid operators andutilities, could also adversely affect the customer data that we provide to our electric power grid operator andutility customers. Such delays and errors could result in an overpayment or underpayment to us and our C&Icustomers from our electric power grid operator and utility customers, which in some instances may cause us toviolate certain market rules and require us to make refunds or pay penalty fees to our electric power grid operatorand utility customers. In addition, in such instances our brand, reputation and growth could be negativelyimpacted.
We face risks related to our expansion into international markets.
We intend to expand our addressable market by pursuing opportunities to provide our energy managementapplications, services and products in international markets. For example, during the first quarter of 2011, wecommenced operations in Australia by enrolling MW in the Independent Market Operator Wholesale ElectricityMarket. In addition, during the third quarter of 2011, we commenced operations in New Zealand by enrollingMW in the Transpower Instantaneous Reserves Market following our acquisition of Energy Response.Accordingly, new markets may require us to respond to new and unanticipated regulatory, marketing, sales andother challenges. There can be no assurance that we will be successful in responding to these and otherchallenges we may face as we enter and attempt to expand in international markets. International operations alsoentail a variety of other risks, including:
• unexpected changes in legislative, regulatory or market requirements of foreign countries;
• currency exchange fluctuations;
• longer payment cycles and greater difficulty in accounts receivable collection; and
• significant taxes or other burdens of complying with a variety of foreign laws.
20
International operations are also subject to general geopolitical risks, such as political, social and economicinstability and changes in diplomatic and trade relations. One or more of these factors could adversely affect anyinternational operations and result in lower revenue than we expect and could significantly affect our results ofoperations and financial condition.
We have a limited operating history in an emerging market, which may make it difficult to evaluate ourbusiness and prospects, and may expose us to increased risks and uncertainties.
We were incorporated as a Delaware corporation in June 2003 and first began generating revenues in 2003.Accordingly, we have only a limited history of generating revenues, and the future revenue potential of our businessin the emerging market for energy management applications, services and products is uncertain. As a result of ourshort operating history, we have limited financial data that can be used to evaluate our business, strategies,performance and prospects or an investment in our common stock. Any evaluation of our business and ourprospects must be considered in light of our limited operating history and the risks and uncertainties encountered bycompanies in an emerging market. To address these risks and uncertainties, we must do the following:
• maintain our current relationships and develop new relationships with electric power grid operators andutilities and the entities that regulate them;
• maintain and expand our current relationships and develop new relationships with C&I customers;
• maintain and enhance our existing energy management applications, services and products, andtechnology systems;
• continue to develop new energy management applications, services and products that achieve significantmarket acceptance;
• continue to enhance our information processing systems;
• execute our business and marketing strategies successfully, including accurately nominating demandresponse capacity in the programs in which we participate, and delivering a high level of performance byassisting our C&I customers to reduce their energy usage during demand response events;
• respond to competitive developments;
• attract, integrate, retain and motivate qualified personnel; and
• continue to participate in shaping the regulatory environment.
We may be unable to accomplish one or more of these objectives, which could cause our business to suffer. Inaddition, accomplishing many of these goals might be very expensive, which could adversely impact our operatingresults and financial condition. Any predictions about our future operating results may not be as accurate as theycould be if we had a longer operating history and if the market in which we operate was more mature.
Our results of operations could be adversely affected if our operating expenses and cost of sales do notcorrespond with the timing of our revenues.
Most of our operating expenses, such as employee compensation and rental expense for properties, areeither relatively fixed in the short-term or incurred in advance of sales. Moreover, our spending levels are basedin part on our expectations regarding future revenues. As a result, if revenues for a particular quarter are belowexpectations, we may not be able to proportionately reduce operating expenses for that quarter. For example, if ademand response event or metering and verification test does not occur in a particular quarter, we may not beable to recognize revenues for the undemonstrated capacity in that quarter. This shortfall in revenues couldadversely affect our operating results for that quarter and could cause the market price of our common stock todecline substantially.
We incur significant up-front costs associated with the expansion of the number of MW under ourmanagement and the infrastructure necessary to enable those MW. In most of the markets in which we originallyfocused our growth, we generally begin earning revenues from our MW under management shortly afterenablement. However, in certain forward capacity markets in which we participate or choose to participate in the
21

future, it may take longer for us to begin earning revenues from MW that we enable, in some cases up to a yearafter enablement. For example, the PJM forward capacity market, which is a market from which we derive asubstantial portion of our revenues, operates on a June to May program-year basis, which means that a MW thatwe enable after June of each year will typically not begin earning revenue until June of the following year. Thisresults in a longer average revenue recognition lag time in our C&I customer portfolio from the point in timewhen we consider a MW to be under management to when we earn revenues from that MW. The up-front costswe incur to expand our MW under management in PJM and other similar markets, coupled with the delay inreceiving revenues from those MW, could adversely affect our operating results and could cause the market priceof our common stock to decline substantially.
We operate in highly competitive markets; if we are unable to compete successfully, we could lose marketshare and revenues.
The market for energy management applications, services and products is fragmented. Some traditionalproviders of advanced metering infrastructure services have added, or may add, demand response or other energymanagement applications, services and products to their existing business. We face strong competition fromother energy management service providers, both larger and smaller than we are. We also compete againsttraditional supply-side resources such as natural gas-fired peaking power plants. In addition, utilities andcompetitive electricity suppliers offer their own energy management applications, services and products, whichcould decrease our base of potential customers and revenues and have a material adverse effect on our results ofoperations and financial condition.
Many of our competitors have greater financial resources than we do. Our competitors could focus theirsubstantial financial resources to develop a competing business model or develop products or services that aremore attractive to potential customers than what we offer. Some advanced metering infrastructure serviceproviders, for example, are substantially larger and better capitalized than we are and have the ability to combineadvanced metering and demand response services into an integrated offering to a large, existing customer base.Our competitors may offer energy management applications, services and products at prices below cost or evenfor free in order to improve their competitive positions. Any of these competitive factors could make it moredifficult for us to attract and retain customers, cause us to lower our prices in order to compete, and reduce ourmarket share and revenues, any of which could have a material adverse effect on our financial condition andresults of operations. In addition, we may also face competition based on technological developments that reducepeak demand for electricity, increase power supplies through existing infrastructure or that otherwise competewith our energy management applications, services and products.
If the actual amount of demand response capacity that we make available under our capacity commitments isless than required, our committed capacity could be reduced and we could be required to make refunds or paypenalty fees, which could negatively impact our results of operations and financial condition.
We provide demand response capacity to our electric power grid operator and utility customers either underutility contracts or under terms established in open market bidding programs where capacity is purchased. Underthe utility contracts and open market bidding programs, electric power grid operators and utilities make periodicpayments to us based on the amount of demand response capacity that we are obligated to make available to themduring the contract period, or make periodic payments to us based on the amount of demand response capacitythat we bid to make available to them during the relevant period. We refer to these payments as committedcapacity payments. Committed capacity is negotiated and established by the utility contract or set in the openmarket bidding process and is subject to subsequent confirmation by measurement and verification tests orperformance in a demand response event. In our open market bidding programs, we offer different amounts ofcommitted capacity to our electric power grid operator and utility customers based on market rules on a periodicbasis. We refer to measured and verified capacity as our demonstrated or proven capacity. Once demonstrated,the proven capacity amounts typically establish a baseline of capacity for each C&I customer site in ourportfolio, on which committed capacity payments are calculated going forward and until the next demandresponse event or measurement and verification test when we are called upon to make capacity available.
22

Under some of our utility contracts and in certain open market bidding programs, any difference betweenour demonstrated capacity and the committed capacity on which capacity payments were previously made willresult in either a refund payment from us to our electric power grid operator or utility customer or an additionalpayment to us by such customer. Any refund payable by us would reduce our deferred revenues, but would notimpact our previously recognized revenues. If there is a refund payment due to an electric power grid operator orutility customer, we generally make a corresponding adjustment in our payments to the C&I customer orcustomers who failed to make the appropriate level of capacity available, however we are sometimes unable todo so. In addition, some of our utility contracts with, and open market programs established by, our electricpower grid operator and utility customers provide for penalty payments, which could be substantial, in certaincircumstances in which we do not meet our capacity commitments, either in measurement and verification testsor in demand response events. Further, because measurement and verification test results for some utilitycontracts and in certain open market bidding programs establish capacity levels on which payments will be madeuntil the next measurement and verification test or demand response event, the payments to be made to us underthese utility contracts and open market bidding programs could be reduced until the level of capacity isestablished at the next measurement and verification test or demand response event. We could experiencesignificant period-to-period fluctuations in our financial results in future periods due to any refund or penaltypayments, capacity payment adjustments, replacement costs or other payments made to our electric power gridoperator or utility customers, which could be substantial. We incurred aggregate net penalty payments of $0.7million, $0.3 million, and $0.2 million during the years ended December 31, 2011, 2010 and 2009, respectively.
Our ability to achieve our committed capacity depends on the performance of our C&I customers, and thefailure of these customers to make the appropriate levels of capacity available when called upon could causeus to make refund payments to, or incur penalties imposed by, our electric power grid operator and utilitycustomers.
The capacity level that we are able to achieve is dependent upon the ability of our C&I customers to curtailtheir energy usage when called upon by us during a demand response event or a measurement and verificationtest. Certain demand response programs in which we currently participate or choose to participate in the futuremay have rigorous requirements, making it difficult for our C&I customers to perform when called upon by us.For example, the market rules applicable to ISO-NE’s forward capacity market, which went into effect in June2010, are rigorous and may result in the failure by some of our C&I customers to make the appropriate levels ofcapacity available. In addition, if PJM dispatches a measurement and verification test and our C&I customers failto perform or perform in a deficient manner, we may be subject to substantial penalties given that we haveenrolled a significant number of MW in the PJM demand response market. In the event that our C&I customersare unable to perform or perform at levels below which they agreed to perform, we may be unable to achieve ourcommitted capacity levels and may be subject to the refunds or penalties described in the risk factor above,which could have a material adverse effect on our results of operations and financial condition. The capacitylevel that we are able to achieve also varies with the electricity demand of targeted equipment, such as heatingand cooling equipment, at the time a C&I customer is called to perform. Accordingly, our ability to delivercommitted capacity depends on factors beyond our control, such as the temperature and humidity, and then-current electricity use by our C&I customers when those C&I customers are called to perform. The correctoperation of, and timely communication with, devices used to control equipment are also important factors thataffect available capacity.
If we fail to successfully educate existing and potential electric power grid operator and utility customersregarding the benefits of our energy management applications, services and products or a market otherwisefails to develop for those applications, services and products, our ability to sell our energy managementapplications, services and products and grow our business could be limited.
Our future success depends on commercial acceptance of our energy management applications, services andproducts and our ability to enter into additional utility contracts and new open market bidding programs. Weanticipate that revenues related to our demand response application and services will constitute a substantialmajority of our revenues for the foreseeable future. The market for energy management applications, services
23

and products in general is relatively new. If we are unable to educate our potential customers about the advantagesof our energy management applications, services and products over competing products and services, or our existingcustomers no longer rely on our energy management applications, services and products, our ability to sell ourenergy management applications, services and products will be limited. In addition, because the energymanagement applications, services and products sector is rapidly evolving, we cannot accurately assess the size ofthe market, and we may have limited insight into trends that may emerge and affect our business. For example, wemay have difficulty predicting customer needs and developing energy management applications, services andproducts that address those needs. Further, we are subject to the risk that the current global economic and marketconditions will result in lower overall demand for electricity in the United States and other markets that we areseeking to penetrate over the next few years. Such a reduction in the demand for electricity could create acorresponding reduction in both supply- and demand-side resources being implemented by electric power gridoperators and utilities. If the market for our energy management applications, services and products does notcontinue to develop, our ability to grow our business could be limited and we may not be able to operate profitably.
We may be subject to governmental or regulatory audits or investigations and may incur significant penaltiesand fines if found to be in non-compliance with any applicable State or Federal regulation.
While the electric power markets in which we operate are regulated, most of our business is not directlysubject to the regulatory framework applicable to the generation and transmission of electricity. However,regulations by FERC related to market design, market rules, tariffs, and bidding rules impact how we can interactwith our electric power grid operator and utility customers. For example, our subsidiary Celerity exports powerto the electric power grid and is thus subject to direct regulation by FERC and its regulations related to the sale ofwholesale power at market based rates. In addition, to the extent our demand response resources are used toprovide ancillary services that involve a sale of electric energy or capacity for resale, or the export of power ontothe electric power grid, such activities are also subject to direct regulation by FERC. Despite our efforts tomanage compliance with such regulations, we may be found to be in non-compliance with such regulations andtherefore subject to penalties or fines, which could have a material adverse effect on our business, financialcondition and results of operations.
In addition, we may be subject to governmental or regulatory audits or investigations from time to time inconnection with our participation in certain demand response programs. For example, in December 2010 wereceived a letter from FERC advising us that FERC would be conducting an audit of us and our demand responseand efficiency resources within the ISO-NE and New York ISO markets. The audit was conducted as part ofFERC’s annual audit plan to determine whether jurisdictional companies are in compliance with FERC’s statutes,orders, and rules and regulations. The audit evaluated our compliance, as a market participant, with the tariffsapplicable to the ISO-NE and New York ISO markets. The audit concluded, and a final audit report was issuedby FERC in January 2012. Although the audit by FERC did not have an adverse impact on our business, anysimilar audit or investigation could result in a material adjustment to our historical financial statements and mayhave a material adverse effect on our results of operations and financial condition. As part of any regulatory auditor investigation, FERC or any other governmental or regulatory entity may review our performance under ourutility contracts and open market bidding programs, cost structures, and compliance with applicable laws,regulations and standards. If an audit uncovers improper or illegal activities, or if we are the subject of aregulatory investigation by FERC or any other regulatory agency that uncovers improper or illegal activities, wemay be subject to civil and criminal penalties and administrative sanctions, in addition to any negative publicityassociated with any such penalties or sanctions, which could have a material adverse effect on our results ofoperations and financial condition.
Our business is subject to government regulation and may become subject to modified or new governmentregulation, which may negatively impact our ability to sell and market our energy management applications,services and products.
While the electric power markets in which we operate are regulated, most of our business is not directlysubject to the regulatory framework applicable to the generation and transmission of electricity. However, wemay become directly subject to the regulation of FERC to the extent we are deemed to own, operate, or control
24

generation used to make wholesale sales of power or provide ancillary services such as exporting power to theelectric power grid as a short-term reserve resource. In addition, in an order issued in January 2010, FERCclarified that when a demand response resource is used to provide ancillary services that involve a sale of electricenergy or capacity for resale, or export power onto the electric power grid, such a transaction may be subject todirect regulation by FERC. Although we do not expect FERC’s determination that it has jurisdiction over suchactivity to have a material adverse effect on our consolidated financial condition, results of operations or cashflows, we may become subject to other new or modified government regulations that could have a materialadverse effect on our results of operations and financial condition.
The installation of devices or the activation of electric generators used in providing our energy managementapplications, services and products may be subject to governmental oversight and regulation under state and localordinances relating to building codes, public safety regulations pertaining to electrical connections, securityprotocols, and local and state licensing requirements. In a relatively few instances, we have agreed to own andoperate a back-up generator at a C&I customer site for a period of time and to activate the generator whencapacity is called for dispatch so that the C&I customer can reduce its consumption of electricity from theelectric power grid. These generators are ineligible to participate in demand response programs in certainregions, and in others they may become ineligible to participate in the future or may be compensated less forsuch participation, thereby reducing our revenues and adversely affecting our financial condition. In addition,certain of our utility contracts and expansion of existing utility contracts are subject to approval by federal, state,provincial or local regulatory agencies. There can be no assurance that such approvals will be obtained or beissued on a timely basis, if at all.
Additionally, federal, state, provincial or local governmental entities may seek to change existingregulations, impose additional regulations or change their interpretation of the applicability of existingregulations. Any modified or new government regulation applicable to our current or future energy managementapplications, services and products, whether at the federal, state, provincial or local level, may negatively impactthe installation, servicing and marketing of, and increase our costs and the price related to, our energymanagement applications, services and products.
We expect to continue to expand our sales and marketing, operations, and research and developmentcapabilities, as well as our financial and reporting systems, and as a result we may encounter difficulties inmanaging our growth, which could disrupt our operations.
We expect to experience continued growth in the number of our employees and significant growth in thescope of our operations. To manage our anticipated future growth, we must continue to implement and improveour managerial, operational, financial and reporting systems, improve our internal controls and procedures,expand our facilities, and continue to recruit and train additional qualified personnel. All of these measures willrequire significant expenditures and will demand the attention of management. Due to our limited resources, wemay not be able to effectively manage the expansion of our operations, implement sufficient internal controls andprocedures, or recruit and adequately train additional qualified personnel. The physical expansion of ouroperations may lead to significant costs and may divert our management and business development resources.Any inability to manage growth could delay the execution of our business plans or disrupt our operations.
We allocate our operations, sales and marketing, research and development, general and administrative, andfinancial resources based on our business plan, which includes assumptions about current and future utilitycontracts and open market programs with grid operator and utility customers, current and future contracts withC&I customers, variable prices in open market programs for demand response capacity, the development ofancillary services markets which enable demand response as a revenue generating resource and a variety of otherfactors relating to electricity markets, and the resulting demand for our energy management applications, servicesand products. However, these factors are uncertain. If our assumptions regarding these factors prove to beincorrect or if alternatives to those offered by our energy management applications, services and products gainfurther acceptance, then actual demand for our energy management applications, services and products could besignificantly less than the demand we anticipate and we may not be able to sustain our revenue growth or returnto profitability in future periods.
25

We may require significant additional capital to pursue our growth strategy, but we may not be able to obtainadditional financing on acceptable terms or at all.
The growth of our business will depend on substantial amounts of additional capital for posting financialassurances in order to enter into utility contracts and open market bidding programs with electric power gridoperators and utilities, and marketing and product development of our energy management applications, servicesand products. Our capital requirements will depend on many factors, including the rate of our revenue and salesgrowth, our introduction of new energy management applications, services and products and enhancements toour existing energy management applications, services and products, and our expansion of sales and marketingand product development activities. In addition, we may consider strategic acquisitions of complementarybusinesses or technologies to grow our business, such as our acquisitions of Global Energy, M2M and ouracquisition of Energy Response in July 2011, which could require significant capital and could increase ourcapital expenditures related to future operation of the acquired business or technology. Because of our historicallosses, we do not fit traditional credit lending criteria. Moreover, the financial turmoil affecting the bankingsystem and financial markets in recent years has resulted in a reduction in the availability of credit in the creditmarkets, which could adversely affect our ability to obtain additional funding. We may not be able to obtainloans or additional capital on acceptable terms or at all.
If we lose key personnel upon whom we are dependent, or if we fail to attract and retain qualified personnel,we may not be able to manage our operations and meet our strategic objectives.
Our continued success depends upon the continued availability, contributions, vision, skills, experience andeffort of our senior management, sales and marketing, research and development, and operations teams. We donot maintain “key person” insurance on any of our employees. We have entered into employment agreementswith certain members of our senior management team, but none of these agreements guarantees the services ofthe individual for a specified period of time. All of the employment arrangements with our key personnel,including the members of our senior management team, provide that employment is at-will and may beterminated by the employee at any time and without notice. The loss of the services of any of our key personnelmight impede our operations or the achievement of our strategic and financial objectives. We rely on ourresearch and development team to research, design and develop new and enhanced energy managementapplications, services and products. We rely on our operations team to install, test, deliver and manage ourenergy management applications, services and products. We rely on our sales and marketing team to sell ourenergy management applications, services and products to our customers, build our brand and promote ourcompany. The loss or interruption of the service of members of our senior management, sales and marketing,research and development, or operations teams, or our inability to attract or retain other qualified personnel oradvisors could have a material adverse effect on our business, financial condition and results of operations andcould significantly reduce our ability to manage our operations and implement our strategy.
An inability to protect our intellectual property could negatively affect our business and results of operations.
Our ability to compete effectively depends in part upon the maintenance and protection of the intellectualproperty related to our energy management applications, services and products. We hold numerous trademarksand copyrights. Patent protection is unavailable for certain aspects of the technology and operational processesthat are important to our business. Any patent held by us or to be issued to us, or any of our pending patentapplications, could be challenged, invalidated, unenforceable or circumvented. Moreover, some of ourtrademarks which are not in use may become available to others. To date, we have relied principally on patent,copyright, trademark and trade secrecy laws, as well as confidentiality and proprietary information agreementsand licensing arrangements, to establish and protect our intellectual property. However, we have not obtainedconfidentiality and proprietary information agreements from all of our customers and vendors, and although wehave entered into confidentiality and proprietary information agreements with all of our employees, we cannot becertain that these agreements will be honored. Some of our confidentiality and proprietary informationagreements are not in writing, and some customers are subject to laws and regulations that require them todisclose information that we would otherwise seek to keep confidential. Policing unauthorized use of ourintellectual property is difficult and expensive, as is enforcing our rights against unauthorized use. The steps that
26

we have taken or may take may not prevent misappropriation of the intellectual property on which we rely. Inaddition, effective protection may be unavailable or limited in jurisdictions outside the United States, as theintellectual property laws of foreign countries sometimes offer less protection or have onerous filingrequirements. From time to time, third parties may infringe our intellectual property rights. Litigation may benecessary to enforce or protect our rights or to determine the validity and scope of the rights of others. Anylitigation could be unsuccessful, cause us to incur substantial costs, divert resources away from our dailyoperations and result in the impairment of our intellectual property. Failure to adequately enforce our rights couldcause us to lose rights in our intellectual property and may negatively affect our business.
We may be subject to damaging and disruptive intellectual property litigation related to allegations that ourenergy management applications, services and products infringe on intellectual property held by others, whichcould result in the loss of use of those applications, services and products.
Third-party patent applications and patents may relate to our energy management applications, services andproducts. As a result, third-parties may in the future make infringement and other allegations that could subjectus to intellectual property litigation relating to our energy management applications, services and products, whichlitigation could be time-consuming and expensive, divert attention and resources away from our daily operations,impede or prevent delivery of our energy management applications, services and products, and require us to paysignificant royalties, licensing fees and damages. In addition, parties making infringement and other claims maybe able to obtain injunctive or other equitable relief that could effectively block our ability to provide our energymanagement applications, services and products and could cause us to pay substantial damages. In the event of asuccessful claim of infringement, we may need to obtain one or more licenses from third parties, which may notbe available at a reasonable cost, or at all.
If our information technology systems fail to adequately gather, assess and protect data used in providing ourenergy management applications, services and products, or if we experience an interruption in their operation,our business, financial condition and results of operations could be adversely affected.
The efficient operation of our business is dependent on our information technology systems. We rely on ourinformation technology systems to effectively control the devices which enable our energy managementapplications, services and products, gather and assess data used in providing our energy managementapplications, services and products, manage relationships with our customers, and maintain our research anddevelopment data. The failure of our information technology systems to perform as we anticipate could disruptour business and product development and make us unable, or severely limit our ability, to respond to demandresponse events. In addition, our information technology systems are vulnerable to damage or interruption from:
• earthquake, fire, flood and other natural disasters;
• terrorist attacks and attacks by computer viruses or hackers;
• power loss; and
• computer systems, Internet, telecommunications or data network failure.
Any interruption in the operation of our information technology systems could result in decreased revenuesunder our contracts and commitments, reduced profit margins on revenues where fixed payments are due to ourC&I customers, reductions in our demonstrated capacity levels going forward, customer dissatisfaction andlawsuits and could subject us to penalties, any of which could have a material adverse effect on our business,financial condition and results of operations.
Any internal or external security breaches involving our energy management applications, services and products,and even the perception of security risks involving our energy management applications, services and productsor the transmission of data over the Internet, whether or not valid, could harm our reputation and inhibit marketacceptance of our energy management applications, services and products and cause us to lose customers.
We use our energy management applications, services and products to compile and analyze sensitive orconfidential information related to our customers. In addition, some of our energy management applications,
27

services and products allow us to remotely control equipment at C&I customer sites. Our energy managementapplications, services and products rely on the secure transmission of proprietary data over the Internet for someof this functionality. Well-publicized compromises of Internet security, or cyberattacks, could have the effect ofsubstantially reducing confidence in the Internet as a medium of data transmission. The occurrence or perceptionof security breaches in our energy management applications, services and products or our customers’ concernsabout Internet security or the security of our energy management applications, services and products, whether ornot they are warranted, could have a material adverse effect on our business, harm our reputation, inhibit marketacceptance of our energy management applications, services and products and cause us to lose customers, any ofwhich could have a material adverse effect on our financial condition and results of operations.
We may come into contact with sensitive consumer information or data when we perform operational,installation or maintenance functions for our customers. Even the perception that we have improperly handledsensitive, confidential information could have a negative effect on our business. If, in handling this information,we fail to comply with privacy or security laws, we could incur civil liability to government agencies, customersand individuals whose privacy is compromised. In addition, third parties may attempt to breach our security orinappropriately use our energy management applications, services and products, particularly as we grow ourbusiness, through computer viruses, electronic break-ins and other disruptions. We may also face a securitybreach or electronic break-in by one of our employees or former employees. If a breach is successful,confidential information may be improperly obtained, and we may be subject to lawsuits and other liabilities.
Global economic and credit market conditions, and any associated impact on spending by electric power gridoperators and utilities or on the continued operations of our C&I customers, could have a material adverseeffect on our business, operating results, and financial condition.
Volatility and disruption in the global capital and credit markets in recent years have led to a significantreduction in the availability of business credit, decreased liquidity, a contraction of consumer credit, businessfailures, higher unemployment, and declines in consumer confidence and spending in the United States andinternationally. If global economic and financial market conditions deteriorate or remain weak for an extendedperiod of time, numerous economic and financial factors could have a material adverse effect on our business,operating results, and financial condition, including:
• decreased spending by electric power grid operators or utilities, or by end-users of electricity, may resultin reduced demand for our energy management applications, services and products;
• consumer demand for electricity may be reduced, which could result in lower prices for both demand-sideand supply-side capacity pursuant to utility contracts and in open market programs with electric powergrid operators and utilities;
• if C&I customers in our demand response network experience financial difficulty, some may cease orreduce business operations, or reduce their electricity usage, all of which could reduce the number of MWof demand response capacity under our management;
• we may be unable to find suitable investments that are safe, liquid, and provide a reasonable return, whichcould result in lower interest income or longer investment horizons, and disruptions to capital markets orthe banking system may also impair the value of investments or bank deposits we currently consider safeor liquid;
• if our C&I customers to whom we provide our EfficiencySMART, SupplySMART or CarbonSMARTapplications and services experience financial difficulty, it could result in their inability to timely meettheir payment obligations to us, extended payment terms, higher accounts receivable, reduced cash flows,greater expense associated with collection efforts, and an increase in charges for uncollectablereceivables; and
• due to stricter lending standards, C&I customers to whom we offer our SupplySMART application andservices may be unable to obtain adequate credit ratings acceptable to electricity suppliers, resulting inincreased costs, which might make our SupplySMART application and services less attractive or result intheir inability to contract with us for SupplySMART.
28

Uncertainty about current global economic conditions could also continue to increase the volatility of ourstock price.
Electric power industry sales cycles can be lengthy and unpredictable and require significant employee timeand financial resources with no assurances that we will realize revenues.
Sales cycles with electric power grid operator and utility customers are generally long and unpredictable. Theelectric power grid operators and utilities that are our potential customers generally have extended budgeting,procurement and regulatory approval processes. They also tend to be risk averse and tend to follow industry trendsrather than be the first to purchase new products or services, which can extend the lead time for or preventacceptance of new products or services such as our energy management applications, services and products.Accordingly, our potential electric power grid operator and utility customers may take longer to reach a decision topurchase services. This extended sales process requires the dedication of significant time by our personnel and ouruse of significant financial resources, with no certainty of success or recovery of our related expenses. It is notunusual for an electric power grid operator or utility customer to go through the entire sales process and not acceptany proposal or quote. Long and unpredictable sales cycles with electric power grid operator and utility customerscould have a material adverse effect on our business, financial condition and results of operations.
We are exposed to potential risks and will continue to incur significant costs as a result of the internal controltesting and evaluation process mandated by Section 404 of the Sarbanes-Oxley Act of 2002.
We assessed the effectiveness of our internal control over financial reporting as of December 31, 2011 andassessed all deficiencies on both an individual basis and in combination to determine if, when aggregated, theyconstitute a material weakness. As a result of this evaluation, no material weaknesses were identified.
We expect to continue to incur significant costs, including increased accounting fees and increased staffinglevels, in order to maintain compliance with Section 404 of the Sarbanes-Oxley Act. We continue to monitorcontrols for any weaknesses or deficiencies. No evaluation can provide complete assurance that our internalcontrols will detect or uncover all failures of persons within the company to disclose material informationotherwise required to be reported. The effectiveness of our controls and procedures could also be limited bysimple errors or faulty judgments. In addition, as we continue to expand globally, the challenges involved inimplementing appropriate internal controls will increase and will require that we continue to improve our internalcontrols over financial reporting.
In the future, if we fail to complete the Sarbanes-Oxley 404 evaluation in a timely manner, or if ourindependent registered public accounting firm cannot attest in a timely manner to our evaluation, we could besubject to regulatory scrutiny and a loss of public confidence in our internal controls, which could adverselyimpact the market price of our common stock. We or our independent registered public accounting firm mayidentify material weaknesses in internal controls over financial reporting, which also may result in a loss ofpublic confidence in our internal controls and adversely impact the market price of our common stock. Inaddition, any failure to implement required, new or improved controls, or difficulties encountered in theirimplementation, could harm our operating results or cause us to fail to meet our reporting obligations.
Our ability to provide security deposits or letters of credit is limited and could negatively affect our ability tobid on or enter into utility contracts or arrangements with electric power grid operators and utilities.
We are increasingly required to provide security deposits in the form of cash to secure our performanceunder utility contracts or open market bidding programs with our electric power grid operator and utilitycustomers. In addition, some of our electric power grid operator or utility customers require collateral in the formof letters of credit to secure our performance or to fund possible damages or penalty payments resulting from ourfailure to make available capacity at agreed upon levels or any other event of default by us. Our ability to obtainsuch letters of credit primarily depends upon our capitalization, working capital, past performance, managementexpertise and reputation and external factors beyond our control, including the overall capacity of the creditmarket. Events that affect credit markets generally may result in letters of credit becoming more difficult toobtain in the future, or being available only at a significantly greater cost. As of December 31, 2011, we had
29

$31.6 million of letters of credit outstanding under the 2011 credit facility, leaving $43.4 million available underthis facility for additional letters of credit. Furthermore, if it is determined that we are in default of our covenantsunder the 2011 credit facility, then any amounts outstanding under the 2011 credit facility would becomeimmediately due and payable and we would be required to collateralize with cash any outstanding letters ofcredit up to 105% of the amounts outstanding.
We may be required, from time to time, to seek alternative sources of security deposits or letters of credit,which may be expensive and difficult to obtain, if available at all. Our inability to obtain letters of credit and, as aresult, to bid or enter into utility contracts or arrangements with electric power grid operators or utilities, couldhave a material adverse effect on our future revenues and business prospects. In addition, in the event that wedefault under our utility contracts or open market bidding programs with our electric power grid operator andutility customers pursuant to which we have posted collateral, we may lose a portion or all of such collateral,which could have a material adverse effect on our financial condition and results of operations.
Our ability to use our net operating loss carryforwards may be subject to limitation.
Generally, a change of more than 50% in the ownership of a company’s stock, by value, over a three-yearperiod constitutes an ownership change for United States federal income tax purposes. An ownership change maylimit a company’s ability to use its net operating loss carryforwards attributable to the period prior to such change.The number of shares of our common stock that we issued in our initial public offering, or IPO, and follow-onpublic offerings, together with any subsequent shares of stock we issue, may be sufficient, taking into account prioror future shifts in our ownership over a three-year period, to cause us to undergo an ownership change. As a result,as we earn net taxable income, our ability to use our pre-ownership change net operating loss carryforwards tooffset United States federal taxable income may become subject to limitations, which could potentially result inincreased future tax liability for us. To date, although we have been able to utilize our net operating losscarryforwards to offset the maximum amount of taxable income allowed by the various tax jurisdictions in whichwe operate, we may not be able to utilize some or all of these net operating losses in the future.
If the software systems we use in providing our energy management applications, services and products or themanual implementation of such systems produce inaccurate information or is incompatible with the systemsused by our customers, it could preclude us from providing our energy management applications, services andproducts, which could lead to a loss of revenues and trigger penalty payments.
Our software is complex and, accordingly, may contain undetected errors or failures when introduced orsubsequently modified. Software defects or inaccurate data may cause incorrect recording, reporting or display ofinformation about the level of demand reduction at a C&I customer site, which could cause us to fail to meet ourcommitments to have capacity available or could result in an overpayment or underpayment to us and our C&Icustomers by our electric power grid operator and utility customer. Any such failures could also cause us to besubject to penalty payments to our electric power grid operator and utility customers, cause a reduction in ourrevenue in the period that any adjustment is identified and result in reductions in capacity payments under utilitycontracts and open market bidding programs in subsequent periods. In addition, such defects and inaccurate datamay prevent us from successfully providing our portfolio of additional energy management applications, servicesand products, which would result in lost revenues. Software defects or inaccurate data may lead to customerdissatisfaction and our customers may seek to hold us liable for any damages incurred. As a result, we could losecustomers, our reputation could be harmed and our financial condition and results of operations could bematerially adversely affected.
We currently serve a C&I customer base that uses a wide variety of constantly changing hardware, softwareapplications and operating systems. Building control, process control and metering systems frequently reside onnon-standard operating systems. Our energy management applications, services and products need to interfacewith these non-standard systems in order to gather and assess data and to implement changes in electricityconsumption. Our business depends on the following factors, among others:
• our ability to integrate our technology with new and existing hardware and software systems, includingmetering, building control, process control, and distributed generation systems;
30

• our ability to anticipate and support new standards, especially Internet-based standards and buildingcontrol and metering system protocol languages; and
• our ability to integrate additional software modules under development with our existing technology andoperational processes.
If we are unable to adequately address any of these factors, our results of operations and prospects forgrowth could be materially adversely effected.
We may face certain product liability or warranty claims if we disrupt our customers’ networks orapplications.
For some of our current and planned applications, our software and hardware is integrated with our C&Icustomers’ networks and software applications. The integration of our software and hardware may entail the riskof product liability or warranty claims based on disruption or security breaches to these networks or applications.In addition, the failure of our software and hardware to perform to customer expectations could give rise towarranty claims against us. Any of these claims, even if without merit, could result in costly litigation or divertmanagement’s attention and resources. Although we carry general liability insurance, our current insurancecoverage could be insufficient to protect us from all liability that may be imposed under these types of claims. Amaterial product liability claim may seriously harm our results of operations.
Fluctuations in the exchange rates of foreign currencies in which we conduct our business, in relation to theU.S. dollar, could harm our business and prospects.
We maintain sales and service offices outside the United States. The expenses of our international officesare denominated in local currencies. In addition, our foreign sales may be denominated in local currencies.Fluctuations in foreign currency exchange rates could affect our revenues, cost of revenues and profit marginsand could result in exchange losses. In addition, currency devaluation can result in a loss if we hold deposits ofthat currency. In the last few years we have not hedged foreign currency exposures, but we may in the futurehedge foreign currency denominated sales. There is a risk that any hedging activities will not be successful inmitigating our foreign exchange risk exposure and may adversely impact our financial condition and results ofoperations.
An adverse change in the projected cash flows from our acquired businesses or the business climate in whichthey operate, including the continuation of the current financial and economic turmoil, could require us toincur an impairment charge, which would have an adverse impact on our operating results.
We periodically review the carrying value of the goodwill and other long-lived assets reflected in ourfinancial statements to determine if any adverse conditions exist or a change in circumstances has occurred thatwould indicate impairment of the value of these assets. Conditions that would indicate impairment andnecessitate a revaluation of these assets include, but are not limited to, a significant adverse change in thebusiness climate or the legal or regulatory environment within which we operate. If the carrying value of an assetis determined to be impaired we will write-down the carrying value of the intangible asset to its fair value in theperiod identified. We generally calculate fair value as the present value of estimated future cash flows to begenerated by the asset using a risk-adjusted discount rate. As of December 31, 2011, we had approximately$111.7 million of goodwill and definite-lived intangible assets. As of November 30, 2011, which is our annualimpairment test date, the fair value of our reporting units exceeded the book value of their corresponding netassets and as such, there was no indication of a goodwill impairment. In addition, as of December 31, 2011, wehad no indefinite-lived intangible assets. Our market capitalization was greater than the book value of our netassets as of December 31, 2011. However, we have experienced a decline in the price of our publicly-tradedcommon stock and related market capitalization such that our market capitalization has declined slightly belowthe book value of our net assets subsequent to December 31, 2011. We will continue to monitor our marketcapitalization compared to the book value of our net assets. It is possible that the continuation of the currentglobal financial and economic turmoil could negatively affect our anticipated cash flows, or the discount rate that
31

is applied to valuing those cash flows, which could require an interim impairment test of goodwill. Anyimpairment test could result in a material impairment charge that would have an adverse impact on our financialcondition and results of operations.
Risks Related to Our Common Stock
We expect our quarterly revenues and operating results to fluctuate. If we fail in future periods to meet ourpublicly announced financial guidance or the expectations of market analysts or investors, the market price ofour common stock could decline substantially.
Our quarterly revenues and operating results have fluctuated in the past and may vary from quarter toquarter in the future. Accordingly, we believe that period-to-period comparisons of our results of operations maybe misleading. The results of one quarter should not be used as an indication of future performance. We providepublic guidance on our expected results of operations for future periods. This guidance is comprised of forward-looking statements subject to risks and uncertainties, including the risks and uncertainties described in thisAnnual Report on Form 10-K for the fiscal year ended December 31, 2011 and in our other public filings andpublic statements, and is based necessarily on assumptions we make at the time we provide such guidance. Ourrevenues and operating results may fail to meet our previously stated financial guidance or the expectations ofsecurities analysts or investors in some quarter or quarters. Our failure to meet such expectations or our financialguidance could cause the market price of our common stock to decline substantially.
Our quarterly revenues and operating results may vary depending on a number of factors, including:
• demand for and acceptance of our energy management applications, services and products;
• the seasonality of our demand response business in certain of the markets in which we operate, whererevenues recognized under certain utility contracts and pursuant to certain open market bidding programscan be higher or concentrated in particular seasons and months;
• changes in open market bidding program rules and reductions in pricing for demand response capacity;
• delays in the implementation and delivery of our energy management applications, services and products,which may impact the timing of our recognition of revenues;
• delays or reductions in spending for energy management applications, services and products by ourelectric power grid operator or utility customers and potential customers;
• the long lead time associated with securing new customer contracts;
• the structure of any forward capacity market in which we participate, which may impact the timing of ourrecognition of revenues related to that market;
• the mix of our revenues during any period, particularly on a regional basis, since local fees recognized asrevenues for demand response capacity tend to vary according to the level of available capacity in givenregions;
• the termination or expiration of existing contracts with electric power grid operator, utility and C&Icustomers;
• the potential interruptions of our customers’ operations;
• development of new relationships and maintenance and enhancement of existing relationships withcustomers and strategic partners;
• temporary capacity programs that could be implemented by electric power grid operators and utilities toaddress short-term capacity deficiencies;
• the imposition of penalties or the reversal of deferred revenue due to our failure to meet a capacitycommitment;
• flaws in the design or the elimination or modification of any demand response program in which weparticipate;
32

• global economic and credit market conditions; and
• increased expenditures for sales and marketing, software development and other corporate activities.
Our stock price has been and is likely to continue to be volatile and the market price of our common stock mayfluctuate substantially.
Prior to our IPO, there was not a public market for our common stock. There is a limited history on which togauge the volatility of our stock price; however, since our common stock began trading on The NASDAQ GlobalMarket, or NASDAQ, on May 18, 2007 through December 31, 2011, our stock price has fluctuated from a low of$4.80 to a high of $50.50. During the year ended December 31, 2011, our stock price fluctuated from a low of$8.00 to a high of $26.57. Furthermore, the stock market has continued to experience significant volatility. Thevolatility of stocks for companies in the energy and technology industry often does not relate to the operatingperformance of the companies represented by the stock. Some of the factors that may cause the market price ofour common stock to fluctuate include:
• demand for and acceptance of our energy management applications, services and products;
• our ability to develop new relationships and maintain and enhance existing relationships with customersand strategic partners;
• changes in open market bidding program rules and reductions in pricing for demand response capacity;
• the termination or expiration of existing contracts with electric power grid operator, utility and C&Icustomers;
• general market conditions and overall fluctuations in equity markets in the United States;
• flaws in the design or the elimination or modification of any demand response program in which weparticipate;
• introduction of technological innovations or new energy management applications or services by us or ourcompetitors;
• actual or anticipated variations in quarterly revenues and operating results;
• the financial guidance we may provide to the public, any changes in such guidance or our failure to meetsuch guidance;
• changes in estimates or recommendations by securities analysts that cover our common stock;
• delays in the implementation and delivery of our energy management applications, services and products,which may impact the timing of our recognition of revenues;
• litigation or regulatory enforcement actions;
• changes in the regulations affecting our industry in the United States and internationally;
• the way in which we recognize revenues and the timing associated with our recognition of revenues;
• developments or disputes concerning patents or other proprietary rights;
• period-to-period fluctuations in our financial results;
• the potential interruptions of our customers’ operations;
• the seasonality of our demand response business in certain of the markets in which we operate;
• failure to secure adequate capital to fund our operations, or the future sale or issuance of equity securitiesat prices below fair market price or in general; and
• economic and other external factors or other disasters or crises.
33

These and other external factors may cause the market price and demand for our common stock to fluctuatesubstantially, which may limit or prevent investors from readily selling their shares of common stock and mayotherwise negatively affect the liquidity of our common stock. In addition, in the past, when the market price of astock has been volatile, holders of that stock have instituted securities class action litigation against the companythat issued the stock. Our stock price has been particularly volatile recently and may continue to be volatile in thenear term and we could incur substantial costs defending any lawsuit brought against us by any of ourstockholders. Such a lawsuit could also divert the time and attention of our management.
We do not intend to pay dividends on our common stock.
We have not declared or paid any cash dividends on our common stock to date, and we do not anticipatepaying any dividends on our common stock in the foreseeable future. We currently intend to retain all availablefunds and any future earnings for use in the development, operation and growth of our business. In addition, the2011 credit facility prohibits us from paying dividends and future loan agreements may also prohibit the paymentof dividends. Any future determination relating to our dividend policy will be at the discretion of our board ofdirectors and will depend on our results of operations, financial condition, capital requirements, businessopportunities, contractual restrictions and other factors deemed relevant. To the extent we do not pay dividendson our common stock, investors must look solely to stock appreciation for a return on their investment in ourcommon stock.
Provisions of our certificate of incorporation, bylaws and Delaware law, and of some of our employmentarrangements, may make an acquisition of us or a change in our management more difficult and coulddiscourage acquisition bids or merger proposals, which may adversely affect the market price of our commonstock.
Certain provisions of our certificate of incorporation and bylaws could discourage, delay or prevent amerger, acquisition or other change of control that stockholders may consider favorable, including transactions inwhich we may have otherwise received a premium on our shares of common stock. These provisions also couldlimit the price that investors might be willing to pay in the future for shares of our common stock, therebydepressing the market price of our common stock. Stockholders who wish to participate in these transactions maynot have the opportunity to do so. Furthermore, these provisions could prevent or frustrate attempts by ourstockholders to replace or remove our management. These provisions:
• allow the authorized number of directors to be changed only by resolution of our board of directors;
• require that vacancies on the board of directors, including newly created directorships, be filled only by amajority vote of directors then in office;
• establish a classified board of directors, providing that not all members of the board be elected at onetime;
• authorize our board of directors to issue, without stockholder approval, blank check preferred stock that, ifissued, could operate as a “poison pill” to dilute the stock ownership of a potential hostile acquirer toprevent an acquisition that is not approved by our board of directors;
• require that stockholder actions must be effected at a duly called stockholder meeting and prohibitstockholder action by written consent;
• prohibit cumulative voting in the election of directors, which would otherwise allow holders of less than amajority of stock to elect some directors;
• establish advance notice requirements for stockholder nominations to our board of directors or forstockholder proposals that can be acted on at stockholder meetings;
• limit who may call stockholder meetings; and
• require the approval of the holders of 75% of the outstanding shares of our capital stock entitled to vote inorder to amend certain provisions of our certificate of incorporation and bylaws.
34

Some of our employment arrangements and equity agreements provide for severance payments andaccelerated vesting of benefits, including accelerated vesting of equity awards, upon a change of control. Theseprovisions may discourage or prevent a change of control. In addition, because we are incorporated in Delaware,we are governed by the provisions of Section 203 of the Delaware General Corporation Law, which may, unlesscertain criteria are met, prohibit large stockholders, in particular those owning 15% or more of our outstandingvoting stock, from merging or combining with us for a proscribed period of time.
If securities or industry analysts do not publish research or publish inaccurate or unfavorable research aboutour business, our stock price and trading volume could decline.
The trading market for our common stock will continue to depend in part on the research and reports thatsecurities or industry analysts publish about us or our business. If these analysts do not continue to provideadequate research coverage or if one or more of the analysts who covers us downgrades our stock or publishesinaccurate or unfavorable research about our business, our stock price would likely decline. If one or more ofthese analysts ceases coverage of our company or fails to publish reports on us regularly, demand for our stockcould decrease, which could cause our stock price and trading volume to decline.
The requirements of being a public company, including compliance with the reporting requirements of theExchange Act and The NASDAQ Stock Market LLC, require significant resources, increase our costs anddistract our management, and we may be unable to comply with these requirements in a timely or cost-effective manner.
As a public company with equity securities listed on NASDAQ, we must comply with statutes andregulations of the SEC and the requirements of NASDAQ. Complying with these statutes, regulations andrequirements occupies a significant amount of the time of our board of directors and management andsignificantly increases our costs and expenses. In addition, as a public company we incur substantial costs toobtain director and officer liability insurance policies. These factors could make it more difficult for us to attractand retain qualified members of our board of directors, particularly to serve on our audit committee.
Item 1B. Unresolved Staff Comments
Not applicable.
Item 2. Properties
Our corporate headquarters and principal office is located in Boston, Massachusetts, where we leaseapproximately 61,032 square feet under a lease agreement expiring in June 2014. We also lease a number ofoffices under various other lease agreements in the United States, Canada, the United Kingdom, Australia andNew Zealand. We do not own any real property. We believe that our leased facilities will be adequate to meet ourneeds for the foreseeable future.
Item 3. Legal Proceedings
We are subject to legal proceedings, claims and litigation arising in the ordinary course of business. We donot expect the ultimate costs to resolve these matters to have a material adverse effect on our consolidatedfinancial condition, results of operations or cash flows.
Item 4. Mine Safety Disclosures
Not applicable.
35

PART II
Item 5. Market for Registrant’s Common Equity, Related Stockholder Matters and Issuer Purchases ofEquity Securities
Price Range of Our Common Stock
Our common stock is currently traded on The NASDAQ Global Market under the symbol “ENOC”. Thefollowing table sets forth the high and low sales prices per share of our common stock as reported on TheNASDAQ Global Market for the periods indicated.
Fiscal 2011 High Low
First Quarter . . . . . . . . . . . . . . . . . . . . . . . . . . . . . . . . . . . . . . . . . . . . . . . . . . . . . . . $26.57 $16.63
Second Quarter . . . . . . . . . . . . . . . . . . . . . . . . . . . . . . . . . . . . . . . . . . . . . . . . . . . . . $22.38 $15.30
Third Quarter . . . . . . . . . . . . . . . . . . . . . . . . . . . . . . . . . . . . . . . . . . . . . . . . . . . . . . . $17.72 $ 8.39
Fourth Quarter . . . . . . . . . . . . . . . . . . . . . . . . . . . . . . . . . . . . . . . . . . . . . . . . . . . . . . $12.24 $ 8.00
Fiscal 2010 High Low
First Quarter . . . . . . . . . . . . . . . . . . . . . . . . . . . . . . . . . . . . . . . . . . . . . . . . . . . . . . . $37.00 $25.93
Second Quarter . . . . . . . . . . . . . . . . . . . . . . . . . . . . . . . . . . . . . . . . . . . . . . . . . . . . . $32.41 $24.75
Third Quarter . . . . . . . . . . . . . . . . . . . . . . . . . . . . . . . . . . . . . . . . . . . . . . . . . . . . . . . $36.75 $29.62
Fourth Quarter . . . . . . . . . . . . . . . . . . . . . . . . . . . . . . . . . . . . . . . . . . . . . . . . . . . . . . $31.79 $23.00
Stockholders
As of March 9, 2012, we had approximately 631 stockholders of record. This number does not includestockholders for whom shares are held in a “nominee” or “street” name.
Dividend Policy
We have never paid or declared any cash dividends on our common stock. We currently intend to retain allavailable funds and any future earnings to fund the development and expansion of our business, and we do notanticipate paying any cash dividends in the foreseeable future. Any future determination to pay dividends will beat the discretion of our board of directors and will depend on our financial condition, results of operations, capitalrequirements, and other factors that our board of directors deems relevant. Additionally, the terms of the 2011credit facility preclude us, and the terms of any future debt or credit facility may preclude us, from payingdividends.
Unregistered Sales of Equity Securities
None.
Issuer Purchases of Equity Securities
None.
36

Item 6. Selected Financial Data
Our selected consolidated financial data set forth below is derived from our audited financial statementscontained elsewhere in this Annual Report on Form 10-K. The following selected consolidated financial datashould be read in conjunction with “Management’s Discussion and Analysis of Financial Condition and Resultsof Operations” and our consolidated financial statements and accompanying notes thereto included in Item 7 andAppendix A, respectively, to this Annual Report on Form 10-K.
Year Ended December 31,
2011(1) 2010(1) 2009(1) 2008(1) 2007(1)
(In thousands, except share and per share data)
Selected Balance Sheet Data:Cash and cash equivalents . . . . . . . . . . . . . $ 87,297 $ 153,416 $ 119,739 $ 60,782 $ 70,242Marketable securities . . . . . . . . . . . . . . . . . — — — 2,000 15,500Working capital . . . . . . . . . . . . . . . . . . . . . . 105,839 163,519 124,680 59,137 72,836Total assets . . . . . . . . . . . . . . . . . . . . . . . . . 355,808 325,899 255,022 136,694 155,584Total long-term debt, including current
portion . . . . . . . . . . . . . . . . . . . . . . . . . . . — 37 73 4,563 6,091Total stockholders’ equity . . . . . . . . . . . . . 247,740 226,126 194,975 99,220 122,417Selected Statement of Operations Data:Revenues . . . . . . . . . . . . . . . . . . . . . . . . . . . $ 286,608 $ 280,157 $ 190,675 $ 106,115 $ 60,838Cost of revenues . . . . . . . . . . . . . . . . . . . . . 163,211 159,832 104,215 64,819 38,949
Gross profit . . . . . . . . . . . . . . . . . . . . . . . . . 123,397 120,325 86,460 41,296 21,889Selling and marketing expenses . . . . . . . . . 51,907 44,029(2) 39,502 30,789 18,695General and administrative expenses . . . . . 66,773 54,983(2) 44,407 41,582 25,866Research and development expenses . . . . . 14,254 10,097 7,601 6,123 3,598
Income (loss) from operations . . . . . . . . (9,537) 11,216 (5,050) (37,198) (26,270)Interest and other (expense) income, net . . (2,040) (803) (1,446) 798 2,788
Income (loss) before income taxes . . . . . . . (11,577) 10,413 (6,496) (36,400) (23,482)Provision for income taxes . . . . . . . . . . . . . (1,806) (836) (333) (262) (100)
Net income (loss) . . . . . . . . . . . . . . . . . . . . $ (13,383) $ 9,577 $ (6,829) $ (36,662) $ (23,582)
Net income (loss) per share, basic . . . . . . . $ (0.52) $ 0.39 $ (0.32) $ (1.88) $ (1.80)
Net income (loss) per share, diluted . . . . . . $ (0.52) $ 0.37 $ (0.32) $ (1.88) $ (1.80)
Weighted average number of basicshares . . . . . . . . . . . . . . . . . . . . . . . . . . . 25,799,494 24,611,729 21,466,813 19,505,065 13,106,114
Weighted average number of dilutedshares . . . . . . . . . . . . . . . . . . . . . . . . . . . 25,799,494 26,054,162 21,466,813 19,505,065 13,106,114
(1) Includes the results of operations from the date of acquisition relating to our acquisitions of Energy Responsein July 2011; Global Energy, M2M and an immaterial acquisition in January 2011; SmallFoot LLC, orSmallFoot, and ZOX, LLC, or Zox, in March 2010; Cogent Energy, Inc., or Cogent, in December 2009;eQuilibrium Solutions Corporation, or eQ, in June 2009; South River Consulting, or SRC, in May 2008; andMdenergy, LLC, or MDE, in September 2007. See Note 2 of our accompanying consolidated financialstatements contained in Appendix A to this Annual Report on Form 10-K for a discussion of the acquisitionsthat occurred during 2009, 2010 and 2011.
(2) We have reclassified certain costs in our consolidated statements of operations for the year endedDecember 31, 2010 totaling $1,407, previously included in selling and marketing expenses as general andadministrative expenses to more appropriately reflect the nature of these costs consistent with costs in theyear ended December 31, 2011. These costs commenced in the year ended December 31, 2010 and thereforeno reclassification was required for any periods prior to 2010.
37

Item 7. Management’s Discussion and Analysis of Financial Condition and Results of Operations
You should read the following discussion and analysis of our financial condition and results of operationstogether with our “Selected Financial Data” and consolidated financial statements and accompanying notesthereto included elsewhere in this Annual Report on Form 10-K. In addition to the historical information, thediscussion contains certain forward-looking statements that involve risks and uncertainties. Our actual resultscould differ materially from those expressed or implied by the forward-looking statements due to applications ofour critical accounting policies and factors including, but not limited to, those set forth under the caption “RiskFactors” in Item 1A of Part I of this Annual Report on Form 10-K.
Overview
We are a leading provider of clean and intelligent energy management applications, services and productsfor the smart grid, which include comprehensive demand response, data-driven energy efficiency, energy priceand risk management, and enterprise carbon management applications, services and products. Our energymanagement applications, services and products enable cost effective energy management strategies forcommercial, institutional and industrial end-users of energy, which we refer to as our C&I customers, and ourelectric power grid operator and utility customers by reducing real-time demand for electricity, increasing energyefficiency, improving energy supply transparency, and mitigating carbon emissions.
We believe that we are the largest demand response service provider to C&I customers. As of December 31,2011, we managed over 7,100, megawatts, or MW, of demand response capacity across a C&I customer base ofapproximately 4,900 accounts and 11,400 sites throughout multiple electric power grids. Demand response is analternative to traditional power generation and transmission infrastructure projects that enables electric powergrid operators and utilities to reduce the likelihood of service disruptions, such as brownouts and blackouts,during periods of peak electricity demand, and otherwise manage the electric power grid during short-termimbalances of supply and demand or during periods when energy prices are high. We use our NetworkOperations Center, or NOC, and comprehensive demand response application, DemandSMART, to remotelymanage and reduce electricity consumption across a growing network of C&I customer sites, making demandresponse capacity available to electric power grid operators and utilities on demand while helping C&I customersachieve energy savings, improved financial results and environmental benefits. To date, we have receivedsubstantially all of our revenues from electric power grid operators and utilities, who make recurring payments tous for managing demand response capacity that we share with our C&I customers in exchange for those C&Icustomers reducing their power consumption when called upon.
We build on our position as a leading demand response services provider by using our NOC and energymanagement application platform to deliver a portfolio of additional energy management applications, services andproducts to new and existing C&I, electric power grid operator and utility customers. These additional energymanagement applications and services include our EfficiencySMART, SupplySMART and CarbonSMARTapplications and services, and certain other wireless energy management products. EfficiencySMART is our data-driven energy efficiency suite that includes commissioning and retro-commissioning authority services, energyconsulting and engineering services, a persistent commissioning application and an enterprise energy managementapplication for managing energy across a portfolio of sites. SupplySMART is our energy price and risk managementapplication that provides our C&I customers located in restructured or deregulated markets throughout the UnitedStates with the ability to more effectively manage the energy supplier selection process, including energy supplyproduct procurement and implementation, budget forecasting, and utility bill management. CarbonSMART is ourenterprise carbon management application that supports and manages the measurement, tracking, analysis, reportingand management of greenhouse gas emissions. Our wireless energy management products are designed to ensure thatour C&I customers can connect their equipment remotely and access meter data securely, and include both cellularmodems and an agricultural specific wireless technology solution acquired as part of our acquisition of M2M.
Since inception, our business has grown substantially. We began by providing demand response services inone state in 2003 and expanded to providing our portfolio of energy management applications, services andproducts in several regions throughout the United States, as well as internationally in Australia, Canada,New Zealand and the United Kingdom.
38

Significant Recent Developments
In February 2011, PJM Interconnection, or PJM, a grid operator customer, and Monitoring Analytics, LLC,the PJM market monitor, issued a joint statement concerning settlements in PJM’s capacity market, from whichwe derive a substantial portion of our revenues, for participants using a certain baseline methodology for themeasurement and verification of demand response. We refer to this as the PJM statement. The PJM statement,among other things, asserted that certain market practices in the PJM capacity market were no longer appropriateor acceptable and unilaterally implied that compensation should no longer be determined by actual measuredreductions in a C&I customer’s electrical load, unless the reductions are below that C&I customer’s peak demandfor electricity, or PLC, in the prior year. In March 2011, we filed for and were granted expedited declaratoryrelief with the Federal Energy Regulatory Commission, or FERC, which allowed us to continue to manage ourportfolio of demand response capacity in PJM as we had in the past and receive settlement in accordance with thethen current PJM market rules approved by FERC. However, PJM continued to take steps to modify the marketrules according to the PJM statement, including by filing proposed tariff changes with FERC.
In November 2011, FERC issued an order that addressed the PJM statement and clarified the rules related tothe measurement and verification of demand response resources in the PJM capacity market. We refer to this asthe FERC order. The FERC order, among other things, preserved PJM’s original market rules for the fullcompliance period of the 2011-12 delivery year, while accepting PJM’s proposed market rule changes goingforward, subject to certain conditions, including the requirement that PJM submit a compliance filing with FERCby January 3, 2012 that included the development of an interim mechanism to protect demand responsesuppliers’ reasonable reliance expectations regarding capacity compliance measurement and verification for the2012-13 delivery year through the 2014-15 delivery year and explained how PJM will treat the aggregation ofdemand response resources under its proposal. In addition, the FERC order encouraged further examination ofthe limitations of PLC and consideration of the development of a more dynamic baseline methodology applicableto demand response resources in the future.
In January 2012, PJM responded to the FERC order by making the compliance filing referred to above,which proposed the immediate implementation of PJM’s proposed market rules. We refer to this as the PJMproposal. We subsequently filed a protest requesting that FERC reject the PJM proposal as unjust andunreasonable for failure to meet the conditions set forth in the FERC order to establish an interim settlementmechanism that protects the reasonable reliance expectations of demand response suppliers through the 2014-15delivery year. We also requested that FERC order PJM to keep current settlement practices in place for the2012-13 delivery year and require PJM to propose an alternative mechanism that complies with FERC’sdirectives through the 2014-2015 delivery year. Subsequent to our protest filing, additional filings were made bycertain parties interested in the outcome of this matter. In February 2012, FERC issued an order substantiallyaccepting the PJM proposal, which resulted in the immediate implementation of PJM’s proposed market rulechanges regarding capacity compliance measurement and verification. As a result, our future PJM revenues andprofit margins will be significantly reduced and our future results of operations and financial condition will benegatively impacted. These impacts may be offset by our future growth in MWs in the PJM market.
Revenues and Expense Components
Revenues
We derive recurring revenues from the sale of our energy management applications, services and products.We do not recognize any revenues until persuasive evidence of an arrangement exists, delivery has occurred, thefee is fixed or determinable, and we deem collection to be reasonably assured.
Our revenues from our demand response services primarily consist of capacity and energy payments,including ancillary services payments. We derive revenues from demand response capacity that we makeavailable in open market programs and pursuant to contracts that we enter into with electric power grid operatorsand utilities. In certain markets, we enter into contracts with electric power grid operators and utilities, generallyranging from three to 10 years in duration, to deploy our demand response services. We refer to these contractsas utility contracts.
39

Where we operate in open market programs, our revenues from demand response capacity payments mayvary month-to-month based upon our enrolled capacity and the market payment rate. Where we have a utilitycontract, we receive periodic capacity payments, which may vary monthly or seasonally, based upon enrolledcapacity and predetermined payment rates. Under both open market programs and utility contracts, we receivecapacity payments regardless of whether we are called upon to reduce demand for electricity from the electricpower grid, and we recognize revenue over the applicable delivery period, even where payments are made over adifferent period. We generally demonstrate our capacity either through a demand response event or ameasurement and verification test. This demonstrated capacity is typically used to calculate the continuingperiodic capacity payments to be made to us until the next demand response event or measurement andverification test establishes a new demonstrated capacity amount. In most cases, we also receive an additionalpayment for the amount of energy usage that we actually curtail from the grid during a demand response event.We refer to this as an energy payment.
As program rules may differ for each open market program in which we participate and for each utilitycontract, we assess whether or not we have met the specific service requirements under the program rules andrecognize or defer revenues as necessary. We recognize demand response capacity revenues when we haveprovided verification to the electric power grid operator or utility of our ability to deliver the committed capacityunder the open market program or utility contract. Committed capacity is verified through the results of an actualdemand response event or a measurement and verification test. Once the capacity amount has been verified, therevenues are recognized and future revenues become fixed or determinable and are recognized monthly over theperformance period until the next demand response event or measurement and verification test. In subsequentdemand response events or measurement and verification tests, if our verified capacity is below the previouslyverified amount, the electric power grid operator or utility customer will reduce future payments based on theadjusted verified capacity amounts. Under certain utility contracts and open market program participation rules, ourperformance and related fees are measured and determined over a period of time. If we can reliably estimate ourperformance for the applicable performance period, we will reserve the entire amount of estimated penalties thatwill be incurred, if any, as a result of estimated underperformance prior to the commencement of revenuerecognition. If we are unable to reliably estimate the performance and any related penalties, we defer the recognitionof revenues until the fee is fixed or determinable. Any changes to our original estimates of net revenues arerecognized as a change in accounting estimate in the earliest reporting period that such a change is determined.
We defer incremental direct costs incurred related to the acquisition or origination of a utility contract oropen market program in a transaction that results in the deferral or delay of revenue recognition. As ofDecember 31, 2011 and 2010, the incremental direct costs deferred were approximately $0 and $0.9 million,respectively. These deferred expenses would not have been incurred without our participation in a certain openmarket program and will be expensed in proportion to the related revenue being recognized. During the yearsended December 31, 2011 and 2010 no contract origination costs were deferred. During the year endedDecember 31, 2009, we deferred contract origination costs of $0.9 million. During the year endedDecember 31, 2011, as a result of the termination of a certain contract, the $0.9 million of previously deferredincremental direct costs were expensed. In addition, we capitalize the costs of our production and generationequipment utilized in the delivery of our demand response services and expense this equipment over the lesser ofits useful life or the term of the contractual arrangement. During the year ended December 31, 2011 and 2010, wecapitalized $9.5 million and $8.9 million, respectively, of production and generation equipment costs. We believethat this accounting treatment appropriately matches expenses with the associated revenue.
As of December 31, 2011, we had over 7,100 MW under management in our demand response network,meaning that we had entered into definitive contracts with our C&I customers representing over 7,100 MW ofdemand response capacity. In determining our MW under management in the seasonal demand responseprograms in which we participate, we typically count the maximum demand response capacity for a C&Icustomer site over a trailing twelve-month period as the MW under management for that C&I customer site.However, the trailing period could be longer in certain programs under which significant rule changes haveoccurred or under which we do not have enough obligation to enroll all of our MW in a given program period,but have enough obligation in a future program period to enroll the MW again. We generally begin earning
40

revenues from our MW under management within approximately one month from the date on which we enablethe MW, or the date on which we can reduce the MW from the electricity grid if called upon to do so. The mostsignificant exception is the PJM forward capacity market, which is a market from which we derive a substantialportion of our revenues. Because PJM operates on a June to May program-year basis, a MW that we enable afterJune of each year may not begin earning revenue until June of the following year. This results in a longer averagerevenue recognition lag time in our C&I customer portfolio from the point in time when we consider a MW to beunder management to when we earn revenues from that MW. Certain other markets in which we currentlyparticipate, such as the ISO-NE market, or choose to participate in the future operate or may operate in a mannerthat could create a delay in recognizing revenue from the MW that we enable in those markets. Additionally, notall of our MW under management may be enrolled in a demand response program or may earn revenue in a givenprogram period or year based on the way that we manage our portfolio of demand response capacity.
In the PJM open market program in which we participate, the program year operates on a June to May basisand performance is measured based on the aggregate performance during the months of June through September.As a result, fees received for the month of June could potentially be subject to adjustment or refund based onperformance during the months of July through September. We had historically concluded that we could reliablyestimate the amount of fees potentially subject to adjustment or refund, and recorded a reserve for this amount inthe month of June. As of June 30, 2011, we had recorded an estimated reserve of $9.3 million related to potentialsubsequent performance adjustments. The fees under this program were fixed as of September 30, 2011 and,based on final performance during the three months ended September 30, 2011, we recorded a reduction in theestimated reserve totaling $3.7 million, which resulted in final performance adjustments of $5.6 million. We havere-evaluated our ability to reliably estimate the amount of fees potentially subject to adjustment or refund for theyear ending December 31, 2012, or fiscal 2012, on a prospective basis based on our consideration of our actualperformance during the months of June 2011 through September 2011, as well as additional guidance issued byPJM regarding its interpretation of certain program rules and changes to certain program rules that will impactperformance calculations on a prospective basis. Based on the changes to certain program rules, we haveconcluded that we no longer have the ability to reliably estimate the amount of fees potentially subject toadjustment or refund until the performance period ends on September 30th of each year. Therefore, on aprospective basis, all revenues related to our participation in PJM open market program will be recognized at theend of the performance period, or during the three months ended September 30th of the applicable year. Inaddition, in accordance with our policy to capitalize direct and incremental costs associated with deferredrevenues to the extent that such costs are realizable, we will capitalize the associated cost of our payments to C&Icustomers for the month of June and expense such capitalized costs when the associated deferred revenues arerecognized. We will evaluate the direct and incremental costs for recoverability prior to capitalization.
In February 2012, FERC issued an order substantially accepting the PJM proposal, which resulted in theimmediate implementation of PJM’s proposed market rule changes regarding capacity compliance measurementand verification. As a result, our future PJM revenues and profit margins will be significantly reduced and ourfuture results of operations and financial condition will be negatively impacted. These impacts may be offset byour future growth in MWs in the PJM market.
Revenues generated from open market sales to PJM, a grid operator customer, accounted for 53%, 60% and52%, respectively, of our total revenues for the years ended December 31, 2011, 2010 and 2009. Under certainutility contracts and open market programs, such as PJM’s Emergency Load Response Program, the periodduring which we are required to perform may be shorter than the period over which we receive payments underthat contract or program. In these cases, we record revenue, net of reserves for estimated penalties related topotential delivered capacity shortfalls, over the mandatory performance obligation period, and a portion of therevenues that have been earned is recorded and accrued as unbilled revenue. Our unbilled revenue of$64.1 million from PJM at December 31, 2011 will be billed and collected through June 2012. Our unbilledrevenue of $73.1 million as of December 31, 2010 was collected in full through June 2011.
Revenues generated from open market sales to ISO-NE, a grid operator customer, accounted for 13%, 18%and 29%, respectively, of our total revenues for the years ended December 31, 2011, 2010 and 2009.
41

In addition to demand response revenues, we generally receive either a subscription-based fee, consulting feeor a percentage savings fee for arrangements under which we provide our other energy management applicationsand services, specifically our EfficiencySMART, SupplySMART and CarbonSMART applications and services,and certain other wireless energy management products. Revenues derived from these offerings were $27.5 million,$15.5 million and $6.8 million, respectively, for the years ended December 31, 2011, 2010 and 2009.
Our revenues have historically been higher in our second and third fiscal quarters compared to otherquarters in our fiscal year due to seasonality related to the demand response market.
Cost of Revenues
Cost of revenues for our demand response services consists primarily of amounts owed to our C&Icustomers for their participation in our demand response network and are generally recognized over the sameperformance period as the corresponding revenue. We enter into contracts with our C&I customers under whichwe deliver recurring cash payments to them for the capacity they commit to make available on demand. We alsogenerally make an additional payment when a C&I customer reduces consumption of energy from the electricpower grid during a demand response event. The equipment and installation costs for our devices located at ourC&I customer sites, which monitor energy usage, communicate with C&I customer sites and, in certaininstances, remotely control energy usage to achieve committed capacity are capitalized and depreciated over thelesser of the remaining estimated customer relationship period or the estimated useful life of the equipment, andthis depreciation is reflected in cost of revenues. We also include in cost of revenues our amortization of acquireddeveloped technology, amortization of capitalized internal-use software costs related to our DemandSMARTapplication, the monthly telecommunications and data costs we incur as a result of being connected to C&Icustomer sites, and our internal payroll and related costs allocated to a C&I customer site. Certain costs, such asequipment depreciation and telecommunications and data costs, are fixed and do not vary based on revenuesrecognized. These fixed costs could impact our gross margin trends described elsewhere in this Annual Report onForm 10-K during interim periods. Cost of revenues for our EfficiencySMART, SupplySMART andCarbonSMART applications and services, and certain other wireless energy management products include ouramortization of capitalized internal-use software costs related to those applications, services and products, thirdparty services, equipment costs, equipment depreciation, and the wages and associated benefits that we pay to ourproject managers for the performance of their services.
Gross Profit and Gross Margin
Gross profit consists of our total revenues less our cost of revenues. Our gross profit has been, and will be,affected by many factors, including (a) the demand for our energy management applications, services andproducts, (b) the selling price of our energy management applications, services and products, (c) our cost ofrevenues, (d) the way in which we manage, or are permitted to manage by the relevant electric power gridoperator or utility, our portfolio of demand response capacity, (e) the introduction of new clean and intelligentenergy management applications, services and products, (f) our demand response event performance and (g) ourability to open and enter new markets and regions and expand deeper into markets we already serve. Ouroutcomes in negotiating favorable contracts with our C&I customers, as well as with our electric power gridoperator and utility customers, the effective management of our portfolio of demand response capacity and ourdemand response event performance are the primary determinants of our gross profit and gross margin.
Operating Expenses
Operating expenses consist of selling and marketing, general and administrative, and research anddevelopment expenses. Personnel-related costs are the most significant component of each of these expensecategories. We grew from 484 full-time employees at December 31, 2010 to 599 full-time employees atDecember 31, 2011 substantially as a result of the acquisitions we completed during the year ended December 31,2011. In addition, we incur significant up-front costs associated with the expansion of the number of MW under ourmanagement, which we expect to continue for the foreseeable future. We expect our overall operating expenses toincrease in absolute dollar terms for the foreseeable future and to increase as a percentage of total annual revenues
42

in the near term as we continue to invest in our business and employee base in order to capitalize on emergingopportunities, expand the development of our energy management applications, services and products, and grow ourMW under management. In addition, amortization expense from intangible assets acquired in future acquisitionswill increase our operating expenses in future periods.
Selling and Marketing
Selling and marketing expenses consist primarily of (a) salaries and related personnel costs, including costsassociated with share-based payment awards, related to our sales and marketing organization, (b) commissions,(c) travel, lodging and other out-of-pocket expenses, (d) marketing programs such as trade shows and (e) otherrelated overhead. Commissions are recorded as an expense when earned by the employee. We expect our sellingand marketing expenses to continue to increase in absolute dollar terms for the foreseeable future and to increase asa percentage of total annual revenues in the near term as we further increase the number of our sales professionals.
General and Administrative
General and administrative expenses consist primarily of (a) salaries and related personnel costs, includingcosts associated with share-based payment awards and bonuses, related to our executive, finance, human resource,information technology and operations organizations, (b) facilities expenses, (c) accounting and legal professionalfees, including fees associated with acquisitions, (d) contract termination costs, (e) depreciation and amortizationand (f) other related overhead. We expect general and administrative expenses to continue to increase in absolutedollar terms for the foreseeable future and to increase as a percentage of total annual revenues in the near term as wefurther invest in our infrastructure and employee base to support our continued growth.
Research and Development
Research and development expenses consist primarily of (a) salaries and related personnel costs, includingcosts associated with share-based payment awards, related to our research and development organization,(b) payments to suppliers for design and consulting services, (c) costs relating to the design and development ofnew energy management applications, services and products and enhancement of existing energy managementapplications, services and products, (d) quality assurance and testing and (e) other related overhead. During theyears ended December 31, 2011, 2010 and 2009, we capitalized internal software development costs of $3.2million, $6.8 million and $4.2 million, respectively, and the amount is included as software in property andequipment at December 31, 2011. Included in the amounts above, we capitalized $1.3 million and $1.5 millionduring the years ended December 31, 2010 and 2009, respectively, related to a company-wide enterprise resourceplanning systems implementation project, which was placed into production in June 2011 and is being amortizedover a five-year useful life. During the three months ended December 31, 2011, as a result of our review and ourrealignment of development efforts, we discontinued our efforts to complete the development of a certainin-process research and development indefinite-lived intangible asset related to our March 2010 acquisition ofZox. As a result, we recorded an impairment charge related to this indefinite-lived in-process research anddevelopment intangible asset of $0.5 million and an impairment charge related to the associated definite-livedpatent intangible asset of less than $0.1 million. We expect research and development expenses to increase inabsolute dollar terms for the foreseeable future and to slightly increase as a percentage of total annual revenues inthe near term as we develop new technologies and further invest in our research and development organization.
Stock-Based Compensation
We account for stock-based compensation in accordance with Accounting Standards Codification, or ASC,718, Stock Compensation. As such, all share-based payments to employees, including grants of stock options,restricted stock and restricted stock units, are recognized in the statement of operations based on their fair valuesas of the date of grant. For stock options granted prior to January 1, 2009, the fair value for these options wasestimated at the date of grant using a Black-Scholes option-pricing model, and for stock options granted on orafter January 1, 2009, the fair value of each award is and will be estimated on the date of grant using a lattice
43

valuation model. For the years ended December 31, 2011, 2010 and 2009, we recorded expenses ofapproximately $13.5 million, $15.7 million and $13.1 million, respectively, in connection with share-basedpayment awards to employees and non-employees. With respect to option grants through December 31, 2011, afuture expense of non-vested options of approximately $4.4 million is expected to be recognized over a weightedaverage period of 2.0 years. For non-vested restricted stock and restricted stock units subject to service-basedvesting conditions outstanding as of December 31, 2011, we had $11.2 million of unrecognized stock-basedcompensation expense, which is expected to be recognized over a weighted average period of 2.7 years. Fornon-vested restricted stock subject to performance-based vesting conditions outstanding and that were probableof vesting as of December 31, 2011, we had $2.5 million of unrecognized stock-based compensation expense,which is expected to be recognized over a weighted average period of 2.1 years. For non-vested restricted stocksubject to performance-based vesting conditions outstanding and that were not probable of vesting as ofDecember 31, 2011, we had $3.1 million of unrecognized stock-based compensation expense.
Other Income and Expense, Net
Other income and expense consist primarily of gain or loss on transactions designated in currencies otherthan our or our subsidiaries’ functional currency, interest income earned on cash balances, and othernon-operating income and expense. We historically have invested our cash in money market funds, treasuryfunds, commercial paper, and municipal bonds.
Interest Expense
Interest expense consists of interest on our capital lease obligations, fees associated with the loan andsecurity agreement that we and one of our subsidiaries entered into with SVB in August 2008, which wassubsequently amended and which we refer to as the 2008 credit facility, fees associated with the 2011 creditfacility, and fees associated with issuing letters of credit and other financial assurances.
Consolidated Results of Operations
Year Ended December 31, 2011 Compared to Year Ended December 31, 2010
Revenues
The following table summarizes our revenues for the years ended December 31, 2011 and 2010 (inthousands):
December 31, DollarChange
PercentageChange2011 2010
Revenues:
DemandSMART . . . . . . . . . . . . . . . . . . . . . . . . . . . . $259,150 $264,608 $ (5,458) (2.1)%
EfficiencySMART, SupplySMART,CarbonSMART and Other . . . . . . . . . . . . . . . . . . 27,458 15,549 11,909 76.6%
Total revenues . . . . . . . . . . . . . . . . . . . . . . . . . . . . . . $286,608 $280,157 $ 6,451 2.3%
44

For the year ended December 31, 2011, our demand response revenues decreased by $5.5 million, or 2%, ascompared to the year ended December 31, 2010. The decrease in our DemandSMART revenues was primarilyattributable to changes in the following existing operating areas (dollars in thousands):
Revenue (Decrease) Increase:
December 31, 2010to
December 31, 2011
PJM . . . . . . . . . . . . . . . . . . . . . . . . . . . . . . . . . . . . . . . . . . . . . . . . . . . . . . . . $(14,431)New England . . . . . . . . . . . . . . . . . . . . . . . . . . . . . . . . . . . . . . . . . . . . . . . . . (14,123)New York . . . . . . . . . . . . . . . . . . . . . . . . . . . . . . . . . . . . . . . . . . . . . . . . . . . (2,601)Public Service Company of New Mexico, or PNM . . . . . . . . . . . . . . . . . . . (560)Ontario Power Authority, or OPA . . . . . . . . . . . . . . . . . . . . . . . . . . . . . . . . 12,204California . . . . . . . . . . . . . . . . . . . . . . . . . . . . . . . . . . . . . . . . . . . . . . . . . . . 5,090Australia . . . . . . . . . . . . . . . . . . . . . . . . . . . . . . . . . . . . . . . . . . . . . . . . . . . . 3,725ERCOT . . . . . . . . . . . . . . . . . . . . . . . . . . . . . . . . . . . . . . . . . . . . . . . . . . . . . 1,793XCEL Energy . . . . . . . . . . . . . . . . . . . . . . . . . . . . . . . . . . . . . . . . . . . . . . . . 959Salt River Project, or SRP . . . . . . . . . . . . . . . . . . . . . . . . . . . . . . . . . . . . . . . 880UK National Grid . . . . . . . . . . . . . . . . . . . . . . . . . . . . . . . . . . . . . . . . . . . . . 798Tucson Electric Power, or TEP . . . . . . . . . . . . . . . . . . . . . . . . . . . . . . . . . . . 646Other . . . . . . . . . . . . . . . . . . . . . . . . . . . . . . . . . . . . . . . . . . . . . . . . . . . . . . . 162
Total decreased demand response revenues . . . . . . . . . . . . . . . . . . . . . . . . . $ (5,458)
The decrease in our DemandSMART revenues during the year ended December 31, 2011 as compared tothe same period in 2010 was primarily attributable to less favorable pricing in the PJM and New York markets,as well as a decrease in MW enrolled in our ISO-NE program as compared to the same period in 2010 due to thecommencement of an ISO-NE program in June 2010, under which we enrolled fewer MW with lower pricingcompared to the ISO-NE program in effect prior to June 2010. The decrease in DemandSMART revenues wasalso partially attributable to fewer demand response events being called by PJM during the year endedDecember 31, 2011, which resulted in decreased energy payments, as compared to the same period in 2010. Thedecrease in DemandSMART revenues was also partially attributable to a decrease in MW under management inour PNM program during the year ended December 31, 2011 as compared to the same period in 2010. Thedecrease in DemandSMART revenues was partially offset by an increase in revenues recognized as a result ofamendments to the OPA contract during the year ended December 31, 2011 that resulted in the recognition of$5.3 million of revenues during the period that had been previously deferred. The decrease in DemandSMARTrevenues was also partially offset by stronger demand response event performance in our California demandresponse programs, our ability to recognize revenues based on the finalization of performance in a certainCalifornia demand response program, and an increase in our MW under management in the XCEL Energy, SRP,UK National Grid, and certain other demand response programs in which we participate. The decrease inDemandSMART revenues was also partially offset by our participation in demand response programs inAustralia and the TEP demand response program. We did not receive any revenues related to the Australia orTEP programs in the year ended December 31, 2010.
For the year ended December 31, 2011, our EfficiencySMART, SupplySMART and CarbonSMARTapplications and services and other revenues increased by $11.9 million as compared to the year endedDecember 31, 2010, primarily due to our acquisitions of Global Energy and M2M, both of which occurred inJanuary 2011. In addition, we completed a certain EfficiencySMART project during the three months endedSeptember 30, 2011, which resulted in the recognition of $0.6 million of revenues that had been previouslydeferred.
We currently expect our total revenues to decrease for the year ending December 31, 2012 as compared tothe same period in 2011, primarily due to an expected decrease in revenues derived from the PJM market. Thedecrease in revenues derived from the PJM market is due to an expected decline in enrolled MW a decline in
45

PJM prices during the year ending December 31, 2012 as compared to the same period in 2011 and theimplementation of PJM’s proposed market rule changes regarding capacity compliance measurement andverification. Until PJM prices return to more historic levels, we expect our revenues derived from the PJMmarket to decrease as a percentage of total annual revenues. We expect that this decrease will be partially offsetas we further increase our MW under management in our other expanded operating regions, enroll new C&Icustomers in our demand response programs, expand the sales of our EfficiencySMART, SupplySMART andCarbonSMART applications and services and other services and products to our new and existing C&Icustomers, and pursue more favorable pricing opportunities with our C&I customers.
In addition, the discontinuance of PJM’s Interruptible Load for Reliability program, beginning in 2012 willreduce the flexibility that we currently have to manage our portfolio of demand response capacity in the PJMmarket and will negatively impact our future revenues.
Gross Profit and Gross Margin
The following table summarizes our gross profit and gross margin percentages for our energy managementapplications, services and products for the years ended December 31, 2011 and 2010 (dollars in thousands):
Year Ended December 31,
2011 2010
Gross Profit Gross Margin Gross Profit Gross Margin
$123,397 43.1% $120,325 42.9%
The increase in gross profit during the year ended December 31, 2011 as compared to the same period in2010 was primarily due to our ability to recognize revenues that had previously been deferred in connection withthe OPA contract, pursuant to which we recognized the cost of such revenues in prior periods due to theuncertainty of the realizability of these costs. The increase in gross profit was also partially attributable tostronger demand response event performance in certain of the demand response programs in which weparticipate, including ISO-NE, which in some cases resulted in increased energy payments for the year endedDecember 31, 2011 as compared to the same period in 2010, as well as our ability to recognize revenues basedon the finalization of performance in a certain California demand response program for which the correspondingcost of revenues were recorded during the year ended December 31, 2010. The acquisitions that we completed in2011 also contributed to the increase in gross profit for the year ended December 31, 2011. The increase in grossprofit was partially offset by less favorable pricing in PJM and ISO-NE, as well as fewer demand response eventsbeing called by PJM during the year ended December 31, 2011, which resulted in decreased energy paymentsfrom PJM, as compared to the same periods in 2010.
The slight increase in gross margin during the year ended December 31, 2011, as compared to the sameperiod in 2010 was primarily due to the recognition of revenues in connection with the OPA contract, pursuant towhich we recognized the cost of revenues in prior periods due to the uncertainty of the realizability of thesecosts. The increase was partially offset by less favorable pricing in PJM and ISO-NE, which was not entirelyoffset by lower payments to our C&I customers.
We currently expect that our gross margin for the year ending December 31, 2012 will be lower than ourgross margin for the year ended December 31, 2011, and that our gross margin for the three months endingSeptember 30, 2012 will be the highest gross margin among our four quarterly reporting periods in 2012,consistent with our gross margin pattern in 2011, due to seasonality related to the demand response industry. Thisexpected decrease in gross margin is primarily the result of a decrease in MW enrolled in the PJM market, adecrease in PJM prices in 2012 as compared to 2011, which will not be entirely offset by lower payments to ourC&I customers and the implementation of PJM’s proposed market rule changes regarding capacity compliancemeasurement and verification.
46

Operating Expenses
The following table summarizes our operating expenses for the years ended December 31, 2011 and 2010(dollars in thousands):
Year EndedDecember 31, Percentage
Change2011 2010
Operating Expenses:
Selling and marketing . . . . . . . . . . . . . . . . . . . . . . . . . . . . . . . . . $ 51,907 $ 44,029 17.9%
General and administrative . . . . . . . . . . . . . . . . . . . . . . . . . . . . . 66,773 54,983 21.4%
Research and development . . . . . . . . . . . . . . . . . . . . . . . . . . . . . . 14,254 10,097 41.2%
Total . . . . . . . . . . . . . . . . . . . . . . . . . . . . . . . . . . . . . . . . . . . . . . . $132,934 $109,109 21.8%
In certain forward capacity markets in which we participate, such as PJM, we may enable our C&Icustomers, meaning we may install our equipment at a C&I customer site to allow for the curtailment of MWfrom the electric power grid, up to twelve months in advance of enrolling the C&I customer in a particulardemand response program. This market feature creates a longer average revenue recognition lag time across ourC&I customer portfolio from the point in time when we consider a MW to be under management to when weearn revenues from that MW. Because we incur operational expenses, including salaries and related personnelcosts, at the time of enablement, there has been a trend of incurring operating expenses associated with enablingour C&I customers in advance of recognizing the corresponding revenues.
The increase in payroll and related costs within our operating expenses during the year ended December 31,2011 as compared to the same period in 2010 was primarily driven by an increase in headcount, from 484 fulltime employees at December 31, 2010 to 599 full time employees at December 31, 2011, which was substantiallydue to the acquisitions that we completed in 2011.
We have reclassified certain costs in our consolidated statements of operations for the year endedDecember 31, 2010 totaling $1,407, previously included in selling and marketing expenses as general andadministrative expenses to more appropriately reflect the nature of these costs consistent with costs in 2011.These costs commenced in the year ended December 31, 2010 and therefore no reclassification was required forthe year ended December 31, 2009.
The following table summarizes the reclassifications between selling and marketing expenses and generaland administrative expenses for the year ended December 31, 2010 (in thousands):
Reclassifications for the YearEnded December 31, 2010
Selling andMarketingExpenses
General andAdministrative
Expenses
Payroll and related costs . . . . . . . . . . . . . . . . . . . . . . . . . . . . . . . . . . . . . . . $ (264) $ 264
Stock-based compensation . . . . . . . . . . . . . . . . . . . . . . . . . . . . . . . . . . . . . (126) 126
Other . . . . . . . . . . . . . . . . . . . . . . . . . . . . . . . . . . . . . . . . . . . . . . . . . . . . . . (1,017) 1,017
Total . . . . . . . . . . . . . . . . . . . . . . . . . . . . . . . . . . . . . . . . . . . . . . . . . . . . . . . $(1,407) $1,407
47
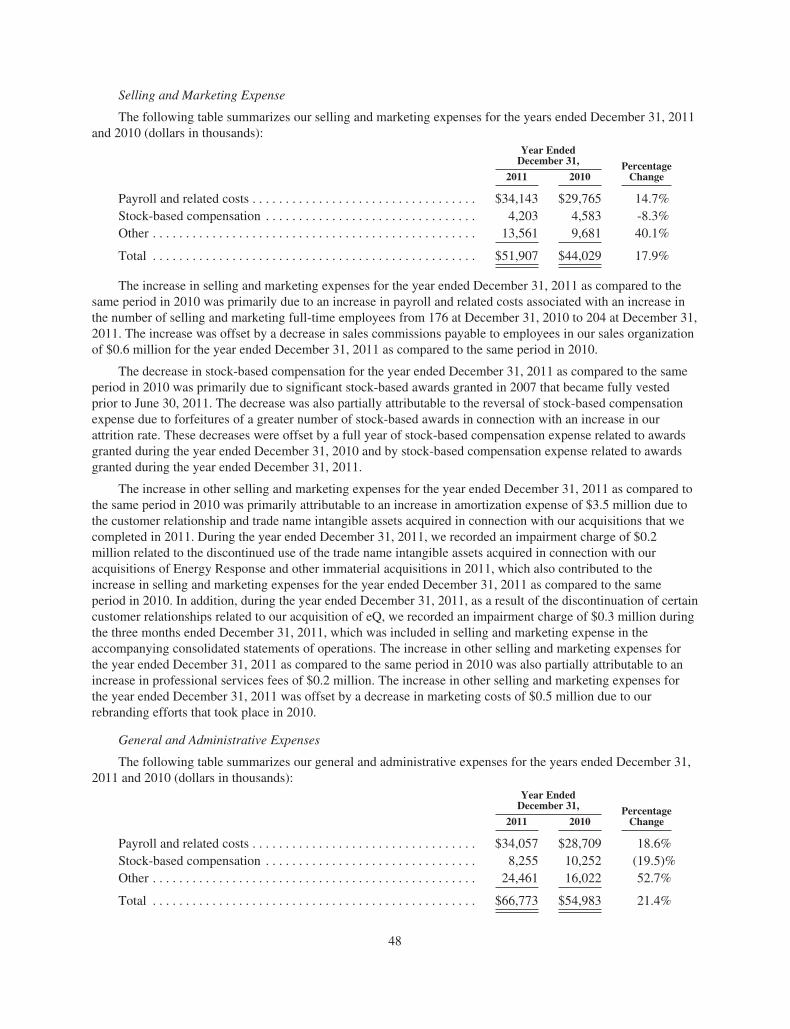
Selling and Marketing Expense
The following table summarizes our selling and marketing expenses for the years ended December 31, 2011and 2010 (dollars in thousands):
Year EndedDecember 31, Percentage
Change2011 2010
Payroll and related costs . . . . . . . . . . . . . . . . . . . . . . . . . . . . . . . . . . $34,143 $29,765 14.7%Stock-based compensation . . . . . . . . . . . . . . . . . . . . . . . . . . . . . . . . 4,203 4,583 -8.3%Other . . . . . . . . . . . . . . . . . . . . . . . . . . . . . . . . . . . . . . . . . . . . . . . . . 13,561 9,681 40.1%
Total . . . . . . . . . . . . . . . . . . . . . . . . . . . . . . . . . . . . . . . . . . . . . . . . . $51,907 $44,029 17.9%
The increase in selling and marketing expenses for the year ended December 31, 2011 as compared to thesame period in 2010 was primarily due to an increase in payroll and related costs associated with an increase inthe number of selling and marketing full-time employees from 176 at December 31, 2010 to 204 at December 31,2011. The increase was offset by a decrease in sales commissions payable to employees in our sales organizationof $0.6 million for the year ended December 31, 2011 as compared to the same period in 2010.
The decrease in stock-based compensation for the year ended December 31, 2011 as compared to the sameperiod in 2010 was primarily due to significant stock-based awards granted in 2007 that became fully vestedprior to June 30, 2011. The decrease was also partially attributable to the reversal of stock-based compensationexpense due to forfeitures of a greater number of stock-based awards in connection with an increase in ourattrition rate. These decreases were offset by a full year of stock-based compensation expense related to awardsgranted during the year ended December 31, 2010 and by stock-based compensation expense related to awardsgranted during the year ended December 31, 2011.
The increase in other selling and marketing expenses for the year ended December 31, 2011 as compared tothe same period in 2010 was primarily attributable to an increase in amortization expense of $3.5 million due tothe customer relationship and trade name intangible assets acquired in connection with our acquisitions that wecompleted in 2011. During the year ended December 31, 2011, we recorded an impairment charge of $0.2million related to the discontinued use of the trade name intangible assets acquired in connection with ouracquisitions of Energy Response and other immaterial acquisitions in 2011, which also contributed to theincrease in selling and marketing expenses for the year ended December 31, 2011 as compared to the sameperiod in 2010. In addition, during the year ended December 31, 2011, as a result of the discontinuation of certaincustomer relationships related to our acquisition of eQ, we recorded an impairment charge of $0.3 million duringthe three months ended December 31, 2011, which was included in selling and marketing expense in theaccompanying consolidated statements of operations. The increase in other selling and marketing expenses forthe year ended December 31, 2011 as compared to the same period in 2010 was also partially attributable to anincrease in professional services fees of $0.2 million. The increase in other selling and marketing expenses forthe year ended December 31, 2011 was offset by a decrease in marketing costs of $0.5 million due to ourrebranding efforts that took place in 2010.
General and Administrative Expenses
The following table summarizes our general and administrative expenses for the years ended December 31,2011 and 2010 (dollars in thousands):
Year EndedDecember 31, Percentage
Change2011 2010
Payroll and related costs . . . . . . . . . . . . . . . . . . . . . . . . . . . . . . . . . . $34,057 $28,709 18.6%Stock-based compensation . . . . . . . . . . . . . . . . . . . . . . . . . . . . . . . . 8,255 10,252 (19.5)%Other . . . . . . . . . . . . . . . . . . . . . . . . . . . . . . . . . . . . . . . . . . . . . . . . . 24,461 16,022 52.7%
Total . . . . . . . . . . . . . . . . . . . . . . . . . . . . . . . . . . . . . . . . . . . . . . . . . $66,773 $54,983 21.4%
48

The increase in general and administrative expenses for the year ended December 31, 2011 as compared tothe same period in 2010 was partially due to an increase in payroll and related costs due to an increase in full-time employees from 250 at December 31, 2010 to 322 at December 31, 2011. The increase was offset by thetiming associated with our hiring new full-time employees during 2011 as compared to 2010.
The decrease in stock-based compensation for the year ended December 31, 2011 as compared to the sameperiod in 2010 was primarily due to prior period stock-based awards that became fully vested in the first half of2011 and the reversal of stock-based compensation expense due to forfeitures of a greater number of stock-basedawards in connection with an increase in our attrition rate. The decrease in stock-based compensation expense forthe year ended December 31, 2011 as compared to the same period in 2010 was also partially attributable tofully-vested stock awards granted to our board of directors during the year ended December 31, 2011 with alower grant-date fair value than the same amount of fully-vested stock awards granted during the same period in2010.
The increase in other general and administrative expenses for the year ended December 31, 2011 comparedto the same period in 2010 was primarily attributable to a $4.3 million increase in finance costs primarily due tocharges that we recorded in connection with a certain contract that we terminated during the year endedDecember 31, 2011. As a result of this termination, we recorded charges of $4.1 million during the year endedDecember 31, 2011, which represents the $3.2 million paid upon the termination and $0.9 million that had beenpreviously capitalized. In addition, the increase in other general and administrative expenses for the year endedDecember 31, 2011 compared to the same period in 2010 was also due to an increase in professional servicesfees of $1.5 million incurred in connection with the integration of the acquisitions that we completed in 2011,technology and communication costs of $1.3 million due to increased software licensing fees and computersupplies, and an increase in facility costs of $1.3 million due to the expansion of our office space as a result ofour recent acquisitions.
Research and Development Expenses
The following table summarizes our research and development expenses for the years ended December 31,2011 and 2010 (dollars in thousands):
Year EndedDecember 31, Percentage
Change2011 2010
Payroll and related costs . . . . . . . . . . . . . . . . . . . . . . . . . . . . . . . . . . $ 7,682 $ 5,517 39.2%
Stock-based compensation . . . . . . . . . . . . . . . . . . . . . . . . . . . . . . . . 1,006 907 10.9%
Other . . . . . . . . . . . . . . . . . . . . . . . . . . . . . . . . . . . . . . . . . . . . . . . . . 5,566 3,673 51.5%
Total . . . . . . . . . . . . . . . . . . . . . . . . . . . . . . . . . . . . . . . . . . . . . . . . . $14,254 $10,097 41.2%
The increase in research and development expenses for the year ended December 31, 2011 as compared tothe same period in 2010 was primarily driven by the costs associated with an increase in the number of researchand development full-time employees from 58 at December 31, 2010 to 73 at December 31, 2011, as well as thetiming associated with our hiring new full-time employees during 2011 as compared to 2010 and an increase insalary rates per full-time employee. The increase was offset by an increase in capitalized internal payroll andrelated costs of $0.3 million for the year ended December 31, 2011.
The increase in stock-based compensation for the year ended December 31, 2011 as compared to the sameperiod in 2010 was primarily due to costs related to equity awards granted to new employees during 2011,including a senior level employee.
The increase in other research and development expenses for the year ended December 31, 2011 ascompared to the same period in 2010 was attributable to a $0.6 million increase in technology andcommunications expenses related to software licensing fees and a $0.5 million impairment charge. The increasewas also attributable to an increase in the allocation of facility costs of $0.2 million due to the expansion of our
49

office space as a result of recent acquisitions, an increase of $0.4 million in professional services fees related toour intellectual property and an increase of $0.2 million in miscellaneous equipment expenses as a result of theexpansion of our hardware product offerings.
During the three months ended December 31, 2011, as a result of our review and realignment of ourdevelopment efforts, we abandoned our efforts to complete the development of a certain in-process research anddevelopment indefinite-lived intangible asset related to our acquisition of Zox. As a result, we recorded animpairment charge related to this indefinite-lived in-process research and development intangible asset of $0.5million and an impairment charge related to the associated definite-lived patent intangible asset of less than $0.1million.
Other (Expense) Income, Net
Other expense, net for the year ended December 31, 2011 was primarily comprised of foreign currencylosses related to certain intercompany receivables denominated in foreign currencies. Other expense, net for theyear ended December 31, 2010 was primarily comprised of a nominal amount of foreign currency losses relatedto certain intercompany receivables denominated in foreign currencies offset by a nominal amount of interestincome. The significant increase in losses arising from transactions denominated in foreign currencies for theyear ended December 31, 2011 as compared to the same period in 2010 was due to the significant increase inforeign denominated intercompany receivables held by us from one of our Australian subsidiaries primarily as aresult of the funding provided to complete the acquisition of Energy Response and the strengthening of theUnited States dollar as compared to the Australian dollar during the year ended December 31, 2011. As ofDecember 31, 2011, we had an intercompany receivable from our Australian subsidiary that is denominated inAustralian dollars and not deemed to be of a “long-term investment” nature totaling $33.7 million ($33.1 millionAustralian). The significant increase in losses arising from transactions denominated in foreign currencies isprimarily unrealized losses and therefore a non-cash expense. We did not implement any currency hedgingtransactions during the year ended December 31, 2011.
Interest Expense
Interest expense for the year ended December 31, 2011 includes amortization of capitalized debt issuancecosts, interest on our outstanding capital leases and letters of credit origination fees. The increase in interestexpense for the year ended December 31, 2011 as compared to the same period in 2010 was due to theamortization of capitalized debt issuance costs associated with the 2011 credit facility, which were significantlyhigher than the amortization of debt issuance costs associated with the 2008 credit facility.
Income Taxes
We recorded a provision for income taxes of $1.8 million and $0.8 million for the years endedDecember 31, 2011 and 2010, respectively. Although our federal and state net operating loss carryforwardsexceeded our taxable income for the years ended December 31, 2011 and 2010, our annual effective tax rate wasgreater than zero due to the following:
• estimated foreign taxes resulting from guaranteed profit allocable to our foreign subsidiaries, which havebeen determined to be limited-risk service providers acting on behalf of the U.S. parent for tax purposes,for which there are no tax net operating loss carryforwards;
• certain state taxes for jurisdictions where the states currently limit or disallow the utilization of netoperating loss carryforwards; and
• amortization of tax deductible goodwill, which generates a deferred tax liability that cannot be offset bynet operating losses or other deferred tax assets since its reversal is considered indefinite in nature.
Our effective tax rate for the year ended December 31, 2011 was 15.6% as compared to an effective tax rateof 8.0% for the year ended December 31, 2010.
50

We review all available evidence to evaluate the recovery of our deferred tax assets, including the recenthistory of accumulated losses in all tax jurisdictions over the last three years, as well as our ability to generateincome in future periods. As of December 31, 2011 and December 31, 2010, due to the uncertainty related to theultimate use of our deferred income tax assets, we have provided a full valuation allowance against ourU.S. deferred tax assets.
Year Ended December 31, 2010 Compared to Year Ended December 31, 2009
Revenues
The following table summarizes our revenues for the years ended December 31, 2010 and 2009 (dollars inthousands):
Year EndedDecember 31, Dollar
ChangePercentage
Change2010 2009
Revenues:
DemandSMART . . . . . . . . . . . . . . . . . . . . . . . . . . . . $264,608 $183,861 $80,747 43.9%
EfficiencySMART, SupplySMART, andCarbonSMART . . . . . . . . . . . . . . . . . . . . . . . . . . . 15,549 6,814 8,735 128.2%
Total revenues . . . . . . . . . . . . . . . . . . . . . . . . . . . . . . $280,157 $190,675 $89,482 46.9%
For the year ended December 31, 2010, our demand response revenues increased by $80.7 million, or 44%,as compared to the year ended December 31, 2009. The increase in our demand response revenues was primarilyattributable to changes in our MW under management in the following existing operating areas (in thousands):
Revenue Increase(Decrease):
December 31, 2009to
December 31, 2010
PJM . . . . . . . . . . . . . . . . . . . . . . . . . . . . . . . . . . . . . . . . . . . . . . . . . . . . . . . . . . . . . . . $69,246
Tennessee Valley Authority . . . . . . . . . . . . . . . . . . . . . . . . . . . . . . . . . . . . . . . . . . . . 5,494
New England . . . . . . . . . . . . . . . . . . . . . . . . . . . . . . . . . . . . . . . . . . . . . . . . . . . . . . . . (4,515)
New York . . . . . . . . . . . . . . . . . . . . . . . . . . . . . . . . . . . . . . . . . . . . . . . . . . . . . . . . . . 934
California . . . . . . . . . . . . . . . . . . . . . . . . . . . . . . . . . . . . . . . . . . . . . . . . . . . . . . . . . . . 1,790
Other(1) . . . . . . . . . . . . . . . . . . . . . . . . . . . . . . . . . . . . . . . . . . . . . . . . . . . . . . . . . . . . 7,798
Total increased demand response revenues . . . . . . . . . . . . . . . . . . . . . . . . . . . . . . . . . $80,747
(1) The amounts included in this category relate to increases in various demand response programs, none ofwhich are individually material.
In addition to an increase in our MW under management, the increase in our demand response revenues forthe year ended December 31, 2010 compared to the same period in 2009 was also attributable to the effectivemanagement of our portfolio of demand response capacity and more favorable pricing in certain operating areas.Additionally, approximately 10% of the increase in demand response revenues was attributable to an increase inenergy payment revenues as a result of more demand response events occurring in 2010 as compared to 2009.These increases were offset by the commencement of a new ISO-NE program, which started in June 2010, underwhich we enrolled fewer MW with lower pricing compared to a prior, similar ISO-NE program in which weparticipated.
For the year ended December 31, 2010, our EfficiencySMART, SupplySMART and CarbonSMARTapplications and services revenues increased by $8.7 million as compared to the year ended December 31, 2009primarily due to our acquisition of Cogent, a company specializing in comprehensive energy consulting,engineering and building commissioning solutions to C&I customers, which occurred in December 2009.
51

Gross Profit and Gross Margin
The following table summarizes our gross profit and gross margin percentages for our energy managementapplications, services and products for the years ended December 31, 2010 and 2009 (dollars in thousands):
Year Ended December 31,
2010 2009
Gross Profit Gross Margin Gross Profit Gross Margin
$ 120,325 42.9% $86,460 45.3%
Our gross profit increased during the year ended December 31, 2010 as compared to the same period in2009 primarily due to the substantial increase in our revenues, as well as the effective management of ourportfolio of demand response capacity and strong demand response event performance, particularly in the PJMregion from which we currently derive a substantial portion of our revenues.
Our gross margin decreased during the year ended December 31, 2010 as compared to the same period in2009 primarily due to lower prices in the ISO-NE market, an increase in cost of revenues in a certain demandresponse program where the associated revenues were deferred and recognition of certain project start-up costsrelated to an enterprise energy management arrangement pursuant to which revenue recognition has not yetcommenced. Additionally, our gross margin decreased during the year ended December 31, 2010 as compared tothe same period in 2009 due to increased depreciation and amortization of capitalized costs and an impairmentcharge of $1.6 million recognized during the year ended December 31, 2010 related to certain demand responseand back-up generator equipment.
Operating Expenses
The following table summarizes our operating expenses for the years ended December 31, 2010 and 2009(dollars in thousands):
Year EndedDecember 31, Percentage
Change2010 2009
Operating Expenses:
Selling and marketing . . . . . . . . . . . . . . . . . . . . . . . . . . . . . . . . . . $ 44,029 $39,502 11.5%
General and administrative . . . . . . . . . . . . . . . . . . . . . . . . . . . . . . 54,983 44,407 23.8%
Research and development . . . . . . . . . . . . . . . . . . . . . . . . . . . . . . . 10,097 7,601 32.8%
Total . . . . . . . . . . . . . . . . . . . . . . . . . . . . . . . . . . . . . . . . . . . . . . . . $109,109 $91,510 19.2%
In certain forward capacity markets in which we choose to participate, such as PJM, we may enable our C&Icustomers, meaning we may install our equipment at a C&I customer site to allow for the curtailment of MWfrom the electric power grid, up to twelve months in advance of enrolling the C&I customer in a particularprogram. This market feature creates a longer average revenue recognition lag time across our C&I customerportfolio from the point in time when we consider a MW to be under management to when we earn revenuesfrom that MW. Because we incur operational expenses, including salaries and related personnel costs, at the timeof enablement, there has been a trend of incurring operating expenses associated with enabling our C&Icustomers in advance of recognizing the corresponding revenues.
We have reclassified certain costs in our consolidated statements of operations for the year endedDecember 31, 2010 totaling $1,407, previously included in selling and marketing expenses as general andadministrative expenses to more appropriately reflect the nature of these costs consistent with costs in 2011.These costs commenced in the year ended December 31, 2010 and therefore no reclassification was required forthe year ended December 31, 2009.
52

Selling and Marketing Expenses
The following table summarizes our selling and marketing expenses for the years ended December 31, 2010and 2009 (dollars in thousands):
Year EndedDecember 31, Percentage
Change2010 2009
Payroll and related costs . . . . . . . . . . . . . . . . . . . . . . . . . . . . . . . . . . $29,765 $26,241 13.4%
Stock-based compensation . . . . . . . . . . . . . . . . . . . . . . . . . . . . . . . . 4,583 3,989 14.9%
Other . . . . . . . . . . . . . . . . . . . . . . . . . . . . . . . . . . . . . . . . . . . . . . . . . 9,681 9,272 4.4%
Total . . . . . . . . . . . . . . . . . . . . . . . . . . . . . . . . . . . . . . . . . . . . . . . . . $44,029 $39,502 11.5%
The increase in selling and marketing expenses for the year ended December 31, 2010 compared to the sameperiod in 2009 was partially driven by the payroll and related costs associated with an increase in the number ofselling and marketing full-time employees from 146 at December 31, 2009 to 176 at December 31, 2010. Theincrease was offset by a decrease in salary rates per full-time employee. The increase in payroll and related costsfor the year ended December 31, 2010 compared to the same period in 2009 was also attributable to an increasein sales commissions payable to certain members of our sales organization of $1.3 million, as well as the timingassociated with our hiring new full-time employees during 2010 as compared to 2009.
The increase in stock-based compensation for the year ended December 31, 2010 compared to the sameperiod in 2009 was primarily due to annual stock-based awards granted to an officer and costs related to equityawards granted to certain existing and newly-hired employees.
The increase in other selling and marketing expenses for the year ended December 31, 2010 as compared tothe same period in 2009 was attributable to increases in professional services and marketing costs of $0.6 milliondue to our rebranding efforts, attendance at conferences and seminars, and costs associated with third-partymarketing personnel. The increase in other selling and marketing expenses for the year ended December 31, 2010as compared to the same period in 2009 was also attributable to an increase in technology and communicationcosts of $0.3 million due to new software licenses. The increase in other selling and marketing expenses for theyear ended December 31, 2010 as compared to the same period in 2009 was partially offset by a decrease infacility costs of $0.5 million due to the reclassification of departments from selling and marketing expenses togeneral and administrative expenses, as noted above.
General and Administrative Expenses
The following table summarizes our general and administrative expenses for the years ended December 31,2010 and 2009 (dollars in thousands):
Year EndedDecember 31, Percentage
Change2010 2009
Payroll and related costs . . . . . . . . . . . . . . . . . . . . . . . . . . . . . . . . . . $28,709 $23,059 24.5%
Stock-based compensation . . . . . . . . . . . . . . . . . . . . . . . . . . . . . . . . 10,252 8,471 21.0%
Other . . . . . . . . . . . . . . . . . . . . . . . . . . . . . . . . . . . . . . . . . . . . . . . . . 16,022 12,877 24.4%
Total . . . . . . . . . . . . . . . . . . . . . . . . . . . . . . . . . . . . . . . . . . . . . . . . . $54,983 $44,407 23.8%
The increase in general and administrative expenses for the year ended December 31, 2010 compared to thesame period in 2009 was primarily driven by payroll and related costs due to an increase in executivecompensation. The increase in payroll and related costs for the year ended December 31, 2010 compared to thesame period in 2009 was also attributable to an increase in full-time employees from 223 at December 31, 2009to 250 at December 31, 2010.
53

The increase in stock-based compensation for the year ended December 31, 2010 compared to the sameperiod in 2009 was primarily due to annual stock-based awards granted to our officers and directors.
The increase in other general and administrative expenses for the year ended December 31, 2010 comparedto the same period in 2009 was attributable to an increase in professional services fees of $1.3 million primarilydue to increased legal and accounting, audit and tax fees, as well as facility costs of $1.2 million primarily relatedto increased rent expense due to the expansion of our office space. Additionally, we allocated company-widecosts to general and administrative expenses based on headcount, which resulted in a $0.6 million increase ofother miscellaneous expenses associated with the growth of our business.
Research and Development Expenses
The following table summarizes our research and development expenses for the years ended December 31,2010 and 2009 (dollars in thousands):
Year EndedDecember 31, Percentage
Change2010 2009
Payroll and related costs . . . . . . . . . . . . . . . . . . . . . . . . . . . . . . . . . . . $ 5,517 $4,214 30.9%
Stock-based compensation . . . . . . . . . . . . . . . . . . . . . . . . . . . . . . . . . 907 674 34.6%
Other . . . . . . . . . . . . . . . . . . . . . . . . . . . . . . . . . . . . . . . . . . . . . . . . . . 3,673 2,713 35.4%
Total . . . . . . . . . . . . . . . . . . . . . . . . . . . . . . . . . . . . . . . . . . . . . . . . . . $10,097 $7,601 32.8%
The increase in research and development expenses for the year ended December 31, 2010 compared to thesame period in 2009 was primarily driven by the costs associated with an increase in the number of research anddevelopment full-time employees from 49 at December 31, 2009 to 58 at December 31, 2010. The increase inresearch and development expenses for the year ended December 31, 2010 compared to the same period in 2009was also attributable to lower capitalized internal payroll and related costs of $0.3 million.
The increase in stock-based compensation for the year ended December 31, 2010 compared to the sameperiod in 2009 was primarily due to stock-based awards granted to certain employees in connection with ouracquisition of SmallFoot and Zox in March 2010.
The increase in other research and development expenses for the year ended December 31, 2010 comparedto the same period in 2009 was primarily related to a $0.6 million increase in technology and communicationsrelated to software licenses and fees used in the development of our energy management applications and$0.5 million related to professional services fees for consulting services associated with the development of ourenergy management applications. Additionally, we allocated company-wide costs to research and developmentexpenses based on headcount, which resulted in a decrease of $0.1 million related to facility costs.
Other Income, Net
Other expense, net for the year ended December 31, 2010 was $0.1 million as compared to other income,net of $0.1 million for the year ended December 31, 2009. Other expense, net for the year ended December 31,2010 was comprised of a nominal amount of interest income due to the nominal rate of returns on our availablecash and was offset by net nominal foreign currency losses in 2010. Other income, net for the year endedDecember 31, 2009 was comprised of a nominal amount of interest income, as well as net nominal foreigncurrency gains in 2009.
Interest Expense
The decrease in interest expense for the year ended December 31, 2010 compared to the same period in2009 was due to our repayment of outstanding borrowings under the 2008 credit facility of $4.4 million duringthe three months ended December 31, 2009, resulting in no interest expense related to any borrowings under the2008 credit facility during the year ended December 31, 2010. Additionally, the decrease in interest expense for
54

the year ended December 31, 2010 compared to the same period in 2009 was due to $1.1 million in fees incurredduring the year ended December 31, 2009 associated with outstanding letters of credit, primarily attributable tothe arrangement we entered into with a third party in May 2009 in connection with bidding capacity into a certainopen market program. Interest expense for the year ended December 31, 2010 included interest on ouroutstanding capital leases and letters of credit origination fees.
Income Taxes
We recorded a provision for income taxes of $0.8 million for the year ended December 31, 2010, whichincluded consideration of the tax benefit recognized by us from stock option deductions generated during theyear ended December 31, 2010. Although our federal and state net operating loss carryforwards exceeded ourtaxable income for the year ended December 31, 2010, our annual effective tax rate was greater than zero due tothe following:
• estimated foreign taxes resulting from guaranteed profit allocable to our foreign subsidiaries, which havebeen determined to be limited-risk service providers acting on behalf of the U.S. parent for tax purposes,for which there are no tax net operating loss carryforwards;
• certain state taxes for jurisdictions where the states currently limit or disallow the utilization of netoperating loss carryforwards; and
• amortization of tax deductible goodwill, which generates a deferred tax liability that cannot be offset bynet operating losses or other deferred tax assets since its reversal is considered indefinite in nature.
Our effective tax rate for the year ended December 31, 2010 was 8.0%.
We recorded a provision for income taxes of $0.3 million for the year ended December 31, 2009, which wasprimarily related to the amortization of tax deductible goodwill that generated a deferred tax liability that cannotbe offset by net operating losses or other deferred tax assets since its reversal is considered indefinite in nature.
We review all available evidence to evaluate the recovery of our deferred tax assets, including the recenthistory of accumulated losses in all tax jurisdictions over the last three years, as well as our ability to generateincome in future periods. As of December 31, 2010 and December 31, 2009, due to the uncertainty related to theultimate use of our deferred income tax assets, we have provided a full valuation allowance against ourU.S. deferred tax assets.
Liquidity and Capital Resources
Overview
Since inception, we have generated significant cumulative losses. As of December 31, 2011, we had anaccumulated deficit of $81.1 million. As of December 31, 2011, our principal sources of liquidity were cash andcash equivalents totaling $87.3 million, a decrease of $66.1 million from the December 31, 2010 balance of$153.4 million. As of December 31, 2011, we were contingently liable for $31.6 million in connection withoutstanding letters of credit under the 2011 credit facility. As of December 31, 2011 and 2010, we had restrictedcash balances of $0.2 million and $1.5 million, respectively, which relate to amounts to collateralize certainobligations to vendors, collateralize outstanding letters of credit and cover financial assurance requirements incertain of the programs in which we participate. At December 31, 2011 and December 31, 2010, the majority ofour excess cash was invested in money market funds.
We are required to meet certain financial covenants under the 2011 credit facility, specifically a minimumspecified ratio of current assets to current liabilities, achievement of minimum earnings levels, and maintenance of aminimum specified charge coverage ratio. We report compliance with the specified ratio of current assets to currentliabilities on a monthly basis, and achievement of minimum earnings levels and maintenance of a minimumspecified charge coverage ratio covenants on a quarterly basis. As of December 31, 2011, we were not in compliancewith the financial covenant related to the achievement of minimum earnings levels required under the 2011 creditfacility, but we obtained a waiver from SVB with respect to such financial covenant and as a result, we were notrequired to post cash to collateralize our outstanding letters of credit.
55
We believe our existing cash and cash equivalents at December 31, 2011, amounts available under the 2011credit facility and our anticipated net cash flows from operating activities will be sufficient to meet ouranticipated cash needs, including investing activities and the provision of financial assurances in connection withour capacity bids in certain open market bidding programs, for at least the next 12 months. Our future workingcapital requirements will depend on many factors, including, without limitation, the rate at which we sell certainof our energy management applications, services, and products to electric power grid operators and utilities andthe increasing rate at which letters of credit or security deposits are required by those electric power gridoperators and utilities, the introduction and market acceptance of new energy management applications, services,and products, the expansion of our sales and marketing and research and development activities, and thegeographic expansion of our business operations. To the extent that our cash and cash equivalents, amountsavailable under the 2011 credit facility and our anticipated net cash flows from operating activities areinsufficient to fund our future activities or planned future acquisitions, we may be required to raise additionalfunds through bank credit arrangements or public or private equity or debt financings. We also may raiseadditional funds in the event we determine in the future to effect one or more acquisitions of businesses,technologies or products. In addition, we may elect to raise additional funds even before we need them if theconditions for raising capital are favorable. Accordingly, we have filed a shelf registration statement with theSEC to register shares of our common stock and other securities for sale, giving us the opportunity to raisefunding when needed or otherwise considered appropriate at prices and on terms to be determined at the time ofany such offerings. We currently have the ability to sell approximately $62.1 million of our securities under theshelf registration statement. Any equity or equity-linked financing could be dilutive to existing stockholders. Inthe event we require additional cash resources, we may not be able to obtain bank credit arrangements or effectany equity or debt financing on terms acceptable to us or at all.
Cash Flows
The following table summarizes our cash flows for the years ended December 31, 2011, 2010 and 2009(dollars in thousands):
Year Ended December 31,
2011 2010 2009
Cash flows provided by operating activities . . . . . . . . . . . . . . . . . $ 27,637 $ 45,148 $ 8,086
Cash flows used in investing activities . . . . . . . . . . . . . . . . . . . . . (95,516) (15,424) (29,172)
Cash flows provided by financing activities . . . . . . . . . . . . . . . . . 1,997 3,974 80,013
Effects of exchange rate changes on cash . . . . . . . . . . . . . . . . . . . (237) (21) 30
Net change in cash and cash equivalents . . . . . . . . . . . . . . . . . . . . $(66,119) $ 33,677 $ 58,957
Cash Flows Provided by Operating Activities
Cash provided by operating activities primarily consists of net (loss) income adjusted for certain non-cashitems including depreciation and amortization, stock-based compensation expenses, asset impairment charges,unrealized foreign currency translation gains and losses, and the effect of changes in working capital and otheractivities.
Cash provided by operating activities for the year ended December 31, 2011 was approximately $27.6million and consisted of a net loss of $13.4 million and $0.5 million of net cash used in working capital and otheractivities offset by $41.5 million of non-cash items, primarily consisting of depreciation and amortization,deferred taxes, stock-based compensation charges, impairment charges of property and equipment and intangibleassets, and unrealized foreign exchange losses. Cash used in working capital and other activities consisted of adecrease in accrued capacity payments of $7.4 million relating primarily to the decrease in PJM revenues andtherefore the associated decrease in capacity payments to C&I customers from 2010 to 2011, a decrease of $3.6million in accounts payable and accrued expenses and other current liabilities due to the timing of payments, anincrease in other assets of $3.8 million, an increase in prepaid expenses and other current assets of $5.0 million,
56

and a decrease in other noncurrent liabilities of $0.2 million. These amounts were offset by cash provided byworking capital and other activities consisting of a decrease of $7.0 million in unbilled revenues relating to thePJM demand response market, a decrease of $2.2 million in accounts receivable due to the timing of cashreceipts under the demand response programs in which we participate, an increase of $9.0 million in deferredrevenue, and an increase of $1.3 million in accrued payroll and related expenses.
Cash provided by operating activities for the year ended December 31, 2010 was $45.1 million andconsisted of net income of $9.6 million and $33.9 million of non-cash items, primarily consisting of depreciationand amortization, deferred taxes, stock-based compensation charges and impairment of property and equipment,as well as $1.6 million of net cash used in working capital and other activities. Cash used in working capital andother activities consisted of an increase of $32.8 million in unbilled revenues relating to the PJM demandresponse market, an increase of $4.9 million in accounts receivable due to the timing of cash receipts under theprograms in which we participate and an increase in prepaid expenses and other assets of $0.7 million. Theseamounts were offset by cash provided by working capital and other activities which reflected an increase of$2.2 million in accrued payroll and related expenses, an increase of $5.8 million in accounts payable and accruedexpenses due to the timing of payments, an increase in accrued capacity payments of $25.2 million, the majorityof which was related to the PJM demand response market, and an increase of $6.8 million in deferred revenue.
Cash provided by operating activities for the year ended December 31, 2009 was $8.1 million and consistedof a net loss of $6.8 million and $12.1 million of net cash used for working capital and other activities, offset by$27.0 million of non-cash items, primarily consisting of depreciation and amortization, unrealized foreignexchange transaction loss, deferred tax provision, stock-based compensation charges and other miscellaneousitems. Cash used for working capital and other activities consisted of an increase of $28.6 million in unbilledrevenues relating to the PJM demand response market, an increase in accounts receivable of $4.6 million due tothe timing of cash receipts under the demand response programs in which we participate, an increase in prepaidexpenses and other assets of $3.7 million, and a decrease of $2.2 million in accounts payable and accruedexpenses due to the timing of payments. These amounts were partially offset by cash provided by working capitaland other activities, which reflected a $1.0 million increase in deferred revenue, a $21.9 million increase inaccrued capacity payments, the majority of which was related to the PJM demand response market, a$3.9 million increase in accrued payroll and related expenses, and an increase of $0.2 million in other noncurrentliabilities.
Cash Flows Used in Investing Activities
Cash used in investing activities was $95.5 million for the year ended December 31, 2011. During the yearended December 31, 2011, we acquired Global Energy for a purchase price of $26.7 million, of which we paid$19.9 million in cash, M2M for a purchase price of $28.6 million, of which we paid $17.5 million in cash,Energy Response for a purchase price of $30.1 million, of which we paid $27.3 million in cash and otherimmaterial acquisitions for a purchase price of $5.2 million, of which we paid $3.9 million in cash. The net cashacquired from these acquisitions was $1.1 million. Additionally, our cash investments included the cash portionof the acquisition contingent consideration for Cogent of $1.5 million. Our other principal cash investmentsduring the year ended December 31, 2011 related to capitalized internal use software costs used to build out andexpand our energy management applications, services and products and purchases of property and equipment.During the year ended December 31, 2011, we incurred $17.6 million in capital expenditures primarily related tothe purchase of office equipment and demand response equipment and other miscellaneous expenditures. Inaddition, during the year ended December 31, 2011, our deposits increased by $8.4 million primarily due tofinancial assurance requirements related to our demand response programs in Australia and our long-term assetsincreased by $0.5 million due to financing costs in connection with the 2011 credit facility.
Cash used in investing activities was $15.4 million for the year ended December 31, 2010. Our principalcash investments during the year ended December 31, 2010 related to capitalizing internal use software costsused to build out and expand our energy management applications and services and purchases of property andequipment. During the year ended December 31, 2010, we acquired SmallFoot and Zox for a purchase price of$1.4 million, of which $1.1 million was paid in cash. Additionally, our cash investments included the cash
57

portion of the earn-out payment due in connection with our acquisition of SRC of $0.9 million. We had adecrease in restricted cash and deposits of $6.0 million primarily as a result of demand response eventperformance in July 2010 under a certain open market program in which we participated, resulting in ourrestricted cash becoming unrestricted in July 2010. During the year ended December 31, 2010, we also incurred$19.4 million in capital expenditures primarily related to the purchase of office equipment and demand responseequipment and other miscellaneous expenditures.
Cash used in investing activities was $29.2 million for the year ended December 31, 2009. Our principalcash investments during 2009 related to installation services used to build out and expand our energymanagement applications and services and purchases of property and equipment. Cash provided by the sales ofavailable-for-sale securities during this period was $2.0 million, and we had an increase in restricted cash anddeposits resulting in a reduction of cash of $7.1 million, primarily as a result of cash deposits made in connectionwith demand response programs in which we participated. During the year ended December 31, 2009, we alsoincurred $16.9 million in capital expenditures primarily related to the purchase of office equipment and demandresponse equipment and other miscellaneous expenditures. Additionally, our cash investments included$0.7 million, $0.3 million and $6.6 million, respectively, related to the cash portion of the earn-out payment duein connection with our acquisition of SRC, cash used for our acquisition of eQ and cash used for our acquisitionof Cogent, net of $0.4 million of cash acquired in connection with our acquisition of Cogent.
Cash Flows Provided by Financing Activities
Cash provided by financing activities was $2.0 for the year ended December 31, 2011 and consistedprimarily of proceeds that we received from exercises of options to purchase shares of our common stock.
Cash provided by financing activities was $4.0 million for the year ended December 31, 2010 and consistedprimarily of proceeds that we received from exercises of options to purchase shares of our common stock.
Cash provided by financing activities was $80.0 million for the year ended December 31, 2009. In August2009, we completed an underwritten public offering of an aggregate of 3,963,889 shares of our common stock atan offering price of $27.00 per share, which included the sale of 709,026 shares by certain selling stockholders.Net proceeds to us from the offering were approximately $83.4 million. In addition, we received approximately$1.1 million from exercises of options to purchase shares of our common stock during the year endedDecember 31, 2009. During the year ended December 31, 2009, we made scheduled payments on our outstandingdebt and capital lease obligations of $4.5 million.
Credit Facility Borrowings
In April 2011, we and one of our subsidiaries entered into the 2011 credit facility with SVB, which wassubsequently amended in June 2011, November 2011 and December 2011. Subject to continued covenantcompliance, the 2011 credit facility provides for a two-year revolving line of credit in the aggregate amount of$75.0 million, the full amount of which may be available for issuances of letters of credit and up to $5.0 millionof which may be available for swing line loans. The revolving line of credit is subject to increase from time totime up to an aggregate amount of $100.0 million with additional commitments from the lenders or newcommitments from financial institutions acceptable to SVB. The interest on revolving loans under the 2011 creditfacility will accrue, at our election, at either (i) the Eurodollar Rate with respect to the relevant interest periodplus 2.00% or (ii) the ABR (defined as the highest of (x) the “prime rate” as quoted in the Wall Street Journal,(y) the Federal Funds Effective Rate plus 0.50% and (z) the Eurodollar Rate for a one-month interest period plus1.00%) plus 1.00%. In connection with the issuance or renewal of letters of credit for our account, we arecharged a letter of credit fee of 2.125% pursuant to the 2011 credit facility. We expense the interest and letter ofcredit fees, as applicable, in the period incurred. The 2011 credit facility terminates and all amounts outstandingthereunder are due and payable in full on April 15, 2013. At December 31, 2011, we had no borrowings andletters of credit totaling $31.6 million outstanding under the 2011 credit facility. As of December 31, 2011, wehad $43.4 million available under the 2011 credit facility for future borrowings or issuance of additional letters ofcredit.
58

The 2011 credit facility contains customary terms and conditions for credit facilities of this type, including,among other things, restrictions on our ability and the ability of our subsidiaries to incur additional indebtedness,create liens, enter into transactions with affiliates, transfer assets, make certain acquisitions, pay dividends ormake distributions on, or repurchase our common stock, consolidate or merge with other entities, or undergo achange in control. In addition, we are required to meet certain monthly and quarterly financial covenantscustomary with this type of credit facility. Our monthly financial covenants include a minimum specified ratio ofcurrent assets to current liabilities. Our quarterly financial covenants include achievement of minimum earningslevels, which is based on earnings before depreciation and amortization expense, interest expense, provisions forcash-based income taxes, stock-based compensation expense, rent expense and certain other non-cash chargesover a rolling twelve month period and maintaining a minimum specified charge coverage ratio, which is basedon the ratio of earnings calculation from the minimum earnings covenants less capital expenditures compared tofixed charges, including depreciation expense, rent expense, and income taxes paid.
The 2011 credit facility contains customary events of default, including for payment defaults, breaches ofrepresentations, breaches of affirmative or negative covenants, cross defaults to other material indebtedness,bankruptcy and failure to discharge certain judgments. If a default occurs and is not cured within any applicablecure period or is not waived, the lenders may accelerate our obligations under the 2011 credit facility. The 2011credit facility replaced the 2008 credit facility, which was in place as of March 31, 2011. If we are determined tobe in default under the 2011 credit facility, then any amounts outstanding would become immediately due andpayable and we would be required to collateralize with cash any outstanding letters of credit up to 105% of theamounts outstanding.
As of December 31, 2011, we were not in compliance with the financial covenant related to the achievementof minimum earnings levels required under the 2011 credit facility, but we obtained a waiver from SVB withrespect to such financial covenant and as a result, we were not required to post cash to collateralize ouroutstanding letters of credit. In March 2012, we and one of our subsidiaries entered into the amended and restated2011 credit facility, under which SVB became the sole lender, our borrowing limit was decreased from $75.0million to $50.0 million and certain of our financial covenant compliance requirements were modified. As aresult, we are reasonably assured that we will be in compliance with our financial covenants under the amendedand restated 2011 credit facility for the foreseeable future.
Contingent Earn-Out Payments
In connection with our acquisition of Energy Response, we may be obligated to pay additional contingentpurchase price consideration related to an earn-out payment of $10.7 million, or $10.0 million Australian. Theearn-out payment, if any, will be based on the development of a demand response reserve capacity market in theNational Electric Market in Australia by December 31, 2013 that meets certain market size and price permegawatt conditions. This milestone needs to be achieved in order for the earn-out payment to occur, and therewill be no partial payment if the milestone is not fully achieved. We determined that the initial fair value of theearn-out payment as of the acquisition date was $0.3 million. Any changes in fair value will be recorded in ourconsolidated statements of income. We recorded our estimate of the fair value of the contingent considerationbased on the evaluation of the likelihood of the achievement of the contractual conditions that would result in thepayment of the contingent consideration and weighted probability assumptions of these outcomes. This fair valuemeasurement was based on significant inputs not observable in the market and, therefore, represented a Level 3measurement as defined in ASC 820, Fair Value Measurements and Disclosures. As of December 31, 2011,there were no changes in the probability of payment of the earn-out payment. Because the liability associatedwith the earn-out payment has been discounted, as the time period to payment shortens, the liability will increase.The change in fair value resulting from this liability was recorded in general and administrative expenses in theaccompanying consolidated statements of operations. During the year ended December 31, 2011, we recorded acharge of less than $0.1 million in general and administrative expenses in the accompanying consolidatedstatements of operations. At December 31, 2011, the liability associated with the earn-out payment was recordedat $0.3 million after adjusting for changes in exchange rates.
59

In connection with our acquisition of Cogent, we agreed to make a single contingent earn-out payment of$1.5 million in cash, to be paid based on the achievement of a certain minimum revenue-based milestone and acertain earnings-based milestone of Cogent for the year ended December 31, 2010. Both of these milestonesneeded to be achieved in order for the earn-out payment to occur, and there would be no partial payment if themilestones were not fully achieved. As we believed that it was remote that the earn-out payment would not bemade, we determined the fair value of the earn-out payment based on the present value of the $1.5 million andrecorded this in connection with our purchase accounting for the acquisition of Cogent. The milestones wereachieved and we paid the earn-out payment in January 2011.
In connection with our acquisition of SRC, in addition to the amounts paid at closing, we incurred acontingent obligation to pay to the former holders of SRC membership interests an earn-out amount equal to 50%to 60% of the revenues of SRC’s business during each twelve-month period from May 1, 2008 through April 30,2010, which would be recognized as additional purchase price when earned. The earn-out payments were basedon the achievement of certain minimum revenue-based milestones of SRC and paid in a combination of cash andshares of our common stock. The additional purchase price recorded in 2009, which was related to the May 1,2008 to April 30, 2009 earn-out period, totaled $1.5 million, of which we paid $0.7 million in cash during 2009and the remainder of which we paid by the issuance of 44,776 shares of our common stock. The additionalpurchase price recorded in 2010, which was related to the May 1, 2009 to April 30, 2010 earn-out period, totaled$1.8 million, of which we paid $0.9 million in cash during 2010, less than $0.1 million was settled through areduction of a receivable due to us from the former holders of SRC membership interests and the remainder ofwhich we paid by the issuance of 30,879 shares of our common stock.
Capital Spending
We have made capital expenditures primarily for general corporate purposes to support our growth and forequipment installation related to our business. Our capital expenditures totalled $17.6 million during the yearended December 31, 2011, $19.4 million during the year ended December 31, 2010 and $16.9 million during theyear ended December 31, 2009. As we continue to grow, we expect our capital expenditures for the year endedDecember 31, 2012 to increase as compared to the same period in 2011.
Contractual Obligations
Information regarding our significant contractual obligations of the types described below as ofDecember 31, 2011 is set forth in the following table (in thousands):
Payments Due By Period
Contractual Obligations TotalLess than
1 Year1 - 3
Years3 - 5
YearsMore than
5 Years
Operating lease obligations . . . . . . . . . . . . . . . . . . . . . . . . . . . . . $11,206 $4,449 $6,582 $162 $13
Total . . . . . . . . . . . . . . . . . . . . . . . . . . . . . . . . . . . . . . . . . . . . . . . $11,206 $4,449 $6,582 $162 $13
Our operating lease obligations relate primarily to the lease of our corporate headquarters in Boston,Massachusetts and our offices in Walnut Creek, San Francisco, Irvine and Concord, California; Baltimore,Maryland; Boise, Idaho; Dallas, Texas; Melbourne, Australia; and London, United Kingdom as well as certainproperty and equipment.
In connection with the acquisition of Energy Response, in addition to the amounts paid at closing, we may beobligated to pay additional contingent purchase price consideration related to an earn-out payment equal to $10.7million ($10.0 million Australian). The earn-out payment, if any, will be based on the development of a demandresponse reserve capacity market in the National Electricity Market in Australia by December 31, 2013 that meetscertain market size and price per megawatt conditions. This milestone needs to be achieved in order for the earn-outpayment to occur and there will be no partial payment if the milestone is not fully achieved. We determined that theinitial fair value of the earn-out payment as of the acquisition date was $0.3 million. This fair value was included asa component of the purchase price resulting in an aggregate purchase price of $30.1 million. At December 31, 2011,the liability was recorded at $0.3 million after adjusting for changes in exchange rates.
60

In connection with our acquisition of M2M, we are required to pay additional consideration that wasdeferred at the date of the acquisition. This deferred purchase price consideration of $7.0 million will be paidupon the earlier of the satisfaction of certain conditions contained in the definitive agreement or seven years afterthe acquisition date of January 25, 2011. The deferred purchase price consideration is not subject to adjustmentor forfeiture. We recorded our estimate of the fair value of the deferred purchase price consideration based on theevaluation of the likelihood of the achievement of the contractual conditions that would result in the payment ofthe deferred purchase price consideration prior to seven years from the acquisition date and weighted probabilityassumptions of these outcomes. This fair value measurement was based on significant inputs not observable inthe market and therefore, represented a Level 3 measurement as defined in ASC 820. The cash portion of thedeferred purchase price consideration of less than $0.5 million is recorded as a liability, discounted to reflect thetime value of money. As the milestone payment date approaches, the fair value of this liability will increase. Thefair value of the deferred purchase price consideration of $3.4 million, related to the 254,654 shares of commonstock to be issued upon the milestone payment date has been classified as additional paid-in capital withinstockholders’ equity. With respect to the cash portion of the deferred purchase price consideration, the increase infair value is recorded as an expense in our accompanying consolidated statements of operations. During the yearended December 31, 2011, we recorded a charge of less than $0.1 million related to the accretion for the timevalue of money discount. At December 31, 2011, the liability was recorded at $0.5 million. The deferredpurchase price consideration to be paid in shares meets the requirements of an equity instrument and,accordingly, will not be remeasured at fair value each reporting period. This acquisition had no contingentconsideration or earn-out payments.
As of December 31, 2011, we had no debt obligations, but had outstanding letters of credit totaling $31.6million under the 2011 credit facility. As of December 31, 2011, we had $43.4 million available under the 2011credit facility for future borrowings or issuances of additional letters of credit. In March 2012, we and one of oursubsidiaries entered into the amended and restated 2011 credit facility, under which SVB became the sole lender,our borrowing limit was decreased from $75.0 million to $50.0 million and certain of our financial covenantcompliance requirements were modified. As a result, we are reasonably assured that we will be in compliancewith our financial covenants under the amended and restated 2011 credit facility for the foreseeable future.
We typically grant certain customers a limited warranty that guarantees that our hardware products willsubstantially conform to current specifications for one year from the delivery date. Based on our operatinghistory, the liability associated with product warranties has been determined to be nominal. We also indemnifyour customers from third-party claims relating to the intended use of our products. Pursuant to these clauses, weindemnify and agree to pay any judgment or settlement relating to a claim.
We guaranteed the electrical capacity we have committed to deliver pursuant to certain long-term contracts.Such guarantees may be secured by cash or letters of credit. Performance guarantees as of December 31, 2011and 2010 were $34.2 million and $40.0 million, respectively. These performance guarantees included depositsheld by certain customers of $14.3 million and $3.5 million, respectively, at December 31, 2011 andDecember 31, 2010.
Off-Balance Sheet Arrangements
As of December 31, 2011, we did not have any off-balance sheet arrangements, as defined inItem 303(a)(4)(ii) of Regulation S-K, that have or are reasonably likely to have a current or future effect on ourfinancial condition, changes in our financial condition, revenues or expenses, results of operations, liquidity,capital expenditures or capital resources that is material to investors. We have issued letters of credit in theordinary course of our business in order to participate in certain demand response programs. As of December 31,2011, we had outstanding letters of credit totaling $31.6 million. For information on these commitments andcontingent obligations, see “Liquidity and Capital Resources — Credit Facility Borrowings” above and Note 12to our consolidated financial statements contained herein.
61

Additional Information
Non-GAAP Financial Measures
To supplement our consolidated financial statements presented on a GAAP basis, we disclose certainnon-GAAP measures that exclude certain amounts, including non-GAAP net income (loss), non-GAAP netincome (loss) per share, adjusted EBITDA and free cash flow. These non-GAAP measures are not in accordancewith, or an alternative for, generally accepted accounting principles in the United States.
The GAAP measure most comparable to non-GAAP net income (loss) is GAAP net income (loss); theGAAP measure most comparable to non-GAAP net income (loss) per share is GAAP net income (loss) per share;the GAAP measure most comparable to adjusted EBITDA is GAAP net income (loss); and the GAAP measuremost comparable to free cash flow is cash flows from operating activities. Reconciliations of each of thesenon-GAAP financial measures to the corresponding GAAP measure are included below.
Use and Economic Substance of Non-GAAP Financial Measures Used by EnerNOC
Management uses these non-GAAP measures when evaluating our operating performance and for internalplanning and forecasting purposes. Management believes that such measures help indicate underlying trends inour business, are important in comparing current results with prior period results, and are useful to investors andfinancial analysts in assessing our operating performance. For example, management considers non-GAAP netincome or loss to be an important indicator of our overall performance because it eliminates certain of the moresignificant effects of our acquisitions and related activities and non-cash compensation expenses. In addition,management considers adjusted EBITDA to be an important indicator of our operational strength andperformance of our business and a good measure of our historical operating trend. Moreover, managementconsiders free cash flow to be an indicator of our operating trend and performance of our business.
The following is an explanation of the non-GAAP measures that we utilize, including the adjustments thatmanagement excluded as part of the non-GAAP measures for the years ended December 31, 2011, 2010 and2009, respectively, as well as reasons for excluding these individual items:
• Management defines non-GAAP net income (loss) as net income (loss) before expenses related to stock-based compensation and amortization expenses related to acquisition-related intangible assets, net ofrelated tax effects.
• Management defines adjusted EBITDA as net income (loss), excluding depreciation, amortization, stock-based compensation, interest, income taxes and other income (expense). Adjusted EBITDA eliminatesitems that represent certain of the more significant effects of our acquisitions and related activities, thatare not part of our core operations or do not require a cash outlay, such as stock-based compensation.Adjusted EBITDA also excludes depreciation, which is based on our estimate of the useful life of tangibleassets. These estimates could vary from actual performance of the asset, are based on historic costincurred to build out our deployed network and may not be indicative of current or future capitalexpenditures.
• Management defines free cash flow as net cash provided by (used in) operating activities less capitalexpenditures. Management defines capital expenditures as purchases of property and equipment, whichincludes capitalization of internal-use software development costs.
Material Limitations Associated with the Use of Non-GAAP Financial Measures
Non-GAAP net income (loss), non-GAAP net income (loss) per share, adjusted EBITDA and free cash flowmay have limitations as analytical tools. The non-GAAP financial information presented here should beconsidered in conjunction with, and not as a substitute for or superior to the financial information presented inaccordance with GAAP and should not be considered measures of our liquidity. There are significant limitationsassociated with the use of non-GAAP financial measures. Further, these measures may differ from thenon-GAAP information, even where similarly titled, used by other companies and therefore should not be used tocompare our performance to that of other companies.
62

Non-GAAP Net Income and Non-GAAP Net Income per Share
Net loss for the year ended December 31, 2011 was $13.4 million, or $0.52 per basic and diluted share,compared to a net income of $9.6 million, or $0.39 per basic share and $0.37 per diluted share, for the year endedDecember 31, 2010, and net loss of $6.8 million, or $0.32 per basic and diluted share, for the year endedDecember 31, 2009. Excluding stock-based compensation charges and amortization of expenses related toacquisition-related assets, net of tax effects, non-GAAP net income for the year ended December 31, 2011 was$5.9 million, or $0.23 per basic share and $0.22 per diluted share, compared to a non-GAAP net income of$25.4 million, or $1.03 per basic share and $0.97 per diluted share, for the year ended December 31, 2010, and anon-GAAP net income of $7.0 million, or $0.33 per basic shares and $0.30 per diluted share, for the year endedDecember 31, 2009. The reconciliation of non-GAAP net income to GAAP net income is set forth below:
Year Ended December 31,
2011 2010 2009
(In thousands, except share and per sharedata)
GAAP net (loss) income . . . . . . . . . . . . . . . . . . . . . . . . . . . . . . . $ (13,383)$ 9,577 $ (6,829)ADD: Stock–based compensation . . . . . . . . . . . . . . . . . . . . . 13,464 15,742 13,134ADD: Amortization expense of acquired intangible assets . . 5,856 1,452 692LESS: Income tax effect on Non-GAAP adjustments(1) . . . . — (1,380) —
Non-GAAP net income . . . . . . . . . . . . . . . . . . . . . . . . . . . . . $ 5,937 $ 25,391 $ 6,997
GAAP net (loss) income per basic share . . . . . . . . . . . . . . . . . . $ (0.52)$ 0.39 $ (0.32)ADD: Stock–based compensation . . . . . . . . . . . . . . . . . . . . . 0.52 0.64 0.61ADD: Amortization expense of acquired intangible assets . . 0.23 0.06 0.04LESS: Income tax effect on Non-GAAP adjustments(1) . . . . — (0.06) —
Non-GAAP net income per basic share . . . . . . . . . . . . . . . . . $ 0.23 $ 1.03 $ 0.33
GAAP net (loss) income per diluted share . . . . . . . . . . . . . . . . . $ (0.52)$ 0.37 $ (0.32)ADD: Stock–based compensation . . . . . . . . . . . . . . . . . . . . . 0.52 0.60 0.61ADD: Amortization expense of acquired intangible assets . . 0.23 0.05 0.04LESS: Income tax effect on Non-GAAP adjustments(1) . . . . — (0.05) —LESS: Dilutive impact on weighted average common stock
equivalents . . . . . . . . . . . . . . . . . . . . . . . . . . . . . . . . . . . . . (0.01) — (0.03)
Non-GAAP net income per diluted share . . . . . . . . . . . . . . . . . . $ 0.22 $ 0.97 $ 0.30
Weighted average number of common shares outstandingBasic . . . . . . . . . . . . . . . . . . . . . . . . . . . . . . . . . . . . . . . . . . . . 25,799,494 24,611,729 21,466,813Diluted . . . . . . . . . . . . . . . . . . . . . . . . . . . . . . . . . . . . . . . . . . 26,766,359 26,054,162 23,021,435
(1) Represents the increase in the income tax provision recorded for the year ended December 31, 2010 based onour effective tax rate for the year ended December 31, 2010. The non-GAAP adjustments would have noimpact on the provision for income taxes recorded for the years ended December 31, 2011 and 2009.
63

Adjusted EBITDA
Adjusted EBITDA was $ 26.0 million, $ 42.8 million, and $20.1 million for the years ended December 31,2011, 2010 and 2009, respectively.
The reconciliation of adjusted EBITDA to net income is set forth below:Year Ended December 31,
2011 2010 2009
Net (loss) income . . . . . . . . . . . . . . . . . . . . . . . . . . . . . . . . . . . . . . . $(13,383) $ 9,577 $ (6,829)
Add back:
Depreciation and amortization . . . . . . . . . . . . . . . . . . . . . . . . . . . 22,043 15,866 12,049
Stock-based compensation expense . . . . . . . . . . . . . . . . . . . . . . . 13,464 15,742 13,134
Other expense (income) . . . . . . . . . . . . . . . . . . . . . . . . . . . . . . . . 987 85 (98)
Interest expense . . . . . . . . . . . . . . . . . . . . . . . . . . . . . . . . . . . . . . . 1,053 718 1,544
Provision for income tax . . . . . . . . . . . . . . . . . . . . . . . . . . . . . . . . 1,806 836 333
Adjusted EBITDA . . . . . . . . . . . . . . . . . . . . . . . . . . . . . . . . . . . . . . $ 25,970 $42,824 $20,133
Free Cash Flow
Cash flow from operating activities was $27.6 million, $45.1 million and $8.1 million for the years endedDecember 31, 2011, 2010 and 2009, respectively. We generated $10.0 million, $25.8 million and negative $8.8million of free cash flow for the years ended December 31, 2011, 2010 and 2009, respectively. The reconciliationof free cash flow to cash flow from operating activities is set forth below:
Year Ended December 31,
2011 2010 2009
Net cash provided by operating activities . . . . . . . . . . . . . . . . . . . $ 27,637 $ 45,148 $ 8,086
Subtract:
Purchases of property and equipment . . . . . . . . . . . . . . . . . . . . (17,613) (19,394) (16,901)
Free cash flow . . . . . . . . . . . . . . . . . . . . . . . . . . . . . . . . . . . . . . . . $ 10,024 $ 25,754 $ (8,815)
Critical Accounting Policies and Use of Estimates
The discussion and analysis of our financial condition and results of operations are based upon ourconsolidated financial statements, which have been prepared in accordance with GAAP. The preparation of theseconsolidated financial statements requires us to make estimates and judgments that affect the reported amounts ofassets, liabilities, revenues and expenses, and related disclosure of contingent assets and liabilities. On anon-going basis, we evaluate our estimates, including those related to revenue recognition for multiple elementarrangements, allowance for doubtful accounts, valuations and purchase price allocations related to businesscombinations, expected future cash flows including growth rates, discount rates, terminal values and otherassumptions and estimates used to evaluate the recoverability of long-lived assets and goodwill, estimated fairvalues of intangible assets and goodwill, amortization methods and periods, certain accrued expenses and otherrelated charges, stock-based compensation, contingent liabilities, tax reserves and recoverability of our netdeferred tax assets and related valuation allowance. We base our estimates on historical experience and variousother assumptions that are believed to be reasonable under the circumstances. Actual results could differ fromthese estimates if past experience or other assumptions do not turn out to be substantially accurate. Anydifferences could have a material impact on our financial condition and results of operations.
We believe that of our significant accounting policies, which are described in Note 1 to our consolidatedfinancial statements contained in Appendix A to this Annual Report on Form 10-K, the following accountingpolicies involve a greater degree of judgment and complexity. Accordingly, these are the policies we believe arethe most critical to aid in fully understanding and evaluating our financial condition and results of operations.
64

Revenue Recognition
We recognize revenues in accordance with ASC 605, Revenue Recognition (formerly Staff AccountingBulletin No. 104, Revenue Recognition in Financial Statements, and Emerging Issues Task Force, or EITF, IssueNo. 00-21, Accounting for Revenue Arrangements with Multiple Deliverables), or ASC 605. In all of ourarrangements, we do not recognize any revenues until persuasive evidence of an arrangement exists, delivery hasoccurred, the fee is fixed or determinable, and we deem collection to be reasonably assured. In making thesejudgments, we evaluate these criteria as follows:
• Evidence of an arrangement. We consider a definitive agreement signed by the customer and us or anarrangement enforceable under the rules of an open market bidding program to be representative ofpersuasive evidence of an arrangement.
• Delivery has occurred. We consider delivery to have occurred when service has been delivered to thecustomer and no significant post-delivery obligations exist. In instances where customer acceptance isrequired, delivery is deemed to have occurred when customer acceptance has been achieved.
• Fees are fixed or determinable. We consider the fee to be fixed or determinable unless the fee is subjectto refund or adjustment or is not payable within normal payment terms. If the fee is subject to refund oradjustment and we cannot reliably estimate this amount, we recognize revenues when the right to a refundor adjustment lapses. If offered payment terms significantly exceed our normal terms, we recognizerevenues as the amounts become due and payable or upon the receipt of cash.
• Collection is reasonably assured. We conduct a credit review at the inception of an arrangement todetermine the creditworthiness of the customer. Collection is reasonably assured if, based upon ourevaluation, we expect that the customer will be able to pay amounts under the arrangement as paymentsbecome due. If we determine that collection is not reasonably assured, revenues are deferred andrecognized upon the receipt of cash.
We enter into contracts and open market bidding programs with utilities and electric power grid operators toprovide demand response applications, services and products. Demand response revenues consist of twoelements: revenue earned based on our ability to deliver committed capacity to our electric power grid operatorand utility customers, which we refer to as capacity revenue; and revenue earned based on additional paymentsmade to us for the amount of energy usage actually curtailed from the grid during a demand response event,which we refer to as energy event revenue.
We recognize demand response revenue when we have provided verification to the electric power gridoperator or utility of our ability to deliver the committed capacity which entitles us to payments under the utilitycontract or open market program. Committed capacity is generally verified through the results of an actualdemand response event or a measurement and verification test. Once the capacity amount has been verified, therevenue is recognized and future revenue becomes fixed or determinable and is recognized monthly until the nextdemand response event or test. In subsequent verification events, if our verified capacity is below the previouslyverified amount, the electric power grid operator or utility customer will reduce future payments based on theadjusted verified capacity amounts. Ongoing demand response revenue recognized between demand responseevents or tests that are not subject to penalty or customer refund are recognized in revenue. If the revenue issubject to refund and the amount of refund cannot be reliably estimated, the revenue is deferred until the right ofrefund lapses.
We have evaluated the factors within ASC 605-45-45 regarding gross versus net revenue reporting for ourdemand response revenues and payments to C&I customers. Based on the evaluation of the factors within ASC605-45-45, we determined that all of the applicable indicators of gross revenue reporting were met. Theseapplicable indicators of gross revenue reporting included, but were not limited to, the following:
• We are the primary obligor in our arrangements with electric power grid operators and utility customersbecause we provide demand response services directly to electric power grid operators and utilities underlong-term contracts or pursuant to open market programs and contract separately with C&I customers todeliver such services. We manage all interactions with the electric power grid operators and utilities, while
65

C&I customers do not interact with the electric power grid operators and utilities. In addition, we assumethe entire performance risk under arrangements with electric power grid operators and utility customers,including the posting of financial assurance to assure timely delivery of committed capacity with nocorresponding financial assurance received from C&I customers. In the event of a shortfall in deliveredcommitted capacity, we are responsible for all penalties assessed by the electric power grid operators andutilities without regard for any recourse we may have with our C&I customers.
• We have latitude in establishing pricing, as the pricing under our arrangements with electric power gridoperators and utilities is negotiated through a contract proposal and contracting process or determinedthrough a capacity auction. We then separately negotiate payment to C&I customers and have completediscretion in the contracting process with the C&I customer.
• We have complete discretion in determining the supplier (C&I customer) to provide the demand responseservices, provided that the C&I customer is located in the same region as the applicable electric powergrid operator or utility.
• We are involved in both the determination of service specifications and performing part of the services,including the installation of metering and other equipment for the monitoring, data gathering andmeasurement of performance, as well as, in certain circumstances, the remote control of C&I customerloads.
As a result, we determined that we earn revenue (as a principal) from the delivery of demand responseservices to electric power grid operators and utility customers and we record the amounts billed to the electricpower grid operators and utility customers as gross demand response revenues and the amounts paid to C&Icustomers as cost of revenues.
In one of the open market programs in which we participate, the program year operates on a June to Maybasis and performance is measured based on the aggregate performance during the months of June throughSeptember. As a result, fees received for the month of June could potentially be subject to adjustment or refundbased on performance during the months of July through September. We have historically concluded that wecould reliably estimate the amount of fees potentially subject to adjustment or refund and recorded a reserve forthis amount in the month of June. As of June 30, 2011, we recorded an estimated reserve of $9.3 million relatedto potential subsequent performance adjustments. The fees under this program were fixed as of September 30,2011 and, based on final performance during the three months ended September 30, 2011, we recorded areduction in the estimated reserve totaling $3.7 million, which resulted in final performance adjustments of $5.6million. We have re-evaluated our ability to reliably estimate the amount of fees potentially subject to adjustmentor refund for fiscal 2012 on a prospective basis based on our consideration of our historical performance underthis program, as well as additional guidance issued by the customer regarding its interpretation of certainprogram rules and changes to certain program rules that will impact performance calculations on a prospectivebasis. Based on the changes to certain program rules, we have concluded that we no longer have the ability toreliably estimate the amount of fees potentially subject to adjustment or refund until the performance period endson September 30th of each year. Therefore, on a prospective basis, all revenues related to our participation in thisprogram will be recognized at the end of the performance period or during the three months endedSeptember 30th of the applicable year. In addition, in accordance with our policy to capitalize direct andincremental costs associated with deferred revenues to the extent that such costs are realizable, we will capitalizethe associated cost of our payments to C&I customers for the month of June and expense such capitalized costswhen the associated deferred revenues are recognized. We will evaluate the direct and incremental costs forrecoverability prior to capitalization.
As a result of contractual amendments entered into during the year ended December 31, 2011 to amendcertain refund provisions included in one of our contracts with a utility customer, we concluded that we couldreliably estimate the fees potentially subject to refund and, therefore, the fees under this arrangement were fixedor determinable. As a result, during the year ended December 31, 2011, we recognized as revenues $5.3 millionof fees that had been previously deferred. As of December 31, 2011, there were no deferred revenues related tothis contractual arrangement.
66
Certain of the forward capacity programs in which we participate may be deemed derivative contracts underASC 815, Derivatives and Hedging, or ASC 815. In such situations, we believe we meet the scope exceptionunder ASC 815 as a normal purchase, normal sale as that term is defined in ASC 815 and, accordingly, thearrangement is not treated as a derivative contract.
Energy event revenues are recognized when earned. Energy event revenue is deemed to be substantive andrepresents the culmination of a separate earnings process and is recognized when the energy event is initiated bythe electric power grid operator or utility customer and we have responded under the terms of the contract oropen market program.
Under certain of our arrangements, in particular those arrangements entered into by our wholly-ownedsubsidiary, M2M, we sell proprietary equipment to C&I customers that is utilized to provide the ongoing servicesthat we deliver. Currently, this equipment has been determined to not have stand-alone value. As a result, wedefer the fees associated with the equipment and we begin recognizing those fees ratably over the expected C&Icustomer relationship period, which is generally 3 years, once the C&I customer is receiving the ongoingservices from us. In addition, we capitalize the associated direct and incremental costs, which primarily representthe equipment and third-party installation costs, and recognize such costs over the expected C&I customerrelationship period.
In September 2009, the Financial Accounting Standards Board, or FASB, ratified ASC Update No. 2009-13,Multiple-Deliverable Revenue Arrangements, or ASU 2009-13. ASU 2009-13 amends existing revenuerecognition accounting pronouncements that are currently within the scope of ASC 605-25, which is the revenuerecognition guidance for multiple-element arrangements. ASU 2009-13 provides for three significant changes tothe existing multiple-element revenue recognition guidance as follows:
• eliminates the requirement to have objective and reliable evidence of fair value for undelivered elementsin an arrangement. This may result in more deliverables being treated as separate units of accounting;
• modifies the manner in which the arrangement consideration is allocated to the separately identifieddeliverables. ASU 2009-13 requires an entity to allocate revenue in an arrangement using its best estimateof selling prices, or ESP, of deliverables if a vendor does not have vendor-specific objective evidence ofselling price, or VSOE, or third-party evidence of selling price, or TPE, if VSOE is not available. Eachseparate unit of accounting must have a selling price, which can be based on management’s estimate whenthere is no other means (VSOE or TPE) to determine the selling price of that deliverable. The arrangementconsideration is allocated based on the elements’ relative selling prices; and
• eliminates use of the residual method and requires an entity to allocate revenue using the relative sellingprice method, which results in the discount in the transaction being evenly allocated to the separate unitsof accounting.
As required, we adopted ASU 2009-13 at the beginning of the first quarter of the fiscal year endedDecember 31, 2011, or fiscal 2011, on a prospective basis for transactions originating or materially modified onor after January 1, 2011. ASU 2009-13 generally does not change the units of accounting for our revenuetransactions. The impact of adopting ASU 2009-13 was not material to our fiscal 2011 financial statements, andif it was applied in the same manner to the fiscal year ended December 31, 2010, would not have had a materialimpact to revenue for such period. We do not expect the adoption of ASU 2009-13 to have a significant impacton the timing and pattern of revenue recognition in the future due to our limited number of multiple elementarrangements. The key impact that we expect the adoption of ASU 2009-13 to have relates to certainEfficiencySMART service arrangements with C&I customers who also provide curtailment of capacity as part ofour demand response arrangements. Historically, we recorded the fees recognized under these arrangements as areduction of cost of revenues as evidence of fair value did not exist for certain EfficiencySMART services due tothe limited history of selling these separately and lack of availability of TPE. As previously stated, the impact ofASU 2009-13 has not been and is not expected to be material.
We typically determine the selling price of our services based on VSOE. Consistent with our methodologyunder previous accounting guidance, we determine VSOE based on our normal pricing and discounting practices
67

for the specific service when sold on a stand-alone basis. In determining VSOE, our policy is to require asubstantial majority of selling prices for a product or service to be within a reasonably narrow range. We alsoconsider the class of customer, method of distribution, and the geographies into which our products and servicesare sold into when determining VSOE. We typically have had VSOE for our products and services.
In certain circumstances, we are not able to establish VSOE for all deliverables in a multiple elementarrangement. This may be due to the infrequent occurrence of stand-alone sales for an element, a limited saleshistory for new services or pricing within a broader range than permissible by our policy to establish VSOE. Inthose circumstances, we proceed to the alternative levels in the hierarchy of determining selling price. TPE ofselling price is established by evaluating largely similar and interchangeable competitor products or services instand-alone sales to similarly situated customers. We are typically not able to determine TPE and have not usedthis measure since we have been unable to reliably verify standalone prices of competitive solutions. ESP isestablished in those instances where neither VSOE nor TPE are available, considering internal factors such asmargin objectives, pricing practices and controls, customer segment pricing strategies and the product life cycle.Consideration is also given to market conditions such as competitor pricing information gathered fromexperience in customer negotiations, market research and information, recent technological trends, competitivelandscape and geographies. Use of ESP is limited to a very small portion of our services, principally certainEfficiencySMART services.
Business Combinations
We record tangible and intangible assets acquired and liabilities assumed in business combinations underthe purchase method of accounting. Amounts paid for each acquisition are allocated to the assets acquired andliabilities assumed based on their fair values at the dates of acquisition. The fair value of identifiable intangibleassets is based on detailed valuations that use information and assumptions provided by management. Weestimate the fair value of contingent consideration at the time of the acquisition using all pertinent informationknown to us at the time to assess the probability of payment of contingent amounts. We allocate any excesspurchase price over the fair value of the net tangible and intangible assets acquired and liabilities assumed togoodwill.
We use the income approach to determine the estimated fair value of identifiable intangible assets, includingcustomer contracts, customer relationships, non-compete agreements and trade names. This approach determinesfair value by estimating the after-tax cash flows attributable to an in-process project over its useful life and thendiscounting these after-tax cash flows back to a present value. We base our revenue assumptions on estimates ofrelevant market sizes, expected market growth rates and expected trends, including introductions by competitorsof new services and products. We base the discount rate used to arrive at a present value as of the date ofacquisition on the time value of money and market participant investment risk factors. The use of differentassumptions could materially impact the purchase price allocation and our financial condition and results ofoperations.
Customer relationships represent established relationships with customers, which provide a ready channelfor the sale of additional energy management applications, services and products. Non-compete agreementsrepresent arrangements with certain employees that limit or prevent their ability to take employment at acompetitor for a fixed period of time. Trade names represent acquired product names that we intend to continueto utilize.
We have also utilized the cost approach to determine the estimated fair value of acquired indefinite-livedintangible assets related to acquired in-process research and development given the stage of development as ofthe acquisition date and the lack of sufficient information regarding future expected cash flows. The costapproach calculates fair value by calculating the reproduction cost of an exact replica of the subject intangibleasset. We calculate the replacement cost based on actual development costs incurred through the date ofacquisition. In determining the appropriate valuation methodology, we consider, among other factors: thein-process projects’ stage of completion; the complexity of the work completed as of the acquisition date; thecosts already incurred; the projected costs to complete; the expected introduction date; and the estimated useful
68

life of the technology. We believe that the estimated in-process research and development amounts so determinedrepresent the fair value at the date of acquisition and do not exceed the amount a third party would pay for theprojects.
Impairment of Intangible Assets and Goodwill
Intangible Assets
We amortize our intangible assets that have finite lives using either the straight-line method or, if reliablydeterminable, based on the pattern in which the economic benefit of the asset is expected to be consumedutilizing expected undiscounted future cash flows. Amortization is recorded over the estimated useful livesranging from one to ten years. We review our intangible assets subject to amortization to determine if anyadverse conditions exist or a change in circumstances has occurred that would indicate impairment or a change inthe remaining useful life. If the carrying value of an asset exceeds its undiscounted cash flows, we will write-down the carrying value of the intangible asset to its fair value in the period identified. In assessingrecoverability, we must make assumptions regarding estimated future cash flows and discount rates. If theseestimates or related assumptions change in the future, we may be required to record impairment charges. Wegenerally calculate fair value as the present value of estimated future cash flows to be generated by the assetusing a risk-adjusted discount rate. If the estimate of an intangible asset’s remaining useful life is changed, wewill amortize the remaining carrying value of the intangible asset prospectively over the revised remaining usefullife.
During the year ended December 31, 2011, as a result of a discontinuation of certain trade names acquiredin connection with the acquisitions of Energy Response and another immaterial acquisition, we determined thatthese definite-lived intangible assets were impaired and recorded an impairment charge of $0.2 million to reducethe carrying value of these assets to zero, which was included in selling and marketing expense in theaccompanying consolidated statements of operations. During the year ended December 31, 2011, as a result ofthe discontinuation of certain customer relationships related to our acquisition of eQ, we recorded an impairmentcharge of $0.3 million which was included in selling and marketing expense in the accompanying consolidatedstatements of operations.
During the year ended December 31, 2009, as a result of a change in the expected period of economic benefitof the trade name acquired in our acquisition of Cogent, we determined that an impairment indicator existed. Basedon the analysis performed, we determined that this trade name was partially impaired and recorded an impairmentcharge of $0.1 million during the year ended December 31, 2009, which is included in general and administrativeexpenses in the accompanying consolidated statements of operations. The fair market value of less than $0.1 millionwas determined using Level 3 inputs, as defined by ASC 820, Fair Value Measurements and Disclosures (formerlySFAS No. 157, Fair Value Measurement), or ASC 820, based on the projected future cash flows over the revisedperiod of economic benefit discounted based on our weighted average cost of capital of 17%.
Goodwill
In accordance with ASC 350, Intangibles — Goodwill and Other (formerly FASB SFAS No. 142, Goodwilland Other Intangible Assets), or ASC 350, we test goodwill at the reporting unit level for impairment on anannual basis and between annual tests if events and circumstances indicate it is more likely than not that the fairvalue of a reporting unit is less than its carrying value. We have determined that we currently have 2 reportingunits: (1) our consolidated Australian operations and (2) all other operations. Although our chief operatingdecision maker, which is our chief executive officer and executive management team, collectively, makebusiness decisions based on the evaluation of financial information at the entity level, certain discrete financialinformation is available related to our consolidated Australian operations with such discrete financial informationutilized by the business unit manager to manage the consolidated Australian operations and make decisions forthose operations. The consolidated Australian operations are comprised of the operations acquired in theacquisitions of Energy Response and another immaterial acquisition, as well as the operations of our subsidiary,EnerNOC Australia Pty Ltd. Events that would indicate impairment and trigger an interim impairment
69

assessment include, but are not limited to, current economic and market conditions, including a decline in marketcapitalization, a significant adverse change in legal factors, business climate or operational performance of thebusiness, and an adverse action or assessment by a regulator. Our annual impairment test date is November 30.
In performing the test, we utilize the two-step approach prescribed under ASC 350. The first step requires acomparison of the carrying value of the reporting units, as defined, to the fair value of these units. We consider anumber of factors to determine the fair value of a reporting unit, including an independent valuation to conductthis test. The valuation is based upon expected future discounted operating cash flows of the reporting unit aswell as analysis of recent sales or offerings of similar companies. We base the discount rate used to arrive at apresent value as the date of the impairment test on our weighted average cost of capital. If the carrying value ofthe reporting unit exceeds its fair value, we will perform the second step of the goodwill impairment test tomeasure the amount of impairment loss, if any. The second step of the goodwill impairment test compares theimplied fair value of a reporting unit’s goodwill to its carrying value.
In order to determine the fair value of our reporting units we utilize both a market approach based on thequoted market price of our common stock and the number of shares outstanding and a discounted cash flowanalysis, or DCF, under the income approach. The key assumptions that drive the fair value in the DCF modelare the discount rates (i.e., weighted average cost of capital, or WACC), terminal values, growth rates, and theamount and timing of expected future cash flows. If the current worldwide financial markets and economicenvironment were to deteriorate, this would likely result in a higher WACC because market participants wouldrequire a higher rate of return. In the DCF, as the WACC increases, the fair value decreases. The other significantfactor in the DCF is its projected financial information (i.e., amount and timing of expected future cash flows andgrowth rates) and if its assumptions were to be adversely impacted, this could result in a reduction of the fairvalue of the entity. We conducted our annual impairment test as of November 30, 2011. As a result of completingthe first step, the fair value exceeded the carrying value, and as such the second step of the impairment test wasnot required. To date, we have not been required to perform the second step of the impairment test. As of theannual impairment test date, and as of December 31, 2011, our market capitalization exceeded the fair value ofour consolidated net assets.
Subsequent to December 31, 2011, we have experienced a decline in our market capitalization. A prolongedsignificant decline in our market capitalization could result in failing the first step of the goodwill impairmenttest and a goodwill impairment charge.
The estimate of fair value requires significant judgment. Any loss resulting from an impairment test wouldbe reflected in operating loss in our consolidated statements of operations. The annual impairment testing processis subjective and requires judgment at many points throughout the analysis. If these estimates or their relatedassumptions change in the future, we may be required to record impairment charges for these assets notpreviously recorded.
Impairment of Property and Equipment
We review property and equipment for impairment whenever events or changes in circumstances indicatethat the carrying amount of assets may not be recoverable. If these assets are considered to be impaired, theimpairment is recognized in earnings and equals the amount by which the carrying value of the assets exceedstheir fair market value determined by either a quoted market price, if any, or a value determined by utilizing adiscounted cash flow technique. If these assets are not impaired, but their useful lives have decreased, theremaining net book value is amortized over the revised useful life.
During the years ended December 31, 2011 and 2010, we identified impairment indicators related to certaindemand response equipment as a result of the removal of such equipment from service during those years. As aresult of these impairment indicators, we performed impairment tests and recognized impairment charges of $0.6million during both of the years ended December 31, 2011 and 2010, representing the difference between thecarrying value and fair market value of the demand response equipment, which is included in cost of revenues inthe accompanying consolidated statements of operations. The fair market value was determined utilizing Level 3inputs, as defined by ASC 820, based on the projected future cash flows discounted using the estimated marketparticipant rate of return for this type of asset.
70

During the years ended December 31, 2011 and 2010, we identified potential impairment indicators relatedto certain demand response and back-up generator equipment as a result of lower than estimated demandresponse event performance by these assets. As a result of the potential indicators of impairment, we performedimpairment tests. The applicable long-lived assets are measured for impairment at the lowest level for whichidentifiable cash flows are largely independent of the cash flows of other assets or liabilities. We determined thatthe undiscounted cash flows to be generated by the asset group over its remaining estimated useful life would notbe sufficient to recover the carrying value of the asset group. We determined the fair value of the asset groupusing a discounted cash flow technique based on Level 3 inputs, as defined by ASC 820, and a discount rate of11%, which we determined represents a market rate of return for the assets being evaluated for impairment. Werecorded impairment charges of $0.1 million and $1.1 million during the years ended December 31, 2011 and2010, respectively, which are reflected in cost of revenues in the accompanying consolidated statements ofoperations. The impairment charges were allocated to the individual assets within the asset group on a pro-ratabasis using the relative carrying amounts of those assets.
As of December 31, 2011, approximately $1.6 million of our generation equipment was utilized in a certainopen market program. The recoverability of the carrying value of this generation equipment is largely dependenton the rates that we are compensated for our committed capacity within this program. These rates representmarket rates and can fluctuate based on the supply and demand of capacity. Although these market rates areestablished up to three years in advance of the service delivery, these market rates have not yet been establishedfor the entire remaining useful life of this generation equipment. In performing an impairment analysis, weestimate the expected future market rates based on current existing market rates and trends. A decline in theexpected future market rates of 10% by itself would not result in an impairment charge related to this generationequipment.
During the year ended December 31, 2010, we identified impairment indicators related to certain demandresponse equipment as a result of lower than estimated demand response event performance in certain demandresponse programs and the removal of demand response equipment from service during the year endedDecember 31, 2010. As a result of these impairment indicators, we recorded impairment charges of $0.6 millionduring the year ended December 31, 2010, presenting the difference between the carrying value and fair marketvalue of demand response equipment, which is included in cost of revenues in the accompanying consolidatedstatements of operations. The fair market value was determined utilizing Level 3 inputs, as defined by ASC 820,based on the projected future cash flows discounted using the estimated market participant rate of return for thistype of asset.
Software Development Costs
We capitalize eligible costs associated with software developed or obtained for internal use. We capitalizethe payroll and payroll-related costs of employees who devote time to the development of internal-use computersoftware. We amortize these costs on a straight-line basis over the estimated useful life of the software, which isgenerally two to three years. Our judgment is required in determining the point at which various projects enterthe stages at which costs may be capitalized, in assessing the ongoing value and impairment of the capitalizedcosts, and in determining the estimated useful lives over which the costs are amortized. Software developmentcosts of $3.2 million, $6.8 million and $4.2 million for the years ended December 31, 2011, 2010 and 2009,respectively, have been capitalized. We capitalized $1.3 million and $1.5 million during the years endedDecember 31, 2010 and 2009, respectively, related to a company-wide enterprise resource planning systemsimplementation project, which was placed into production in June 2011 and is being amortized over a five-yearuseful life.
Stock-Based Compensation
Our Amended and Restated 2003 Stock Option and Incentive Plan, which we refer to as the 2003 plan, andour Amended and Restated 2007 Employee, Director and Consultant Stock Plan, which we refer to as the 2007plan, provide for the grant of incentive stock options, nonqualified stock options, restricted and unrestricted stockawards and other stock-based awards to our eligible employees, directors and consultants. Options granted under
71
both the 2003 plan and the 2007 plan are exercisable for a period determined by us, but in no event longer thanten years from the date of the grant. Option awards are generally granted with an exercise price equal to themarket price of our common stock on the date of grant. Options, restricted stock awards and restricted stock unitawards generally vest ratably over four years, with certain exceptions. The 2003 plan expired upon our IPO inMay 2007. Any forfeitures under the 2003 plan that occurred after the effective date of the IPO are available forfuture grant under the 2007 plan up to a maximum of 1,000,000 shares. During the years ended December 31,2011, 2010, and 2009, we issued 18,211, 24,681, and 45,085 shares of our common stock, respectively, to certainexecutives to satisfy a portion of our compensation obligations to those individuals. As of December 31, 2011,1,713,410 shares were available for future grant under the 2007 plan.
For stock options granted prior to January 1, 2009, the fair value of each option was estimated at the date ofgrant using a Black-Scholes option-pricing model. For stock options granted on or after January 1, 2009, the fairvalue of each option is estimated on the date of grant using a lattice valuation model. The lattice model considerscharacteristics of fair value option pricing that are not available under the Black-Scholes model. Similar to theBlack-Scholes model, the lattice model takes into account variables such as expected volatility, dividend yieldrate, and risk free interest rate. However, in addition, the lattice model considers the probability that the optionwill be exercised prior to the end of its contractual life and the probability of termination or retirement of theoption holder in computing the value of the option. For these reasons, we believe that the lattice model provides afair value that is more representative of actual experience and future expected experience than the valuecalculated using the Black-Scholes model.
Volatility measures the amount that a stock price has fluctuated or is expected to fluctuate during aperiod. As there was no public market for our common stock prior to the effective date of the IPO, wedetermined volatility based on an analysis of reported data for a peer group of companies that issued options withsubstantially similar terms. The expected volatility of options granted has been determined using an average ofthe historical volatility measures of this peer group of companies, as well as the historical volatility of ourcommon stock beginning January 1, 2008. During the three months ended September 30, 2010, we determinedthat we had sufficient history to utilize company-specific volatility in accordance with ASC 718, StockCompensation, or ASC 718, and we are now calculating volatility using a component of implied volatility andhistorical volatility to determine the value of share-based payments. The risk-free interest rate is the rateavailable as of the option date on zero-coupon United States government issues with a term equal to the expectedlife of the option. We have not paid dividends on our common stock in the past and do not plan to pay anydividends in the foreseeable future. In addition, the terms of the 2011 credit facility preclude us from payingdividends. During the year ended December 31, 2011, we updated our estimated exit rate pre-vesting and post-vesting applied to options, restricted stock and restricted stock units based on an evaluation of demographics ofour employee groups and historical forfeitures for these groups in order to determine our option valuations aswell as our stock-based compensation expense. The changes in estimate of the volatility, exit rate pre-vesting andexit rate post-vesting did not have a material impact on our stock-based compensation expense recorded in theaccompanying consolidated statements of operations for the year ended December 31, 2011.
The amount of stock-based compensation expense recognized during a period is based on the value of theportion of the awards that are ultimately expected to vest. ASC 718 requires forfeitures to be estimated at thetime of grant and revised, if necessary, in subsequent periods if actual forfeitures differ from those estimates. Theterm “forfeitures” is distinct from “cancellations” or “expirations” and represents only the unvested portion of thesurrendered option. We have determined a forfeiture rate of 8.0% as of December 31, 2011. Ultimately, theactual expense recognized over the vesting period will only be for those awards that vest.
For the years ended December 31, 2011, 2010 and 2009, we recorded expenses of approximately$13.5 million, $15.7 million and $13.1 million, respectively, in connection with share-based payment awards toemployees and non-employees. With respect to option grants through December 31, 2011, a future expense ofnon-vested options of approximately $4.4 million is expected to be recognized over a weighted average period of2.0 years. For non-vested restricted stock and restricted stock units subject to service-based vesting conditionsoutstanding as of December 31, 2011, we had $11.2 million of unrecognized stock-based compensation expense,which is expected to be recognized over a weighted average 2.7 years. For non-vested restricted stock subject to
72

performance-based vesting conditions outstanding as of December 31, 2011 and that were probable of vesting asof December 31, 2011, we had $2.5 million of unrecognized stock-based compensation expense, which isexpected to be recognized over a weighted average period of 2.1 years. For non-vested restricted stock subject toperformance-based vesting conditions outstanding as of December 31, 2011 and that were not probable ofvesting as of December 31, 2011, we had $3.1 million of unrecognized stock-based compensation expense.
For awards with graded vesting, we allocate compensation costs on a straight-line basis over the requisiteservice period. Accordingly, we amortized the fair value of each award over each award’s service period, whichis generally the vesting period.
Our accounting for stock options issued to non-employees requires valuing and remeasuring such stockoptions to the current fair value until the performance date has been reached. Stock-based compensation expenserecorded for the years ended December 31, 2011, 2010 and 2009 related to stock options to non-employees wasnot material.
Accounting for Income Taxes
We use the asset and liability method for accounting for income taxes. Under this method, we determinedeferred tax assets and liabilities based on the difference between financial reporting and taxes bases of ourassets and liabilities. We measure deferred tax assets and liabilities using enacted tax rates and laws that will bein effect when we expect the differences to reverse.
We have incurred consolidated net losses since our inception and as a result, we had not recognized netUnited States deferred taxes as of December 31, 2011 or December 31, 2010. Our deferred tax liabilitiesprimarily relate to deferred taxes associated with our acquisitions and property and equipment. Our deferred taxassets relate primarily to net operating loss carryforwards, accruals and reserves, and stock-based compensation.We record a valuation allowance to reduce our deferred tax assets to the amount that is more likely than not to berealized. While we have considered future taxable income and ongoing prudent and feasible tax planningstrategies in assessing the need for the valuation allowance, in the event we were to determine that we would beable to realize our deferred tax assets in the future in excess of the net recorded amount, an adjustment to thedeferred tax asset would increase income in the period such determination was made.
In accordance with ASC 740, Income Taxes, or ASC 740, we are required to evaluate uncertainty in incometaxes recognized in our financial statements (formerly FASB Interpretation No. 48, Accounting for Uncertainty inIncome Taxes — an interpretation of FASB Statement No. 109). ASC 740 prescribes a recognition threshold andmeasurement criteria for the financial statement recognition and measurement of a tax position taken or expected tobe taken in a tax return. ASC 740 also provides guidance on derecognition, classification, interest and penalties,accounting in interim periods, disclosure, and transition and defines the criteria that must be met for the benefits of atax position to be recognized.
We had no unrecognized tax benefits as of December 31, 2011 and 2010.
In the ordinary course of global business, there are many transactions and calculations where the ultimatetax outcome is uncertain. Judgment is required in determining our worldwide income tax provision. In ouropinion, it is not required that we have a provision for income taxes for any years subject to audit. Although webelieve our estimates are reasonable, no assurance can be given that the final tax outcome of matters will not bedifferent than that which is reflected in our historical income tax provisions and accruals. In the event ourassumptions are incorrect, the differences could have a material impact on our income tax provision andoperating results in the period in which such determination is made.
Recent Accounting Pronouncements
Intangibles — Goodwill and Other
In September 2011, the FASB issued ASU 2011-08, Intangibles — Goodwill and Other (Topic 350):Testing Goodwill for Impairment, or ASU 2011-08, which gives companies the option to first perform a
73

qualitative assessment to determine whether it is more likely than not that the fair value of a reporting unit is lessthan its carrying amount. If a company concludes that this is the case, it must perform the two-step test.Otherwise, a company can forgo the two-step test. ASU 2011-08 is effective for fiscal years that begin afterDecember 15, 2011; however, early adoption is permitted. We are currently evaluating the impact of ASU2011-08, including whether we will early adopt. We do not expect the adoption of ASU 2011-08 to have amaterial impact on our financial condition or results of operations.
Amendments to Achieve Common Fair Value Measurement and Disclosure Requirements in U.S. GAAP andIFRS
In May 2011, the FASB issued ASU 2011-04, Amendments to Achieve Common Fair Value Measurementand Disclosure Requirements in U.S. GAAP and IFRS, or ASU 2011-04, which amends FASB’s accountingguidance related to fair value measurements in order to more closely align its disclosure requirements with thosein International Financial Reporting Standards. ASU 2011-04 clarifies the application of existing fair valuemeasurement and disclosure requirements and also changes certain principles or requirements for measuring fairvalue or for disclosing information about fair value measurements. ASU 2011-04 is effective for interim andannual periods beginning after December 15, 2011. The adoption of ASU 2011-04 is not expected to have amaterial effect on our financial condition or results of operations.
Presentation of Comprehensive Income
In June 2011, the FASB issued ASU 2011-05, Presentation of Comprehensive Income, or ASU 2011-05,which represents new accounting guidance related to the presentation of other comprehensive income (OCI).ASU 2011-05 eliminates the option to present components of OCI as part of the statement of changes inshareholders’ equity, which is the option that we currently use to present OCI. ASU 2011-05 allows for aone-statement or two-statement approach, outlined as follows:
• One-statement approach: present the components of net income and total net income, the components ofOCI and a total for OCI, along with the total of comprehensive income in a single continuous statement.
• Two-statement approach: present the components of net income and total net income in the statement ofnet income. A statement of OCI would immediately follow the statement of net income and include thecomponents of OCI and a total for OCI, along with the total of comprehensive income.
ASU 2011-05 also required an entity to present on the face of the financial statements any reclassificationadjustments for items that are reclassified from OCI to net income (see below). ASU 2011-05 is effective forinterim and annual periods beginning after December 15, 2011.
In December 2011, the FASB issued ASU 2011-12, Comprehensive Income (Topic 220): Deferral of theEffective Date for Amendments to the Presentation of Reclassifications of Items Out of Accumulated OtherComprehensive Income in Accounting Standards Update No. 2011-05, or ASU 2011-12. ASU 2011-12 defersonly those changes in ASU 2011-05 that related to the presentation of reclassification adjustments andsupersedes only those paragraphs that pertain to how and where reclassification adjustments are presented. Allother requirements in ASU 2011-05 are not affected by ASU 2011-12, including the requirement to reportcomprehensive income either in a single continuous financial statement or in two separate but consecutivefinancial statements, effective for interim and annual periods beginning after December 15, 2011.
The adoption of ASU 2011-05 and ASU 2011-12 will not have an effect on our financial condition or resultsof operations, but will only impact how certain information related to how OCI is presented in the consolidatedfinancial statements.
74

Selected Quarterly Financial Data (Unaudited)
The table below sets forth selected unaudited quarterly financial information. The information is derivedfrom our unaudited consolidated financial statements and includes, in the opinion of management, all normal andrecurring adjustments that management considers necessary for a fair statement of results for such periods. Theoperating results for any quarter are not necessarily indicative of results for any future period. The amounts in thetable and footnote are in thousands except for per share data.
Year Ended December 31, 2011 1st Qtr 2nd Qtr 3rd Qtr 4th Qtr(1)
(In thousands, except per share data)
Revenues . . . . . . . . . . . . . . . . . . . . . . . . . . . . . . . . . . $ 31,762 $ 58,904 $169,183 $ 26,759Gross profit . . . . . . . . . . . . . . . . . . . . . . . . . . . . . . . . 12,561 20,377 84,832 5,627Operating expenses . . . . . . . . . . . . . . . . . . . . . . . . . . 31,132 32,869 33,861 35,072(Loss) Income from operations . . . . . . . . . . . . . . . . . (18,571) (12,492) 50,971 (29,445)Net (loss) income . . . . . . . . . . . . . . . . . . . . . . . . . . . (19,272) (12,973) 46,878 (28,016)
Basic net (loss) income per share: . . . . . . . . . . . . . $ (0.76) $ (0.51) $ 1.83 $ (1.08)Diluted net (loss) income per share: . . . . . . . . . . . $ (0.76) $ (0.51) $ 1.77 $ (1.08)
Year Ended December 31, 2010 1st Qtr 2nd Qtr 3rd Qtr 4th Qtr
(In thousands, except per share data)
Revenues . . . . . . . . . . . . . . . . . . . . . . . . . . . . . . . . . . $ 28,121 $ 66,548 $162,798 $ 22,690Gross profit . . . . . . . . . . . . . . . . . . . . . . . . . . . . . . . . 9,575 28,992 77,736 4,022Operating expenses . . . . . . . . . . . . . . . . . . . . . . . . . . 24,920 27,177 29,938 27,074(Loss) Income from operations . . . . . . . . . . . . . . . . . (15,345) 1,815 47,798 (23,052)Net (loss) income . . . . . . . . . . . . . . . . . . . . . . . . . . . (14,200) 1,078 43,866 (21,167)
Basic net (loss) income per share: . . . . . . . . . . . . . $ (0.59) $ 0.04 $ 1.76 $ (0.86)Diluted net (loss) income per share: . . . . . . . . . . . $ (0.59) $ 0.04 $ 1.67 $ (0.86)
(1) During the fourth quarter of the year ended December 31, 2011, we recorded an adjustment to increase to ouraccrued capacity payments as of December 31, 2011 by approximately $1,719, with a corresponding chargerecorded to cost of sales in the fourth quarter of 2011 relating to payments owed to C&I customers enrolledin demand response programs that were not properly accounted for during second and third quarters of 2011.Of this $1,719 adjustment, approximately $1,419 and $ 300 related to the second and third quarters of 2011,respectively. In addition, we recorded certain other adjustments in the fourth quarter of 2011 resulting in anet charge to operating income of approximately $539 that should have been recorded in prior interim and/orannual periods.
In accordance with SEC Staff Accounting Bulletin (SAB) No. 99, Materiality, and SAB No. 108, we assessed themateriality of these corrections, individually and in aggregate, on our consolidated financial statements for theyears ended December 31, 2011, 2010 and 2009 and each of the quarters within those years, using both the roll-over and iron-curtain approaches described in SAB No. 108. We concluded the effect of these errors was notmaterial to our consolidated financial statements for any of the periods and, as such, these consolidated financialstatements are not materially misstated. As a result, we recorded these adjustments totaling $2,258 in the con-solidated statement of operations for the three months ended December 31, 2011.
Item 7A. Quantitative and Qualitative Disclosure About Market Risk
Financial Instruments, Other Financial Instruments, and Derivative Commodity Instruments
ASC 825, Financial Instruments (formerly SFAS No. 107, Disclosure of Fair Value of FinancialInstruments), requires disclosure about fair value of financial instruments. Financial instruments principallyconsist of cash equivalents, marketable securities, accounts receivable, and debt obligations. The fair value ofthese financial instruments approximates their carrying amount.
75

Foreign Currency Exchange Risk
Our international business is subject to risks, including, but not limited to unique economic conditions, changesin political climate, differing tax structures, other regulations and restrictions, and foreign exchange rate volatility.Accordingly, our future results could be materially adversely impacted by changes in these or other factors.
A substantial majority of our foreign expense and sales activities are transacted in local currencies,including Australian dollars, British pounds, Canadian dollars and New Zealand dollars. In addition, our foreignsales are denominated in local currencies. Fluctuations in the foreign currency rates could affect our sales, cost ofrevenues and profit margins and could result in exchange losses. In addition, currency devaluations can result ina loss if we maintain deposits in a foreign currency. During each of the years ended December 31, 2011, 2010and 2009, less than 10% of our sales were generated outside the United States.
The operating expenses of our international subsidiaries that are incurred in local currencies did not have amaterial adverse effect on our business, results of operations or financial condition for the year endedDecember 31, 2011 and we do not expect that they will have a material effect on our business, results ofoperations or financial condition for the year ending December 31, 2012. Our operating results and certain assetsand liabilities that are denominated in foreign currencies are affected by changes in the relative strength of theU.S. dollar against the applicable foreign currency. Our expenses denominated in foreign currencies arepositively affected when the U.S. dollar strengthens against the applicable foreign currency and adverselyaffected when the U.S. dollar weakens.
During the years ended December 31, 2011, 2010 and 2009, we incurred foreign exchange losses of$1.6 million, $0.1 million and less than $0.1 million, respectively. The significant increase in losses arising fromtransactions denominated in foreign currencies for the year ended December 31, 2011 as compared to the sameperiods in 2010 and 2009, was due to the significant increase of foreign denominated intercompany receivablesheld by us from one of our Australian subsidiaries primarily as a result of the funding provided to complete theacquisition of Energy Response in July 2011 and the strengthening of the U.S. dollar as compared to theAustralian dollar from the date of acquisition through December 31, 2011. During the years ended December 31,2011, 2010 and 2009, there were no material realized losses incurred related to transactions denominated inforeign currencies. As of December 31, 2011, we had an intercompany receivable from our Australian subsidiarythat is denominated in Australian dollars and not deemed to be of a “long-term investment” nature totaling$33.7 million, or $33.1 million Australian.
A hypothetical 10% increase or decrease in foreign currencies that we transact in would not have a materialadverse effect on our financial condition or results of operations other than the impact on the unrealized gain(loss) on the intercompany receivable held by us from our Australian subsidiary that is denominated in Australiandollars, for which a hypothetical 10% increase or decrease in the foreign currency would result in an incremental$3.4 million gain or loss.
We currently do not have a program in place that is designed to mitigate our exposure to changes in foreigncurrency exchange rates. We are evaluating certain potential programs, including the use of derivative financialinstruments to reduce our exposure to a reduction in U.S. dollar value and the volatility of future cash flowscaused by changes in currency exchange rates. The utilization of forward foreign currency contracts wouldreduce, but would not eliminate, the impact of currency exchange rate movements.
Interest Rate Risk
As of December 31, 2011, we had no outstanding debt under the 2011 credit facility.
The recent market events have not required us to materially modify or change our financial riskmanagement strategies with respect to our exposure to interest rate risk.
We manage our cash and cash equivalents portfolio considering investment opportunities and risks, taxconsequences and overall financing strategies. Our investment portfolio consists primarily of cash and cashequivalents, money market funds, and commercial paper. We have, in the past, held municipal auction rate
76

securities that have since been redeemed. As our investments are made with highly rated securities, we are notanticipating any significant impact in the short term from a change in interest rates.
Item 8. Financial Statements and Supplementary Data
All financial statements and schedules required to be filed hereunder are included as Appendix A hereto andincorporated into this Annual Report on Form 10-K by reference.
Item 9. Changes in and Disagreements With Accountants on Accounting and Financial Disclosure
None.
Item 9A. Controls and Procedures
Disclosure Controls and Procedures.
Our principal executive officer and principal financial officer, after evaluating the effectiveness of ourdisclosure controls and procedures (as defined in Exchange Act Rules 13a-15(e) and 15d-15(e)) as of the end ofthe period covered by this Annual Report on Form 10-K, have concluded that, based on such evaluation, ourdisclosure controls and procedures were effective to ensure that information required to be disclosed by us in thereports that we file or submit under the Exchange Act is recorded, processed, summarized and reported, withinthe time periods specified in the SEC’s rules and forms, and is accumulated and communicated to ourmanagement, including our principal executive and principal financial officers, or persons performing similarfunctions, as appropriate to allow timely decisions regarding required disclosure.
Management’s Annual Report on Internal Control Over Financial Reporting
Our management is responsible for establishing and maintaining adequate internal control over financialreporting. Internal control over financial reporting is defined in Rule 13a-15(f) and 15d-15(f) under the ExchangeAct as a process designed by, or under the supervision of, our principal executive and principal financial officersand effected by our board of directors, management and other personnel, to provide reasonable assuranceregarding the reliability of financial reporting and the preparation of financial statements for external purposes inaccordance with generally accepted accounting principles, and includes those policies and procedures that:
• pertain to the maintenance of records that in reasonable detail accurately and fairly reflect the transactionsand dispositions of our assets;
• provide reasonable assurance that transactions are recorded as necessary to permit preparation of financialstatements in accordance with generally accepted accounting principles, and that our receipts andexpenditures are being made only in accordance with authorization of our management and directors: and
• provide reasonable assurance regarding prevention or timely detection of unauthorized acquisition, use ordisposition of our assets that could have a material effect on the financial statements.
Because of its inherent limitations, internal control over financial reporting may not prevent or detectmisstatements. Projections of any evaluation of effectiveness to future periods are subject to the risk that controlsmay become inadequate because of changes in conditions, or that the degree of compliance with the policies andprocedures may deteriorate.
Our management assessed the effectiveness of our internal control over financial reporting as ofDecember 31, 2011. In making this assessment, management used the criteria set forth by the Internal Control —Integrated Framework issued by the Committee of Sponsoring Organizations of the Treadway Commission, orthe COSO criteria.
Our assessment of and conclusion regarding the effectiveness of our internal control over financial reportingdid not include the internal controls of Global Energy Partners, Inc., a business we acquired in January 2011,M2M Communications Corporation, a business we acquired in January 2011, and Energy Response Holdings Pty
77

Ltd, a business we acquired in July 2011. The results of operations of Global Energy Partners, Inc., M2MCommunications Corporation and Energy Response Holdings Pty Ltd are included in our consolidated financialstatements from the dates of acquisition through December 31, 2011 and constituted approximately $24.3 millionand $12.4 million of total and net assets, respectively, as of December 31, 2011, and approximately $17.3 millionand $11.4 million of revenues and net loss, respectively, for the year ended December 31, 2011.
Based on this assessment, management believes that, as of December 31, 2011, our internal control overfinancial reporting was effective at a reasonable assurance level based on these criteria.
Ernst & Young LLP, the independent registered public accounting firm that audited our consolidatedfinancial statements included elsewhere in this Annual Report on Form 10-K, has issued an attestation report onour internal control over financial reporting. That report appears below in this Item 9A under the heading “Reportof Independent Registered Public Accounting Firm.”
Changes in Internal Control Over Financial Reporting
As a result of our recent acquisitions, we have begun to integrate certain business processes and systems.Accordingly, certain changes have been made and will continue to be made to our internal controls over financialreporting until such time as these integrations are complete. There have been no other changes in our internalcontrol over financial reporting that occurred during the period covered by this report that have materiallyaffected, or are reasonably likely to materially affect, our internal control over financial reporting.
78

REPORT OF INDEPENDENT REGISTERED PUBLIC ACCOUNTING FIRM
The Board of Directors and Stockholders of EnerNOC, Inc.
We have audited EnerNOC, Inc.’s internal control over financial reporting as of December 31, 2011, basedon criteria established in Internal Control — Integrated Framework issued by the Committee of SponsoringOrganizations of the Treadway Commission (the COSO criteria). EnerNOC, Inc.’s management is responsiblefor maintaining effective internal control over financial reporting, and for its assessment of the effectiveness ofinternal control over financial reporting included in the accompanying Management’s Annual Report on InternalControl Over Financial Reporting. Our responsibility is to express an opinion on the Company’s internal controlover financial reporting based on our audit.
We conducted our audit in accordance with the standards of the Public Company Accounting OversightBoard (United States). Those standards require that we plan and perform the audit to obtain reasonable assuranceabout whether effective internal control over financial reporting was maintained in all material respects. Ouraudit included obtaining an understanding of internal control over financial reporting, assessing the risk that amaterial weakness exists, testing and evaluating the design and operating effectiveness of internal control basedon the assessed risk, and performing such other procedures as we considered necessary in the circumstances. Webelieve that our audit provides a reasonable basis for our opinion.
A company’s internal control over financial reporting is a process designed to provide reasonable assuranceregarding the reliability of financial reporting and the preparation of financial statements for external purposes inaccordance with generally accepted accounting principles. A company’s internal control over financial reportingincludes those policies and procedures that (1) pertain to the maintenance of records that, in reasonable detail,accurately and fairly reflect the transactions and dispositions of the assets of the company; (2) provide reasonableassurance that transactions are recorded as necessary to permit preparation of financial statements in accordancewith generally accepted accounting principles, and that receipts and expenditures of the company are being madeonly in accordance with authorizations of management and directors of the company; and (3) provide reasonableassurance regarding prevention or timely detection of unauthorized acquisition, use, or disposition of thecompany’s assets that could have a material effect on the financial statements.
Because of its inherent limitations, internal control over financial reporting may not prevent or detectmisstatements. Also, projections of any evaluation of effectiveness to future periods are subject to the risk thatcontrols may become inadequate because of changes in conditions, or that the degree of compliance with thepolicies or procedures may deteriorate.
As indicated in the accompanying Management’s Annual Report on Internal Control Over FinancialReporting, management’s assessment of and conclusion on the effectiveness of internal control over financialreporting did not include the internal controls of Global Energy Partners, Inc., M2M CommunicationsCorporation, or Energy Response Holdings Pty Ltd, which are included in the 2011 consolidated financialstatements of EnerNOC, Inc. and constituted approximately $24.3 million and $12.4 million of total and netassets, respectively, as of December 31, 2011 and $17.3 million and $11.4 million of revenues and net loss,respectively, for the year then ended. Our audit of internal control over financial reporting of EnerNOC, Inc. alsodid not include an evaluation of the internal control over financial reporting of Global Energy Partners, Inc.,M2M Communications Corporation, or Energy Response Holdings Pty Ltd.
In our opinion, EnerNOC, Inc. maintained, in all material respects, effective internal control over financialreporting as of December 31, 2011, based on the COSO criteria.
We also have audited, in accordance with the standards of the Public Company Accounting Oversight Board(United States), the consolidated balance sheets as of December 31, 2011 and 2010, and the related consolidatedstatements of operations, changes in stockholders’ equity and comprehensive (loss) income, and cash flows foreach of the three years in the period ended December 31, 2011 of EnerNOC, Inc. and our report dated March 15,2012 expressed an unqualified opinion thereon.
/s/ Ernst & Young LLP
Boston, MassachusettsMarch 15, 2012
79

Item 9B. Other Information
On April 15, 2011, we and ENOC Securities Corporation, one of our subsidiaries, entered into a$75.0 million senior secured revolving credit facility pursuant to a credit agreement with a certain financialinstitution and Silicon Valley Bank, or SVB, which was subsequently amended in June 2011, November 2011and December 2011. We refer to this agreement as the 2011 credit facility.
On March 14, 2012, we and ENOC Securities Corporation amended and restated the 2011 credit facility,which we refer to as the amended and restated 2011 credit facility. The amended and restated 2011 credit facility,under which SVB became the sole lender, decreased our borrowing limit from $75.0 million to $50.0 million, aswell as modified certain of the our financial covenant compliance requirements. The material changes in theamended and restated 2011 credit facility to our monthly and quarterly financial covenants include:
• a decrease in our quarterly financial covenant related to minimum earnings levels and a change in thecalculation, which is now based on earnings before depreciation and amortization expense, interestexpense, provision for income taxes, stock-based compensation expense, rent expense, certain impairmentcharges and certain other non-cash charges over a trailing twelve month period;
• amendment to our monthly financial covenant related to maintenance of a minimum specified ratio ofcurrent assets to current liabilities reducing our required minimum of unrestricted cash from $50 millionto $30 million for certain periods; and
• elimination of the quarterly financial covenant related to maintenance of a minimum specified fixedcharge coverage ratio.
The interest on revolving loans under the amended and restated 2011 credit facility will accrue, at ourelection, at either (i) the Eurodollar Rate with respect to the relevant interest period plus 2.0% or (ii) the ABR(defined as the highest of (x) the “prime rate” as quoted in the Wall Street Journal, (y) the Federal FundsEffective Rate plus 0.50% and (z) LIBOR plus 1.00%) plus 1.50%. The amended and restated credit facilityterminates and all amounts outstanding thereunder are due and payable in full on April 15, 2013.
All other terms of the 2011 credit facility, including the negative covenant restrictions in and collateralsecuring such facility, remained substantially unchanged. The foregoing summary of the amended and restated2011 credit facility does not purport to be complete and is qualified in its entirety by reference to the amendedand restated 2011 credit facility, which will be filed as an exhibit to our Quarterly Report on Form 10-Q for thequarter ending March 31, 2012.
PART III
Item 10. Directors, Executive Officers and Corporate Governance
The information required by this Item will be contained in our definitive proxy statement for our 2012Annual Meeting of Stockholders under the captions “Directors and Executive Officers,” “Corporate Governanceand Board Matters,” “Corporate Code of Conduct and Ethics” and “Section 16(a) Beneficial OwnershipReporting Compliance” and is incorporated by reference herein.
Item 11. Executive Compensation
The information required by this Item will be contained in our definitive proxy statement for our 2012Annual Meeting of Stockholders under the captions “Compensation Discussion and Analysis,” “CorporateGovernance and Board Matters” and “Compensation Committee Report” and is incorporated by reference herein.
80

Item 12. Security Ownership of Certain Beneficial Owners and Management and Related StockholderMatters
The information required by this Item will be contained in our definitive proxy statement for our 2012Annual Meeting of Stockholders under the captions “Compensation Discussion and Analysis,” “EquityCompensation Plan Information” and “Security Ownership of Certain Beneficial Owners and Management” andis incorporated by reference herein.
Item 13. Certain Relationships and Related Transactions, and Director Independence
The information required by this Item will be contained in our definitive proxy statement for our 2012Annual Meeting of Stockholders under the captions “Certain Relationships and Related Transactions” and“Corporate Governance and Board Matters” and is incorporated by reference herein.
Item 14. Principal Accounting Fees and Services
The information required by this Item will be contained in our definitive proxy statement for our 2012Annual Meeting of Stockholders under the caption “Proposal Two — Ratification of Appointment ofIndependent Registered Public Accounting Firm” and is incorporated by reference herein.
PART IV
Item 15. Exhibits, Financial Statement Schedules
(a) The following are filed as part of this Annual Report on Form 10-K:
1. Financial Statements
The following consolidated financial statements beginning on page F-1 of Appendix A are included in thisAnnual Report on Form 10-K:
• Report of Independent Registered Public Accounting Firm
• Consolidated Balance Sheets as of December 31, 2011 and 2010
• Consolidated Statements of Operations for the Years ended December 31, 2011, 2010 and 2009
• Consolidated Statements of Changes in Stockholders’ Equity and Comprehensive (Loss) Income for theYears ended December 31, 2011, 2010 and 2009
• Consolidated Statements of Cash Flows for the Years ended December 31, 2011, 2010 and 2009
• Notes to the Consolidated Financial Statements
(b) Exhibits
The exhibits listed in the Exhibit Index immediately preceding the exhibits are filed with or incorporated byreference in this Annual Report on Form 10-K.
(c) Financial Statement Schedules
All other schedules have been omitted since the required information is not present, or not present inamounts sufficient to require submission of the schedule, or because the information required is included in theconsolidated financial statements or the Notes thereto.
81

SIGNATURES
Pursuant to the requirements of Section 13 or 15(d) of the Securities Exchange Act of 1934, the registranthas duly caused this report to be signed on its behalf by the undersigned, thereunto duly authorized.
EnerNOC, Inc.
Date: March 15, 2012 By: /S/ TIMOTHY G. HEALY
Name: Timothy G. HealyTitle: Chairman of the Board and
Chief Executive Officer
Pursuant to the requirements of the Securities Exchange Act of 1934, this report has been signed below bythe following persons on behalf of the registrant and in the capacities and on the dates indicated.
Signature Title Date
/S/ TIMOTHY G. HEALY
Timothy G. Healy
Chairman of the Board,Chief Executive Officer and Director
(principal executive officer)
March 15, 2012
/S/ TIMOTHY WELLER
Timothy Weller
Chief Financial Officer and Treasurer(principal financial officer)
March 15, 2012
/S/ KEVIN J. BLIGH
Kevin J. Bligh
Chief Accounting Officer(principal accounting officer)
March 15, 2012
/S/ DAVID B. BREWSTER
David B. Brewster
Director and President March 15, 2012
/S/ ARTHUR W. COVIELLO, JR.
Arthur W. Coviello, Jr.
Director March 15, 2012
/S/ RICHARD DIETER
Richard Dieter
Director March 15, 2012
/S/ TJ GLAUTHIER
TJ Glauthier
Director March 15, 2012
/S/ SUSAN F. TIERNEY
Susan F. Tierney, Ph.D.
Director March 15, 2012
82

APPENDIX A
EnerNOC, Inc.
INDEX TO CONSOLIDATED FINANCIAL STATEMENTS
Page
Consolidated Financial Statements of EnerNOC, Inc.:Report of Independent Registered Public Accounting Firm . . . . . . . . . . . . . . . . . . . . . . . . . . . . . . . . . . . . . . F-2
Consolidated Balance Sheets as of December 31, 2011 and 2010 . . . . . . . . . . . . . . . . . . . . . . . . . . . . . . . . . . F-3
Consolidated Statements of Operations for the Years Ended December 31, 2011, 2010 and 2009 . . . . . . . . F-4
Consolidated Statements of Changes in Stockholders’ Equity and Comprehensive (Loss) Income for theYears Ended December 31, 2011, 2010 and 2009 . . . . . . . . . . . . . . . . . . . . . . . . . . . . . . . . . . . . . . . . . . . . F-5
Consolidated Statements of Cash Flows for the Years Ended December 31, 2011, 2010 and 2009 . . . . . . . . F-6
Notes to Consolidated Financial Statements . . . . . . . . . . . . . . . . . . . . . . . . . . . . . . . . . . . . . . . . . . . . . . . . . . F-7
F-1

Report of Independent Registered Public Accounting Firm
The Board of Directors and Stockholders of EnerNOC, Inc.
We have audited the accompanying consolidated balance sheets of EnerNOC, Inc. as of December 31, 2011and 2010, and the related consolidated statements of operations, changes in stockholders’ equity andcomprehensive (loss) income, and cash flows for each of the three years in the period ended December 31, 2011.These financial statements are the responsibility of the Company’s management. Our responsibility is to expressan opinion on these financial statements based on our audits.
We conducted our audits in accordance with the standards of the Public Company Accounting OversightBoard (United States). Those standards require that we plan and perform the audit to obtain reasonable assuranceabout whether the financial statements are free of material misstatement. An audit includes examining, on a testbasis, evidence supporting the amounts and disclosures in the financial statements. An audit also includesassessing the accounting principles used and significant estimates made by management, as well as evaluatingthe overall financial statement presentation. We believe that our audits provide a reasonable basis for ouropinion.
In our opinion, the financial statements referred to above present fairly, in all material respects, theconsolidated financial position of EnerNOC, Inc. at December 31, 2011 and 2010, and the consolidated results ofits operations and its cash flows for each of the three years in the period ended December 31, 2011, in conformitywith U.S. generally accepted accounting principles.
We also have audited, in accordance with the standards of the Public Company Accounting Oversight Board(United States), EnerNOC, Inc.’s internal control over financial reporting as of December 31, 2011, based oncriteria established in the Internal Control-Integrated Framework issued by the Committee of SponsoringOrganizations of the Treadway Commission and our report dated March 15, 2012 expressed an unqualifiedopinion thereon.
/s/ Ernst & Young LLP
Boston, MassachusettsMarch 15, 2012
F-2

EnerNOC, Inc.
CONSOLIDATED BALANCE SHEETS(in thousands, except par value and share data)
December 31,
2011 2010
AssetsCurrent assets
Cash and cash equivalents . . . . . . . . . . . . . . . . . . . . . . . . . . . . . . . . . . . . . . . . . . . . . . . . . . . . . $ 87,297 $153,416Restricted cash . . . . . . . . . . . . . . . . . . . . . . . . . . . . . . . . . . . . . . . . . . . . . . . . . . . . . . . . . . . . . . 158 1,537Trade accounts receivable, net of allowance for doubtful accounts of $192 and $150 at
December 31, 2011 and 2010, respectively . . . . . . . . . . . . . . . . . . . . . . . . . . . . . . . . . . . . . . 24,525 22,137Unbilled revenue . . . . . . . . . . . . . . . . . . . . . . . . . . . . . . . . . . . . . . . . . . . . . . . . . . . . . . . . . . . . 64,448 73,144Prepaid expenses, deposits and other current assets . . . . . . . . . . . . . . . . . . . . . . . . . . . . . . . . . . 26,723 6,707
Total current assets . . . . . . . . . . . . . . . . . . . . . . . . . . . . . . . . . . . . . . . . . . . . . . . . . . . . . . . . . 203,151 256,941Property and equipment, net of accumulated depreciation of $51,400 and $36,309 at
December 31, 2011 and 2010, respectively . . . . . . . . . . . . . . . . . . . . . . . . . . . . . . . . . . . . . . 36,636 34,690Goodwill . . . . . . . . . . . . . . . . . . . . . . . . . . . . . . . . . . . . . . . . . . . . . . . . . . . . . . . . . . . . . . . . . . . 79,213 24,653Customer relationship intangible assets, net of accumulated amortization of $5,286 and
$1,016 at December 31, 2011 and 2010, respectively . . . . . . . . . . . . . . . . . . . . . . . . . . . . . . 26,993 2,494Other definite-lived intangible assets, net of accumulated amortization of $3,591 and $2,095
at December 31, 2011 and 2010, respectively . . . . . . . . . . . . . . . . . . . . . . . . . . . . . . . . . . . . 5,524 3,329Indefinite-lived intangible assets . . . . . . . . . . . . . . . . . . . . . . . . . . . . . . . . . . . . . . . . . . . . . . . . — 920Deposits and other assets . . . . . . . . . . . . . . . . . . . . . . . . . . . . . . . . . . . . . . . . . . . . . . . . . . . . . . 4,291 2,872
Total assets . . . . . . . . . . . . . . . . . . . . . . . . . . . . . . . . . . . . . . . . . . . . . . . . . . . . . . . . . . . . . . . $355,808 $325,899
Liabilities and Stockholders’ EquityCurrent liabilities
Accounts payable . . . . . . . . . . . . . . . . . . . . . . . . . . . . . . . . . . . . . . . . . . . . . . . . . . . . . . . . . . . . $ 2,335 $ 111Accrued capacity payments . . . . . . . . . . . . . . . . . . . . . . . . . . . . . . . . . . . . . . . . . . . . . . . . . . . . 58,332 65,792Accrued payroll and related expenses . . . . . . . . . . . . . . . . . . . . . . . . . . . . . . . . . . . . . . . . . . . . 11,937 11,135Accrued expenses and other current liabilities . . . . . . . . . . . . . . . . . . . . . . . . . . . . . . . . . . . . . . 6,107 9,307Accrued performance adjustments . . . . . . . . . . . . . . . . . . . . . . . . . . . . . . . . . . . . . . . . . . . . . . . 6,045 —Accrued acquisition contingent consideration . . . . . . . . . . . . . . . . . . . . . . . . . . . . . . . . . . . . . . — 1,500Deferred revenue . . . . . . . . . . . . . . . . . . . . . . . . . . . . . . . . . . . . . . . . . . . . . . . . . . . . . . . . . . . . 12,556 5,540Current portion of long-term debt . . . . . . . . . . . . . . . . . . . . . . . . . . . . . . . . . . . . . . . . . . . . . . . — 37
Total current liabilities . . . . . . . . . . . . . . . . . . . . . . . . . . . . . . . . . . . . . . . . . . . . . . . . . . . . . . 97,312 93,422Long-term liabilities
Deferred acquisition consideration . . . . . . . . . . . . . . . . . . . . . . . . . . . . . . . . . . . . . . . . . . . . . . . 500 —Accrued acquisition contingent consideration, long term . . . . . . . . . . . . . . . . . . . . . . . . . . . . . 336 —Deferred tax liability . . . . . . . . . . . . . . . . . . . . . . . . . . . . . . . . . . . . . . . . . . . . . . . . . . . . . . . . . . 2,646 1,141Deferred revenue, long-term . . . . . . . . . . . . . . . . . . . . . . . . . . . . . . . . . . . . . . . . . . . . . . . . . . . 6,810 4,696Other liabilities . . . . . . . . . . . . . . . . . . . . . . . . . . . . . . . . . . . . . . . . . . . . . . . . . . . . . . . . . . . . . . 464 514
Total long-term liabilities . . . . . . . . . . . . . . . . . . . . . . . . . . . . . . . . . . . . . . . . . . . . . . . . . . . . 10,756 6,351Commitments and contingencies (Note 7 and Note 12) . . . . . . . . . . . . . . . . . . . . . . . . . . . . . . . . . — —Stockholders’ equity
Undesignated preferred stock, $0.001 par value; 5,000,000 shares authorized; no sharesissued . . . . . . . . . . . . . . . . . . . . . . . . . . . . . . . . . . . . . . . . . . . . . . . . . . . . . . . . . . . . . . . . . . . — —
Common stock, $0.001 par value; 50,000,000 shares authorized, 27,306,548 and 25,155,067shares issued and outstanding at December 31, 2011 and 2010, respectively . . . . . . . . . . . . . . 27 25
Additional paid-in capital . . . . . . . . . . . . . . . . . . . . . . . . . . . . . . . . . . . . . . . . . . . . . . . . . . . . . . . . 329,817 293,942Accumulated other comprehensive loss . . . . . . . . . . . . . . . . . . . . . . . . . . . . . . . . . . . . . . . . . . . . . (955) (75)Accumulated deficit . . . . . . . . . . . . . . . . . . . . . . . . . . . . . . . . . . . . . . . . . . . . . . . . . . . . . . . . . . . . (81,149) (67,766)
Total stockholders’ equity . . . . . . . . . . . . . . . . . . . . . . . . . . . . . . . . . . . . . . . . . . . . . . . . . . . . . . . 247,740 226,126
Total liabilities and stockholders’ equity . . . . . . . . . . . . . . . . . . . . . . . . . . . . . . . . . . . . . . . . . . . . $355,808 $325,899
The accompanying notes are an integral part of these consolidated financial statements
F-3

EnerNOC, Inc.
CONSOLIDATED STATEMENTS OF OPERATIONS(in thousands, except share and per share data)
Year Ended December 31,
2011 2010 2009
Revenues . . . . . . . . . . . . . . . . . . . . . . . . . . . . . . . . . . . . . . . . . . . . . . . $ 286,608 $ 280,157 $ 190,675Cost of revenues . . . . . . . . . . . . . . . . . . . . . . . . . . . . . . . . . . . . . . . . . 163,211 159,832 104,215
Gross profit . . . . . . . . . . . . . . . . . . . . . . . . . . . . . . . . . . . . . . . . . 123,397 120,325 86,460Operating expenses:
Selling and marketing . . . . . . . . . . . . . . . . . . . . . . . . . . . . . . . . . . . 51,907 44,029 39,502General and administrative . . . . . . . . . . . . . . . . . . . . . . . . . . . . . . . 66,773 54,983 44,407Research and development . . . . . . . . . . . . . . . . . . . . . . . . . . . . . . . 14,254 10,097 7,601
Total operating expenses . . . . . . . . . . . . . . . . . . . . . . . . . . . . . . . 132,934 109,109 91,510
Income (loss) from operations . . . . . . . . . . . . . . . . . . . . . . . . . . . . . . (9,537) 11,216 (5,050)Other (expense) income, net . . . . . . . . . . . . . . . . . . . . . . . . . . . . . . . . (987) (85) 98Interest expense . . . . . . . . . . . . . . . . . . . . . . . . . . . . . . . . . . . . . . . . . . (1,053) (718) (1,544)
Income (loss) before income tax . . . . . . . . . . . . . . . . . . . . . . . . . (11,577) 10,413 (6,496)Provision for income tax . . . . . . . . . . . . . . . . . . . . . . . . . . . . . . . . . . . (1,806) (836) (333)
Net income (loss) . . . . . . . . . . . . . . . . . . . . . . . . . . . . . . . . . . . . $ (13,383) $ 9,577 $ (6,829)
Income (loss) per common shareBasic . . . . . . . . . . . . . . . . . . . . . . . . . . . . . . . . . . . . . . . . . . . . . . $ (0.52) $ 0.39 $ (0.32)Diluted . . . . . . . . . . . . . . . . . . . . . . . . . . . . . . . . . . . . . . . . . . . . . $ (0.52) $ 0.37 $ (0.32)
Weighted average number of common shares outstandingBasic . . . . . . . . . . . . . . . . . . . . . . . . . . . . . . . . . . . . . . . . . . . . . . 25,799,494 24,611,729 21,466,813Diluted . . . . . . . . . . . . . . . . . . . . . . . . . . . . . . . . . . . . . . . . . . . . . 25,799,494 26,054,162 21,466,813
F-4

EnerNOC, Inc.
CONSOLIDATED STATEMENTS OF CHANGES INSTOCKHOLDERS’ EQUITY
AND COMPREHENSIVE (LOSS) INCOME(in thousands, except share data)
Common Stock AdditionalPaid inCapital
AccumulatedOther
ComprehensiveLoss
AccumulatedDeficit Total
Comprehensive(Loss) Income
Number ofShares Amount
Balances as of December 31, 2008 . . . . . . . . . . . . . . . . . . . . 20,254,548 $20 $169,800 $ (86) $(70,514) $ 99,220 —
Issuance of common stock upon exercise of stock options . . . 426,744 — 1,078 — — 1,078 —Issuance of restricted stock . . . . . . . . . . . . . . . . . . . . . . . . . . . 81,750 — — — — — —Vesting of restricted stock . . . . . . . . . . . . . . . . . . . . . . . . . . . . — — 20 — — 20 —Cancellation of restricted stock . . . . . . . . . . . . . . . . . . . . . . . . (10,063) — — — — —Issuance of common stock in satisfaction of bonuses . . . . . . . 45,085 — 500 — — 500 —Issuance of common stock in connection with the acquisition
of Cogent Energy, Inc. . . . . . . . . . . . . . . . . . . . . . . . . . . . . 114,281 — 3,162 — — 3,162 —Issuance of common stock in connection with the acquisition
of eQuilibrium Solutions Corporation . . . . . . . . . . . . . . . . . 21,464 — 501 — — 501 —Issuance of common stock in connection with the public
offering, net of issuance costs of $4,468 . . . . . . . . . . . . . . . 3,254,863 4 83,421 — — 83,425 —Earn-out payment of common stock to South River
Consulting, LLC . . . . . . . . . . . . . . . . . . . . . . . . . . . . . . . . . 44,776 — 734 — — 734 —Stock based compensation expense . . . . . . . . . . . . . . . . . . . . . — — 13,134 — — 13,134 —Comprehensive (loss) income:Foreign currency translation gain . . . . . . . . . . . . . . . . . . . . . . — — — 30 — 30 $ 30Net loss . . . . . . . . . . . . . . . . . . . . . . . . . . . . . . . . . . . . . . . . . . — — — — (6,829) (6,829) (6,829)
Balances as of December 31, 2009 . . . . . . . . . . . . . . . . . . . . 24,233,448 24 272,350 (56) (77,343) 194,975 $ (6,799)
Issuance of common stock upon exercise of stock options . . . 583,796 — 3,861 — — 3,861 —Issuance of restricted stock . . . . . . . . . . . . . . . . . . . . . . . . . . . 247,900 — — — — — —Vesting of restricted stock . . . . . . . . . . . . . . . . . . . . . . . . . . . . — — 17 17 —Vesting of restricted stock units . . . . . . . . . . . . . . . . . . . . . . . 51,876 1 (1) — — — —Cancellation of restricted stock . . . . . . . . . . . . . . . . . . . . . . . . (22,679) — — — — — —Issuance of common stock in satisfaction of bonuses . . . . . . . 24,681 — 775 — — 775 —Issuance of common stock in connection with the acquisition
of SmallFoot LLC and ZOX, LLC . . . . . . . . . . . . . . . . . . . 8,758 — 260 — — 260 —Earn-out payment of common stock to South River
Consulting, LLC . . . . . . . . . . . . . . . . . . . . . . . . . . . . . . . . . 30,879 — 900 — — 900 —Release and retirement of escrow shares to satisfy purchase
accounting obligation from Cogent . . . . . . . . . . . . . . . . . . . (3,592) — (94) — — (94) —Stock based compensation expense . . . . . . . . . . . . . . . . . . . . . — — 15,742 — — 15,742 —Tax benefit related to exercise of stock options and vesting
of restricted stock and restricted stock units . . . . . . . . . . . . — — 132 — — 132 —Comprehensive (loss) income:Foreign currency translation loss . . . . . . . . . . . . . . . . . . . . . . — — — (19) — (19) $ (19)Net income . . . . . . . . . . . . . . . . . . . . . . . . . . . . . . . . . . . . . . . — — — — 9,577 9,577 9,577Balances as of December 31, 2010 . . . . . . . . . . . . . . . . . . . . 25,155,067 25 293,942 (75) (67,766) 226,126 $ 9,558
Issuance of common stock upon exercise of stock options . . . 310,155 — 2,034 — — 2,034 —Issuance of restricted stock . . . . . . . . . . . . . . . . . . . . . . . . . . . 1,062,165 1 — — — 1 —Vesting of restricted stock units . . . . . . . . . . . . . . . . . . . . . . . 95,167 — — — — — —Cancellation of restricted stock . . . . . . . . . . . . . . . . . . . . . . . . (72,287) — — — — — —Issuance of common stock in satisfaction of bonuses . . . . . . . 18,211 — 440 — — 440 —Issuance of common stock in connection with the acquisition
of Global Energy Partners, Inc. . . . . . . . . . . . . . . . . . . . . . . 275,181 — 6,783 — — 6,783 —Issuance of common stock in connection with the acquisition
of M2M Communications Corporation (“M2M”) . . . . . . . 351,665 1 8,349 — — 8,350 —Issuance of common stock in connection with the acquisition
of Energy Response Holidings Pty Ltd . . . . . . . . . . . . . . . . 156,697 — 2,491 — — 2,491 —Retirement of M2M escrow shares . . . . . . . . . . . . . . . . . . . . . (45,473) (1,125) (1,125)Acquisition date fair value of shares of common stock
related to deferred purchase price consideration inacquisition of M2M . . . . . . . . . . . . . . . . . . . . . . . . . . . . . . . — — 3,439 — — 3,439 —
Stock based compensation expense . . . . . . . . . . . . . . . . . . . . . — — 13,464 — — 13,464 —Comprehensive (loss) income:Foreign currency translation loss . . . . . . . . . . . . . . . . . . . . . . — — — (880) — (880) $ (880)Net loss . . . . . . . . . . . . . . . . . . . . . . . . . . . . . . . . . . . . . . . . . . — — — — (13,383) (13,383) (13,383)Balances as of December 31, 2011 . . . . . . . . . . . . . . . . . . . . 27,306,548 $27 $329,817 $(955) $(81,149) $247,740 $(14,263)
The accompanying notes are an integral part of these consolidated financial statements.
F-5

EnerNOC, Inc.
CONSOLIDATED STATEMENTS OF CASH FLOWS(in thousands)
Year Ended December 31,
2011 2010 2009
Cash flow from operating activitiesNet (loss) income . . . . . . . . . . . . . . . . . . . . . . . . . . . . . . . . . . . . . . . . . . . . . . . . . . . . . . . . . . . . . . . . . . . . . $ (13,383) $ 9,577 $ (6,829)Adjustments to reconcile net income (loss) to net cash used in operating activities:Depreciation . . . . . . . . . . . . . . . . . . . . . . . . . . . . . . . . . . . . . . . . . . . . . . . . . . . . . . . . . . . . . . . . . . . . . . . . . 16,187 14,414 11,357Amortization of acquired intangible assets . . . . . . . . . . . . . . . . . . . . . . . . . . . . . . . . . . . . . . . . . . . . . . . . . . 5,856 1,452 692Impairment of acquired intangible assets . . . . . . . . . . . . . . . . . . . . . . . . . . . . . . . . . . . . . . . . . . . . . . . . . . . 1,084 — 135Stock based compensation expense . . . . . . . . . . . . . . . . . . . . . . . . . . . . . . . . . . . . . . . . . . . . . . . . . . . . . . . 13,464 15,742 13,134Excess tax benefit related to exercise of options, restricted stock and restricted stock units . . . . . . . . . . . . — (132)Impairment of equipment . . . . . . . . . . . . . . . . . . . . . . . . . . . . . . . . . . . . . . . . . . . . . . . . . . . . . . . . . . . . . . . 632 1,646 1,191Unrealized foreign exchange transaction loss . . . . . . . . . . . . . . . . . . . . . . . . . . . . . . . . . . . . . . . . . . . . . . . . 1,401 133 86Deferred taxes . . . . . . . . . . . . . . . . . . . . . . . . . . . . . . . . . . . . . . . . . . . . . . . . . . . . . . . . . . . . . . . . . . . . . . . . 1,516 469 292Non-cash interest expense . . . . . . . . . . . . . . . . . . . . . . . . . . . . . . . . . . . . . . . . . . . . . . . . . . . . . . . . . . . . . . . 191 26 60Non-cash charges related to termination of third party agreement . . . . . . . . . . . . . . . . . . . . . . . . . . . . . . . . 882 — —Accretion of fair value of deferred purchase price consideration related to acquisition . . . . . . . . . . . . . . . . 15 — —Accretion of fair value of contingent purchase price consideration related to acquisition . . . . . . . . . . . . . . 46 — —Loss on disposal of equipment . . . . . . . . . . . . . . . . . . . . . . . . . . . . . . . . . . . . . . . . . . . . . . . . . . . . . . . . . . . — — 26Other, net . . . . . . . . . . . . . . . . . . . . . . . . . . . . . . . . . . . . . . . . . . . . . . . . . . . . . . . . . . . . . . . . . . . . . . . . . . . . 221 143 33Changes in operating assets and liabilities, net of effects of acquisitions:Accounts receivable, trade . . . . . . . . . . . . . . . . . . . . . . . . . . . . . . . . . . . . . . . . . . . . . . . . . . . . . . . . . . . . . . 2,194 (4,886) (4,582)Unbilled revenue . . . . . . . . . . . . . . . . . . . . . . . . . . . . . . . . . . . . . . . . . . . . . . . . . . . . . . . . . . . . . . . . . . . . . . 7,009 (32,754) (28,622)Prepaid expenses and other current assets . . . . . . . . . . . . . . . . . . . . . . . . . . . . . . . . . . . . . . . . . . . . . . . . . . (5,022) (666) (2,778)Other assets . . . . . . . . . . . . . . . . . . . . . . . . . . . . . . . . . . . . . . . . . . . . . . . . . . . . . . . . . . . . . . . . . . . . . . . . . . (3,764) 3 (940)Other noncurrent liabilities . . . . . . . . . . . . . . . . . . . . . . . . . . . . . . . . . . . . . . . . . . . . . . . . . . . . . . . . . . . . . . (176) — 254Deferred revenue . . . . . . . . . . . . . . . . . . . . . . . . . . . . . . . . . . . . . . . . . . . . . . . . . . . . . . . . . . . . . . . . . . . . . . 8,994 6,751 997Accrued capacity payments . . . . . . . . . . . . . . . . . . . . . . . . . . . . . . . . . . . . . . . . . . . . . . . . . . . . . . . . . . . . . (7,369) 25,223 21,871Accrued payroll and related expenses . . . . . . . . . . . . . . . . . . . . . . . . . . . . . . . . . . . . . . . . . . . . . . . . . . . . . . 1,262 2,199 3,873Accounts payable and accrued expenses and other current liabilities . . . . . . . . . . . . . . . . . . . . . . . . . . . . . (3,603) 5,808 (2,164)
Net cash provided by operating activities . . . . . . . . . . . . . . . . . . . . . . . . . . . . . . . . . . . . . . . . . . . . . . . . . 27,637 45,148 8,086Cash flows from investing activitiesSales and maturities of marketable securities . . . . . . . . . . . . . . . . . . . . . . . . . . . . . . . . . . . . . . . . . . . . . . . . — — 2,000Payments made for acquisitions of businesses, net of cash acquired . . . . . . . . . . . . . . . . . . . . . . . . . . . . . . (67,492) (2,001) (7,203)Payments made for contingent consideration related to acquisitions . . . . . . . . . . . . . . . . . . . . . . . . . . . . . . (1,500) — —Purchases of property and equipment . . . . . . . . . . . . . . . . . . . . . . . . . . . . . . . . . . . . . . . . . . . . . . . . . . . . . . (17,613) (19,394) (16,901)Change in restricted cash and deposits . . . . . . . . . . . . . . . . . . . . . . . . . . . . . . . . . . . . . . . . . . . . . . . . . . . . . (8,381) 5,971 (7,068)Change in long-term assets . . . . . . . . . . . . . . . . . . . . . . . . . . . . . . . . . . . . . . . . . . . . . . . . . . . . . . . . . . . . . . (530) — —
Net cash used in investing activities . . . . . . . . . . . . . . . . . . . . . . . . . . . . . . . . . . . . . . . . . . . . . . . . . . . . . (95,516) (15,424) (29,172)Cash flows from financing activitiesProceeds from public offerings of common stock, net of issuance costs . . . . . . . . . . . . . . . . . . . . . . . . . . . — — 83,425Proceeds from exercises of stock options . . . . . . . . . . . . . . . . . . . . . . . . . . . . . . . . . . . . . . . . . . . . . . . . . . . 2,034 3,878 1,078Repayment of borrowings and payments under capital leases . . . . . . . . . . . . . . . . . . . . . . . . . . . . . . . . . . . (37) (36) (4,490)Excess tax benefit related to exercise of options, restricted stock and restricted stock units . . . . . . . . . . . . — 132 —
Net cash provided by financing activities . . . . . . . . . . . . . . . . . . . . . . . . . . . . . . . . . . . . . . . . . . . . . . . . . 1,997 3,974 80,013Effects of exchange rate changes on cash and cash equivalents . . . . . . . . . . . . . . . . . . . . . . . . . . . . . . . . . . (237) (21) 30
Net change in cash and cash equivalents . . . . . . . . . . . . . . . . . . . . . . . . . . . . . . . . . . . . . . . . . . . . . . . . . . . (66,119) 33,677 58,957Cash and cash equivalents at beginning of period . . . . . . . . . . . . . . . . . . . . . . . . . . . . . . . . . . . . . . . . . . . . 153,416 119,739 60,782
Cash and cash equivalents at end of period . . . . . . . . . . . . . . . . . . . . . . . . . . . . . . . . . . . . . . . . . . . . . . . . . $ 87,297 $153,416 $119,739
Supplemental disclosure of cash flow informationCash paid for interest . . . . . . . . . . . . . . . . . . . . . . . . . . . . . . . . . . . . . . . . . . . . . . . . . . . . . . . . . . . . . . . . . . $ 862 $ 699 $ 1,536
Cash paid for income taxes . . . . . . . . . . . . . . . . . . . . . . . . . . . . . . . . . . . . . . . . . . . . . . . . . . . . . . . . . . . . . . $ 353 $ 360 $ —
Non-cash financing and investing activitiesIssuance of common stock in connection with acquisitions, including earn out payments . . . . . . . . . . . . . $ 16,499 $ 1,066 $ 4,397
Issuance of common stock in satisfaction of bonuses . . . . . . . . . . . . . . . . . . . . . . . . . . . . . . . . . . . . . . . . . . $ 440 $ 775 $ 500
Deferred acquisition consideration . . . . . . . . . . . . . . . . . . . . . . . . . . . . . . . . . . . . . . . . . . . . . . . . . . . . . . . . $ 3,925 $ — $ —
Increase in accrued acquisition contingent consideration . . . . . . . . . . . . . . . . . . . . . . . . . . . . . . . . . . . . . . . $ 309 $ — $ —
The accompanying notes are an integral part of these consolidated financial statements
F-6

EnerNOC, Inc.
NOTES TO CONSOLIDATED FINANCIAL STATEMENTS(in thousands, except share and per share data)
1. Description of Business, Basis of Presentation and Summary of Significant Accounting Policies
Description of Business
EnerNOC, Inc. (the Company) is a service company that was incorporated in Delaware on June 5, 2003. TheCompany operates in a single segment providing clean and intelligent energy management applications, servicesand products for the smart grid, which include comprehensive demand response, data-driven energy efficiency,energy price and risk management, and enterprise carbon management applications, services and products. TheCompany’s energy management applications, services and products enable cost effective energy managementstrategies for its commercial, institutional and industrial end-users of energy (C&I customers) and its electricpower grid operator and utility customers by reducing real-time demand for electricity, increasing energyefficiency, improving energy supply transparency, and mitigating carbon emissions. The Company uses itsNetwork Operations Center (NOC) and comprehensive demand response application, DemandSMART, toremotely manage and reduce electricity consumption across a growing network of C&I customer sites, makingdemand response capacity available to electric power grid operators and utilities on demand while helping C&Icustomers achieve energy savings, improved financial results and environmental benefits. To date, the Companyhas received substantially all of its revenues from electric power grid operators and utilities, who make recurringpayments to the Company for managing demand response capacity that it shares with its C&I customers inexchange for those C&I customers reducing their power consumption when called upon.
The Company builds on its position as a leading demand response services provider by using its NOC andenergy management application platform to deliver a portfolio of additional energy management applications andservices to new and existing C&I, electric power grid operator and utility customers. These additional energymanagement applications and services include its EfficiencySMART, SupplySMART and CarbonSMARTapplications and services, and certain other products. EfficiencySMART is its data-driven energy efficiency suitethat includes commissioning and retro-commissioning authority services, energy consulting and engineeringservices, a persistent commissioning application and an enterprise energy management application for managingenergy across a portfolio of sites. SupplySMART is its energy price and risk management application thatprovides its C&I customers located in restructured or deregulated markets throughout the United States with theability to more effectively manage the energy supplier selection process, including energy supply productprocurement and implementation, budget forecasting, and utility bill information management. CarbonSMART isits enterprise carbon management application that supports and manages the measurement, tracking, analysis,reporting and management of greenhouse gas emissions. The Company’s products include its wirelesstechnology solutions for energy management and demand response related to its leading energy managementapplications and the acquisition of M2M in January 2011.
Reclassifications and Adjustments
The Company has reclassified certain costs in its consolidated statements of operations for the year endedDecember 31, 2010 totaling $1,407, previously included in selling and marketing expenses as general andadministrative expenses to more appropriately reflect the nature of these costs consistent with costs in 2011.These costs commenced in the year ended December 31, 2010 and therefore no reclassification is required for theyear ended December 31, 2009.
During the fourth quarter of the year ended December 31, 2011, the Company recorded an adjustment toincrease to its accrued capacity payments as of December 31, 2011 by approximately $1,719 with acorresponding charge recorded to cost of sales in the fourth quarter of 2011 relating to payments owed to C&Icustomers enrolled in demand response programs that were not properly accounted for during the second andthird quarters of 2011. Of this $1,719 adjustment, approximately $1,419 and $300 related to the second and third
F-7

quarters of 2011, respectively. In addition, the Company recorded certain other adjustments in the fourth quarterof 2011 resulting in a net charge to operating income of approximately $539, that should have been recorded inprior interim and/or annual periods.
In accordance with SEC Staff Accounting Bulletin (SAB) No. 99, Materiality, and SAB No. 108, theCompany assessed the materiality of these corrections, individually and in aggregate, on its consolidatedfinancial statements for the years ended December 31, 2011, 2010 and 2009 and each of the quarters within thoseyears, using both the roll-over and iron-curtain approaches described in SAB No. 108. The Company concludedthe effect of these errors was not material to its consolidated financial statements for any of the periods and, assuch, these consolidated financial statements are not materially misstated. As a result, the Company recordedthese adjustments totaling $2,258 in the consolidated statement of operations for the three months endedDecember 31, 2011.
Basis of Consolidation
The consolidated financial statements of the Company include the accounts of its wholly-owned subsidiariesand have been prepared in conformity with accounting principles generally accepted in the United States(GAAP). Intercompany transactions and balances are eliminated upon consolidation.
On July 1, 2011, the Company acquired all of the outstanding capital stock of Energy Response HoldingsPty Ltd (Energy Response) in a purchase business combination. Accordingly, the results of Energy Responsesubsequent to that date are included in the Company’s consolidated statements of operations.
On January 25, 2011, the Company acquired all of the outstanding capital stock of M2M CommunicationsCorporation (M2M) in a purchase business combination. Accordingly, the results of M2M subsequent to that dateare included in the Company’s consolidated statements of operations.
On January 3, 2011, the Company acquired all of the outstanding capital stock of Global Energy Partners,Inc. (Global Energy) in a purchase business combination. Accordingly, the results of Global Energy subsequentto that date are included in the Company’s consolidated statements of operations.
On March 15, 2010, the Company acquired substantially all of the assets and certain liabilities of SmallFootLLC (SmallFoot) and ZOX, LLC (Zox) in a purchase business combination. Accordingly, the results ofSmallFoot and Zox subsequent to that date are included in the Company’s consolidated statements of operations.
On December 4, 2009, the Company acquired all of the outstanding capital stock of Cogent Energy, Inc.(Cogent) in a purchase business combination. Accordingly, the results of Cogent subsequent to that date areincluded in the Company’s consolidated statements of operations.
On June 11, 2009, the Company acquired all of the assets eQuilibrium Solutions Corporation (eQ) in apurchase business combination. Accordingly, the results of eQ subsequent to that date are included in theCompany’s consolidated statements of operations.
Subsequent Events Consideration
The Company considers events or transactions that occur after the balance sheet date but prior to theissuance of the financial statements to provide additional evidence relative to certain estimates or to identifymatters that require additional disclosure. Subsequent events have been evaluated as required.
In January 2012, PJM Interconnection, or PJM, responded to a certain Federal Energy RegulatoryCommission (FERC) order by making a compliance filing, which proposed the immediate implementation ofPJM’s proposed market rules accepted in the FERC order. The Company refers to this as the PJM proposal. TheCompany subsequently filed a protest requesting that FERC reject the PJM proposal as unjust and unreasonablefor failure to meet the conditions set forth in the FERC order to establish an interim settlement mechanism thatprotects the reasonable reliance expectations of demand response suppliers through the 2014-15 delivery year.The Company also requested that FERC order PJM to keep current settlement practices in place for the 2012-13delivery year and require PJM to propose an alternative mechanism that complies with FERC’s directivesthrough the 2014-2015 delivery year or, in the alternative, order the adoption of the Company’s proposed interim
F-8

settlement as described in the Company’s protest. Subsequent to the Company’s protest filing, additional filingswere made by certain parties interested in the outcome of this matter. In February 2012, FERC issued an ordersubstantially accepting the PJM proposal, which resulted in the immediate implementation of PJM’s proposedmarket rule changes regarding capacity compliance measurement and verification.
In April 2011, the Company and one of its subsidiaries entered into a $75.0 million senior secured revolvingcredit facility pursuant to a credit agreement, which was subsequently amended in June 2011, November 2011and December 2011 (the 2011 credit facility), with Silicon Valley Bank ( SVB) and one other financialinstitution. In March 2012, the Company and one of its subsidiaries amended and restated the 2011 credit facility(amended and restated 2011 credit facility) under which SVB became the sole lender, the Company’s borrowinglimit was decreased from $75.0 million to $50.0 million and certain of its financial covenant compliancerequirements were modified. As a result, the Company is reasonably assured it will be in compliance with thefinancial covenants under the amended and restated 2011 credit facility for the foreseeable future. For additionalinformation regarding the 2011 credit facility and the amended and restated 2011 credit facility, see Note 7.
Use of Estimates in Preparation of Financial Statements
The preparation of these consolidated financial statements requires the Company to make estimates andjudgments that affect the reported amounts of assets, liabilities, revenues and expenses, and related disclosure ofcontingent assets and liabilities. On an on-going basis, the Company evaluates its estimates, including thoserelated to revenue recognition, allowance for doubtful accounts, valuations and purchase price allocations relatedto business combinations, fair value of deferred acquisition consideration, fair value of accrued acquisitioncontingent consideration, expected future cash flows including growth rates, discount rates, terminal values andother assumptions and estimates used to evaluate the recoverability of long-lived assets and goodwill, estimatedfair values of intangible assets and goodwill, amortization methods and periods, certain accrued expenses andother related charges, stock-based compensation, contingent liabilities, tax reserves and recoverability of theCompany’s net deferred tax assets and related valuation allowance.
Although the Company regularly assesses these estimates, actual results could differ materially. Changes inestimates are recorded in the period in which they become known. The Company bases its estimates on historicalexperience and various other assumptions that it believes to be reasonable under the circumstances. Actual resultsmay differ from management’s estimates if these results differ from historical experience or other assumptionsprove not to be substantially accurate, even if such assumptions are reasonable when made.
The Company is subject to a number of risks similar to those of other companies of similar and differentsizes both inside and outside of its industry, including, but not limited to, rapid technological changes,competition from similar energy management applications, services and products provided by larger companies,customer concentration, government regulations, market or program rule changes, protection of proprietary rightsand dependence on key individuals.
Significant Accounting Policies
Restricted Cash and Cash Equivalents
Restricted cash is comprised of certificates of deposit and cash held to collateralize the Company’soutstanding letters of credit. Cash equivalents are highly liquid investments with insignificant interest rate riskand maturities of three months or less at the time of acquisition. Investments qualifying as cash equivalentsconsist of investments in money market funds, which have no withdrawal restrictions or penalties and totaled$51,841 and $108,000 at December 31, 2011 and 2010, respectively.
The Company held no marketable securities as of December 31, 2011 or 2010. The cost of securities sold isbased on the specific identification method. Interest and dividends on securities classified asavailable-for-sale are included in interest and other income.
Disclosure of Fair Value of Financial Instruments
The Company’s financial instruments mainly consist of cash and cash equivalents, restricted cash, accountsreceivable, accounts payable and debt obligations. The carrying amounts of the Company’s cash equivalents,
F-9

restricted cash, accounts receivable and accounts payable approximate their fair value due to the short-termnature of these instruments. As of December 31, 2011, the Company had no borrowings, but had outstandingletters of credit totaling $31,631 under the amended 2011 credit facility. At December 31, 2010, the Companyhad no borrowings but had outstanding letters of credit totaling $36,561 under the loan and security agreemententered into with SVB in August 2008 (2008 credit facility). During fiscal 2009, the Company paid theoutstanding borrowings of $4,442 under the 2008 credit facility. For additional information regarding the 2011credit facility and 2008 credit facility, see Note 7.
Concentrations of Credit Risk
Financial instruments that potentially subject the Company to significant concentrations of credit riskprincipally consist of cash and cash equivalents, restricted cash and billed and unbilled accounts receivable. TheCompany maintains its cash and cash equivalent balances with highly rated financial institutions and,consequently, such funds are subject to minimal credit risk.
The Company’s customers are principally located in the mid-Atlantic and northeastern regions of the UnitedStates where the Company’s customers are regional electric grid operators PJM and ISO- New England, Inc.(ISO-NE), respectively. The Company performs ongoing credit evaluations of the financial condition of itscustomers and generally does not require collateral. Although the Company is directly affected by the overallfinancial condition of the energy industry as well as global economic conditions, the Company does not believesignificant credit risk exists as of December 31, 2011. The Company generally has not experienced any materiallosses related to receivables from individual customers or groups of customers in the energy industry. TheCompany maintains an allowance for doubtful accounts based on accounts past due and historical collectionexperience. The Company’s losses related to collection of trade receivables have consistently been within theCompany’s expectations. Due to these factors, no additional credit risk beyond amounts provided for collectionlosses is believed by the Company to be probable.
The following table presents the Company’s significant customers. With respect to PJM and ISO-NE, thesecustomers are regional electric power grid operators, which are comprised of multiple utilities and were formedto control the operation of a regional power system, coordinate the supply of electricity, and establish fair andefficient markets.
Year Ended December 31,
2011 2010 2009
Revenues% of TotalRevenues Revenues
% of TotalRevenues Revenues
% of TotalRevenues
PJM Interconnection (PJM) . . . . . . . . . . . . $153,231 53% $167,662 60% $ 98,416 52%
ISO-New England, Inc. (ISO-NE) . . . . . . . 37,469 13% 51,592 18% 56,107 29%
Total . . . . . . . . . . . . . . . . . . . . . . . . . . . . . . $190,700 66% $219,254 78% $154,523 81%
No other customers accounted for more than 10% of the Company’s consolidated revenues for the yearsended December 31, 2011, 2010 or 2009.
Accounts receivable from PJM and ISO-NE was approximately $7,131 and $11,199 at December 31, 2011and 2010, respectively. Tennessee Valley Authority also comprised 10% or more of the accounts receivablebalance at December 31, 2011 at 13%. Other than PJM and ISO-NE, Southern California Edison Company wasthe only additional customer that represented 10% or more of the accounts receivable balance at December 31,2010 at 15%. Unbilled revenue related to PJM was $64,099 and $72,887 at December 31, 2011 and 2010,respectively. There was no significant unbilled revenue for any other customers at December 31, 2011 and 2010.
Deposits and restricted cash consist of funds to secure performance under certain contracts and open marketbidding programs with electric power grid operator and utility customers. Deposits held by these customers were$14,281 and $3,467 at December 31, 2011 and 2010, respectively. The increase in deposits from December 31,2010 to December 31, 2011 was due to additional deposits made to collateralize new contractual obligations
F-10

related to one of the Company’s Australian subsidiaries. Restricted cash to secure letters of credit was $0 and$1,300 at December 31, 2011 and 2010, respectively. Restricted cash to secure certain other commitments was$158 and $237 at December 31, 2011 and 2010, respectively.
Property and Equipment
Property and equipment is stated at cost and depreciated using the straight-line method over the estimateduseful lives of the respective assets, ranging from three to ten years. Demand response equipment is depreciatedover the lesser of its useful life or the estimated C&I customer relationship period, which historically has beenapproximately three years. Leasehold improvements are amortized over their useful life or the original leaseterm, whichever is shorter. The amortization of capital lease amounts has been included in depreciation expense.There were no assets under capital leases at December 31, 2011. Expenditures that improve or extend the life of arespective asset are capitalized while repairs and maintenance expenditures are expensed as incurred.
Software Development Costs
The Company applies the provisions of Accounting Standard Codification (ASC) 350-40 (ASC 350-40),Internal-Use Software (formerly American Institute of Certified Public Accountants (AICPA) Statement ofPosition (SOP) 98-1, Software Developed or Obtained for Internal Use). ASC 350-40 requires computersoftware costs associated with internal use software to be expensed as incurred until certain capitalization criteriaare met, and it also defines which types of costs should be capitalized and which should be expensed. TheCompany capitalizes the payroll and payroll-related costs of employees who devote time to the development ofinternal-use computer software. The Company amortizes these costs on a straight-line basis over the estimateduseful life of the software, which is generally two to five years. The Company’s judgment is required indetermining the point at which various projects enter the stages at which costs may be capitalized, in assessingthe ongoing value and impairment of the capitalized costs, and in determining the estimated useful lives overwhich the costs are amortized.
Software development costs of $3,177, $6,778 and $4,162 for the years ended December 31, 2011, 2010,and 2009, respectively, have been capitalized in accordance with ASC 350-40. The capitalized amount wasincluded as software in property and equipment at December 31, 2011, 2010 and 2009. The Company capitalized$1,313, and $1,541 during the years ended December 31, 2010 and 2009, respectively, related to a company-wideenterprise resource planning systems implementation project which was placed into production in June 2011 andis being amortized over a five-year useful life. Amortization of capitalized software development costs was$4,013, $2,947 and $2,311 for the years ended December 31, 2011, 2010, and 2009, respectively. Accumulatedamortization of capitalized software development costs was $11,147 and $7,134 as of December 31, 2011 and2010, respectively.
Impairment of Property and Equipment
The Company reviews property and equipment for impairment whenever events or changes incircumstances indicate that the carrying amount of assets may not be recoverable. If these assets are consideredto be impaired, the impairment is recognized in earnings and equals the amount by which the carrying value ofthe assets exceeds their fair market value determined by either a quoted market price, if any, or a valuedetermined by utilizing a discounted cash flow technique. If these assets are not impaired, but their useful liveshave decreased, the remaining net book value is amortized over the revised useful life.
During the years ended December 31, 2011 and 2010, the Company identified impairment indicators relatedto certain demand response equipment as a result of the removal of such equipment from service during thoseyears. As a result of these impairment indicators, the Company performed impairment tests and recognizedimpairment charges of $566 and $552 during the year ended December 31, 2011 and 2010, respectively,representing the difference between the carrying value and fair market value of the demand response equipment,which is included in cost of revenues in the accompanying consolidated statements of operations. The fair marketvalue was determined utilizing Level 3 inputs, as defined by ASC 820, Fair Value Measurements andDisclosures (ASC 820), based on the projected future cash flows discounted using the estimated marketparticipant rate of return for this type of asset.
F-11

During the years ended December 31, 2011 and 2010, the Company identified potential indicators ofimpairment related to certain demand response and back-up generator equipment as a result of lower thanestimated demand response event performance by these assets. As a result of the potential indicators ofimpairment, the Company performed impairment tests. The applicable long-lived assets are measured forimpairment at the lowest level for which identifiable cash flows are largely independent of the cash flows ofother assets or liabilities. The Company determined that the undiscounted cash flows to be generated by the assetgroup over its remaining estimated useful life would not be sufficient to recover the carrying value of the assetgroup. The Company determined the fair value of the asset group using a discounted cash flow technique basedon Level 3 inputs, as defined by ASC 820, Fair Value Measurements and Disclosures (ASC 820), and a discountrate of 11%, which the Company determined represents a market rate of return for the assets being evaluated forimpairment. The Company recorded impairment charges of $66 and $1,094 during the years ended December 31,2011 and 2010, respectively, which is reflected in cost of revenues in the accompanying consolidated statementsof operations. The impairment charges were allocated to the individual assets within the asset group on a pro-ratabasis using the relative carrying amounts of those assets.
As of December 31, 2011 approximately $1,594 of the Company’s generation equipment is utilized in anopen market program. The recoverability of the carrying value of this generation equipment is largely dependenton the rates that the Company is compensated for its committed capacity within these programs. These ratesrepresent market rates and can fluctuate based on the supply and demand of capacity. Although these marketrates are established up to three years in advance of the service delivery, these market rates have not yet beenestablished for the entire remaining useful life of this generation equipment. In performing its impairmentanalysis, the Company estimates the expected future market rates based on current existing market rates andtrends. A decline in the expected future market rates of 10% by itself would not result in an impairment chargerelated to this generation equipment.
For the year ended December 31, 2009, the carrying value of a portion of the Company’s demand responseand generation equipment exceeded the undiscounted future cash flows based upon the anticipated retirementdates. As a result, the Company recognized an impairment charge of $1,191 representing the difference betweenthe carrying value and fair market value of demand response and generation equipment, which is included in costof revenues in the accompanying consolidated statements of operations.
Business Combinations
The Company records tangible and intangible assets acquired and liabilities assumed in businesscombinations under the purchase method of accounting. Amounts paid for each acquisition are allocated to theassets acquired and liabilities assumed based on their fair values at the dates of acquisition. The fair value ofidentifiable intangible assets is based on detailed valuations that use information and assumptions provided bythe Company. The Company estimates the fair value of contingent consideration at the time of the acquisitionusing all pertinent information known to the Company at the time to assess the probability of payment ofcontingent amounts. The Company allocates any excess purchase price over the fair value of the net tangible andintangible assets acquired and liabilities assumed to goodwill.
The Company primarily uses the income approach to determine the estimated fair value of identifiableintangible assets, including customer relationships, non-compete agreements and trade names. This approachdetermines fair value by estimating the after-tax cash flows attributable to an in-process project over its usefullife and then discounting these after-tax cash flows back to a present value. The Company bases its revenueassumptions on estimates of relevant market sizes, expected market growth rates and expected trends, includingintroductions by competitors of new energy management applications, services and products. The Companybases the discount rate used to arrive at a present value as of the date of acquisition on the time value of moneyand market participant investment risk factors. The use of different assumptions could materially impact thepurchase price allocation and the Company’s financial condition and results of operations.
Customer relationships represent established relationships with customers, which provide a ready channelfor the sale of additional energy management applications, services and products. Non-compete agreements
F-12

represent arrangements with certain employees that limit or prevent their ability to take employment at acompetitor for a fixed period of time. Trade names represent acquired product names that the Company intendsto continue to utilize.
The Company has utilized the cost approach to determine the estimated fair value of acquired indefinite-lived intangible assets related to acquired in-process research and development given the stage of development asof the acquisition date and the lack of sufficient information regarding future expected cash flows. The costapproach calculates fair value by calculating the reproduction cost of an exact replica of the subject intangibleasset. The Company calculates the replacement cost based on actual development costs incurred through the dateof acquisition. In determining the appropriate valuation methodology, the Company considers, among otherfactors: the in-process projects’ stage of completion; the complexity of the work completed as of the acquisitiondate; the costs already incurred; the projected costs to complete; the expected introduction date; and the estimateduseful life of the technology. The Company believes that the estimated in-process research and developmentamounts so determined represent the fair value at the date of acquisition and do not exceed the amount a thirdparty would pay for the projects.
Impairment of Intangible Assets and Goodwill
Definite-Lived Intangible Assets
The Company amortizes its intangible assets that have finite lives using either the straight-line method or, ifreliably determinable, based on the pattern in which the economic benefit of the asset is expected to be consumedutilizing expected undiscounted future cash flows. Amortization is recorded over the estimated useful livesranging from one to ten years. The Company reviews its intangible assets subject to amortization to determine ifany adverse conditions exist or a change in circumstances has occurred that would indicate impairment or achange in the remaining useful life. If the carrying value of an asset exceeds its undiscounted cash flows, theCompany will write-down the carrying value of the intangible asset to its fair value in the period identified. Inassessing recoverability, the Company must make assumptions regarding estimated future cash flows anddiscount rates. If these estimates or related assumptions change in the future, the Company may be required torecord impairment charges. The Company generally calculates fair value as the present value of estimated futurecash flows to be generated by the asset using a risk-adjusted discount rate. If the estimate of an intangible asset’sremaining useful life is changed, the Company will amortize the remaining carrying value of the intangible assetprospectively over the revised remaining useful life.
During the year ended December 31, 2011, as a result of a discontinuation of certain trade names acquiredin connection with the acquisition of Energy Response in July 2011 and another immaterial acquisition thatoccurred in January 2011, the Company determined that these definite-lived intangible assets were impaired andrecorded an impairment charge of $241 to reduce the carrying value of these assets to zero, which was includedin selling and marketing expense in the accompanying consolidated statements of operations. During the yearended December 31, 2011, as a result of the discontinuation of certain customer relationships related to the 2009acquisition of eQ, the Company recorded an impairment charge of $296 which was included in selling andmarketing expense in the accompanying consolidated statements of operations.
During the year ended December 31, 2009, as a result of a change in the expected period of economicbenefit of the trade name acquired in the acquisition of Cogent, the Company determined that an impairmentindicator existed. Based on the analysis performed, the Company determined that this trade name was partiallyimpaired and recorded an impairment charge of $135 during the year ended December 31, 2009, which isincluded in general and administrative expenses in the accompanying consolidated statements of operations. Thefair market value of approximately $65 was determined using Level 3 inputs, as defined by ASC 820, based onthe projected future cash flows over the revised period of economic benefit discounted based on the Company’sweighted average cost of capital of 17%.
F-13

The following table provides the gross carrying amount and related accumulated amortization of intangibleassets as of December 31, 2011 and December 31, 2010:
WeightedAverage
AmortizationPeriod
(in years)
As of December 31, 2011 As of December 31, 2010
GrossCarryingAmount
AccumulatedAmortization
GrossCarryingAmount
AccumulatedAmortization
Customer relationships . . . . . . . . . . . . . . . . . . . . . . 5.10 $32,279 $(5,286) $3,510 $(1,016)
Total customer relationship intangible assets . . . 32,279 (5,286) 3,510 (1,016)
Customer contracts . . . . . . . . . . . . . . . . . . . . . . . . . 5.26 4,217 (2,007) 4,217 (1,593)
Employment agreements and non-competeagreements . . . . . . . . . . . . . . . . . . . . . . . . . . . . . 2.25 1,726 (707) 772 (309)
Software . . . . . . . . . . . . . . . . . . . . . . . . . . . . . . . . . 0.47 120 (103) 120 (63)
Developed technology . . . . . . . . . . . . . . . . . . . . . . 2.83 2,297 (517) — —
Trade name . . . . . . . . . . . . . . . . . . . . . . . . . . . . . . . 2.16 575 (225) 115 (115)
Patents . . . . . . . . . . . . . . . . . . . . . . . . . . . . . . . . . . . 8.18 180 (32) 200 (15)
Total other definite-lived intangible assets . . . . . 9,115 (3,591) 5,424 (2,095)
Total . . . . . . . . . . . . . . . . . . . . . . . . . . . . . . . . . . . . $41,394 $(8,877) $8,934 $(3,111)
The increase in intangibles assets from December 31, 2010 to December 31, 2011 was due to the allocationof purchase price related to the acquisitions in the year ended December 31, 2011. Amortization expense relatedto intangible assets amounted to $5,856, $1,452 and $692 for years ended December 31, 2011, 2010 and 2009,respectively. Amortization expense for developed technology, which was acquired as part of the Company’s2011 acquisitions, was $517 for the year ended December 31, 2011 and is included in cost of revenues in theaccompanying consolidated statements of operations. Amortization expense for all other intangible assets isincluded as a component of operating expenses in the accompanying consolidated statements of operations. Theintangible asset lives range from one to ten years and the weighted average remaining life was 4.83 years atDecember 31, 2011. Estimated amortization is $7,317, $7,223, $6,490, $4,612, $4,035 and $2,840 for 2012,2013, 2014, 2015, 2016 and thereafter, respectively.
Indefinite-Lived Intangible Assets
An intangible asset that is deemed to have an indefinite useful life is not subject to the same impairmenttesting guidance as definite-lived intangible assets. The accounting guidance notes that the non-amortization ofthe indefinite-life asset merits a more stringent model for the measurement and recognition of impairment.Additionally, because the cash flows associated with indefinite-lived intangible assets would extend into thefuture indefinitely; those assets might never fail the undiscounted cash flows recoverability test that definite-lived intangible assets are subject to. As a result, the recognition of impairment losses on indefinite-livedintangible assets is based solely on a comparison of their fair value to book value, without consideration of anyrecoverability test.
Indefinite-lived intangible assets are to be tested for impairment annually or more frequently if events orchanges in circumstances between annual tests indicate that the asset might be impaired. The impairment testrequires the determination of the fair value of the intangible asset in accordance with ASC 820. If the fair valueof the intangible asset is less than its carrying value, an impairment loss should be recognized in an amount equalto the difference. The asset will then be carried at its new fair value. The Company had established November 30as its annual impairment test date for its indefinite-lived intangible assets.
In connection with the Company’s acquisition of SmallFoot and Zox, as further discussed in Note 2, theCompany acquired certain in-process research and development projects with a carrying value of $390 and $530,respectively, through March 31, 2011. During the three months ended June 30, 2011, the Company concludedthat the SmallFoot in-process research and development project had reached technological feasibility. Prior to
F-14

re-classifying the asset as a definite-lived intangible asset, the Company performed an impairment test utilizingthe income approach to assess whether the carrying value of the asset was impaired. The Company determinedthat the fair value exceeded the carrying value, and therefore, no impairment existed. Therefore, the Companyre-classified the carrying value of $390 relating to the SmallFoot in-process research and development project toa definite-lived intangible asset at June 30, 2011 with a useful life of three years. The amount of amortizationexpense recorded in the year ended December 31, 2011 was $76.
During the three-months ended December 31, 2011, as a result of the Company’s review and realignment ofdevelopment efforts, the Company abandoned its efforts to complete the development of a certain in-processresearch and development indefinite-lived intangible asset related to the 2010 acquisition of Zox. As a result, theCompany recorded an impairment charge related to this indefinite-lived in-process research and developmentintangible asset of $530 and an impairment charge of $17 related to the associated definite-lived patent intangibleasset.
Goodwill
In accordance with ASC 350, Intangibles—Goodwill and Other (formerly FASB SFAS No. 142, Goodwilland Other Intangible Assets) (ASC 350), the Company tests goodwill at the reporting unit level for impairmenton an annual basis and between annual tests if events and circumstances indicate it is more likely than not thatthe fair value of a reporting unit is less than its carrying value. The Company has determined that it currently has2 reporting units: (1) the consolidated Australian operations and (2) all other operations. Although theCompany’s chief operating decision maker, which is our chief executive officer and executive management team,collectively, make business decisions based on the evaluation of financial information at the entity level, certaindiscrete financial information is available related to the Company’s consolidated Australian operations with suchdiscrete financial information utilized by the business unit manager to manage the consolidated Australianoperations and make decisions for those operations. The consolidated Australian operations are comprised of theoperations acquired in the fiscal 2011 acquisitions of Energy Response and another immaterial acquisition, aswell as, the operations of EnerNOC Australia Pty Ltd. Events that would indicate impairment and trigger aninterim impairment assessment include, but are not limited to, current economic and market conditions, includinga decline in market capitalization, a significant adverse change in legal factors, business climate or operationalperformance of the business, and an adverse action or assessment by a regulator. The Company’s annualimpairment test date is November 30.
In performing the test, the Company utilizes the two-step approach prescribed under ASC 350. The first steprequires a comparison of the carrying value of the reporting units, as defined, to the fair value of these units. TheCompany considers a number of factors to determine the fair value of a reporting unit, including an independentvaluation to conduct this test. The valuation is based upon expected future discounted operating cash flows of thereporting unit as well as analysis of recent sales or offerings of similar companies. The Company bases thediscount rate used to arrive at a present value as the date of the impairment test on its weighted average cost ofcapital. If the carrying value of the reporting unit exceeds its fair value, the Company will perform the secondstep of the goodwill impairment test to measure the amount of impairment loss, if any. The second step of thegoodwill impairment test compares the implied fair value of a reporting unit’s goodwill to its carrying value.
In order to determine the fair value of the reporting units, the Company utilizes both a market approachbased on the quoted market price of its common stock and the number of shares outstanding and a discountedcash flow analysis (DCF) under the income approach. The key assumptions that drive the fair value in the DCFmodel are the discount rates (i.e., weighted average cost of capital (WACC)), terminal values, growth rates, andthe amount and timing of expected future cash flows. If the current worldwide financial markets and economicenvironment were to deteriorate, this would likely result in a higher WACC because market participants wouldrequire a higher rate of return. In the DCF, as the WACC increases, the fair value decreases. The other significantfactor in the DCF is its projected financial information (i.e., amount and timing of expected future cash flows andgrowth rates) and if its assumptions were to be adversely impacted, this could result in a reduction of the fairvalue of the entity. The Company conducted its annual impairment and as a result of completing the first step, thefair value exceeded the carrying value, and as such the second step of the impairment test was not required. To
F-15

date, the Company has not been required to perform the second step of the impairment test. As of the annualimpairment test date and as of December 31, 2011, the Company’s market capitalization exceeds the fair value ofits consolidated net assets. Subsequent to December 31, 2011, the Company has experienced a decline in itsmarket capitalization. A prolonged significant decline in the Company’s market capitalization might result infailing the first step of the goodwill impairment test and a goodwill impairment charge.
The estimate of fair value requires significant judgment. Any loss resulting from an impairment test wouldbe reflected in operating loss in the Company’s consolidated statements of operations. The annual impairmenttesting process is subjective and requires judgment at many points throughout the analysis. If these estimates ortheir related assumptions change in the future, the Company may be required to record impairment charges forthese assets not previously recorded.
The following table shows the change of the carrying amount of goodwill from December 31, 2009 toDecember 31, 2011:
Balance at December 31, 2009 . . . . . . . . . . . . . . . . . . . . . . . . . . . . . . . . . . . . . . . . . . . . . . . . . $22,553
Acquisition of SmallFoot and Zox . . . . . . . . . . . . . . . . . . . . . . . . . . . . . . . . . . . . . . . . . . . . . . 240
Purchase price adjustments related to Cogent . . . . . . . . . . . . . . . . . . . . . . . . . . . . . . . . . . . . . 20
SRC earn-out . . . . . . . . . . . . . . . . . . . . . . . . . . . . . . . . . . . . . . . . . . . . . . . . . . . . . . . . . . . . . . 1,840
Balance at December 31, 2010 . . . . . . . . . . . . . . . . . . . . . . . . . . . . . . . . . . . . . . . . . . . . . . . . . 24,653
Acquisition of Global Energy . . . . . . . . . . . . . . . . . . . . . . . . . . . . . . . . . . . . . . . . . . . . . . . . . 18,926
Acquisition of M2M . . . . . . . . . . . . . . . . . . . . . . . . . . . . . . . . . . . . . . . . . . . . . . . . . . . . . . . . . 22,231
Acquisition of Energy Response . . . . . . . . . . . . . . . . . . . . . . . . . . . . . . . . . . . . . . . . . . . . . . . 12,994
Other immaterial acquisition . . . . . . . . . . . . . . . . . . . . . . . . . . . . . . . . . . . . . . . . . . . . . . . . . . 1,042
Foreign currency translation impact . . . . . . . . . . . . . . . . . . . . . . . . . . . . . . . . . . . . . . . . . . . . . (633)
Balance at December 31, 2011 . . . . . . . . . . . . . . . . . . . . . . . . . . . . . . . . . . . . . . . . . . . . . . . . . $79,213
Income Taxes
The Company uses the asset and liability method for accounting for income taxes. Under this method, theCompany determines deferred tax assets and liabilities based on the difference between financial reporting andtaxes bases of its assets and liabilities. The Company records its deferred tax assets and liabilities using enactedtax rates and laws that will be in effect when the Company expects the differences to reverse.
The Company has incurred consolidated net losses since its inception and, as a result, the Company has notrecognized net United States deferred tax assets as of December 31, 2011 or 2010. The Company’s deferred taxliabilities primarily relate to deferred taxes associated with the Company’s acquisitions and property andequipment. The Company’s deferred tax assets relate primarily to net operating loss carryforwards, accruals andreserves, and stock-based compensation. The Company records a valuation allowance to reduce its deferred taxassets to the amount that is more likely than not to be realized. While the Company has considered future taxableincome and ongoing prudent and feasible tax planning strategies in assessing the need for the valuationallowance, in the event the Company were to determine that the Company would be able to realize its deferredtax assets in the future in excess of the net recorded amount, an adjustment to the deferred tax asset wouldincrease income in the period such determination was made.
ASC 740, Income Taxes (ASC 740), (formerly FASB Interpretation No. 48, Accounting for Uncertainty inIncome Taxes — an interpretation of FASB Statement No. 109), prescribes a recognition threshold andmeasurement criteria for the financial statement recognition and measurement of a tax position taken or expectedto be taken in a tax return. ASC 740 also provides guidance on derecognition, classification, interest andpenalties, accounting in interim periods, disclosure, and transition and defines the criteria that must be met for thebenefits of a tax position to be recognized.
F-16
The Company had no unrecognized tax benefits as of December 31, 2011 and 2010.
In the ordinary course of global business, there are many transactions and calculations where the ultimatetax outcome is uncertain. Judgment is required in determining the Company’s worldwide income tax provision.In the Company’s opinion, it is not required that the Company has a provision for income taxes for any yearssubject to audit. Although the Company believes its estimates are reasonable, no assurance can be given that thefinal tax outcome of matters will not be different than that which is reflected in the Company’s historical incometax provisions and accruals. In the event the Company’s assumptions are incorrect, the differences could have amaterial impact on its income tax provision and operating results in the period in which such determination ismade.
Industry Segment Information
The Company is required to disclose the standards for reporting information about its operating segments inannual financial statements and required selected information of these segments being presented in interimfinancial reports issued to stockholders. Operating segments are defined as components of an enterprise aboutwhich separate financial information is available that is evaluated regularly by the chief operating decisionmaker, or decision making group, in making decisions on how to allocate resources and assess performance. TheCompany’s chief decision maker is considered to be the team comprised of the chief executive officer and theexecutive management team. The Company views its operations and manages its business as one operatingsegment.
The Company operates in several geographic areas, primarily the United States, Canada, United Kingdom,Australia and New Zealand. Revenues derived from United States operations comprise the majority ofconsolidated revenues. International subsidiaries comprised less than 10% of consolidated revenues for the yearsended December 31, 2011, 2010 and 2009, respectively, and tangible assets of international subsidiaries was lessthan 10% of total consolidated assets as of December 31, 2011, 2010 and 2009, respectively.
Revenue Recognition
The Company recognizes revenues in accordance with Accounting Standards Codification 605, RevenueRecognition (ASC 605). In all of the Company’s arrangements, it does not recognize any revenues until it candetermine that persuasive evidence of an arrangement exists, delivery has occurred, the fee is fixed ordeterminable, and it deems collection to be reasonably assured. In making these judgments, the Companyevaluates these criteria as follows:
• Evidence of an arrangement. The Company considers a definitive agreement signed by the customer andthe Company or an arrangement enforceable under the rules of an open market bidding program to berepresentative of persuasive evidence of an arrangement.
• Delivery has occurred. The Company considers delivery to have occurred when service has beendelivered to the customer and no significant post-delivery obligations exist. In instances where customeracceptance is required, delivery is deemed to have occurred when customer acceptance has been achieved.
• Fees are fixed or determinable. The Company considers the fee to be fixed or determinable unless the fee issubject to refund or adjustment or is not payable within normal payment terms. If the fee is subject to refundor adjustment and the Company cannot reliably estimate this amount, the Company recognizes revenues whenthe right to a refund or adjustment lapses. If offered payment terms exceed the Company’s normal terms, theCompany recognizes revenues as the amounts become due and payable or upon the receipt of cash.
• Collection is reasonably assured. The Company conducts a credit review at the inception of anarrangement to determine the creditworthiness of the customer. Collection is reasonably assured if, basedupon evaluation, the Company expects that the customer will be able to pay amounts under thearrangement as payments become due. If the Company determines that collection is not reasonablyassured, revenues are deferred and recognized upon the receipt of cash.
F-17

The Company enters into contracts and open market bidding programs with utilities and electric power gridoperators to provide demand response applications and services. Demand response revenues consist of twoelements: revenue earned based on the Company’s ability to deliver committed capacity to its electric power gridoperator and utility customers, which the Company refers to as capacity revenue; and revenue earned based onadditional payments made to the Company for the amount of energy usage actually curtailed from the grid duringa demand response event, which the Company refers to as energy event revenue.
The Company recognizes demand response revenue when it has provided verification to the electric powergrid operator or utility of its ability to deliver the committed capacity which entitles the Company to paymentsunder the contract or open market program. Committed capacity is generally verified through the results of anactual demand response event or a measurement and verification test. Once the capacity amount has beenverified, the revenue is recognized and future revenue becomes fixed or determinable and is recognized monthlyuntil the next demand response event or test. In subsequent verification events, if the Company’s verifiedcapacity is below the previously verified amount, the electric power grid operator or utility customer will reducefuture payments based on the adjusted verified capacity amounts. Ongoing demand response revenue recognizedbetween demand response events or tests that are not subject to penalty or customer refund are recognized inrevenue. If the revenue is subject to refund and the amount of refund cannot be reliably estimated, the revenue isdeferred until the right of refund lapses.
The Company has evaluated the factors within ASC 605-45-45 regarding gross versus net revenue reportingfor its demand response revenues and its payments to C&I customers. Based on the evaluation of the factorswithin ASC 605-45-45, the Company determined that all of the applicable indicators of gross revenue reportingwere met. These applicable indicators of gross revenue reporting included, but were not limited to, the following:
• The Company is the primary obligor in its arrangements with electric power grid operators and utilitycustomers because the Company provides its demand response services directly to electric power gridoperators and utilities under long-term contracts or pursuant to open market programs and contractsseparately with C&I customers to deliver such services. The Company manages all interactions with theelectric power grid operators and utilities, while C&I customers do not interact with the electric powergrid operators and utilities. In addition, the Company assumes the entire performance risk under itsarrangements with electric power grid operators and utility customers, including the posting of financialassurance to assure timely delivery of committed capacity with no corresponding financial assurancereceived from its C&I customers. In the event of a shortfall in delivered committed capacity, the Companyis responsible for all penalties assessed by the electric power grid operators and utilities without regard forany recourse the Company may have with its C&I customers.
• The Company has latitude in establishing pricing, as the pricing under its arrangements with electricpower grid operators and utilities is negotiated through a contract proposal and contracting process ordetermined through a capacity auction. The Company then separately negotiates payment to C&Icustomers and has complete discretion in the contracting process with the C&I customer.
• The Company has complete discretion in determining the supplier (C&I customer) to provide the demandresponse services, provided that the C&I customer is located in the same region as the applicable electricpower grid operator or utility.
• The Company is involved in both the determination of service specifications and performs part of theservices, including the installation of metering and other equipment for the monitoring, data gathering andmeasurement of performance, as well as, in certain circumstances, the remote control of C&I customer loads.
As a result, the Company determined that it earns revenue (as a principal) from the delivery of demandresponse services to electric power grid operators and utility customers and records the amounts billed to theelectric power grid operators and utility customers as gross demand response revenues and the amounts paid toC&I customers as cost of revenues.
In one of the open market program in which the Company participates, the program year operates on a Juneto May basis and performance is measured based on the aggregate performance during the months of June
F-18

through September. As a result, fees received for the month of June could potentially be subject to adjustment orrefund based on performance during the months of July through September. The Company had historicallyconcluded that it could reliably estimate the amount of fees potentially subject to adjustment or refund, andrecorded a reserve for this amount in the month of June. As of June 30, 2011, the Company recorded anestimated reserve of $9,260 related to potential subsequent performance adjustments. The fees under thisprogram were fixed as of September 30, 2011 and, based on final performance during the three months endedSeptember 30, 2011, the Company recorded a reduction in the estimated reserve totaling $3,690 million, whichresulted in final performance adjustments of $5,570 million. The Company has re-evaluated its ability to reliablyestimate the amount of fees potentially subject to adjustment or refund for the year ending December 31, 2012(fiscal 2012) on a prospective basis based on its consideration of its historical performance under this program, aswell as, additional guidance issued by the customer regarding its interpretation of certain program rules, as wellas, changes to certain program rules that will impact performance calculations on a prospective basis. Based onthe changes in certain program rules, the Company has concluded that it no longer has the ability to reliablyestimate the amount of fees potentially subject to adjustment or refund until the performance period ends onSeptember 30th of each year. Therefore, on a prospective basis, all revenues related to its participation in thisprogram will be recognized at the end of the performance period, or during the three months endedSeptember 30th of the applicable year. In addition, in accordance with its policy to capitalize direct andincremental costs associated with deferred revenues to the extent that such costs are realizable, the Company willcapitalize the associated cost of its payments to C&I customers for the month of June and expense suchcapitalized costs when the associated deferred revenues are recognized. The Company will evaluate the directand incremental costs for recoverability prior to capitalization.
As a result of contractual amendments entered into during the year ended December 31, 2011 to amendcertain refund provisions included in one of the Company’s contracts with a utility customer, the Companyconcluded that it could reliably estimate the fees potentially subject to refund and, therefore, the fees under thisarrangement were fixed or determinable. As a result, during the year ended December 31, 2011 the Companyrecognized as revenues $5,319 of fees that had been previously deferred. As of December 31, 2011, there wereno deferred revenues related to this contractual arrangement.
Certain of the forward capacity programs in which the Company participates may be deemed derivativecontracts under ASC 815, Derivatives and Hedging (ASC 815). In such situations, the Company believes it meetsthe scope exception under ASC 815 as a normal purchase, normal sale as that term is defined in ASC and,accordingly, the arrangement is not treated as a derivative contract.
Energy event revenues are recognized when earned. Energy event revenue is deemed to be substantive andrepresents the culmination of a separate earnings process and is recognized when the energy event is initiated bythe electric power grid operator or utility customer and the Company has responded under the terms of thecontract or open market program.
Under certain of the Company’s arrangements, in particular those arrangements entered into by theCompany’s wholly-owned subsidiary, M2M, the Company sells proprietary equipment to C&I customers that isutilized to provide the ongoing services that the Company delivers. Currently, this equipment has beendetermined to not have stand-alone value. As a result, the Company defers the fees associated with the equipmentand the Company begins recognizing those fees ratably over the expected C&I customer relationship period(generally 3 years), once the C&I customer is receiving the ongoing services from the Company. In addition, theCompany capitalizes the associated direct and incremental costs, which primarily represent the equipment andthird-party installation costs, and recognizes such costs over the expected C&I customer relationship period.
F-19

In September 2009, the Financial Accounting Standards Board (FASB) ratified ASC Update No. 2009-13,Multiple-Deliverable Revenue Arrangements (ASU 2009-13). ASU 2009-13 amends existing revenue recognitionaccounting pronouncements that are currently within the scope of ASC Subtopic 605-25, which is the revenuerecognition guidance for multiple-element arrangements. ASU 2009-13 provides for three significant changes tothe existing multiple-element revenue recognition guidance as follows:
• eliminates the requirement to have objective and reliable evidence of fair value for undelivered elementsin an arrangement. This may result in more deliverables being treated as separate units of accounting;
• modifies the manner in which the arrangement consideration is allocated to the separately identifieddeliverables. ASU 2009-13 requires an entity to allocate revenue in an arrangement using its best estimateof selling prices (ESP) of deliverables if a vendor does not have vendor-specific objective evidence ofselling price (VSOE) or third-party evidence of selling price (TPE), if VSOE is not available. Eachseparate unit of accounting must have a selling price, which can be based on management’s estimate whenthere is no other means (VSOE or TPE) to determine the selling price of that deliverable. The arrangementconsideration is allocated based on the elements’ relative selling prices; and
• eliminates use of the residual method and requires an entity to allocate revenue using the relative sellingprice method, which results in the discount in the transaction being evenly allocated to the separate unitsof accounting.
As required, the Company adopted ASU 2009-13 at the beginning of its first quarter of the fiscal year endedDecember 31, 2011 (fiscal 2011) on a prospective basis for transactions originating or materially modified on orafter January 1, 2011. ASU 2009-13 generally does not change the units of accounting for the Company’srevenue transactions. The impact of adopting ASU 2009-13 was not material to the Company’s financialstatements during the year ended December 31, 2011, and if it was applied in the same manner to the fiscal yearended December 31, 2010 (fiscal 2010) would not have had a material impact to revenue for the year endedDecember 31, 2010. The Company does not expect the adoption of ASU 2009-13 to have a significant impact onthe timing and pattern of revenue recognition in the future due to the Company’s limited number of multipleelement arrangements. The key impact that the Company expects the adoption of ASU 2009-13 to have relates tocertain EfficiencySMART service arrangements with C&I customers who also provide curtailment of capacity aspart of the Company’s demand response arrangements. Historically, the Company recorded the fees recognizedunder these arrangements as a reduction of cost of revenues as evidence of fair value did not exist for certainEfficiencySMARTservices due to the limited history of selling these separately and lack of availability of TPE.As previously stated, the impact of ASU 2009-13 has not been and is not expected to be material.
The Company typically determines the selling price of its services based on VSOE. Consistent with itsmethodology under previous accounting guidance, the Company determines VSOE based on its normal pricingand discounting practices for the specific service when sold on a stand-alone basis. In determining VSOE, theCompany’s policy is to require a substantial majority of selling prices for a product or service to be within areasonably narrow range. The Company also considers the class of customer, method of distribution, and thegeographies into which its products and services are sold into when determining VSOE. The Company typicallyhas had VSOE for its products and services.
In certain circumstances, the Company is not able to establish VSOE for all deliverables in a multipleelement arrangement. This may be due to the infrequent occurrence of stand-alone sales for an element, a limitedsales history for new services or pricing within a broader range than permissible by the Company’s policy toestablish VSOE. In those circumstances, the Company proceeds to the alternative levels in the hierarchy ofdetermining selling price. TPE of selling price is established by evaluating largely similar and interchangeablecompetitor products or services in stand-alone sales to similarly situated customers. The Company is typicallynot able to determine TPE and has not used this measure since the Company has been unable to reliably verifystandalone prices of competitive solutions. ESP is established in those instances where neither VSOE nor TPEare available, considering internal factors such as margin objectives, pricing practices and controls, customersegment pricing strategies and the product life cycle. Consideration is also given to market conditions such ascompetitor pricing information gathered from experience in customer negotiations, market research and
F-20

information, recent technological trends, competitive landscape and geographies. Use of ESP is limited to a verysmall portion of the Company’s services, principally certain EfficiencySMART services.
Cost of Revenues
Cost of revenues for demand response services consists primarily of amounts owed to the Company’s C&Icustomers for their participation in the Company’s demand response network and are generally recognized overthe same performance period as the corresponding revenue. The Company enters into contracts with C&Icustomers under which it delivers recurring cash payments to them for the capacity they commit to makeavailable on demand. The Company also generally makes an additional payment when a C&I customer reducesconsumption of energy from the electric power grid during a demand response event. The equipment andinstallation costs for devices located at C&I customer sites, which monitor energy usage, communicate with C&Icustomer sites and, in certain instances, remotely control energy usage to achieve committed capacity arecapitalized and depreciated over the lesser of the remaining estimated customer relationship period or theestimated useful life of the equipment, and this depreciation is reflected in cost of revenues. The Company alsoincludes in cost of revenues the amortization of acquired developed technology, amortization of capitalizedinternal-use software costs related to DemandSMART application, the monthly telecommunications and datacosts incurred as a result of being connected to a C&I customer sites, and the internal payroll and related costsallocated to a C&I customer site. Cost of revenues for the EfficiencySMART, SupplySMART andCarbonSMART applications and services and for the sale, installation and ongoing services of the Company’swireless technology solutions include amortization of capitalized internal-use software costs related to thoseapplications and services, third party services, equipment costs, equipment depreciation, and the wages andassociated benefits that the Company pays to its project managers for the performance of their services.
Research and Development Expenses
Research and development expenses consist primarily of (a) salaries and related personnel costs, includingcosts associated with share-based payment awards, related to the Company’s research and developmentorganization, (b) payments to suppliers for design and consulting services, (c) costs relating to the design anddevelopment of new energy management applications, services and products and enhancement of existing energymanagement applications, services and products, (d) quality assurance and testing and (e) other related overhead.Costs incurred in research and development are expensed as incurred.
Stock-Based Compensation
The Company accounts for stock-based compensation in accordance with ASC 718, Stock Compensation(ASC 718). As such, all share-based payments to employees, including grants of stock options, restricted stockand restricted stock units, are recognized in the statement of operations based on their fair values as of the date ofgrant. As of December 31, 2011, the Company had one stock-based compensation plan, which is more fullydescribed in Note 9 below. Generally, the Company grants stock-based awards with exercise prices equal to theestimated fair value of its common stock; however, to the extent that the deemed fair value of the common stockexceeded the exercise or purchase price of stock-based awards granted to employees on the date of grant, theCompany amortizes the expense over the vesting schedule of the awards, generally four years.
For stock options granted prior to January 1, 2009, the fair value of each option was estimated at the date ofgrant using a Black-Scholes option-pricing model. For stock options granted on or after January 1, 2009, the fairvalue of each option has been and will be estimated on the date of grant using a lattice valuation model. Thelattice model considers characteristics of fair value option pricing that are not available under the Black-Scholesmodel. Similar to the Black-Scholes model, the lattice model takes into account variables such as expectedvolatility, dividend yield rate, and risk free interest rate. However, in addition, the lattice model considers theprobability that the option will be exercised prior to the end of its contractual life and the probability oftermination or retirement of the option holder in computing the value of the option. For these reasons, theCompany believes that the lattice model provides a fair value that is more representative of actual experience and
F-21

future expected experience than that value calculated using the Black-Scholes model. Stock-based compensationfor the years ended December 31, 2011, 2010 and 2009 was $13,464, $15,742 and $13,134, respectively. Foradditional information regarding stock-based compensation see Note 9.
The Company accounts for transactions in which services are received from non-employees in exchange forequity instruments based on the fair value of such services received or of the equity instruments issued,whichever is more reliably measurable. During the years ended December 31, 2011, 2010 and 2009, thestock-based compensation expense related to share-based payments to non-employees was not material.
Foreign Currency Translation
The financial statements of the Company’s international subsidiaries are translated in accordance with ASC830, Foreign Currency Matters (formerly SFAS No. 52, Foreign Currency Translation) (ASC 830), into theCompany’s reporting currency, which is the United States dollar. The functional currencies of the Company’ssubsidiaries in Canada, the United Kingdom, Australia and New Zealand are the Canadian dollar, the Britishpound, the Australian dollar and the New Zealand dollar, respectively. Assets and liabilities are translated to theUnited States dollar from the local functional currency at the exchange rate in effect at each balance sheet date.Before translation, the Company re-measures foreign currency denominated assets and liabilities, includingcertain inter-company accounts receivable and payable that have been determined to not be of a “long-terminvestment” nature, as defined by ASC 830, into the functional currency of the respective entity, resulting inunrealized gains or losses recorded in the consolidated statement of operations. Revenues and expenses aretranslated using average exchange rates during the respective period.
Foreign currency translation adjustments are recorded as a component of other comprehensive income andincluded in accumulated other comprehensive loss within stockholders’ equity. Losses arising from transactionsdenominated in foreign currencies and the remeasurement of certain intercompany receivables and payables areincluded in other (expense) income, net on the consolidated statements of operations and were $1,580, $133, and$29 for the years ended December 31, 2011, 2010 and 2009, respectively. The significant increase in lossesarising from transactions denominated in foreign currencies for the year ended December 31, 2011 as comparedto the comparable periods of 2010 is due to the significant increase of foreign denominated intercompanyreceivables held by the Company from one of its Australian subsidiaries primarily as a result of the fundingprovided to complete the acquisition of Energy Response (see Note 2) and the strengthening of the United Statesdollar as compared to the Australian dollar during the year ended December 31, 2011. During the years endedDecember 31, 2011 and 2010, there were no material realized gains or losses incurred related to transactionsdenominated in foreign currencies. As of December 31, 2011, the Company had an intercompany receivablefrom its Australian subsidiary that is denominated in Australia dollars and not deemed to be of a “long-terminvestment” nature totaling $33,657 ($33,074 Australian). Subsequent to December 31, 2011, $17,468 ($16,400Australian) of the intercompany receivable from the Company’s Australian subsidiary was settled resulting in arealized gain of $494.
In addition, a portion of the funding provided by the Company to one of its Australian subsidiaries tocomplete the acquisition of Energy Response (see Note 2) was deemed to be of a “long-term investment nature”and therefore, the resulting translation adjustments are being recorded as a component of stockholders’ equitywithin accumulated other comprehensive loss. As of December 31, 2011, the intercompany funding that isdenominated in Australia dollars and deemed to be of a “long-term investment” nature totaled $21,671 ($20,364Australian).
Comprehensive Income (Loss)
Comprehensive income (loss) is defined as the change in equity of a business enterprise during a periodresulting from transactions and other events and circumstances from non-owner sources. Comprehensive income(loss) is composed of net income (loss) and foreign currency translation adjustments. As of December 31, 2011and 2010, accumulated other comprehensive income (loss) was comprised solely of cumulative foreign currencytranslation adjustments. The Company presents its components of other comprehensive income, net of related taxeffects, which have not been material to date.
F-22

Recent Accounting Pronouncements
In September 2011, the FASB issued ASU 2011-08, Intangibles — Goodwill and Other (Topic 350):Testing Goodwill for Impairment (ASU 2011-08), which gives companies the option to first perform a qualitativeassessment to determine whether it is more likely than not that the fair value of a reporting unit is less than itscarrying amount. If a company concludes that this is the case, it must perform the two-step test. Otherwise, acompany can forgo the two-step test. ASU 2011-08 is effective for fiscal years that begin after December 15,2011; however, early adoption is permitted. The Company is currently evaluating the impact of ASU 2011-08,including whether it will early adopt. The Company does not expect the adoption of ASU 2011-08 to have amaterial impact on its financial condition or results of operations.
Amendments to Achieve Common Fair Value Measurement and Disclosure Requirements in U.S. GAAP andIFRS
In May 2011, the FASB issued ASU 2011-04, Amendments to Achieve Common Fair Value Measurementand Disclosure Requirements in U.S. GAAP and IFRS (ASU 2011-04), which amends FASB’s accountingguidance related to fair value measurements in order to more closely align its disclosure requirements with thosein International Financial Reporting Standards. ASU 2011-04 clarifies the application of existing fair valuemeasurement and disclosure requirements and also changes certain principles or requirements for measuring fairvalue or for disclosing information about fair value measurements. ASU 2011-04 is effective for interim andannual periods beginning after December 15, 2011. The adoption of ASU 2011-04 is not expected to have amaterial effect on the Company’s financial condition or results of operations.
Presentation of Comprehensive Income
In June 2011, the FASB issued ASU 2011-05, Presentation of Comprehensive Income (ASU 2011-05),which represents new accounting guidance related to the presentation of other comprehensive income (OCI).ASU 2011-05 eliminates the option to present components of OCI as part of the statement of changes inshareholders’ equity, which is the option that the Company currently uses to present OCI. ASU 2011-05 allowsfor a one-statement or two-statement approach, outlined as follows:
• One-statement approach: Present the components of net income and total net income, the components ofOCI and a total for OCI, along with the total of comprehensive income in a single continuous statement.
• Two-statement approach: Present the components of net income and total net income in the statement ofnet income. A statement of OCI would immediately follow the statement of net income and include thecomponents of OCI and a total for OCI, along with the total of comprehensive income.
ASU 2011-05 also required an entity to present on the face of the financial statements any reclassificationadjustments for items that are reclassified from OCI to net income (see below). ASU 2011-05 is effective forinterim and annual periods beginning after December 15, 2011.
In December 2011, the FASB issued ASU 2011-12, Comprehensive Income (Topic 220): Deferral of theEffective Date for Amendments to the Presentation of Reclassifications of Items Out of Accumulated OtherComprehensive Income in Accounting Standards Update No. 2011-05(ASU 2011-12). The amendments in ASU2011-12 defers only those changes in ASU 2011-05 that related to the presentation of reclassificationadjustments and supersedes only those paragraphs that pertain to how and where reclassification adjustments arepresented. All other requirements in ASU 2011-05 are not affected by ASU 2011-12, including the requirementto report comprehensive income either in a single continuous financial statement or in two separate butconsecutive financial statements, effective for interim and annual periods beginning after December 15, 2011.
The adoption of ASU 2011-05 and ASU 2011-12 will not have an effect on the Company’s financialcondition or results of operations, but will only impact how certain information related to OCI is presented in theconsolidated financial statements.
F-23

2. Acquisitions
Energy Response Holdings Pty Ltd
In July 2011, the Company and one of its subsidiaries acquired all of the outstanding capital stock of EnergyResponse, a privately-held company headquartered in Australia and specializing in demand response and otherenergy management services in Australia and New Zealand, pursuant to a definitive agreement dated July 1,2011. The Company concluded that this acquisition represents a business combination and therefore, hasaccounted for it as such. The Company believes that Energy Response will enhance and broaden the Company’sservice offerings in Australia and New Zealand.
The Company concluded that the acquisition of Energy Response represented a material businesscombination under the provisions of ASC 805, Business Combinations (ASC 805), and therefore, pro formafinancial information has been provided herein. Subsequent to the acquisition date, the Company’s results ofoperations include the results of operations of Energy Response.
The Company acquired Energy Response for an aggregate purchase price, exclusive of potential contingentconsideration, of $29,286, plus an additional $470 paid as working capital and other adjustments, consisting of$27,265 in cash paid at closing and $2,491 representing the fair value of the 156,697 shares of Companycommon stock issued as of the acquisition date. Of the consideration paid at closing, $2,646 was paid asconsideration to settle Energy Response’s outstanding debt obligations. In addition to the amounts paid atclosing, the Company may be obligated to pay additional contingent purchase price consideration related to anearn-out payment equal to $10,718 ($10,000 Australian). The earn-out payment, if any, will be based on thedevelopment of a demand response reserve capacity market in the National Electricity Market in Australia byDecember 31, 2013 that meets certain market size and price per megawatt conditions. This milestone needs to beachieved in order for the earn-out payment to occur and there will be no partial payment if the milestone is notfully achieved. The Company determined that the initial fair value of the earn-out payment as of the acquisitiondate was $309. This fair value was included as a component of the purchase price resulting in an aggregatepurchase price of $30,065. Any changes in fair value will be recorded in the Company’s consolidated statementsof operations. The Company recorded its estimate of the fair value of the contingent consideration based on theevaluation of the likelihood of the achievement of the contractual conditions that would result in the payment ofthe contingent consideration and weighted probability assumptions of these outcomes. This fair valuemeasurement was based on significant inputs not observable in the market and therefore, represented a Level 3measurement as defined in ASC 820. As of December 31, 2011, there were no changes in the probability of theearn out payment. This liability has been discounted to reflect the time value of money and therefore, as themilestone date approaches, the fair value of this liability will increase. This increase in fair value was recorded ingeneral and administrative expenses in the Company’s accompanying consolidated statements of operations.During the year ended December 31, 2011, the Company recorded a charge of $46. At December 31, 2011, theliability was recorded at $336 after adjusting for changes in exchange rates.
Transaction costs of approximately $500 related to this business combination have been expensed asincurred, which are included in general and administrative expenses in the Company’s consolidated statements ofoperations.
Based on new information gathered about facts and circumstances that existed as of the acquisition daterelated to the valuation of certain acquired identifiable intangible assets, the Company updated the preliminaryvaluations during the three months ended December 31, 2011. The revised valuations resulted in a decrease in thefair value of the acquired customer relationships intangible assets of $400 and a corresponding increase togoodwill. The change in estimate of the amortization expense related to the change in the fair value of acquiredcustomer relationships which was recorded in the three months ended December 31, 2011 was not material.
F-24

The components and preliminary allocation of the purchase price consists of the following approximateamounts:
Net tangible assets acquired as of July 1, 2011 . . . . . . . . . . . . . . . . . . . . . . . . . . . . . . . . . . . . $ 228
Customer relationships . . . . . . . . . . . . . . . . . . . . . . . . . . . . . . . . . . . . . . . . . . . . . . . . . . . . . . . 16,400
Non-compete agreements . . . . . . . . . . . . . . . . . . . . . . . . . . . . . . . . . . . . . . . . . . . . . . . . . . . . . 79
Developed technology . . . . . . . . . . . . . . . . . . . . . . . . . . . . . . . . . . . . . . . . . . . . . . . . . . . . . . . 165
Trade name . . . . . . . . . . . . . . . . . . . . . . . . . . . . . . . . . . . . . . . . . . . . . . . . . . . . . . . . . . . . . . . . 199
Goodwill . . . . . . . . . . . . . . . . . . . . . . . . . . . . . . . . . . . . . . . . . . . . . . . . . . . . . . . . . . . . . . . . . . 12,994
Total . . . . . . . . . . . . . . . . . . . . . . . . . . . . . . . . . . . . . . . . . . . . . . . . . . . . . . . . . . . . . . . . . . . . . $30,065
Net tangible assets acquired in the acquisition of Energy Response primarily related to the following:
Cash . . . . . . . . . . . . . . . . . . . . . . . . . . . . . . . . . . . . . . . . . . . . . . . . . . . . . . . . . . . . . . . . . . . . . . $ 695
Restricted cash . . . . . . . . . . . . . . . . . . . . . . . . . . . . . . . . . . . . . . . . . . . . . . . . . . . . . . . . . . . . . 2,237
Accounts receivable . . . . . . . . . . . . . . . . . . . . . . . . . . . . . . . . . . . . . . . . . . . . . . . . . . . . . . . . . 148
Unbilled revenue . . . . . . . . . . . . . . . . . . . . . . . . . . . . . . . . . . . . . . . . . . . . . . . . . . . . . . . . . . . . 633
Prepaids and other assets . . . . . . . . . . . . . . . . . . . . . . . . . . . . . . . . . . . . . . . . . . . . . . . . . . . . . 756
Forward energy contracts (current asset) . . . . . . . . . . . . . . . . . . . . . . . . . . . . . . . . . . . . . . . . . 144
Property and equipment . . . . . . . . . . . . . . . . . . . . . . . . . . . . . . . . . . . . . . . . . . . . . . . . . . . . . . 780
Accounts payable . . . . . . . . . . . . . . . . . . . . . . . . . . . . . . . . . . . . . . . . . . . . . . . . . . . . . . . . . . . (1,114)
Amounts due to former stockholders . . . . . . . . . . . . . . . . . . . . . . . . . . . . . . . . . . . . . . . . . . . . (2,051)
Accrued expenses and other liabilities . . . . . . . . . . . . . . . . . . . . . . . . . . . . . . . . . . . . . . . . . . . (1,868)
Forward energy contracts (current liability) . . . . . . . . . . . . . . . . . . . . . . . . . . . . . . . . . . . . . . . (132)
Total . . . . . . . . . . . . . . . . . . . . . . . . . . . . . . . . . . . . . . . . . . . . . . . . . . . . . . . . . . . . . . . . . . . . . $ 228
Restricted cash acquired primarily relates to certain security deposits posted by Energy Response tocollateralize its performance obligations under certain contractual arrangements with electric power grid operatorcustomers. In accordance with the definitive agreement, the Company is required to distribute to the formerstockholders of Energy Response $2,051 of this restricted cash upon the amount being released by the applicableelectric power grid operator customers. This amount has been classified as an amount due to the formerstockholders in the reconciliation of net tangible assets acquired above. This amount was released by the electricpower grid operator customers and the Company distributed this amount to the former stockholders during thethree months ended September 30, 2011. The remaining restricted cash relates to amounts used to collateralizeEnergy Response’s obligations under certain of its facility operating lease arrangements. The acquired forwardenergy contracts represent derivative instruments. ASC Topic 815 requires all derivative instruments to berecognized at their fair values as either assets or liabilities on the balance sheet. The Company determined thefair value of these derivative instruments using the framework prescribed by ASC 820, by considering theestimated amount that would be received or paid to sell or transfer these instruments at the reporting date and bytaking into account current interest rates, current energy rates, and the creditworthiness of the applicablecounterparty. These acquired forward energy contracts were short-term arrangements which either expired orwere terminated prior to September 30, 2011. The Company has not entered into any additional forward energycontracts since the acquisition date and therefore, the Company held no derivative instruments as ofSeptember 30, 2011. From the date of acquisition through the date of expiration or termination, the change in fairvalue of these forward energy contracts was not material and was included in other expense (income), net in theaccompanying consolidated statements of operations.
F-25

Identifiable Intangible Assets
As part of the preliminary purchase price allocation, the Company determined that Energy Response’sseparately identifiable intangible assets were its customer relationships, non-compete agreements, developedtechnology and trade name. Developed technology represented certain proprietary software tools that EnergyResponse had developed, which are utilized to assist in the management of certain contractual arrangements. Asof the date of acquisition, the Company determined that there was no in-process research and development as theongoing research and development efforts were nominal and related to routine, on-going maintenance efforts.
The Company used the income approach to value the customer relationships, non-compete agreements,developed technology and trade name. This approach calculates fair value by discounting the after-tax cash flowsback to a present value. The baseline data for this analysis was the cash flow estimates used to price thetransaction. Cash flows were forecasted for each intangible asset then discounted based on an appropriatediscount rate. The discount rates applied, which ranged between 12% and 17%, were benchmarked withreference to the implied rate of return from the transaction model, as well as an estimate of a market-participant’sweighted average cost of capital based on the capital asset pricing model.
In estimating the useful life of the acquired assets, the Company considered ASC 350-30-35, GeneralIntangibles Other Than Goodwill (ASC 350-30-35), which lists the pertinent factors to be considered whenestimating the useful life of an intangible asset. These factors include a review of the expected use by thecombined company of the assets acquired, the expected useful life of another asset (or group of assets) related tothe acquired assets, legal, regulatory or other contractual provisions that may limit the useful life of an acquiredasset or may enable the extension of the useful life of an acquired asset without substantial cost, the effects ofobsolescence, demand, competition and other economic factors, and the level of maintenance expendituresrequired to obtain the expected future cash flows from the asset. The Company amortizes these intangible assetsover their estimated useful lives using a method that is based on estimated future cash flows, as the Companybelieves this will approximate the pattern in which the economic benefits of the assets will be utilized, or wherethe Company has concluded that the cash flows were not reliably determinable, on a straight-line basis.
Subsequent to the acquisition, the Company discontinued the use of the trade name intangible asset andrecorded an impairment charge of $199. This amount is included in selling and marketing expense in theaccompanying consolidated statements of income during the year December 31, 2011.
The factors contributing to the recognition of this amount of goodwill were based upon the Company’sdetermination that several strategic and synergistic benefits are expected to be realized from the combination.None of the goodwill is expected to be currently deductible for tax purposes.
As noted above, the Company’s consolidated results of operations for the year ended December 31, 2011include the results of operations for Energy Response from the date of acquisition through December 31, 2011,which included net revenues of $3,534 and net loss of $4,151.
The following unaudited pro forma financial information presents the consolidated results of operations ofthe Company and Energy Response as if the acquisition had occurred at the beginning of fiscal 2010 with proforma adjustments to give effect to amortization of intangible assets, a decrease in interest expense as all ofEnergy Response’s debt arrangement were settled in connection with the acquisition, an increase in weightedaverage number of common shares outstanding based on the shares issued in connection with the acquisition andcertain other adjustments:
Year ended December 31,
2011 2010
Net revenue . . . . . . . . . . . . . . . . . . . . . . . . . . . . . . . . . . . . . . . . . . . . . . . . . . . . $289,803 $282,610
Net (loss) income . . . . . . . . . . . . . . . . . . . . . . . . . . . . . . . . . . . . . . . . . . . . . . . $ (16,317) $ 4,140
Net (loss) income per common share:
Basic . . . . . . . . . . . . . . . . . . . . . . . . . . . . . . . . . . . . . . . . . . . . . . . . . . . . . $ (0.63) $ 0.17
Diluted . . . . . . . . . . . . . . . . . . . . . . . . . . . . . . . . . . . . . . . . . . . . . . . . . . . . $ (0.63) $ 0.16
F-26

The direct acquisition fees and expenses of approximately $500 that were a direct result of the transactionare excluded from the unaudited pro forma information above for the year ended December 31, 2011. Theunaudited pro forma financial information for the year ended December 31, 2010 was adjusted to include thesecharges. The unaudited pro forma results are not necessarily indicative of the results that the Company wouldhave attained had the acquisitions of Energy Response occurred on January 1, 2010.
Global Energy Partners, Inc.
In January 2011, the Company acquired all of the outstanding capital stock of Global Energy, a privately-held company located in California and specializing in the design and implementation of utility energy efficiencyand demand response programs. The Company believes that Global Energy’s service offerings will enhance andbroaden its portfolio of service offerings in the area of energy efficiency and demand response.
The Company concluded that the acquisition of Global Energy did not represent a material businesscombination and therefore, no pro forma financial information has been provided herein. Subsequent to theacquisition date, the Company’s results of operations include the results of operations of Global Energy. TheCompany accounted for the acquisition of Global Energy as a purchase of a business under ASC 805.
The total purchase price paid by the Company at closing was approximately $26,658, consisting of $19,875in cash and the remainder of which was paid by the issuance of 275,181 shares of the Company’s common stockthat had a fair value of approximately $6,783. The fair value of these shares was measured as of the acquisitiondate using the closing price of the Company’s common stock, as reported on NASDAQ on January 3, 2011. Thisacquisition had no contingent consideration or earn-out payments.
Transaction costs related to this business combination were not material and have been expensed asincurred, which are included in general and administrative expenses in the accompanying consolidatedstatements of operations.
The components and allocation of the purchase price consist of the following approximate amounts:
Net tangible assets acquired as of January 3, 2011 . . . . . . . . . . . . . . . . . . . . . . . . . . . . . . . . . $ 572
Customer relationships . . . . . . . . . . . . . . . . . . . . . . . . . . . . . . . . . . . . . . . . . . . . . . . . . . . . . . . 6,430
Non-compete agreements . . . . . . . . . . . . . . . . . . . . . . . . . . . . . . . . . . . . . . . . . . . . . . . . . . . . . 420
Developed technology . . . . . . . . . . . . . . . . . . . . . . . . . . . . . . . . . . . . . . . . . . . . . . . . . . . . . . . 50
Trade name . . . . . . . . . . . . . . . . . . . . . . . . . . . . . . . . . . . . . . . . . . . . . . . . . . . . . . . . . . . . . . . . 260
Goodwill . . . . . . . . . . . . . . . . . . . . . . . . . . . . . . . . . . . . . . . . . . . . . . . . . . . . . . . . . . . . . . . . . . 18,926
Total . . . . . . . . . . . . . . . . . . . . . . . . . . . . . . . . . . . . . . . . . . . . . . . . . . . . . . . . . . . . . . . . . . . . . $26,658
Net tangible assets acquired in the acquisition of Global Energy primarily related to the following:
Cash . . . . . . . . . . . . . . . . . . . . . . . . . . . . . . . . . . . . . . . . . . . . . . . . . . . . . . . . . . . . . . . . . . . . . . $ 273
Accounts receivable . . . . . . . . . . . . . . . . . . . . . . . . . . . . . . . . . . . . . . . . . . . . . . . . . . . . . . . . . . 1,049
Prepaids and other assets . . . . . . . . . . . . . . . . . . . . . . . . . . . . . . . . . . . . . . . . . . . . . . . . . . . . . . 35
Property and equipment . . . . . . . . . . . . . . . . . . . . . . . . . . . . . . . . . . . . . . . . . . . . . . . . . . . . . . . 183
Accounts payable . . . . . . . . . . . . . . . . . . . . . . . . . . . . . . . . . . . . . . . . . . . . . . . . . . . . . . . . . . . . (196)
Accrued expenses and other liabilities . . . . . . . . . . . . . . . . . . . . . . . . . . . . . . . . . . . . . . . . . . . . (772)
Total . . . . . . . . . . . . . . . . . . . . . . . . . . . . . . . . . . . . . . . . . . . . . . . . . . . . . . . . . . . . . . . . . . . . . . $ 572
F-27

Identifiable Intangible Assets
As part of the preliminary purchase price allocation, the Company determined that Global Energy’sseparately identifiable intangible assets were its customer relationships, non-compete agreements, developedtechnology and trade name. Developed technology represented certain proprietary software tools that GlobalEnergy had developed, which are utilized on certain consulting projects. As of the date of acquisition, theCompany determined that there was no in-process research and development as the ongoing research anddevelopment efforts were nominal and related to routine, on-going maintenance efforts.
The Company used the income approach to value the customer relationships, non-compete agreements,developed technology and trade name. This approach calculates fair value by discounting the after-tax cash flowsback to a present value. The baseline data for this analysis was the cash flow estimates used to price thetransaction. Cash flows were forecasted for each intangible asset then discounted based on an appropriatediscount rate. The discount rates applied, which ranged between 10% and 16%, were benchmarked withreference to the implied rate of return from the transaction model as well as an estimate of a market-participant’sweighted average cost of capital based on the capital asset pricing model.
In estimating the useful life of the acquired assets, the Company considered ASC 350-30-35, which lists thepertinent factors to be considered when estimating the useful life of an intangible asset. These factors include areview of the expected use by the combined company of the assets acquired, the expected useful life of anotherasset (or group of assets) related to the acquired assets, legal, regulatory or other contractual provisions that maylimit the useful life of an acquired asset or may enable the extension of the useful life of an acquired assetwithout substantial cost, the effects of obsolescence, demand, competition and other economic factors, and thelevel of maintenance expenditures required to obtain the expected future cash flows from the asset. The Companyamortizes these intangible assets over their estimated useful lives using a method that is based on estimatedfuture cash flows, as the Company believes this will approximate the pattern in which the economic benefits ofthe assets will be utilized, or where the Company has concluded that the cash flows were not reliablydeterminable, on a straight-line basis. The acquisition of Global Energy was deemed to be an asset purchase forincome tax purposes. Accordingly, no deferred taxes were established relating to the fair value of the acquiredintangible assets.
The factors contributing to the recognition of this amount of goodwill were based upon several strategic andsynergistic benefits that are expected to be realized from the combination. Substantially all of the goodwill isexpected to be deductible for tax purposes.
M2M Communications Corporation
On January 21, 2011, the Company entered into a definitive agreement to acquire M2M, a privately-heldcompany located in Idaho and specializing in wireless technology solutions for energy management and demandresponse. The Company acquired all of the outstanding capital stock of M2M, and the acquisition closed onJanuary 25, 2011. By integrating M2M’s wireless technology solutions with the Company’s energy managementapplications and services, the Company believes that it will be able to enhance its automated demand responseoffering and deliver more value to its rapidly growing C&I customer base.
The Company concluded that the acquisition of M2M did not represent a material business combination andtherefore, no pro forma financial information has been provided herein. Subsequent to the acquisition date, theCompany’s results of operations include the results of operations of M2M. The Company accounted for theacquisition of M2M as a purchase of a business under ASC 805.
The total initial purchase price paid by the Company at closing was approximately $29,871, consisting of$17,597 in cash, $3,925 representing the estimated fair value of $7,000 of deferred purchase price considerationdetermined at closing, and the remainder of which was paid by the issuance of 351,665 shares of the Company’scommon stock that had a fair value of approximately $8,349. The fair value of these shares was measured as ofthe acquisition date using the closing price of the Company’s common stock, as reported on NASDAQ onJanuary 25, 2011. The deferred purchase price consideration of $7,000 will be paid upon the earlier of thesatisfaction of certain conditions contained in the definitive agreement or seven years after the acquisition date of
F-28

January 25, 2011. The deferred purchase price consideration is not subject to adjustment or forfeiture. TheCompany recorded its estimate of the fair value of the deferred purchase price consideration based on theevaluation of the likelihood of the achievement of the contractual conditions that would result in the payment ofthe deferred purchase price consideration prior to seven years from the acquisition date and weighted probabilityassumptions of these outcomes. This fair value measurement was based on significant inputs not observable inthe market and therefore, represented a Level 3 measurement as defined in ASC 820. The cash portion of thedeferred purchase price consideration ($485) is recorded as a liability, discounted to reflect the time value ofmoney. As the milestone payment date approaches, the fair value of this liability will increase. The fair value ofthe deferred purchase price consideration of $3,439, related to the 254,654 shares of common stock to be issuedupon the milestone payment date has been classified as additional paid-in capital within stockholders’ equity.With respect to the cash portion of the deferred purchase price consideration, the increase in fair value isrecorded as an expense in the Company’s accompanying consolidated statements of operations. During the yearended December 31, 2011, the Company recorded a charge of $15 related to the accretion for the time value ofmoney discount. At December 31, 2011, the liability was recorded at $500. The deferred purchase priceconsideration to be paid in shares meets the requirements of an equity instrument and, accordingly, will not beremeasured at fair value each reporting period. This acquisition had no contingent consideration or earn-outpayments.
Transaction costs related to this business combination were not material and have been expensed asincurred, which are included in general and administrative expenses in the accompanying consolidatedstatements of operations.
Based on new information gathered about facts and circumstances that existed as of the acquisition daterelated to the valuation of certain acquired identifiable intangible assets, the Company updated the preliminaryvaluations during the three months ended December 31, 2011. The revised valuations resulted in a decrease in thefair value of the acquired customer relationships, developed technology and trade name intangible assets of$2,000, $1,300 and $200, respectively, and a corresponding increase to non-compete agreements and goodwill of$180 and $3,320, respectively. The change in estimate of the amortization expense related to the change in thefair value of acquired customer relationships which was recorded in the three months ended December 31, 2011was not material.
During the three months ended September 30, 2011, based on additional information gathered related to thefair value of certain acquired assets and liabilities, the Company recorded adjustments to the allocation of thepurchase price, resulting in an increase of net tangible assets acquired of $192 and a corresponding decrease togoodwill.
During the three months ended June 30, 2011, as a result of gathering information to update the Company’svaluation allocation, the Company asserted that the estimated merger consideration paid at the closing exceededthe final merger consideration. The Company and the former stockholders of M2M reached a settlementagreement to reduce the purchase price by $1,250, which was recorded in prepaid expenses, deposits and othercurrent assets in the Company’s consolidated balance sheets as of June 30, 2011 included in the Company’sQuarterly Report on Form 10-Q for the period ended June 30, 2011. This reduction in purchase price reduced thefair value of the customer relationships and non-compete agreements intangible assets acquired by $100 and $10,respectively. The additional $1,140 reduction in purchase price was recorded as a reduction of goodwill. TheCompany received back 45,473 shares of common stock, which was based on the fair value used to determine thestock consideration issued in connection with the acquisition of $23.74 per share and represents a fair value of$1,125, and cash of $125 from escrow during the year ended December 31, 2011.
F-29

The components and allocation of the purchase price consist of the following approximate amounts:
Net tangible assets acquired as of January 25, 2011 . . . . . . . . . . . . . . . . . . . . . . . . . . . . . . . . $ 1,340
Customer relationships . . . . . . . . . . . . . . . . . . . . . . . . . . . . . . . . . . . . . . . . . . . . . . . . . . . . . . . 2,700
Non-compete agreements . . . . . . . . . . . . . . . . . . . . . . . . . . . . . . . . . . . . . . . . . . . . . . . . . . . . . 450
Developed technology . . . . . . . . . . . . . . . . . . . . . . . . . . . . . . . . . . . . . . . . . . . . . . . . . . . . . . . 1,700
Trade name . . . . . . . . . . . . . . . . . . . . . . . . . . . . . . . . . . . . . . . . . . . . . . . . . . . . . . . . . . . . . . . . 200
Goodwill . . . . . . . . . . . . . . . . . . . . . . . . . . . . . . . . . . . . . . . . . . . . . . . . . . . . . . . . . . . . . . . . . . 22,231
Total . . . . . . . . . . . . . . . . . . . . . . . . . . . . . . . . . . . . . . . . . . . . . . . . . . . . . . . . . . . . . . . . . . . . . $28,621
Net tangible assets acquired in the acquisition of M2M primarily related to the following:
Cash . . . . . . . . . . . . . . . . . . . . . . . . . . . . . . . . . . . . . . . . . . . . . . . . . . . . . . . . . . . . . . . . . . . . . . $ 70
Accounts receivable . . . . . . . . . . . . . . . . . . . . . . . . . . . . . . . . . . . . . . . . . . . . . . . . . . . . . . . . . . 1,444
Inventory . . . . . . . . . . . . . . . . . . . . . . . . . . . . . . . . . . . . . . . . . . . . . . . . . . . . . . . . . . . . . . . . . . 437
Property and equipment . . . . . . . . . . . . . . . . . . . . . . . . . . . . . . . . . . . . . . . . . . . . . . . . . . . . . . . 272
Other current assets . . . . . . . . . . . . . . . . . . . . . . . . . . . . . . . . . . . . . . . . . . . . . . . . . . . . . . . . . . 182
Accounts payable . . . . . . . . . . . . . . . . . . . . . . . . . . . . . . . . . . . . . . . . . . . . . . . . . . . . . . . . . . . . (458)
Accrued expenses . . . . . . . . . . . . . . . . . . . . . . . . . . . . . . . . . . . . . . . . . . . . . . . . . . . . . . . . . . . . (94)
Borrowing under line of credit arrangement . . . . . . . . . . . . . . . . . . . . . . . . . . . . . . . . . . . . . . . (500)
Other long-term liabilities . . . . . . . . . . . . . . . . . . . . . . . . . . . . . . . . . . . . . . . . . . . . . . . . . . . . . (13)
Total . . . . . . . . . . . . . . . . . . . . . . . . . . . . . . . . . . . . . . . . . . . . . . . . . . . . . . . . . . . . . . . . . . . . . . $1,340
In connection with the acquisition of M2M, the Company assumed M2M’s outstanding debt under its line ofcredit arrangement with a financial institution. At closing, the Company fully repaid these borrowings andM2M’s line of credit arrangement was terminated.
Identifiable Intangible Assets
As part of the preliminary purchase price allocation, the Company determined that M2M’s separatelyidentifiable intangible assets were its customer relationships, non-compete agreements, developed technologyand trade name. Developed technology represented the products and related software that M2M had developedfor its wireless technology applications. As of the date of the acquisition, the Company determined that there wasno in-process research and development as the ongoing research and development efforts related solely toroutine, on-going efforts to refine, enrich, or otherwise improve the qualities of the existing product, and theadaptation of existing capability to a particular requirement or customer’s need as part of a contractualarrangement (i.e. configuring equipment for specific customer requirements), which do not meet the criteria ofin-process research and development.
The Company used the income approach to value the customer relationships, non-compete agreements,developed technology and trade name. This approach calculates fair value by discounting the after-tax cash flowsback to a present value. The baseline data for this analysis was the cash flow estimates used to price thetransaction. Cash flows were forecasted for each intangible asset then discounted based on an appropriatediscount rate. The discount rates applied, which ranged between 10% and 18%, were benchmarked withreference to the implied rate of return from the transaction model, as well as an estimate of a market-participant’sweighted average cost of capital based on the capital asset pricing model.
In estimating the useful life of the acquired assets, the Company considered ASC 350-30-35, which lists thepertinent factors to be considered when estimating the useful life of an intangible asset. These factors include areview of the expected use by the combined company of the assets acquired, the expected useful life of anotherasset (or group of assets) related to the acquired assets, legal, regulatory or other contractual provisions that may
F-30

limit the useful life of an acquired asset or may enable the extension of the useful life of an acquired assetwithout substantial cost, the effects of obsolescence, demand, competition and other economic factors, and thelevel of maintenance expenditures required to obtain the expected future cash flows from the asset. The Companyamortizes these intangible assets over their estimated useful lives using a method that is based on estimatedfuture cash flows, as the Company believes this will approximate the pattern in which the economic benefits ofthe assets will be utilized, or where the Company has concluded that the cash flows were not reliablydeterminable, on a straight-line basis. The acquisition of M2M was deemed to be an asset purchase for incometax purposes. Accordingly, no deferred taxes were established relating to the fair value of the acquired intangibleassets.
The factors contributing to the recognition of this amount of goodwill were based upon the Company’sdetermination that several strategic and synergistic benefits are expected to be realized from the combination.Substantially all of the goodwill is expected to be deductible for tax purposes.
Other Immaterial Acquisitions
In January 2011, the Company completed its acquisition of a privately-held company specializing indemand response and other energy management services. The Company believes that this acquisition willenhance and broaden the Company’s international service offerings.
The Company concluded that this acquisition did not represent a material business combination andtherefore, no pro forma financial information has been provided herein. Subsequent to the acquisition date, theCompany’s results of operations include the results of operations of the acquired company. The Companyaccounted for this acquisition as a purchase of a business under ASC 805.
The total purchase price paid by the Company at closing was approximately $5,193, consisting of $3,918 incash at closing, $779 paid as consideration to settle the acquired company’s outstanding debt obligations and$496 of cash consideration to be paid upon satisfaction of certain general representations and warranties, whichwill be paid in one year or less and is included in accrued expenses and other current liabilities in theaccompanying consolidated balance sheets as of December 31, 2011. This acquisition had no contingentconsideration or earn-out payments. The Company did not issue any shares of its capital stock in connection withthis acquisition.
Transaction costs related to this business combination were not material and have been expensed asincurred, which are included in general and administrative expenses in the accompanying consolidatedstatements of operations.
The components and allocation of the purchase price consist of the following approximate amounts:
Net tangible liabilities assumed as of January 25, 2011 . . . . . . . . . . . . . . . . . . . . . . . . . . . . . . $ (319)
Customer relationships . . . . . . . . . . . . . . . . . . . . . . . . . . . . . . . . . . . . . . . . . . . . . . . . . . . . . . . . 4,400
Non-compete agreements . . . . . . . . . . . . . . . . . . . . . . . . . . . . . . . . . . . . . . . . . . . . . . . . . . . . . . 20
Trade name . . . . . . . . . . . . . . . . . . . . . . . . . . . . . . . . . . . . . . . . . . . . . . . . . . . . . . . . . . . . . . . . . 50
Goodwill . . . . . . . . . . . . . . . . . . . . . . . . . . . . . . . . . . . . . . . . . . . . . . . . . . . . . . . . . . . . . . . . . . . 1,042
Total . . . . . . . . . . . . . . . . . . . . . . . . . . . . . . . . . . . . . . . . . . . . . . . . . . . . . . . . . . . . . . . . . . . . . . $5,193
Net tangible liabilities assumed in this acquisition primarily related to the following:
Other receivables . . . . . . . . . . . . . . . . . . . . . . . . . . . . . . . . . . . . . . . . . . . . . . . . . . . . . . . . . . . . . $ 35
Accounts payable . . . . . . . . . . . . . . . . . . . . . . . . . . . . . . . . . . . . . . . . . . . . . . . . . . . . . . . . . . . . . (354)
Total . . . . . . . . . . . . . . . . . . . . . . . . . . . . . . . . . . . . . . . . . . . . . . . . . . . . . . . . . . . . . . . . . . . . . . . $(319)
F-31

Identifiable Intangible Assets
As part of the preliminary purchase price allocation, the Company determined that the acquired company’sseparately identifiable intangible assets were its customer relationships, non-compete agreements and trade name.The acquired company had no developed technology nor were there any ongoing research and developmentefforts as of the date of acquisition.
The Company used the income approach to value the customer relationships, non-compete agreements andtrade name. This approach calculates fair value by discounting the after-tax cash flows back to a present value.The baseline data for this analysis was the cash flow estimates used to price the transaction. Cash flows wereforecasted for each intangible asset then discounted based on an appropriate discount rate. The discount ratesapplied, which ranged between 16% and 28%, were benchmarked with reference to the implied rate of returnfrom the transaction model, as well as an estimate of a market-participant’s weighted average cost of capitalbased on the capital asset pricing model.
In estimating the useful life of the acquired assets, the Company considered ASC 350-30-35, which lists thepertinent factors to be considered when estimating the useful life of an intangible asset. These factors include areview of the expected use by the combined company of the assets acquired, the expected useful life of anotherasset (or group of assets) related to the acquired assets, legal, regulatory or other contractual provisions that maylimit the useful life of an acquired asset or may enable the extension of the useful life of an acquired assetwithout substantial cost, the effects of obsolescence, demand, competition and other economic factors, and thelevel of maintenance expenditures required to obtain the expected future cash flows from the asset. The Companyamortizes these intangible assets over their estimated useful lives using a method that is based on estimatedfuture cash flows, as the Company believes this will approximate the pattern in which the economic benefits ofthe assets will be utilized, or where the Company concluded that the cash flows were not reliably determinable,on a straight-line basis.
The factors contributing to the recognition of this amount of goodwill were based upon the Company’sdetermination that several strategic and synergistic benefits were expected to be realized from the combination.None of the goodwill is expected to be expected to be currently deductible for tax purposes.
SmallFoot LLC and ZOX, LLC
In March 2010, the Company acquired substantially all of the assets and certain liabilities of SmallFoot andZox which were companies unaffiliated with the Company but were entities under common control. SmallFootwas in the process of developing wireless systems that manage and coordinate electricity demand for smallcommercial facilities and Zox was in the process of developing hardware and software for automated utilitymeter reading. The total purchase price paid by the Company at closing was approximately $1,360, of which$1,100 was paid in cash and the remainder of which was paid by the issuance of 8,758 shares of the Company’scommon stock that had a fair value of approximately $260. These shares were measured as of the acquisition dateusing the closing price of the Company’s common stock, as reported on NASDAQ on March 15, 2010. TheCompany believes that SmallFoot’s technology will reduce deployment costs and accelerate deeper marketpenetration into C&I customers, specifically smaller C&I customers. The Company believes Zox’s smart gridcommunications and metering technology provides a platform for transforming electric industry legacy metersinto smart meters at a substantially lower cost as compared to traditional replacement methods.
Although SmallFoot and Zox were development stage entities as of the acquisition close date, these entitiesmet the definition of a business as defined under ASC 805 as these entities had inputs and processes that have theability to provide a return to its owners. As a result, this acquisition was treated as a business combination inaccordance with ASC 805.
Transaction costs related to this business combination were not material and have been expensed asincurred. The transaction costs are included in general and administrative expenses in the accompanyingconsolidated statements of operations.
F-32

The allocation of the purchase price is based upon estimates of the fair value of assets acquired andliabilities assumed as of March 15, 2010. There were no net tangible assets acquired in connection with thisacquisition. The components and allocation of the purchase price consists of the following approximate amounts:
In-process research and development . . . . . . . . . . . . . . . . . . . . . . . . . . . . . . . . . . . . . . . . . . . . $ 920
Patents . . . . . . . . . . . . . . . . . . . . . . . . . . . . . . . . . . . . . . . . . . . . . . . . . . . . . . . . . . . . . . . . . . . . 200
Goodwill . . . . . . . . . . . . . . . . . . . . . . . . . . . . . . . . . . . . . . . . . . . . . . . . . . . . . . . . . . . . . . . . . . . 240
Total . . . . . . . . . . . . . . . . . . . . . . . . . . . . . . . . . . . . . . . . . . . . . . . . . . . . . . . . . . . . . . . . . . . . . . $1,360
As part of the purchase price allocation, the Company determined that the identifiable intangible assetsinclude two in-process research and development projects and certain acquired patents. As of December 31,2011, there were no indefinite-lived intangible assets related to in-process research and development projects.Refer to Note 1 for further discussion of such projects.
The Company used the cost approach to value the two acquired in-process research and developmentprojects that related to the development of wireless systems that manage and coordinate electricity demand forsmall commercial facilities and the development of hardware and software for automated utility meter reading,but had not yet reached technological feasibility and had no alternate future uses as of the acquisition date. Theprimary basis for determining the technological feasibility of these projects is the completion of a working modelthat performs all the major functions planned for the product and is ready for initial customer testing, usuallyidentified as beta testing. ASC 805 requires that purchased research and development acquired in a businesscombination be recognized as an indefinite-lived intangible asset until the completion or abandonment of theassociated research and development efforts. The cost approach calculates fair value by calculating thereproduction cost of an exact replica of the subject intangible asset. The Company calculated the replacementcost based on actual development costs incurred through the date of acquisition. In determining the appropriatevaluation methodology, the Company considered, among other factors: the in-process projects’ stage ofcompletion; the complexity of the work completed as of the acquisition date; the costs already incurred; theprojected costs to complete; the expected introduction date; and the estimated useful life of the technology.Given the stage of development as of the acquisition date and the current lack of sufficient information regardingfuture expected cash flows, the Company determined that the cost approach was the most reliable valuationmethodology to determine the fair value of the in-process research and development projects acquired. TheCompany believes that the estimated in-process research and development amounts so determined represent thefair value at the date of acquisition and do not exceed the amount a third party would pay for the projects.However, if the projects are not successful or completed in a timely manner, the Company may not realize thefinancial benefits expected for these projects or for the acquisition as a whole.
The Company used the income approach to value the acquired patents. The discount rate in connection withthis valuation was 25% and was based on the commercial and technical risks related to this asset and onestimated market participant discount rates for a similar asset.
The factors contributing to the recognition of goodwill were based upon several strategic and synergisticbenefits that were expected to be realized from the combination.
Cogent Energy, Inc.
In December 2009, the Company acquired all of the outstanding capital stock of Cogent, a companyspecializing in comprehensive energy consulting, engineering and building commissioning solutions to C&Icustomers. The total purchase price paid by the Company at closing was approximately $11,172, of which $6,555was paid in cash and the remainder of which was paid by the issuance of 114,281 shares of the Company’scommon stock that had a fair value of approximately $3,162. These shares were measured as of the acquisitiondate using the closing price of the Company’s common stock, as reported on NASDAQ on December 4, 2009. Asa result of gathering information to update the Company’s valuation of certain acquired assets and liabilities, the
F-33

purchase price was reduced by $94 during 2010 through the release back to the Company of 3,592 shares of theCompany’s common stock that were previously held in escrow in connection with the Cogent acquisition. Uponrelease, the Company’s board of directors approved the retirement of these shares.
In addition to the amounts paid at closing, the Company was obligated to pay an earn-out amount of $1,500to the former stockholders of Cogent. The earn-out payment was based on the achievement of a certain minimumrevenue-based milestone and a certain earnings-based milestone of Cogent for the year ended December 31, 2010and was paid in cash in January 2011.
Transaction costs related to this business combination were not material and were expensed as incurred. Thetransaction costs are included in general and administrative expenses.
The components and allocation of the purchase price consist of the following approximate amounts:
Net tangible assets acquired as of December 4, 2009 . . . . . . . . . . . . . . . . . . . . . . . . . . . . . . . $ 1,331
Customer relationships . . . . . . . . . . . . . . . . . . . . . . . . . . . . . . . . . . . . . . . . . . . . . . . . . . . . . . . 1,400
Non-compete agreements . . . . . . . . . . . . . . . . . . . . . . . . . . . . . . . . . . . . . . . . . . . . . . . . . . . . . 590
Trade name . . . . . . . . . . . . . . . . . . . . . . . . . . . . . . . . . . . . . . . . . . . . . . . . . . . . . . . . . . . . . . . . 200
Goodwill . . . . . . . . . . . . . . . . . . . . . . . . . . . . . . . . . . . . . . . . . . . . . . . . . . . . . . . . . . . . . . . . . . 7,557
Total . . . . . . . . . . . . . . . . . . . . . . . . . . . . . . . . . . . . . . . . . . . . . . . . . . . . . . . . . . . . . . . . . . . . . $11,078
Net tangible assets acquired in the acquisition of Cogent primarily related to the following:
Cash . . . . . . . . . . . . . . . . . . . . . . . . . . . . . . . . . . . . . . . . . . . . . . . . . . . . . . . . . . . . . . . . . . . . . . $ 336
Accounts receivable . . . . . . . . . . . . . . . . . . . . . . . . . . . . . . . . . . . . . . . . . . . . . . . . . . . . . . . . . . 1,777
Prepaids and other assets . . . . . . . . . . . . . . . . . . . . . . . . . . . . . . . . . . . . . . . . . . . . . . . . . . . . . . 77
Accounts payable . . . . . . . . . . . . . . . . . . . . . . . . . . . . . . . . . . . . . . . . . . . . . . . . . . . . . . . . . . . . (331)
Accrued expenses . . . . . . . . . . . . . . . . . . . . . . . . . . . . . . . . . . . . . . . . . . . . . . . . . . . . . . . . . . . . (528)
Total . . . . . . . . . . . . . . . . . . . . . . . . . . . . . . . . . . . . . . . . . . . . . . . . . . . . . . . . . . . . . . . . . . . . . . $1,331
eQuilibrium Solutions Corporation
In June 2009, the Company acquired substantially all of the assets of eQ, a software company specializing inthe development of enterprise sustainability management products and services. The total purchase price paid bythe Company at closing was approximately $751, of which $250 was paid in cash and the remainder of whichwas paid by the issuance of 21,464 shares of the Company’s common stock that had a value of approximately$501. These shares were measured as of the acquisition date using the closing price of the Company’s commonstock, as reported on NASDAQ on June 11, 2009.
Transaction costs related to this business combination were not material and were expensed as incurred. Thetransaction costs are included in general and administrative expenses. The Company’s consolidated financialstatements reflect eQ’s results of operations from June 11, 2009 forward.
F-34

3. Net Loss Per Share
A reconciliation of basic and diluted share amounts for the years ended December 31, 2011, 2010, and 2009are as follows (shares in thousands):
Year Ended December 31,
2011 2010 2009
Basic weighted average common shares outstanding . . . . . . . . . . . . . . 25,799 24,612 21,467
Weighted average common stock equivalents . . . . . . . . . . . . . . . . . . . — 1,442 —
Diluted weighted average common shares outstanding . . . . . . . . . . . . 25,799 26,054 21,467
Weighted average anti-dilutive shares related to:
Stock options . . . . . . . . . . . . . . . . . . . . . . . . . . . . . . . . . . . . . . . . . . . . . 1,793 497 3,239
Nonvested restricted stock . . . . . . . . . . . . . . . . . . . . . . . . . . . . . . . . . . 633 127 200
Restricted stock units . . . . . . . . . . . . . . . . . . . . . . . . . . . . . . . . . . . . . . 269 22 106
Escrow shares . . . . . . . . . . . . . . . . . . . . . . . . . . . . . . . . . . . . . . . . . . . . 334 — 129
In the reporting period in which the Company reported net income, which was the year ended December 31,2010, anti-dilutive shares comprise those common stock equivalents that have either an exercise price above theaverage stock price for the quarter or the common stock equivalent’s related average unrecognized stockcompensation expense is sufficient to “buy back” the entire amount of shares. In those reporting periods in whichthe Company has reported a net loss, which were the years ended December 31, 2011 and 2009, anti-dilutiveshares comprise the impact of those number of shares that would have been dilutive had the Company had netincome plus the number of common stock equivalents that would be anti-dilutive had the Company had netincome.
The Company excludes the shares issued in connection with restricted stock awards from the calculation ofbasic weighted average common shares outstanding until such time as those shares vest. In addition, inconnection with certain of the Company’s business combinations, the Company has issued shares that were heldin escrow upon closing of the applicable business combination. The Company excludes shares held in escrowfrom the calculation of basic weighted average common shares outstanding where the release of such shares iscontingent upon an event and not solely subject to the passage of time. The 254,654 shares related to acomponent of the deferred purchase price consideration from the acquisition of M2M, which are not subject toadjustment as the issuance of such shares is not subject to any contingency, are included in both the basic anddiluted weighted average common shares outstanding amounts.
4. Fair Value Measurements
ASC 820 establishes a fair value hierarchy that requires the use of observable market data, when available,and prioritizes the inputs to valuation techniques used to measure fair value in the following categories:
• Level 1 — Valuation is based upon quoted prices for identical instruments traded in active markets.Level 1 instruments include securities traded on active exchange markets, such as the New York StockExchange.
• Level 2 — Valuation is based upon quoted prices for similar instruments in active markets, quoted pricesfor identical or similar instruments in markets that are not active and model-based valuation techniques forwhich all significant assumptions are observable in the market.
• Level 3 — Valuation is generated from model-based techniques that use significant assumptions notobservable in the market. These unobservable assumptions reflect the Company’s own estimates ofassumptions market participants would use in pricing the asset or liability.
F-35

The table below presents the balances of assets and liabilities measured at fair value on a recurring basis atDecember 31, 2011:
Fair Value Measurement at December 31, 2011 Using
Totals
Quoted Pricesin Active
Markets forIdentical Assets
(Level 1)
SignificantOther
ObservableInputs
(Level 2)
UnobservableInputs
(Level 3)
Money market funds(1) . . . . . . . . . . . . . . . . . . . . . . . $51,841 $51,841 $— $ —
Deferred acquisition consideration(2) . . . . . . . . . . . . 500 — — 500
Accrued acquisition contingent consideration(2) . . . 336 — — 336
(1) Included in cash and cash equivalents in the accompanying consolidated balance sheets.
(2) Deferred acquisition consideration and accrued acquisition contingent consideration, which are liabilities,represent the only assets or liabilities that the Company measures and records at fair value on a recurringbasis using significant unobservable inputs (Level 3). The increase in fair value for the year endedDecember 31, 2011 of $61 is due to the increase in the liabilities as a result of the amortization of theapplicable discounts offset by changes in exchange rates. See Note 2 for further discussion.
With respect to assets measured at fair value on a non-recurring basis, which would be impaired long-livedassets and impaired intangible assets, refer to Note 1 for discussion of the determination of fair value of theseassets.
At December 31, 2011, the Company had restricted cash of approximately $158 collateralizing certain othercommitments. All certificates of deposit have contractual maturities of twelve months or less. The Company’sinvestments in certificates of deposit have a fair value that approximates cost.
5. Allowance for Doubtful Accounts
The Company reduces gross trade accounts receivable by an allowance for doubtful accounts. Theallowance for doubtful accounts is the Company’s best estimate of the amount of probable credit losses in theCompany’s existing accounts receivable. The Company reviews its allowance for doubtful accounts on a regularbasis and all past due balances are reviewed individually for collectability. Account balances are charged offagainst the allowance after all means of collection have been exhausted and the potential for recovery isconsidered remote. Provisions for allowance for doubtful accounts are recorded in general and administrativeexpenses. Below is a summary of the changes in the Company’s allowance for doubtful accounts for the yearsended December 31, 2011, 2010 and 2009.
Balance atBeginning of
Period
AdditionsCharged to
Expense
Deductions — Write-offs, Payments andOther Adjustments
Balance atEnd of Period
Year ended December 31, 2011 . . . . . $150 $215 $(173) $192
Year ended December 31, 2010 . . . . . $ 57 $160 $ (67) $150
Year ended December 31, 2009 . . . . . $ 37 $ 33 $ (13) $ 57
F-36

6. Property and Equipment
Property and equipment as of December 31, 2011 and December 31, 2010 consisted of the following:Estimated Useful Life (Years) December 31, 2011 December 31, 2010
Computers and office equipment . . . . 3 $ 16,855 $ 12,374
Software . . . . . . . . . . . . . . . . . . . . . . . 2 - 5 20,019 16,652
Demand response equipment . . . . . . . Lesser of useful life or estimatedcommercial, institutional and industrial
customer relationship period
34,620 24,849
Back-up generators . . . . . . . . . . . . . . 5 - 10 9,436 9,560
Furniture and fixtures . . . . . . . . . . . . 5 1,706 1,490
Leasehold improvements . . . . . . . . . . Lesser of the useful lifeor original lease term
2,419 1,998
Assets under capital lease . . . . . . . . . Lesser of the useful lifeor original lease term
— 222
Construction-in-progress . . . . . . . . . . 2,981 3,854
88,036 70,999
Accumulated depreciation . . . . . . . . . (51,400) (36,309)
Property and equipment, net . . . . . . . $ 36,636 $ 34,690
Depreciation expense was $16,187, $14,414 and $11,357 for the years ended December 31, 2011, 2010 and2009, respectively. For the years ended December 31, 2011, 2010 and 2009, $11,614, $9,907 and $5,415,respectively, were included in cost of revenues, and $4,573, $4,507 and $5,942, respectively, were included ingeneral and administrative expenses. The amortization expense related to assets under capital leases was includedwithin the Company’s depreciation expense for the years ended December 31, 2011, 2010 and 2009. There wereno assets under capital leases as of December 31, 2011. As of December 31, 2010, total accumulatedamortization expense related to assets under capital leases was $182.
7. Financing Arrangements
In April 2011, the Company and one of its subsidiaries entered into the 2011 credit facility, which wassubsequently amended. Subject to continued compliance with the covenants therein, the 2011 credit facilityprovides for a two-year revolving line of credit in the aggregate amount of $75,000, the full amount of whichmay be available for issuances of letters of credit and up to $5,000 of which may be available for swing lineloans. The revolving line of credit is subject to increase from time to time up to an aggregate amount of $100,000with additional commitments from the lenders or new commitments from financial institutions acceptable toSVB. The interest on revolving loans under the 2011 credit facility will accrue, at the Company’s election, ateither (i) the Eurodollar Rate with respect to the relevant interest period plus 2.00% or (ii) the ABR (defined asthe highest of (x) the “prime rate” as quoted in the Wall Street Journal, (y) the Federal Funds Effective Rate plus0.50% and (z) the Eurodollar Rate for a one-month interest period plus 1.00%) plus 1.00%. In connection withthe issuance or renewal of letters of credit for the Company’s account, the Company is charged a letter of creditfee of 2.125%. The Company expenses the interest and letter of credit fees, as applicable, in the period incurred.The obligations under the 2011 credit facility are secured by all domestic assets of the Company and several ofits subsidiaries, excluding the Company’s foreign subsidiaries. The 2011 credit facility terminates and allamounts outstanding thereunder are due and payable in full on April 15, 2013. The Company incurred financingcosts of $543 in connection with the 2011 credit facility, which were deferred and are being amortized to interestexpense over the life of the 2011 credit facility.
The 2011 credit facility contains customary terms and conditions for credit facilities of this type, including,among other things, restrictions on the ability of the Company and its subsidiaries to incur additionalindebtedness, create liens, enter into transactions with affiliates, transfer assets, make certain acquisitions, pay
F-37

dividends or make distributions on, or repurchase, the Company’s common stock, consolidate or merge withother entities, or undergo a change in control. In addition, the Company is required to meet certain monthly andquarterly financial covenants customary with this type of credit facility. The Company’s monthly financialcovenants include a minimum specified ratio of current assets to current liabilities. The Company’s quarterlyfinancial covenants include achievement of minimum earnings levels, which is based on earnings beforedepreciation and amortization expense, interest expense, provisions for cash based income taxes, stock-basedcompensation expense, rent expense and certain other non-cash charges over a rolling twelve month period, andmaintaining a minimum specified fixed charge coverage ratio, which is based on the ratio of earnings calculationfrom the minimum earnings covenants discussed above less capital expenditures as compared to fixed charges,including depreciation expense, rent expense, and income taxes paid
The 2011 credit facility contains customary events of default, including for payment defaults, breaches ofrepresentations, breaches of affirmative or negative covenants, cross defaults to other material indebtedness,bankruptcy and failure to discharge certain judgments. If a default occurs and is not cured within any applicablecure period or is not waived, the lenders may accelerate the Company’s obligations under the 2011 credit facility.The 2011 credit facility replaced the 2008 credit facility as of April 15, 2011. If the Company is determined to bein default then any amounts outstanding under the 2011 credit facility would become immediately due andpayable and the Company would be required to collateralize with cash any outstanding letters of credit up to105% of the amounts outstanding.
As of December 31, 2011, the Company had no borrowings, but had outstanding letters of credit totaling$31,631 under the 2011 credit facility. As of December 31, 2011, the Company had $43,369 available under the2011 credit facility for future borrowings or issuances of additional letters of credit.
As of December 31, 2011, the Company was not in compliance with the financial covenant related to theachievement of minimum earnings levels required under the 2011 credit facility, but the Company obtained awaiver with respect to such covenant and as a result, the Company was not required to post cash to collateralizeits outstanding letters of credit. In March 2012, the Company and one of its subsidiaries amended and restated the2011 credit facility. The amended and restated 2011 credit facility, under which SVB became the sole lender,decreased the Company’s borrowing limit from $75,000 to $50,000, as well as modified certain of theCompany’s financial covenant compliance requirements. The material changes in the amended and restated 2011credit facility to the Company’s monthly and quarterly financial covenants include:
• a decrease in the Company’s quarterly financial covenant related to minimum earnings levels and achange in the calculation, which is now based on earnings before depreciation and amortization expense,interest expense, provision for income taxes, stock-based compensation expense, rent expense, certainimpairment charges and certain other non-cash charges over a trailing twelve month period;
• amendment to the Company’s monthly financial covenant related to maintenance of a minimum specifiedratio of current assets to current liabilities reducing the Company’s required minimum of unrestricted cashfrom $50,000 to $30,000 for certain periods; and
• elimination of the quarterly financial covenant related to maintenance of a minimum specified fixedcharge coverage ratio.
The amended and restated 2011 credit facility also decreased the letter of credit fee charged in connection withthe issuance or renewal of letters of credit for the Company’s account from 2.125 % to 2.0%.
The Company believes that it is reasonably assured that it will comply with the financial covenants under theamended and restated 2011 credit facility for the foreseeable future.
8. Stockholders’ Equity
Follow-On Public Offering
During the third quarter of 2009, the Company completed an underwritten public offering of an aggregate of3,963,889 shares of common stock at an offering price of $27.00 per share, which included the sale of 709,026
F-38

shares by certain selling stockholders. After deducting underwriting discounts and commissions and offeringexpenses payable by the Company, the Company received net proceeds of approximately $83,421 from the offering.
Common Stock
At December 31, 2011, the Company has authorized 50,000,000 shares of common stock, of which27,306,548 shares were issued and outstanding and 1,713,410 shares have been reserved for future issuanceunder the Company’s Amended and Restated 2007 Employee, Director and Consultant Stock Plan (the 2007Plan).
9. Stock-Based Compensation
Stock Options
The Company’s Amended and Restated 2003 Stock Option and Incentive Plan (2003 Plan) and the 2007Plan (collectively the Plans) provide for the grant of incentive stock options, nonqualified stock options,restricted and unrestricted stock awards and other stock-based awards to eligible employees, directors andconsultants of the Company. Options granted under the Plans are exercisable for a period determined by theCompany, but in no event longer than ten years from the date of the grant. Option awards are generally grantedwith an exercise price equal to the market price of the Company’s common stock on the date of grant. Options,restricted stock awards and restricted stock unit awards generally vest ratably over four years, with certainexceptions. The 2003 Plan expired upon the Company’s initial public offering (IPO) in May 2007. Anyforfeitures under the 2003 Plan that occurred after the effective date of the IPO are available for future grantunder the 2007 Plan up to a maximum of 1,000,000 shares. The 2007 Plan provides for an annual increase to theshares issuable under the 2007 Plan by an amount equal to the lesser of 520,000 shares or an amount determinedby the Company’s board of directors. This annual increase is effective on the first day of each fiscal year through2017. During the years ended December 31, 2011, 2010 and 2009, the Company issued 18,211, 24,681 and45,085 shares of its common stock, respectively, to certain executives to satisfy a portion of the Company’sbonus obligations to those individuals. As of December 31, 2011, 1,713,410 shares were available for futuregrant under the 2007 Plan.
The fair value of options granted was estimated at the date of grant using the following weighted averageassumptions:
Year Ended December 31,
2011 2010 2009
Risk-free interest rate . . . . . . . . . . . . . . . . . . . . . . . . . . . . . . . . . . . . . 3.2% 3.5% 3.2%
Expected term of options, in years . . . . . . . . . . . . . . . . . . . . . . . . . . . — — —
Vesting term, in years . . . . . . . . . . . . . . . . . . . . . . . . . . . . . . . . . . . . . 2.22 2.17 2.16
Expected annual volatility . . . . . . . . . . . . . . . . . . . . . . . . . . . . . . . . . . 80% 85% 86%
Expected dividend yield . . . . . . . . . . . . . . . . . . . . . . . . . . . . . . . . . . . —% —% —%
Exit rate pre-vesting . . . . . . . . . . . . . . . . . . . . . . . . . . . . . . . . . . . . . . 8.00% 5.95% 4.88%
Exit rate post-vesting . . . . . . . . . . . . . . . . . . . . . . . . . . . . . . . . . . . . . . 14.06% 11.49% 10.89%
Volatility measures the amount that a stock price has fluctuated or is expected to fluctuate during a period.As there was no public market for the Company’s common stock prior to the effective date of the IPO, theCompany determined the volatility based on an analysis of reported data for a peer group of companies thatissued options with substantially similar terms. The expected volatility of options granted through September 30,2010 was determined using an average of the historical volatility measures of this peer group of companies.During the year ended December 31, 2010, the Company determined that it had sufficient history to utilizeCompany-specific volatility in accordance with ASC 718, Stock Compensation (ASC 718) and is now calculatingvolatility using a component of implied volatility and historical volatility to determine the value of share-basedpayments. The risk-free interest rate is the rate available as of the option date on zero-coupon United Statesgovernment issues with a term equal to the expected life of the option. During the year ended December 31,
F-39

2010, the Company changed its vesting for new grants of stock options and restricted stock to a 25% cliff vestafter one year of grant and quarterly thereafter for three years as compared to its primary vesting for historicalgrants of 25% cliff vest after one year of grant and monthly thereafter for three years. The change in vestingresulted in the vesting term changing in 2010 for new grants awarded with this new vesting. The Company hasnot paid dividends on its common stock in the past and does not plan to pay any dividends in the foreseeablefuture. In addition, the terms of the Credit Facility preclude the Company from paying dividends. During the yearended December 31, 2011, the Company updated its estimated exit rate pre-vesting and post-vesting applied tooptions, restricted stock and restricted stock units based on an evaluation of demographics of its employee groupsand historical forfeitures for these groups in order to determine its option valuations as well as its stock-basedcompensation expense. The changes in estimate of the volatility, exit rate pre-vesting and exit rate post-vestingdid not have a material impact on the Company’s stock-based compensation expense recorded in theaccompanying consolidated statements of operations for the year ended December 31, 2011.
The Company accounts for transactions in which services are received from non-employees in exchange forequity instruments based on the fair value of such services received or of the equity instruments issued,whichever is more reliably measured.
The components of stock-based compensation expense are disclosed below:
Year Ended December 31,
2011 2010 2009
Stock options . . . . . . . . . . . . . . . . . . . . . . . . . . . . . . . . . . . . . . . . . . . $ 5,170 $ 9,406 $ 9,781
Restricted stock and restricted stock units . . . . . . . . . . . . . . . . . . . . . 8,294 6,336 3,353
Total . . . . . . . . . . . . . . . . . . . . . . . . . . . . . . . . . . . . . . . . . . . . . . . . . . $13,464 $15,742 $13,134
Stock based compensation is recorded in the accompanying statements of operations, as follows:
Year Ended December 31,
2011 2010 2009
Selling and marketing expenses . . . . . . . . . . . . . . . . . . . . . . . . . . . . . $ 4,203 $ 4,583 $ 3,989
General and administrative expenses . . . . . . . . . . . . . . . . . . . . . . . . . 8,255 10,252 8,471
Research and development expenses . . . . . . . . . . . . . . . . . . . . . . . . . 1,006 907 674
Total . . . . . . . . . . . . . . . . . . . . . . . . . . . . . . . . . . . . . . . . . . . . . . . . . . $13,464 $15,742 $13,134
The stock-based compensation expense related to share-based payments to non-employees was not materialfor the years ended December 31, 2011, 2010 and 2009. The Company recognized no material income tax benefitfrom stock-based compensation arrangements during the years ended December 31, 2011, 2010 and 2009. Inaddition, no material compensation cost was capitalized during the years ended December 31, 2011, 2010 and2009.
F-40

The following is a summary of the Company’s stock option activity during the year ended December 31,2011:
Year Ended December 31, 2011
Number ofShares
UnderlyingOptions
Exercise PricePer Share
Weighted–Average
Exercise PricePer Share
AggregateIntrinsic
Value
Outstanding at December 31, 2010 . . . . . . 2,112,359 $0.17–$48.06 $14.38 $23,948(2)
Granted . . . . . . . . . . . . . . . . . . . . . . . . . . . . 44,650 18.38
Exercised . . . . . . . . . . . . . . . . . . . . . . . . . . . (310,155) 6.57 $ 3,484(3)
Cancelled . . . . . . . . . . . . . . . . . . . . . . . . . . (235,463) 18.79
Outstanding at December 31, 2011 . . . . . . 1,611,391 $0.17–$48.06 15.35 $ 4,195(4)
Weighted average remaining contractuallife in years: 4.8
Exercisable at end of period . . . . . . . . . . . . 1,247,467 $0.17–$48.06 $12.83 $ 4,137(4)
Weighted average remaining contractuallife in years: 4.5
Vested or expected to vest at
December 31, 2011(1) . . . . . . . . . . . . 1,588,524 $0.17–$48.06 $15.20 $ 4,193(4)
(1) This represents the number of vested options as of December 31, 2011 plus the number of unvested optionsexpected to vest as of December 31, 2011 based on the unvested options outstanding at December 31, 2011,adjusted for the estimated forfeiture rate of 8.0%.
(2) The aggregate intrinsic value was calculated based on the positive difference between the estimated fair valueof the Company’s common stock on December 31, 2010 of $23.91 and the exercise price of the underlyingoptions.
(3) The aggregate intrinsic value was calculated based on the positive difference between the fair value of theCompany’s common stock on the applicable exercise dates and the exercise price of the underlying options.
(4) The aggregate intrinsic value was calculated based on the positive difference between the estimated fair valueof the Company’s common stock on December 31, 2011 of $10.87 and the exercise price of the underlyingoptions.
In December 2008, the Company’s board of directors approved a one-time offer to the Company’semployees, including its executive officers, and directors to exchange option grants that had an exercise price pershare that was equal to or greater than the higher of $12.00 or the closing price of the Company’s common stockas reported on NASDAQ on January 21, 2009 (the Exchange). The Exchange closed on January 21, 2009, andthe Company exchanged options that had exercise prices equal to or greater than $12.00 per share. As a result, anaggregate of 744,401 options, with exercise prices ranging from $12.27 to $48.54 per share, were exchanged for424,722 options with an exercise price per share of $8.63 for employees who are not also executive officers ofthe Company, 142,179 options with an exercise price per share of $11.47 for executive officers who are not alsodirectors of the Company and 45,653 options with an exercise price per share of $12.94 for the Company’sdirectors. On the date of the Exchange, the estimated fair value of the new options did not exceed the fair valueof the exchanged stock options calculated immediately prior to the Exchange. As such, there was no incrementalfair value of the new options, and the Company will not record additional compensation expense related to theExchange. The Company will continue to recognize the remaining compensation expense related to theexchanged options over the remaining vesting period of the original options. For outstanding unvested stockoptions related to the Exchange as of December 31, 2011, the Company had $98 of unrecognized stock-basedcompensation expense, which is expected to be recognized over a weighted average period of 0.4 years.
F-41
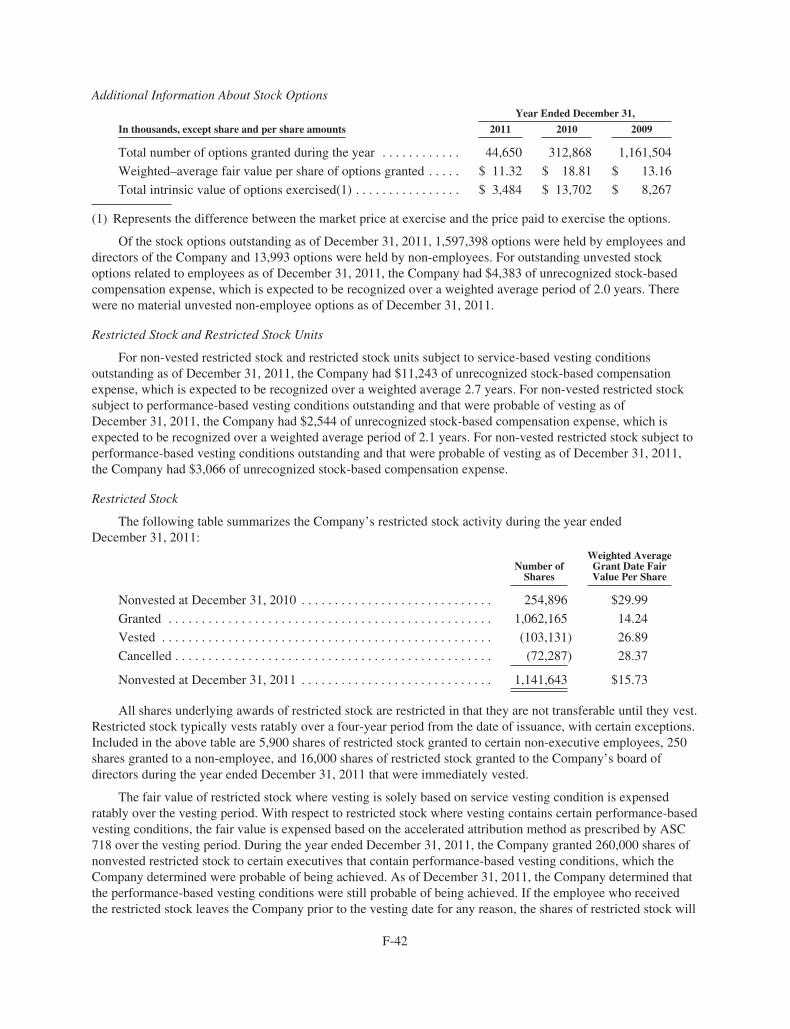
Additional Information About Stock OptionsYear Ended December 31,
In thousands, except share and per share amounts 2011 2010 2009
Total number of options granted during the year . . . . . . . . . . . . 44,650 312,868 1,161,504
Weighted–average fair value per share of options granted . . . . . $ 11.32 $ 18.81 $ 13.16
Total intrinsic value of options exercised(1) . . . . . . . . . . . . . . . . $ 3,484 $ 13,702 $ 8,267
(1) Represents the difference between the market price at exercise and the price paid to exercise the options.
Of the stock options outstanding as of December 31, 2011, 1,597,398 options were held by employees anddirectors of the Company and 13,993 options were held by non-employees. For outstanding unvested stockoptions related to employees as of December 31, 2011, the Company had $4,383 of unrecognized stock-basedcompensation expense, which is expected to be recognized over a weighted average period of 2.0 years. Therewere no material unvested non-employee options as of December 31, 2011.
Restricted Stock and Restricted Stock Units
For non-vested restricted stock and restricted stock units subject to service-based vesting conditionsoutstanding as of December 31, 2011, the Company had $11,243 of unrecognized stock-based compensationexpense, which is expected to be recognized over a weighted average 2.7 years. For non-vested restricted stocksubject to performance-based vesting conditions outstanding and that were probable of vesting as ofDecember 31, 2011, the Company had $2,544 of unrecognized stock-based compensation expense, which isexpected to be recognized over a weighted average period of 2.1 years. For non-vested restricted stock subject toperformance-based vesting conditions outstanding and that were probable of vesting as of December 31, 2011,the Company had $3,066 of unrecognized stock-based compensation expense.
Restricted Stock
The following table summarizes the Company’s restricted stock activity during the year endedDecember 31, 2011:
Number ofShares
Weighted AverageGrant Date FairValue Per Share
Nonvested at December 31, 2010 . . . . . . . . . . . . . . . . . . . . . . . . . . . . . 254,896 $29.99
Granted . . . . . . . . . . . . . . . . . . . . . . . . . . . . . . . . . . . . . . . . . . . . . . . . . 1,062,165 14.24
Vested . . . . . . . . . . . . . . . . . . . . . . . . . . . . . . . . . . . . . . . . . . . . . . . . . . (103,131) 26.89
Cancelled . . . . . . . . . . . . . . . . . . . . . . . . . . . . . . . . . . . . . . . . . . . . . . . . (72,287) 28.37
Nonvested at December 31, 2011 . . . . . . . . . . . . . . . . . . . . . . . . . . . . . 1,141,643 $15.73
All shares underlying awards of restricted stock are restricted in that they are not transferable until they vest.Restricted stock typically vests ratably over a four-year period from the date of issuance, with certain exceptions.Included in the above table are 5,900 shares of restricted stock granted to certain non-executive employees, 250shares granted to a non-employee, and 16,000 shares of restricted stock granted to the Company’s board ofdirectors during the year ended December 31, 2011 that were immediately vested.
The fair value of restricted stock where vesting is solely based on service vesting condition is expensedratably over the vesting period. With respect to restricted stock where vesting contains certain performance-basedvesting conditions, the fair value is expensed based on the accelerated attribution method as prescribed by ASC718 over the vesting period. During the year ended December 31, 2011, the Company granted 260,000 shares ofnonvested restricted stock to certain executives that contain performance-based vesting conditions, which theCompany determined were probable of being achieved. As of December 31, 2011, the Company determined thatthe performance-based vesting conditions were still probable of being achieved. If the employee who receivedthe restricted stock leaves the Company prior to the vesting date for any reason, the shares of restricted stock will
F-42

be forfeited and returned to the Company. In November 2011, the Company also granted 36,000 shares ofnonvested restricted stock to an employee that contain performance-based vesting conditions. As ofDecember 31, 2011, the Company determined that no awards were probable of vesting and as a result, no stock-based compensation expense related to these awards has been recorded through December 31, 2011.
In November 2011, the Company’s Board of Directors approved a plan to include performance-based stockawards as part of the annual non-executive bonus plan. In December 2011, 283,334 shares were issued under the2007 Plan with a fair value of $2,700 and these awards will vest in equal installments in 2013 and 2014 if theperformance conditions are achieved. Through December 31, 2011, the Company determined that no awardswere probable of vesting and as a result, no stock-based compensation expense related to these awards has beenrecorded through December 31, 2011. If and when any portion of the awards is deemed probable to vest, theCompany will reflect the effect of the change in estimate in the period of change by recording a cumulativecatch-up adjustment to retroactively apply the new estimate.
Additional Information About Restricted Stock
Year Ended December 31,
In thousands, except share and per share amounts 2011 2010 2009
Total number of shares of restricted stock granted during the year . . . 1,062,165 247,900 81,750
Weighted average fair value per share of restricted stock granted . . . $ 14.24 $ 30.14 $ 28.06
Total number of shares of restricted stock vested during the year . . . . 103,131 158,943 159,603
Total fair value of shares of restricted stock vested during the year . . $ 1,349 $ 4,691 $ 3,088
Restricted Stock Units
The following table summarizes the Company’s restricted stock unit activity during the year endedDecember 31, 2011:
Number ofShares
Weighted AverageGrant Date FairValue Per Share
Nonvested at December 31, 2010 . . . . . . . . . . . . . . . . . . . . . . . . . . . . . . 388,124 $26.11
Granted . . . . . . . . . . . . . . . . . . . . . . . . . . . . . . . . . . . . . . . . . . . . . . . . . . — —
Vested . . . . . . . . . . . . . . . . . . . . . . . . . . . . . . . . . . . . . . . . . . . . . . . . . . . (95,167) 24.59
Cancelled . . . . . . . . . . . . . . . . . . . . . . . . . . . . . . . . . . . . . . . . . . . . . . . . . (63,937) 26.08
Nonvested at December 31, 2011 . . . . . . . . . . . . . . . . . . . . . . . . . . . . . . 229,020 $26.75
Additional Information About Restricted Stock Units
Year Ended December 31,
In thousands, except share and per share amounts 2011 2010 2009
Total number of shares of restricted stock units granted during the year . . . — 326,000 123,000
Weighted average fair value per share of restricted stock units granted . . . $ — $ 28.99 $ 11.55
Total number of shares of restricted stock units vested during the year . . . . 95,167 51,876 —
Total fair value of shares of restricted stock units vested during the year . . $ 1,609 $ 1,637 $ —
Prior to 2009, the Company had not granted any restricted stock units.
F-43

10. Income Taxes
The Company accounts for income taxes in accordance with ASC 740, Income Taxes (ASC 740), which isthe asset and liability method for accounting and reporting income taxes. Under ASC 740, deferred tax assets andliabilities are recognized based on temporary differences between the financial reporting and income tax bases ofassets and liabilities using statutory rates. In addition, ASC 740 requires a valuation allowance against netdeferred tax assets if, based upon the available evidence, it is more likely than not that some or all of the deferredtax assets will not be realized.
Domestic and foreign pre-tax (loss) income is as follows:Year Ended December 31,
2011 2010 2009
United States . . . . . . . . . . . . . . . . . . . . . . . . . . . . . . . . . . . . . . . . . . . $ (6,506) $10,086 $(5,223)
Foreign . . . . . . . . . . . . . . . . . . . . . . . . . . . . . . . . . . . . . . . . . . . . . . . . (5,071) 327 (1,273)
$(11,577) $10,413 $(6,496)
The provision for income taxes is as follows:Year Ended December 31,
2011 2010 2009
Current
Federal . . . . . . . . . . . . . . . . . . . . . . . . . . . . . . . . . . . . . . . . . . . . . . . . . . . . $ — $ — $ —
State . . . . . . . . . . . . . . . . . . . . . . . . . . . . . . . . . . . . . . . . . . . . . . . . . . . . . . 233 165 —
Foreign . . . . . . . . . . . . . . . . . . . . . . . . . . . . . . . . . . . . . . . . . . . . . . . . . . . . 57 202 41
290 367 41
Deferred
Federal . . . . . . . . . . . . . . . . . . . . . . . . . . . . . . . . . . . . . . . . . . . . . . . . . . . . 1,212 401 248
State . . . . . . . . . . . . . . . . . . . . . . . . . . . . . . . . . . . . . . . . . . . . . . . . . . . . . . 235 87 44
Foreign . . . . . . . . . . . . . . . . . . . . . . . . . . . . . . . . . . . . . . . . . . . . . . . . . . . . 69 (19) —
1,516 469 292
$1,806 $836 $333
Amounts due to various states for non-income taxes are included in general and administrative expenses andaccrued expenses and other current liabilities as of December 31, 2011, 2010, and 2009.
A reconciliation of income tax expense at the statutory federal income tax rate and income taxes as reflectedin the consolidated financial statements is as follows:
Year Ended December 31,
2011 2010 2009
Federal income tax at statutory federal rate . . . . . . . . . . . . . . . . . . . . . . . . . . . (34.0)% 34.0% (34.0)%
State taxes . . . . . . . . . . . . . . . . . . . . . . . . . . . . . . . . . . . . . . . . . . . . . . . . . . . . . 3.7 1.9 0.7
Tax-deductible goodwill . . . . . . . . . . . . . . . . . . . . . . . . . . . . . . . . . . . . . . . . . 10.5 3.9 3.8
Foreign losses not benefited . . . . . . . . . . . . . . . . . . . . . . . . . . . . . . . . . . . . . . . 14.3 — 6.7
Stock-based compensation expense . . . . . . . . . . . . . . . . . . . . . . . . . . . . . . . . . 3.4 8.3 24.5
Foreign dividends . . . . . . . . . . . . . . . . . . . . . . . . . . . . . . . . . . . . . . . . . . . . . . . — 4.2 —
Other . . . . . . . . . . . . . . . . . . . . . . . . . . . . . . . . . . . . . . . . . . . . . . . . . . . . . . . . . 4.2 (0.5) 1.9
Change in valuation allowance . . . . . . . . . . . . . . . . . . . . . . . . . . . . . . . . . . . . 13.5 (43.8) 1.5
15.6% 8.0% 5.1%
F-44

Deferred tax assets (liabilities) consisted of the following:December 31,
2011 2010
Deferred income tax assets:Net operating loss carryforwards . . . . . . . . . . . . . . . . . . . . . . . . . . . . . . . . . $ 19,633 $ 20,055Intangible assets . . . . . . . . . . . . . . . . . . . . . . . . . . . . . . . . . . . . . . . . . . . . . . 2,048 64Reserves and accruals . . . . . . . . . . . . . . . . . . . . . . . . . . . . . . . . . . . . . . . . . . 1,025 (745)Deferred revenue . . . . . . . . . . . . . . . . . . . . . . . . . . . . . . . . . . . . . . . . . . . . . . 233 261Deferred rent . . . . . . . . . . . . . . . . . . . . . . . . . . . . . . . . . . . . . . . . . . . . . . . . . 225 209Stock options . . . . . . . . . . . . . . . . . . . . . . . . . . . . . . . . . . . . . . . . . . . . . . . . . 6,808 5,699Tax credits and other . . . . . . . . . . . . . . . . . . . . . . . . . . . . . . . . . . . . . . . . . . . 983 506
$ 30,955 $ 26,049
Deferred tax liabilities:Property and equipment . . . . . . . . . . . . . . . . . . . . . . . . . . . . . . . . . . . . . . . . (7,414) (5,378)Tax deductible goodwill . . . . . . . . . . . . . . . . . . . . . . . . . . . . . . . . . . . . . . . . (2,588) (1,141)
Total deferred tax liabilities . . . . . . . . . . . . . . . . . . . . . . . . . . . . . . . . . . . . . . . (10,002) (6,519)
Net deferred tax assets before valuation allowance . . . . . . . . . . . . . . . . . . . . . 20,953 19,530Valuation allowance . . . . . . . . . . . . . . . . . . . . . . . . . . . . . . . . . . . . . . . . . . . . . (23,599) (20,652)
Net deferred tax liability . . . . . . . . . . . . . . . . . . . . . . . . . . . . . . . . . . . . . . . . . . (2,646) (1,122)Current deferred tax asset . . . . . . . . . . . . . . . . . . . . . . . . . . . . . . . . . . . . . . . . . — 19
Noncurrent deferred tax liability . . . . . . . . . . . . . . . . . . . . . . . . . . . . . . . . . . . . $ (2,646) $ (1,141)
Due to the uncertainty related to the ultimate use of the Company’s U.S. and certain foreign deferred incometax assets, the Company has provided a full valuation allowance for these tax benefits as of December 31, 2011and 2010. The valuation allowance increased $2,947 during the year ended December 31, 2011, due primarily tothe net decrease in certain non-deductible reserves and accruals, depreciation, stock-based compensation, netoperating losses and deferred revenue. The current deferred tax asset and liability relates to two of theCompany’s foreign subsidiaries. As a result of the guaranteed profit related to these subsidiaries, the Companyhas determined that it is more likely than not that these deferred tax assets will be realized. The Company hasreflected this deferred tax asset in prepaid expenses, deposits and other current assets as of December 31, 2010 inthe accompanying consolidated balance sheets.
As of December 31, 2011, the Company had U.S. federal and state net operating loss carryforwards of$64,640 and $44,505, respectively, to offset future federal and state taxable income, which expires at varioustimes through 2031. The net operating loss carryforwards may be subject to the annual limitations under the“Change of Ownership” rules provided in Section 382 of the Internal Revenue Code of 1986, as amended. TheCompany’s U.S. net operating loss carryforwards at December 31, 2011 include $15,486 in income taxdeductions related to stock options which will be tax effected and the benefit will be reflected as a credit toadditional paid in capital as realized. Due to limitations on the use of net operating losses in certain states, theCompany utilized income tax deductions related to the exercise of stock options during the year endedDecember 31, 2011 and 2010 and recorded the benefit of $0 and $132, respectively, directly to additional paid-incapital. The Company has U.S. tax credits of $199 that are available to reduce future U.S. tax liabilities, whichexpire at various times through 2025. As of December 31, 2011, the company had Australian federal netoperating loss carryforwards of $3,118 with no expiration date to offset future Australian taxable income.
As of December 31, 2011 and 2010, the Company determined that no liabilities for uncertain tax positionsshould be recorded. Therefore, the Company has not recorded any interest and penalties on any unrecognized taxbenefits since its inception. The Company has adopted a policy that it will recognize both accrued interest andpenalties related to unrecognized benefits in income tax expense, when and if recorded.
F-45

The Company files income tax returns in the U.S. federal and applicable state jurisdictions, and theAustralian, New Zealand, Canadian and United Kingdom tax jurisdictions. The tax years for 2008 through 2011remain open for certain U.S. federal and state tax jurisdictions, although carryforward attributes that weregenerated prior to 2008 may still be subject to examination if they either have been or will be used in futureperiods. With respect to the Company’s foreign tax jurisdictions, the tax years for 2009 through 2011, the taxyear of 2011, the tax years for 2007 through 2011 and the tax years for 2010 through 2011 remain open for theAustralia, New Zealand, Canada and United Kingdom tax jurisdictions, respectively. The Company is currentlynot under examination by any tax jurisdictions for any tax years.
The Company continues to maintain its permanent reinvestment assertion with regards to the unremittedearnings of its foreign subsidiaries. As such, it does not accrue U.S. tax for the possible future repatriation ofthese unremitted foreign earnings. As of December 31, 2011, the amount of foreign earnings, which representearnings in Canada and the United Kingdom, that are expected to remain invested outside the U.S. indefinitelyand for which no U.S. tax cost has been provided were not material. If the Company were to repatriate theseearnings, it expects to utilize existing tax attributes (U.S. net operating losses) and expect any taxes to be paid torepatriate these earnings will be minimal.
11. Employee Savings and Retirement Plan
The Company has established a 401(k) Profit Sharing Plan and Trust (the 401(k) Plan) coveringsubstantially all employees. Once the employees have met the eligibility and participation requirements under the401(k) Plan, employees may contribute a portion of their earnings to the 401(k) Plan to be invested in varioussavings alternatives. Annually, at the discretion of the Company’s board of directors, the Company may makematching contributions to the 401(k) Plan, which may vest ratably over periods ranging from one to three years.The Company has not made any matching contributions to the 401(k) Plan since inception.
12. Commitments and Contingencies
The Company leases its office facilities and certain equipment under non-cancelable operating leases, whichexpire through 2015. Certain of the Company’s operating leases contain escalating rent payments. The Companyhas accounted for its rent expense under these operating lease arrangements on a straight-line basis. As ofDecember 31, 2011 and 2010, the deferred rent balances are included in other liabilities in the consolidatedbalance sheets and were not material. The majority of the office leases require payments for additional expensessuch as taxes, maintenance, and utilities. Certain of the leases contain renewal options.
At December 31, 2011, future minimum lease payments for operating leases with non-cancelable terms ofmore than one year were as follows:
Operating Leases
2012 . . . . . . . . . . . . . . . . . . . . . . . . . . . . . . . . . . . . . . . . . . . . . . . . . . . . . . . . . . . . . . . . $ 4,4492013 . . . . . . . . . . . . . . . . . . . . . . . . . . . . . . . . . . . . . . . . . . . . . . . . . . . . . . . . . . . . . . . . 4,0562014 . . . . . . . . . . . . . . . . . . . . . . . . . . . . . . . . . . . . . . . . . . . . . . . . . . . . . . . . . . . . . . . . 2,2472015 . . . . . . . . . . . . . . . . . . . . . . . . . . . . . . . . . . . . . . . . . . . . . . . . . . . . . . . . . . . . . . . . 2792016 . . . . . . . . . . . . . . . . . . . . . . . . . . . . . . . . . . . . . . . . . . . . . . . . . . . . . . . . . . . . . . . . 162Thereafter . . . . . . . . . . . . . . . . . . . . . . . . . . . . . . . . . . . . . . . . . . . . . . . . . . . . . . . . . . . 13
Total minimum lease payments . . . . . . . . . . . . . . . . . . . . . . . . . . . . . . . . . . . . . . . . . . . $11,206
Rent expense under operating leases amounted to $5,144, $4,311 and $3,484 during the years endedDecember 31, 2011, 2010 and 2009, respectively.
The Company is subject to performance guarantee requirements under certain utility and electric power gridoperator customer contracts and open market bidding program participation rules. Such guarantees may besecured by cash or letters of credit. Performance guarantees as of December 31, 2011 and 2010 were $34,152 and$40,028, respectively. These performance guarantees included deposits held by certain customers of $14,281 and
F-46

$3,467, respectively, at December 31, 2011 and December 31, 2010. These amounts primarily represent up-frontpayments required by utility and electric power grid operator customers as a condition of participation in certaindemand response programs and to ensure that the Company will deliver its committed capacity amounts in thoseprograms. If the Company fails to meet its minimum committed capacity requirements, a portion or all of thedeposit may be forfeited. The Company assessed the probability of default under these customer contracts andopen market bidding programs and has determined the likelihood of default and loss of deposits to be remote. Inaddition, under certain utility and electric power grid operator customer contracts, if the Company does notachieve the required performance guarantee requirements, the customer can terminate the arrangement and theCompany would potentially be subject to termination penalties. Under these arrangements, the Company defersall fees received up to the amount of the potential termination penalty until the Company has concluded that itcan reliably determine that the potential termination penalty will not be incurred or the termination penaltylapses. As of December 31, 2011, the Company had no remaining deferred fees that were included in deferredrevenues. As of December 31, 2011, the maximum termination penalty that the Company is subject to underthese arrangements, which the Company has not deemed probable of incurring, is approximately $7,294.
As of December 31, 2011, the Company has accrued for $6,045 of performance adjustments related to feesreceived for its participation in a demand response program in the accompanying consolidated balance sheet. TheCompany believes that it is probable that these fees will need to be re-paid to the electric power grid operator infiscal 2012 as a result of the Company not delivering all of its MW obligations under this demand responseprogram.
In connection with the Company’s participation in an open market bidding program, the Company enteredinto an arrangement with a third party during the second quarter of 2009 to bid capacity into the program andprovide the corresponding financial assurance required in connection with the bid. The arrangement included anup-front payment by the Company equal to $2,000, of which $1,100 was expensed as interest expense during thesecond quarter of 2009 and $900 was deferred and would be recognized ratably as a charge to cost of revenues asrevenue is recognized over the 2012/2013 delivery year. In addition, the Company would be required to pay thethird party an additional contingent fee, up to a maximum of $3,000, based on the revenue that the Companywould earn in 2012 in connection with the bid. In December 2011, the Company and the third party entered intoa termination agreement under which the Company paid a termination fee of $4,186, of which $1,000 had beenpreviously paid. As a result, of this termination agreement, the Company recorded a contract termination fee of$4,068 during the year ended December 31, 2011, which represents the $3,186 paid upon the termination and$882 that had been previously capitalized, as a component of general and administrative expenses in theaccompanying consolidated statements of operations.
The Company is currently involved in an ongoing matter related to a review of certain fees received under acontractual arrangement. This matter is in initial stages and no claim has currently been asserted. As a result, theCompany does not currently believe it is probable that a loss has been incurred and therefore, no amounts havebeen accrued related to this matter. However, the Company has determined that it is reasonably possible that theCompany may incur a loss related to this matter. The potential amount of such a loss is not currently estimable,however, it could be more than insignificant.
The Company typically grants customers a limited warranty that guarantees that its hardware willsubstantially conform to current specifications for one year from the delivery date. Based on the Company’soperating history, the liability associated with product warranties has been determined to be nominal.
Indemnification Provisions
The Company includes indemnification provisions in certain of its contracts. These indemnificationprovisions include provisions indemnifying the customer against losses, expenses, and liabilities from damagesthat could be awarded against the customer in the event that the Company’s services and related enterprisesoftware platforms are found to infringe upon a patent or copyright of a third party. The Company believes thatits internal business practices and policies and the ownership of information limits the Company’s risk in payingout any claims under these indemnification provisions.
F-47

Exhibit Index
Number Exhibit Title
2.1 Stock Purchase Agreement, dated as of December 2, 2010, by and among EnerNOC Inc., GlobalEnergy Partners, Inc., The Global Energy Partners, Inc., Employee Stock Ownership Trust andcertain individuals named herein, filed as Exhibit 2.1 to the Registrant’s Form 10-K for the yearended December 31, 2010 (File No. 001-33471), is hereby incorporated by reference as Exhibit 2.1.
2.2 Agreement and Plan of Merger, dated as of January 21, 2011, by and among EnerNOC, Inc., M2MCommunications Corporation, M2M Merger Sub, Inc., Steven L. Hodges, in his capacity asstockholder representative, and certain individuals named therein, filed as Exhibit 2.1 to theRegistrant’s Form 10-Q filed May 5, 2011 (File No. 001-33471), is hereby incorporated by referenceas Exhibit 2.2.
2.3 Stock Purchase Agreement, dated as of July 1, 2011, by and among EnerNOC, Inc., EnerNOCAustralia Pty Ltd, Energy Response Holdings Pty Ltd, Semibreve Pty Ltd, in its capacity as asecurity holder representative, and certain individuals named therein, filed as Exhibit 2.1 to theRegistrant’s Form 10-Q filed November 7, 2011 (File No. 001-33471), is hereby incorporated byreference as Exhibit 2.3.
3.1 Amended and Restated Certificate of Incorporation of EnerNOC, Inc., filed as Exhibit 3.2 to theRegistrant’sForm S-1/A filed May 3, 2007 (File No. 333-140632), is hereby incorporated by reference asExhibit 3.1.
3.2 Amended and Restated Bylaws of EnerNOC, Inc., filed as Exhibit 3.4 to the Registrant’s Form S-1/Afiled May 3, 2007 (File No. 333-140632), is hereby incorporated by reference as Exhibit 3.2.
4.1 Form of Specimen Common Stock Certificate, filed as Exhibit 4.1 to the Registrant’s Form S-1/Afiled May 3, 2007 (File No. 333-140632), is hereby incorporated by reference as Exhibit 4.1.
4.2 Fifth Amended and Restated Investor Rights Agreement, filed as Exhibit 4.1 to the Registrant’sForm 10-Q filed November 5, 2007 (File No. 001-33471), is hereby incorporated by reference asExhibit 4.2.
10.1.1 Credit Agreement among EnerNOC, Inc., ENOC Securities Corporation, Silicon Valley Bank andT.D. Bank, N.A., dated as of April 15, 2011, as amended by the First Amendment to CreditAgreement, dated as of June 30, 2011, filed as Exhibit 10.1 to the Registrant’s Form 10-Q filedAugust 9, 2011 (File No. 001-33471), is hereby incorporated by reference as Exhibit 10.1.1.
10.1.2* Second Amendment to Credit Agreement among EnerNOC, Inc., ENOC Securities Corporation,Silicon Valley Bank and T.D. Bank, N.A., dated as of November 8, 2011, and Third Amendment toCredit Agreement among EnerNOC, Inc., ENOC Securities Corporation, Silicon Valley Bank andT.D. Bank, N.A., dated as of December 30, 2011.
10.2 Guarantee and Collateral Agreement made by EnerNOC, Inc. and ENOC Securities Corporation infavor of Silicon Valley Bank, dated as of April 15, 2011, filed as Exhibit 10.2 to the Registrant’sForm 10-Q filed August 9, 2011 (File No. 001-33471), is hereby incorporated by reference as Exhibit10.2.
10.3@* Second Amended and Restated Employment Agreement, dated as of March 1, 2010, by and betweenTimothy G. Healy and EnerNOC, Inc., as amended by the First Amendment to the Second Amendedand Restated Employment Agreement, dated as of March 1, 2012.
10.4@ Second Amended and Restated Employment Agreement, dated as of March 1, 2010, by and betweenDavid B. Brewster and EnerNOC, Inc. filed as Exhibit 10.4 to the Registrant’s Annual Report onForm 10-K for the year ended December 31, 2009 (File No. 001-33471), is hereby incorporated byreference as Exhibit 10.4.

10.5@ Form of Severance Agreement by and between EnerNOC, Inc. and each of Gregg Dixon and DavidSamuels, filed as Exhibit 10.6 to the Registrant’s Form S-1 filed February 12, 2007 (File No. 333-140632), is hereby incorporated by reference as Exhibit 10.5.
10.6@ Form of Amendment No. 1 to Form of Severance Agreement by and between EnerNOC, Inc, andeach of Gregg Dixon and David Samuels, filed as Exhibit 10.3 to the Registrant’s Form 10-Q filedAugust 10, 2007 (File No. 001-33471), is hereby incorporated by reference as Exhibit 10.6.
10.7 Amended and Restated Office Lease, dated as of August 15, 2008, between Transwestern Federal,L.L.C. and EnerNOC, Inc., filed as Exhibit 10.1 to the Registrant’s Current Report on Form 8-Kfiled August 20, 2008 (File No. 001-33471), is hereby incorporated by reference as Exhibit 10.7.
10.8 First Amendment to Amended and Restated Lease, dated as of September 16, 2011, between AslanIII Federal, L.L.C. (formerly known as Transwestern Federal, L.L.C.) and EnerNOC, Inc., filed asExhibit 10.1 to the Registrant’s Form 10-Q filed November 7, 2011 (File No. 001-33471), is herebyincorporated by reference as Exhibit 10.8.
10.9 Sub-Sublease Agreement by and between Prosodie Interactive California and EnerNOC, Inc., datedMay 30, 2008, filed as Exhibit 10.1 to the Registrant’s Form 10-Q filed August 13, 2008 (FileNo. 001-33471), is hereby incorporated by reference as Exhibit 10.9.
10.10 Agreement of Lease, dated as of September 9, 2008, between CRP/Capstone 14W Property Owner,L.L.C. and EnerNOC, Inc., filed as Exhibit 10.1 to the Registrant’s Current Report on Form 8-Kfiled September 12, 2008 (File No. 001-33471), is hereby incorporated by reference asExhibit 10.10.
10.11@* EnerNOC, Inc. Amended and Restated 2007 Employee, Director and Consultant Stock Plan andHMRC Sub-Plan for UK Employees and Australian Sub-Plan, and forms of agreement thereunder.
10.12@* EnerNOC, Inc. Second Amended and Restated Non-Employee Director Compensation Policy.
10.13@* Summary of 2012 and 2013 Executive Officer Bonus Plan.
10.14@ Form of Indemnification Agreement between EnerNOC, Inc. and each of the directors and executiveofficers thereof, filed as Exhibit 10.21 to the Registrant’s Registration Statement on Form S-1, asamended, filed May 3, 2007 (File No. 333-140632), is hereby incorporated by reference asExhibit 10.14.
10.15@ Separation agreement with Darren Brady, filed as Exhibit 10.1 to the Registrant’s Form 10-Q filedMay 5, 2011 (File No. 001-33471), is hereby incorporated by reference as Exhibit 10.15.
10.16@ Severance Agreement, dated as of January 22, 2008, by and between EnerNOC, Inc. and Darren P.Brady filed as Exhibit 10.1 to the Registrant’s Current Report on Form 8-K/A filed January 24, 2008(File No. 001-33471), is hereby incorporated by reference as Exhibit 10.16.
10.17@ Offer Letter, dated as of July 27, 2009, between EnerNOC, Inc. and Timothy Weller, filed asExhibit 10.1 to the Registrant’s Current Report on Form 8-K filed July 31, 2009 (File No. 001-33471), is hereby incorporated by reference as Exhibit 10.17.
10.18@ Severance Agreement, dated as of July 27, 2009, by and between EnerNOC, Inc. and TimothyWeller, filed as Exhibit 10.2 to the Registrant’s Current Report on Form 8-K filed July 31, 2009(File No. 001-33471), is hereby incorporated by reference as Exhibit 10.18.
10.19@ Offer Letter, dated as of November 4, 2009, by and between EnerNOC, Inc. and Kevin Bligh, filedas Exhibit 10.1 to the Registrant’s Current Report on Form 8-K filed November 10, 2009 (FileNo. 001-33471), is hereby incorporated by reference as Exhibit 10.19.
21.1* Subsidiaries of EnerNOC, Inc.
23.1* Consent of Ernst & Young LLP, Independent Registered Public Accounting Firm.
31.1* Certification of Chief Executive Officer of EnerNOC, Inc. pursuant to Rule 13a-14(a) or Rule 15d-14(a) promulgated under the Securities Exchange Act of 1934, as amended.

31.2* Certification of Chief Financial Officer of EnerNOC, Inc. pursuant to Rule 13a-14(a) or Rule 15d-14(a)promulgated under the Securities Exchange Act of 1934, as amended.
32.1* Certification of the Chief Executive Officer and Chief Financial Officer of EnerNOC, Inc. pursuant toRule 13a-14(b) promulgated under the Securities Exchange Act of 1934, as amended, and 18 U.S.C.Section 1350, as adopted pursuant to Section 906 of the Sarbanes-Oxley Act of 2002.
101** The following materials from EnerNOC, Inc.’s Annual Report on Form 10-K for the year endedDecember 31, 2011, formatted in XBRL (eXtensible Business Reporting Language); (i) ConsolidatedBalance Sheets as of December 31, 2011 and 2010, (ii) Consolidated Statements of Operations for theyears ended December 31, 2011, 2010 and 2009, (iii) Consolidated Statements of Changes inStockholders’ Equity and Comprehensive (Loss) Income for the years ended December 31, 2011, 2010and 2009, (iv) Consolidated Statements of Cash Flows for the years ended December 31, 2011, 2010and 2009, and (v) Notes to Consolidated Financial Statements.**
@ Management contract, compensatory plan or arrangement.* Filed herewith** Pursuant to Rule 406T of Regulation S-T, the Interactive Data Files on Exhibit 101 hereto are deemed not
filed or part of a registration statement or prospectus for purposes of Sections 11 or 12 of the Securities Actof 1933, as amended, are deemed not filed for purposes of Section 18 of the Securities and Exchange Act of1934, as amended, and otherwise are not subject to liability under those sections.

Exhibit 23.1
Consent of Independent Registered Public Accounting Firm
We consent to the incorporation by reference in the following Registration Statements:
1. Registration Statements on Form S-3 (333-160820) of EnerNOC, Inc., and
2. Registration Statements on Form S-8 (Nos. , 333-157980, 333-149939, 333-143906, and 333-172533)pertaining to the Amended and Restated 2003 Stock Option and Incentive Plan and the Amended andRestated 2007 Employee, Director and Consultant Stock Plan of EnerNOC, Inc.;
of our reports dated March 15, 2012, with respect to the consolidated financial statements of EnerNOC, Inc. andthe effectiveness of internal control over financial reporting of EnerNOC, Inc. included in this Annual Report(Form 10-K) of EnerNOC, Inc. for the year ended December 31, 2011.
/s/ Ernst & Young LLP
Boston, MassachusettsMarch 15, 2012

Exhibit 31.1
CERTIFICATIONS UNDER SECTION 302
I, Timothy G. Healy, certify that:
1. I have reviewed this annual report on Form 10-K of EnerNOC, Inc.;
2. Based on my knowledge, this report does not contain any untrue statement of a material fact or omit to state a material factnecessary to make the statements made, in light of the circumstances under which such statements were made, not misleading withrespect to the period covered by this report;
3. Based on my knowledge, the financial statements, and other financial information included in this report, fairly present in allmaterial respects the financial condition, results of operations and cash flows of the registrant as of, and for, the periods presented inthis report;
4. The registrant’s other certifying officer(s) and I are responsible for establishing and maintaining disclosure controls andprocedures (as defined in Exchange Act Rules 13a-15(e) and 15d-15(e)) and internal control over financial reporting (as defined inExchange Act Rules 13a-15(f) and 15d-15(f)) for the registrant and have:
a) designed such disclosure controls and procedures, or caused such disclosure controls and procedures to be designed underour supervision, to ensure that material information relating to the registrant, including its consolidated subsidiaries, is madeknown to us by others within those entities, particularly during the period in which this report is being prepared;
b) designed such internal control over financial reporting, or caused such internal control over financial reporting to bedesigned under our supervision, to provide reasonable assurance regarding the reliability of financial reporting and thepreparation of financial statements for external purposes in accordance with generally accepted accounting principles;
c) evaluated the effectiveness of the registrant’s disclosure controls and procedures and presented in this report ourconclusions about the effectiveness of the disclosure controls and procedures, as of the end of the period covered by this reportbased on such evaluation; and
d) disclosed in this report any change in the registrant’s internal control over financial reporting that occurred during theregistrant’s most recent fiscal quarter (the registrant’s fourth fiscal quarter in the case of an annual report) that has materiallyaffected, or is reasonably likely to materially affect, the registrant’s internal control over financial reporting; and
5. The registrant’s other certifying officer(s) and I have disclosed, based on our most recent evaluation of internal control overfinancial reporting, to the registrant’s auditors and the audit committee of the registrant’s board of directors (or persons performingthe equivalent functions):
a) all significant deficiencies and material weaknesses in the design or operation of internal control over financial reportingwhich are reasonably likely to adversely affect the registrant’s ability to record, process, summarize and report financialinformation; and
b) any fraud, whether or not material, that involves management or other employees who have a significant role in theregistrant’s internal control over financial reporting.
Date: March 15, 2012 /s/ TIMOTHY G. HEALY
Timothy G. HealyChairman of the Board and Chief Executive Officer

Exhibit 31.2
CERTIFICATIONS UNDER SECTION 302
I, Timothy Weller, certify that:
1. I have reviewed this annual report on Form 10-K of EnerNOC, Inc.;
2. Based on my knowledge, this report does not contain any untrue statement of a material fact or omit to state a material factnecessary to make the statements made, in light of the circumstances under which such statements were made, not misleading withrespect to the period covered by this report;
3. Based on my knowledge, the financial statements, and other financial information included in this report, fairly present in allmaterial respects the financial condition, results of operations and cash flows of the registrant as of, and for, the periods presented inthis report;
4. The registrant’s other certifying officer(s) and I are responsible for establishing and maintaining disclosure controls andprocedures (as defined in Exchange Act Rules 13a-15(e) and 15d-15(e)) and internal control over financial reporting (as defined inExchange Act Rules 13a-15(f) and 15d-15(f)) for the registrant and have:
a) designed such disclosure controls and procedures, or caused such disclosure controls and procedures to be designed underour supervision, to ensure that material information relating to the registrant, including its consolidated subsidiaries, is madeknown to us by others within those entities, particularly during the period in which this report is being prepared;
b) designed such internal control over financial reporting, or caused such internal control over financial reporting to bedesigned under our supervision, to provide reasonable assurance regarding the reliability of financial reporting and thepreparation of financial statements for external purposes in accordance with generally accepted accounting principles;
c) evaluated the effectiveness of the registrant’s disclosure controls and procedures and presented in this report ourconclusions about the effectiveness of the disclosure controls and procedures, as of the end of the period covered by this reportbased on such evaluation; and
d) disclosed in this report any change in the registrant’s internal control over financial reporting that occurred during theregistrant’s most recent fiscal quarter (the registrant’s fourth fiscal quarter in the case of an annual report) that has materiallyaffected, or is reasonably likely to materially affect, the registrant’s internal control over financial reporting; and
5. The registrant’s other certifying officer(s) and I have disclosed, based on our most recent evaluation of internal control overfinancial reporting, to the registrant’s auditors and the audit committee of the registrant’s board of directors (or persons performingthe equivalent functions):
a) all significant deficiencies and material weaknesses in the design or operation of internal control over financial reportingwhich are reasonably likely to adversely affect the registrant’s ability to record, process, summarize and report financialinformation; and
b) any fraud, whether or not material, that involves management or other employees who have a significant role in theregistrant’s internal control over financial reporting.
Date: March 15, 2012 /s/ TIMOTHY WELLERTimothy WellerChief Financial Officer and Treasurer

Exhibit 32.1
CERTIFICATIONS UNDER SECTION 906
Pursuant to section 906 of the Sarbanes-Oxley Act of 2002 (subsections (a) and (b) of section 1350, chapter 63 of title 18, UnitedStates Code), each of the undersigned officers of EnerNOC, Inc., a Delaware corporation (the “Company”), does hereby certify, tosuch officer’s knowledge, that:
The Annual Report for the year ended December 31, 2011 (the “Form 10-K”) of the Company fully complies with therequirements of Section 13(a) or 15(d) of the Securities Exchange Act of 1934, and the information contained in the Form 10-K fairlypresents, in all material respects, the financial condition and results of operations of the Company.
Dated: March 15, 2012
/s/ TIMOTHY G. HEALYTimothy G. HealyChairman of the Board andChief Executive Officer
Dated: March 15, 2012
/s/ TIMOTHY WELLERTimothy WellerChief Financial Officer and Treasurer


The stock performance graph set forth below compares the cumulative total stockholder returnon our common stock from May 18, 2007 through December 31, 2011 with cumulative total return ofthe NASDAQ Composite Index and the SIC Code 7389 Index over the same period.
COMPARISON OF 56 MONTH CUMULATIVE TOTAL RETURN*Among EnerNOC Inc, the NASDAQ Composite Index, and SIC Code 7389
$0
$20
$40
$60
$80
$100
$120
$140
$160
$180
SIC Code 7389NASDAQ CompositeEnerNOC Inc
12/118/114/1112/108/104/1012/098/094/0912/088/084/0812/078/075/07
* $100 invested on 5/18/07 in stock or 4/30/07 in index, including reinvestment of dividends.Fiscal year ending December 31.
1. This graph is not “soliciting material,” is not deemed filed with the Securities and ExchangeCommission and is not to be incorporated by reference in any filing of the Company under theSecurities Act or the Exchange Act, whether made before or after the date hereof, except tothe extent that the Company specifically incorporates this graph or a portion of it byreference.
2. The stock price performance of the Company shown on the graph is not necessarily indicativeof future price performance.
3. Information used on the graph was obtained from Research Data Group, Inc., a sourcebelieved to be reliable, but the Company is not responsible for any errors or omissions in suchinformation.
4. Our market capitalization as of December 31, 2011 was approximately $296.8 million.

EnerNOC, Inc. Headquarters101 Federal Street Suite 1100Boston, MA 02110Offi ce: 617.224.9900Fax: 617.224.9910
www.enernoc.com
EnerNOC, Inc. is headquartered in Boston, MA, United States, with wholly-owned subsidiaries in Canada (EnerNOC Ltd.), the United Kingdom (EnerNOC UK Limited), New Zealand (EnerNOC New Zealand Limited), and Australia (EnerNOC Pty Ltd, ABN 49 104 710 278). EnerNOC UK Limited is a company incorporated in England and Wales with company number 06937931, VAT number GB980145422 and whose registered offi ce is located at Alder Castle, 4th Floor, 10 Noble Street, London EC2V 7JX. A list of directors is available for inspection at our offi ces.
©2012 EnerNOC, Inc. All rights reserved. No text can be reprinted without permission.
Annual Report 2011
41057.indd 1-341057.indd 1-3 4/4/12 2:08 AM4/4/12 2:08 AM