green cross corporation and its subsidiaries - gc pharma · green cross corporation and its...
TRANSCRIPT

Green Cross Corporation and its subsidiaries
Consolidated fi nancial statementsfor the years ended December 31, 2016 and 2015
with the independent auditors’ report

Table of contents
Independent auditors’ report Page Consolidated financial statements
Consolidated statements of financial position 1 Consolidated statements of comprehensive income 3 Consolidated statements of changes in equity 4 Consolidated statements of cash flows 5 Notes to the consolidated financial statements 6
Independent auditors’ report
The Shareholders and Board of Directors Green Cross Corporation We have audited the accompanying consolidated financial statements of Green Cross Corporation (the “Company”) and its subsidiaries (collectively the “Group”), which comprise the consolidated statements of financial position as at December 31, 2016 and 2015, and the consolidated statements of comprehensive income, consolidated statements of changes in equity and consolidated statements of cash flows for the years then ended, and a summary of significant accounting policies and other explanatory information. Management's responsibility for the consolidated financial statements Management is responsible for the preparation and fair presentation of these consolidated financial statements in accordance with Korean International Financial Reporting Standards, and for such internal control as management determines is necessary to enable the preparation of the consolidated financial statements that are free from material misstatement, whether due to fraud or error. Auditors’ responsibility Our responsibility is to express an opinion on these consolidated financial statements based on our audits. We conducted our audits in accordance with auditing standards generally accepted in the Republic of Korea. Those standards require that we comply with ethical requirements and plan and perform the audit to obtain reasonable assurance about whether the consolidated financial statements are free from material misstatement. An audit involves performing procedures to obtain audit evidence about the amounts and disclosures in the consolidated financial statements. The procedures selected depend on the auditors’ judgment, including the assessment of the risks of material misstatement of the consolidated financial statements, whether due to fraud or error. In making those risk assessments, the auditors consider internal control relevant to the entity's preparation and fair presentation of the consolidated financial statements in order to design audit procedures that are appropriate in the circumstances, but not for the purpose of expressing an opinion on the effectiveness of the entity's internal control. An audit also includes evaluating the appropriateness of accounting policies used and the reasonableness of accounting estimates made by management, as well as evaluating the overall presentation of the consolidated financial statements. We believe that the audit evidence we have obtained is sufficient and appropriate to provide a basis for our audit opinion.
한영회계법인
서울특별시 영등포구 여의공원로 111, 태영빌딩 3-8F07241
Tel: 02 3787 6600 Fax: 02 783 5890 ey.com/kr
Ernst & Young Han YoungTaeyoung Building, 111, Yeouigongwon-ro, Yeongdeungpo-gu, Seoul 07241 Korea
Tel: +82 2 3787 6600 Fax: +82 2 783 5890 ey.com/kr

Opinion In our opinion, the consolidated financial statements present fairly, in all material respects, the financial position of the Group as at December 31, 2016 and 2015, and its financial performance and cash flows for the years then ended in accordance with Korean International Financial Reporting Standards.
March 16, 2017
This audit report is effective as at March 16, 2017, the independent auditors’ report date. Accordingly,
certain material subsequent events or circumstances may have occurred during the period from the date of
the independent auditors’ report to the time this report is used. Such events and circumstances could
significantly affect the accompanying consolidated financial statements and may result in modifications to
this report.

GREEN CROSS CORPORATION and its subsidiaries
Consolidated financial statements for the years ended December 31, 2016 and 2015
“The accompanying consolidated financial statements, including all footnotes and disclosures, have been
prepared by, and are the responsibility of, the Company.” Huh, Eun Chul Chief Executive Officer Green Cross Corporation

Notes
Assets
Current assets:
Cash and cash equivalents 4 \ 56,920,250,501 \ 57,736,364,909
Trade and other receivables, net 5 344,970,619,852 288,383,609,050
Current financial assets 6 60,276,998,226 55,580,000,000
Inventories, net 7 320,752,651,018 324,730,944,417 Other current assets 12 18,456,932,314 17,030,607,904
Total current assets 801,377,451,911 743,461,526,280
Non-current assets:
Long-term trade and other receivables, net 5 8,135,854,362 8,196,722,400
Non-current financial assets 6,30 26,095,927,060 26,040,091,957
Investment in associates 8 67,352,954,178 58,652,651,388
Property, plant and equipment, net 9 554,025,943,196 500,402,998,344
Intangible assets, net 10 73,613,464,953 60,226,083,709
Investment properties 11 8,427,494,801 8,549,603,413
Deferred tax assets 28 11,585,573,567 9,598,768,080
Total non-current assets 749,237,212,117 671,666,919,291 Total assets \ 1,550,614,664,028 \ 1,415,128,445,571
(Continued)
Green Cross Corporation and its subsidiaries
Consolidated statements of financial position
as at December 31, 2016 and 2015
(Korean won)
2016 2015
1

Notes
Liabilities and equityCurrent liabilities:
Trade and other payables 13 \ 164,059,572,720 \ 188,734,626,433
Short-term borrowings 14 99,300,000,000 58,685,581,512
Income tax payables 7,259,969,704 35,140,417,579 Provisions 15 13,761,496,531 12,219,471,772
Other current liabilities 12 18,916,116,514 12,955,323,799
Total current liabilities 303,297,155,469 307,735,421,095
Non-current liabilities:
Long-term trade and other payables 13 1,914,907,254 1,405,210,996
Long-term borrowings 14 149,545,117,977 74,000,000,000
Net employee defined benefit liabilities 16 15,744,609,643 18,015,991,507
Deferred tax liabilities 28 2,256,060,907 1,925,492,162
Other non-current liabilities 12 18,845,778,730 14,342,317,364
Total non-current liabilities 188,306,474,511 109,689,012,029
Total liabilities 491,603,629,980 417,424,433,124
Equity
Issued capital 1,17 58,432,690,000 58,432,690,000
Share premium 18 324,532,146,247 311,314,319,208
Other components of equity 19 (35,701,766,555) (13,911,996,125)
Accumulated other comprehensive income 20 8,565,283,585 5,521,677,561
Retained earnings 21 637,242,993,956 595,452,795,864
Equity attributable to the owners of the parent 993,071,347,233 956,809,486,508
Non-controlling interests 1 65,939,686,815 40,894,525,939
Total equity 1,059,011,034,048 997,704,012,447
Total liabilities and equity \ 1,550,614,664,028 \ 1,415,128,445,571
The notes are an integral part of the consolidated financial statements.
Green Cross Corporation and its subsidiaries
Consolidated statements of financial position
as at December 31, 2016 and 2015 (cont'd)
(Korean won)
2016 2015
2
Notes
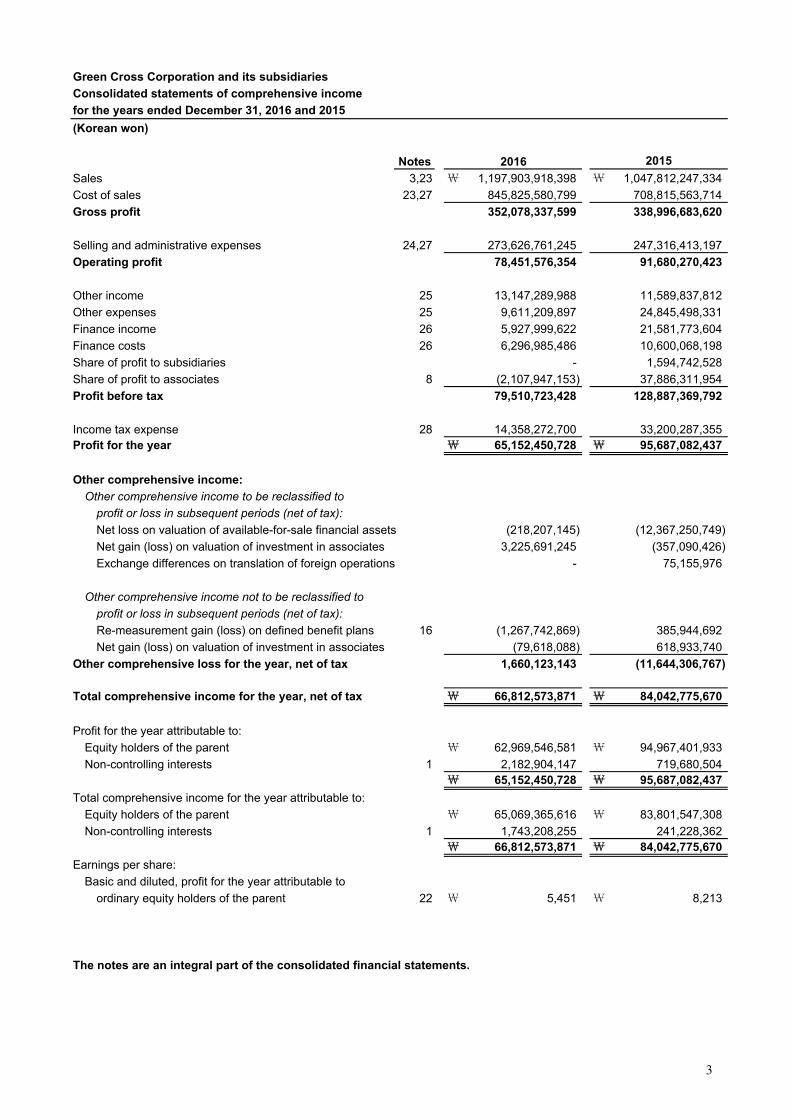
Sales 3,23 \ 1,197,903,918,398 \ 1,047,812,247,334
Cost of sales 23,27 845,825,580,799 708,815,563,714
Gross profit 352,078,337,599 338,996,683,620
Selling and administrative expenses 24,27 273,626,761,245 247,316,413,197
Operating profit 78,451,576,354 91,680,270,423
Other income 25 13,147,289,988 11,589,837,812
Other expenses 25 9,611,209,897 24,845,498,331
Finance income 26 5,927,999,622 21,581,773,604
Finance costs 26 6,296,985,486 10,600,068,198
Share of profit to subsidiaries - 1,594,742,528
Share of profit to associates 8 (2,107,947,153) 37,886,311,954
Profit before tax 79,510,723,428 128,887,369,792
Income tax expense 28 14,358,272,700 33,200,287,355 Profit for the year \ 65,152,450,728 \ 95,687,082,437
Other comprehensive income:
Other comprehensive income to be reclassified to profit or loss in subsequent periods (net of tax):Net loss on valuation of available-for-sale financial assets (218,207,145) (12,367,250,749)
Net gain (loss) on valuation of investment in associates 3,225,691,245 (357,090,426)
Exchange differences on translation of foreign operations - 75,155,976
Other comprehensive income not to be reclassified to profit or loss in subsequent periods (net of tax):Re-measurement gain (loss) on defined benefit plans 16 (1,267,742,869) 385,944,692
Net gain (loss) on valuation of investment in associates (79,618,088) 618,933,740
Other comprehensive loss for the year, net of tax 1,660,123,143 (11,644,306,767)
Total comprehensive income for the year, net of tax \ 66,812,573,871 \ 84,042,775,670
Profit for the year attributable to:
Equity holders of the parent \ 62,969,546,581 \ 94,967,401,933
Non-controlling interests 1 2,182,904,147 719,680,504 \ 65,152,450,728 \ 95,687,082,437
Total comprehensive income for the year attributable to:
Equity holders of the parent \ 65,069,365,616 \ 83,801,547,308
Non-controlling interests 1 1,743,208,255 241,228,362 \ 66,812,573,871 \ 84,042,775,670
Earnings per share:
Basic and diluted, profit for the year attributable to
ordinary equity holders of the parent 22 \ 5,451 \ 8,213
The notes are an integral part of the consolidated financial statements.
Green Cross Corporation and its subsidiaries
Consolidated statements of comprehensive income
for the years ended December 31, 2016 and 2015
(Korean won)
2016 2015
3

Green Cross Corporation and its subsidiaries
Consolidated statements of changes in equity
for the years ended December 31, 2016 and 2015
As at January 1, 2015 \ 58,432,690,000 \ 316,513,944,358 \ (13,911,996,125) \ 18,200,405,099 \ 513,426,493,518 \ 892,661,536,850 \ 27,965,289,930 \ 920,626,826,780
Profit for the year - - - - 94,967,401,933 94,967,401,933 719,680,504 95,687,082,437
Net loss on valuation of available-for-sale financial assets - - - (12,396,793,088) - (12,396,793,088) 29,542,339 (12,367,250,749)
Net gain (loss) on valuation of investment in associates - - - (357,090,426) 618,933,740 261,843,314 - 261,843,314
Exchange differences on translation of foreign operations - - - 75,155,976 - 75,155,976 - 75,155,976
Re-measurement gain on defined benefit plans - - - - 893,939,173 893,939,173 (507,994,481) 385,944,692
Total comprehensive income for the year - - - (12,678,727,538) 96,480,274,846 83,801,547,308 241,228,362 84,042,775,670
Dividends - - - - (14,453,972,500) (14,453,972,500) (574,257,100) (15,028,229,600)
Differential dividends in subsidiaries - (44,885,102) - - - (44,885,102) 44,885,102 -
Issuance of ordinary shares in subsidiaries - (480,609,916) - - - (480,609,916) 9,923,368,836 9,442,758,920
Equity adjustments in subsidiaries - (133,147,898) - - - (133,147,898) 215,225,210 82,077,312
Changes in the scope of consolidation - - - - - - 2,978,308,718 2,978,308,718
Equity transaction under common control - (4,440,505,353) - - - (4,440,505,353) - (4,440,505,353)
Merger between subsidiaries - (100,476,881) - - - (100,476,881) 100,476,881 -
Total transactions with owners of the parent - (5,199,625,150) - - (14,453,972,500) (19,653,597,650) 12,688,007,647 (6,965,590,003)As at December 31, 2015 \ 58,432,690,000 \ 311,314,319,208 \ (13,911,996,125) \ 5,521,677,561 \ 595,452,795,864 \ 956,809,486,508 \ 40,894,525,939 \ 997,704,012,447
As at January 1, 2016 \ 58,432,690,000 \ 311,314,319,208 \ (13,911,996,125) \ 5,521,677,561 \ 595,452,795,864 \ 956,809,486,508 \ 40,894,525,939 \ 997,704,012,447
Profit for the year - - - - 62,969,546,581 62,969,546,581 2,182,904,147 65,152,450,728
Net loss on valuation of available-for-sale financial assets - - - (182,085,221) - (182,085,221) (36,121,924) (218,207,145)
Net gain (loss) on valuation of investment in associates - - - 3,225,691,245 (79,618,088) 3,146,073,157 - 3,146,073,157
Re-measurement loss on defined benefit plans - - - - (864,168,901) (864,168,901) (403,573,968) (1,267,742,869)
Total comprehensive income for the year - - - 3,043,606,024 62,025,759,592 65,069,365,616 1,743,208,255 66,812,573,871
Dividends - - - - (20,235,561,500) (20,235,561,500) (264,338,250) (20,499,899,750)
Acquisition of treasury shares - - (21,789,770,430) - - (21,789,770,430) - (21,789,770,430)
Differential dividends in subsidiaries - (18,509,812) - - - (18,509,812) 18,509,812 -
Issuance of ordinary shares in subsidiaries - 13,231,824,624 - - - 13,231,824,624 23,537,293,286 36,769,117,910
Equity adjustments in subsidiaries - 4,512,227 - - - 4,512,227 10,487,773 15,000,000
Total transactions with owners of the parent - 13,217,827,039 (21,789,770,430) - (20,235,561,500) (28,807,504,891) 23,301,952,621 (5,505,552,270)As at December 31, 2016 \ 58,432,690,000 \ 324,532,146,247 \ (35,701,766,555) \ 8,565,283,585 \ 637,242,993,956 \ 993,071,347,233 \ 65,939,686,815 \ 1,059,011,034,048
The notes are an integral part of the consolidated financial statements.
Sub-totalNon-controlling
interests Total equity
(Korean won)
Attributable to the equity holders of the parent
Issued capital Share premiumOther components
of equity
Accumulated othercomprehensive
income Retained earnings
4

Green Cross Corporation and its subsidiaries
Consolidated statements of cash flowsfor the years ended December 31, 2016 and 2015
NotesOperating activities
Cash flows from operating activities 31 \ 44,797,631,475 \ 79,494,586,354
Interest received 926,951,322 870,028,787 Dividend received 403,027,513 385,094,486 Interest paid (4,593,854,807) (4,862,119,648)Income tax paid (43,276,040,032) (30,643,812,318)
Net cash flows from (used in) operating activities (1,742,284,529) 45,243,777,661
Investing activities
Decrease in short-term financial instruments 161,910,850,000 161,137,425,356 Proceeds from disposal of available-for-sale financial assets 181,145,717 35,514,576,796 Proceeds from disposal of investment in associates - 130,258,778,375 Proceeds from disposal of investment in subsidiaries - 215,225,210 Proceeds from disposal of property, plant and equipment 109,228,806 183,631,494
Proceeds from disposal of intangible assets 151,178,750 32,009,999 Decrease in deposits - 893,085,018 Increase in short-term financial instruments (166,308,283,390) (154,389,264,431)Increase in long-term loans (50,000,000) - Acquisition of available-for-sale financial assets (500,339,703) - Acquisition of investment in associates (7,912,170,000) (28,032,900,000)Acquisition of property, plant and equipment (80,668,468,011) (121,151,443,759)Acquisition of intangible assets (17,998,293,182) (14,486,749,177)Increase in deposits - (1,339,993,400)
Changes in the scope of consolidation - (999,043,339)Net cash flows from (used in) investing activities (111,085,151,013) 7,835,338,142
Financing activities
Increase in short-term borrowings 168,900,000,000 955,062,484,699 Increase in long-term borrowings 10,000,000,000 90,975,330,000 Issurance of bonds 149,450,400,000 -
Issuance of ordinary shares in subsidiaries 36,769,117,910 9,309,611,025
Equity adjustments in subsidiaries 15,000,000 -
Repayment of short-term borrowings (212,285,581,512) (1,012,940,740,444)
Repayment of current portion of long-term borrowings - (30,000,000,000)
Repayment of long-term borrowings - (25,000,000,000)Acquisition of treasury shares (21,789,770,430) - Payment of dividends (20,499,906,536) (15,028,450,790)
Net cash flows from (used in) financing activities 110,559,259,432 (27,621,765,510)
Net increase (decrease) in cash and cash equivalents (2,268,176,110) 25,457,350,293 Cash and cash equivalents as at January 1 57,736,364,909 32,001,573,669 Net foreign exchange difference 1,452,061,702 277,440,947 Cash and cash equivalents as at December 31 \ 56,920,250,501 \ 57,736,364,909
The notes are an integral part of the consolidated financial statements.
(Korean won)
2016 2015
5

Green Cross Coporation and its subsidiaries Notes to the consolidated financial statements December 31, 2016 and 2015
1. Organization and business
1-1 The Company Green Cross Corporation (the “Company”), located in 107, Ihyeon-ro 30 beon-gil, Giheung-gu, Yongin, Gyeonggi province, was incorporated on November 1, 1969, and is engaged in the manufacture and sale of pharmaceutical products. On August 1, 1989, the Company was listed on the Korea Exchange. As at December 31, 2016, the Company issued capital amounts to ₩58,433 million, and 52.38% of the issued capital is owned by Green Cross Holdings Corporation, the major shareholder of the Company (including the shares of other related parties).
1-2 Consolidated subsidiaries Details of subsidiaries as at December 31, 2016 and 2015 are as follows:
Equity
ownership (%)
Subsidiary Principal activity Parent company 2016 2015 LocationGreen Cross Medical Science
Co., Ltd. (*1) Manufacture of
diagnostic reagents Green Cross Corp. 42.10 42.10 Korea Green Cross Wellbeing Co.,Ltd. (*1),(*2)
Manufacture and sale of pharmaceuticals Green Cross Corp. 31.83 31.83 Korea
Green Cross LabCell Co., Ltd. (*1),(*3)
Blood diagnostics Green Cross Corp. 38.66 48.00 Korea
Invac Pharm Corp. Farming Green Cross Corp. 92.55 92.55 Korea Green Cross Genome Co., Ltd.(*4)
Genetic analysis Green Cross Corp. 54.35 54.68 Korea
Green Cross Medis Corp. (*5),(*6)
Manufacture of intravenous glucose monitoring
devices Green Cross Corp.
and etc. 51.00 51.00 Korea (*1) The entity is included as a subsidiary because the Company is the largest shareholder of the entity and has rights to make decisions on operational and financial issues although its equity interest in the entity is less than 50%. Under the contract with Green Cross Holdings Corporation who is the largest shareholder of the Company, Green Cross Holdings Corporation delegated 16.93% of voting rights to the Company. (*2) During the previous reporting period, GC JBP Co., Ltd. was renamed as Green Cross JBP Co., Ltd., which was renamed as Green Cross Wellbeing Co., Ltd. (*3) The Company’s equity interest in the entity decreased as third parties participated in a public capital increase of the entity in 2016. (*4) The change in equity interests was due to disposal of the certain interests of the Company in 2016. (*5) During the previous reporting period, the Company acquired the equity securities of Green Cross Medis Corp. and recognized financial liabilities related to the acquisition of the equity securities (See Note 35). (*6) Although the company holds less than 50% of the equity interest in the entity, the entity is classified as a subsidiary subject to consolidation considering the company’s indirect control over the entity through Green Cross Medical Science Co., Ltd., a subsidiary.
6
Green Cross Coporation and its subsidiaries Notes to the consolidated financial statements December 31, 2016 and 2015
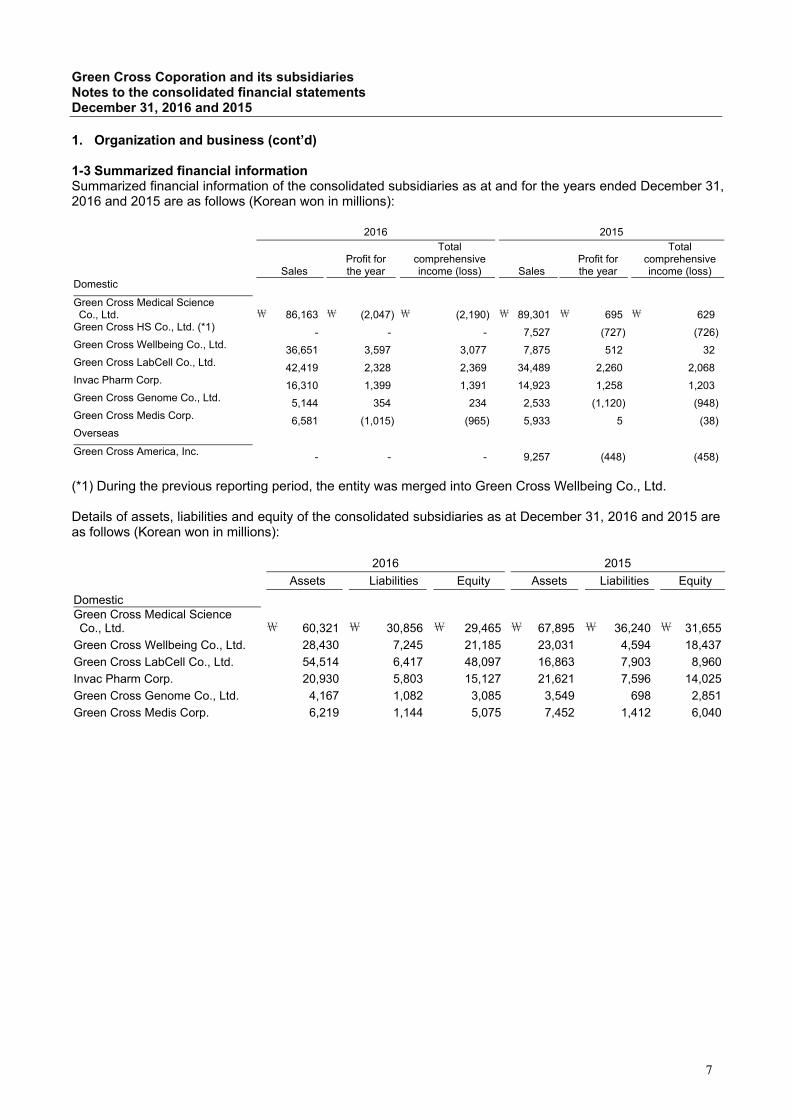
1. Organization and business (cont’d) 1-3 Summarized financial information Summarized financial information of the consolidated subsidiaries as at and for the years ended December 31, 2016 and 2015 are as follows (Korean won in millions):
2016 2015
Sales Profit for the year
Total comprehensiveincome (loss) Sales
Profit for the year
Total comprehensiveincome (loss)
Domestic
Green Cross Medical Science Co., Ltd.
₩ 86,163 ₩ (2,047) ₩ (2,190) ₩ 89,301 ₩ 695 ₩ 629
Green Cross HS Co., Ltd. (*1) - - - 7,527 (727) (726)Green Cross Wellbeing Co., Ltd. 36,651 3,597 3,077 7,875 512 32Green Cross LabCell Co., Ltd. 42,419 2,328 2,369 34,489 2,260 2,068Invac Pharm Corp. 16,310 1,399 1,391 14,923 1,258 1,203Green Cross Genome Co., Ltd. 5,144 354 234 2,533 (1,120) (948)Green Cross Medis Corp. 6,581 (1,015) (965) 5,933 5 (38)Overseas Green Cross America, Inc. - - - 9,257 (448) (458) (*1) During the previous reporting period, the entity was merged into Green Cross Wellbeing Co., Ltd. Details of assets, liabilities and equity of the consolidated subsidiaries as at December 31, 2016 and 2015 are as follows (Korean won in millions):
2016 2015
Assets Liabilities Equity Assets Liabilities Equity
Domestic Green Cross Medical Science Co., Ltd.
₩ 60,321 ₩ 30,856 ₩ 29,465 ₩ 67,895 ₩ 36,240 ₩ 31,655
Green Cross Wellbeing Co., Ltd. 28,430 7,245 21,185 23,031 4,594 18,437
Green Cross LabCell Co., Ltd. 54,514 6,417 48,097 16,863 7,903 8,960
Invac Pharm Corp. 20,930 5,803 15,127 21,621 7,596 14,025
Green Cross Genome Co., Ltd. 4,167 1,082 3,085 3,549 698 2,851
Green Cross Medis Corp. 6,219 1,144 5,075 7,452 1,412 6,040
7

Green Cross Coporation and its subsidiaries Notes to the consolidated financial statements December 31, 2016 and 2015
1. Organization and business (cont’d) 1-4 Non-controlling interests Summarized financial information of the consolidated subsidiaries attributable to non-controlling interests (before inter-group eliminations) as at and for the years ended December 31, 2016 and 2015 are as follows (Korean won in millions):
2016
Green Cross Medical
Science Co., Ltd.
Green Cross
WellbeingCo., Ltd.
Green Cross
LabCell Co., Ltd.
Invac Pharm Corp.
Green Cross
Genome Co., Ltd.
Green Cross Medis Corp. Sub-total
Inter -group
eliminations Total
Non-controlling interests 57.90% = 68.17% 61.34% 7.45% 45.65% 49.00%
Current assets ₩ 39,327 ₩ 14,096 ₩ 44,935 ₩ 2,943 ₩ 2,019 ₩ 2,983
Non-current assets 20,994 14,334 9,579 17,987 2,148 3,236
Current liabilities 27,039 5,496 4,623 5,436 922 460
Non-current liabilities 3,817 1,749 1,794 367 160 684
Net assets 29,465 21,185 48,097 15,127 3,085 5,075
Book value of non-controlling interests 17,060 14,441 29,503 1,127 1,408 2,487 ₩ 66,026 ₩ (86) ₩ 65,940
Revenue 86,163 36,651 42,419 16,310 5,144 6,581
Profit or loss for the year (2,047) 3,597 2,328 1,399 354 (1,015) Other comprehensive income (loss) (143) (520) 41 (8) (120) 50 Total comprehensive income (loss) (2,190) 3,077 2,369 1,391 234 (965) Profit (loss) for the year attributable to non-controlling interests (1,185) 2,452 1,428 104 162 (497) 2,464 (281) 2,183Total comprehensive income (loss) attributable to non-controlling interests (1,268) 2,098 1,453 104 107 (473) 2,021 (278) 1,743Cash flows from (used in) operating activities 9,992 (1,562) (297) 2,980 643 271 Cash flows from (used in) investing activities (2,523) 313 (36,354) (1,142) (588) (380) Cash flows from (used in) financing activities (6,886) (329) 36,769 (1,838) - - Net increase (decrease) in cash and cash equivalents 583 (1,578) 118 - 55 (109)
8

Green Cross Coporation and its subsidiaries Notes to the consolidated financial statements December 31, 2016 and 2015
1. Organization and business (cont’d) 1-4 Non-controlling interests (cont’d)
2015
Green Cross
Medical Science Co., Ltd.
Green Cross
WellbeingCo., Ltd.
Green Cross
LabCell Co., Ltd.
Invac Pharm Corp.
Green Cross
Genome Co., Ltd.
Green Cross Medis Corp. Sub-total
Inter -group
eliminations Total
Non-controlling interests 57.90% = 68.17% 52.00% 7.45% 45.32% 49.00%
Current assets ₩ 46,858 ₩ 11,378 ₩ 7,793 ₩ 2,824 ₩ 1,834 ₩ 3,907
Non-current assets 21,037 11,653 9,070 18,797 1,715 3,545
Current liabilities 33,007 3,259 6,139 2,995 529 811
Non-current liabilities 3,233 1,335 1,764 4,601 169 601
Net assets 31,655 18,437 8,960 14,025 2,851 6,040
Book value of non-controlling interests 18,328 12,569 4,659 1,045 1,293 2,960 ₩40,854 ₩ 41 ₩40,895
Revenue 89,301 7,875 34,489 14,923 2,533 5,933
Profit or loss for the year 695 512 2,260 1,258 (1,120) 5 Other comprehensive income (loss) (66) (480) (192) (55) 172 (43) Total comprehensive income (loss) 629 32 2,068 1,203 (948) (38) Profit (loss) for the year attributable to non-controlling interests 402 349 1,175 94 (508) 2 1,514 (794) 720Total comprehensive income (loss) attributable to non-controlling interests 364 22 1,075 90 (430) (19) 1,102 (861) 241Cash flows from (used in) operating activities (4,379) 747 1,698 (118) (972) (2,523) Cash flows used in investing Activities (8,540) (7,572) (2,187) (472) (788) (1,106) Cash flows from (used in) financing activities 13,282 8,352 523 599 1,663 (4,000) Net increase (decrease) in cash and cash equivalents 363 1,527 34 9 (97) (7,629) 1-5 Investment in associates Investment in associates as at December 31, 2016 and 2015 are as follows: 2016 2015
Associate Principal activity Parent
company Parent
company Subsidiary Total Parent
company Subsidiary Total
LocationDomestic Medigen Biotech Corp.
Plasma research
Green Cross Corp. 50.00% - 50.00% 50.00% - 50.00% Korea
Green Cross Cell Co., Ltd.
Manufacture and sales of
immunotheraphy Green Cross Corp. 25.03% - 25.03% 25.03% - 25.03% Korea
Overseas
PBS Biotech, Inc. (*1)
Service
Green Cross Corp. and
etc 26.07% 1.44% 27.51% 26.07% 1.44% 27.51% USA Green Cross North America Inc. (*2)
Service Green Cross Corp. 46.85% - 46.85% 46.24% - 46.24% Canada
Green Cross America, lnc. (*2)
Healthcare service
Green Cross Corp. 25.93% - 25.93% 37.50% - 37.50% USA
(*1) The Company’s equity interest in the entity excludes preferred shares. (*2) The Company’s equity interest in the entity changed as third parties participated in a public capital increase of the entity in 2016.
9

Green Cross Coporation and its subsidiaries Notes to the consolidated financial statements December 31, 2016 and 2015
2. Basis of preparation and summary of significant accounting policies
2-1 Basis of consolidated financial statements preparation The Company and its subsidiaries (collectively referred to as the “Group”) prepare statutory consolidated financial statements in the Korean language in accordance with Korean International Financial Reporting Standards (KIFRS) enacted by the Act on External Audit of Stock Companies. The accompanying consolidated financial statements have been prepared on a historical cost basis, except for financial instruments that have been measured at fair value and when otherwise noted. The consolidated financial statements are presented in Korean won and all values are rounded to the nearest million, except when otherwise indicated.
2-2 Principles of consolidation The consolidated financial statements comprise the financial statements of the Company and its subsidiaries as at December 31, 2016. Control is achieved when the Group is exposed, or has rights, to variable returns from its involvement with the investee and has the ability to affect those returns through its power over the investee. Specifically, the Group controls an investee if, and only if, the Group has: - Power over the investee (i.e. existing rights that give it the current ability to direct the relevant activities of
the investee) - Exposure, or rights, to variable returns from its involvement with the investee, and - The ability to use its power over the investee to affect its returns
When the Group has less than a majority of the voting or similar rights of an investee, the Group considers all relevant facts and circumstances in assessing whether it has power over an investee, including: - The contractual arrangement with the other vote holders of the investee - Rights arising from other contractual arrangements - The Group’s voting rights and potential voting rights
The Group re-assesses whether or not it controls an investee if facts and circumstances indicate that there are changes to one or more of the three elements of control. Consolidation of a subsidiary begins when the Group obtains control over the subsidiary and ceases when the Group loses control of the subsidiary. Assets, liabilities, income and expenses of a subsidiary acquired or disposed of during the year are included in the consolidated statements of comprehensive income from the date the Group gains control until the date the Group ceases to control the subsidiary.
Profit or loss and each component of other comprehensive income (OCI) are attributed to the equity holders of the parent and to the non-controlling interests, even if this results in the non-controlling interests having a deficit balance. When necessary, adjustments are made to the financial statements of subsidiaries to bring their accounting policies into line with the Group’s accounting policies. All intra-group assets and liabilities, equity, income, expenses and cash flows relating to transactions between members of the Group are eliminated in full on consolidation.
A change in the ownership interest of a subsidiary, without a loss of control, is accounted for as an equity transaction.
If the Group loses control over a subsidiary, it derecognizes the related assets (including goodwill), liabilities, non-controlling interest and other components of equity while any resultant gain or loss is recognized in profit or loss. Any investment retained is recognized at fair value. 2-3 Business combinations and goodwill Business combinations are accounted for using the acquisition method. The cost of an acquisition is measured as the aggregate of the consideration transferred, which is measured at acquisition date fair value and the amount of any non-controlling interest in the acquiree. For each business combination, the acquirer measures the non-controlling interest in the acquiree either at fair value or at the proportionate share of the acquiree’s identifiable net assets. Acquisition costs incurred are expensed and included in administrative expenses.
10
Green Cross Coporation and its subsidiaries Notes to the consolidated financial statements December 31, 2016 and 2015
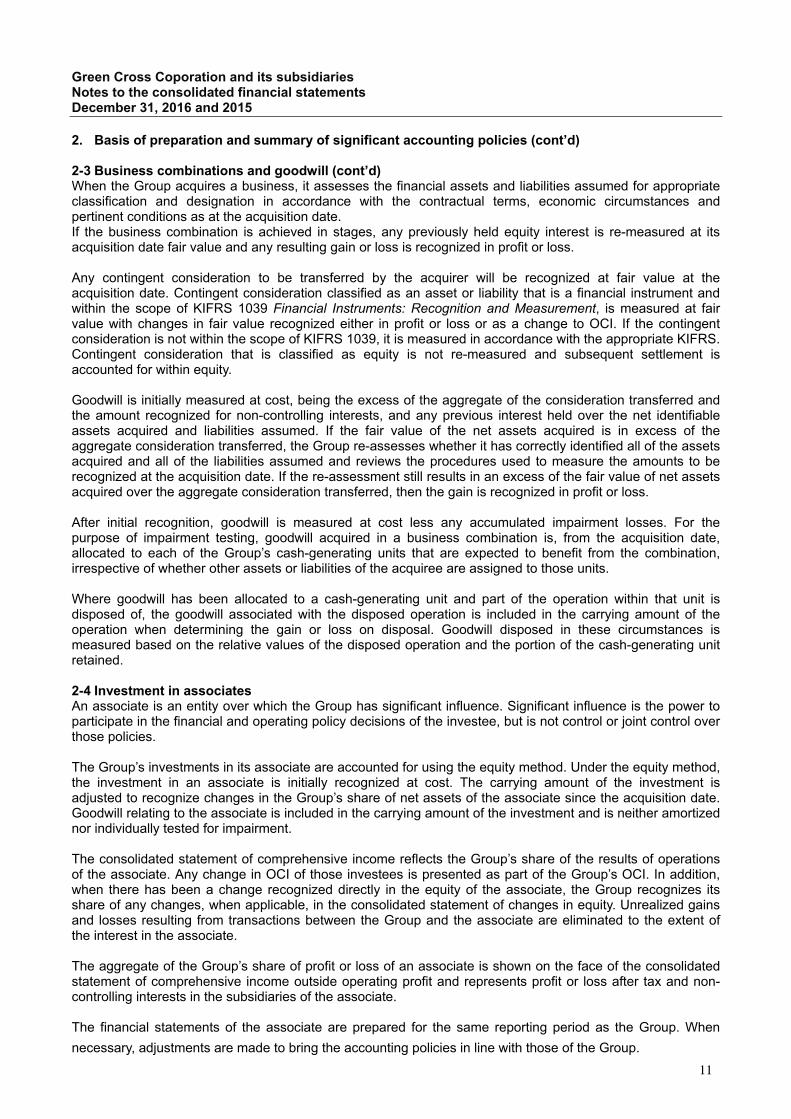
2. Basis of preparation and summary of significant accounting policies (cont’d) 2-3 Business combinations and goodwill (cont’d) When the Group acquires a business, it assesses the financial assets and liabilities assumed for appropriate classification and designation in accordance with the contractual terms, economic circumstances and pertinent conditions as at the acquisition date. If the business combination is achieved in stages, any previously held equity interest is re-measured at its acquisition date fair value and any resulting gain or loss is recognized in profit or loss. Any contingent consideration to be transferred by the acquirer will be recognized at fair value at the acquisition date. Contingent consideration classified as an asset or liability that is a financial instrument and within the scope of KIFRS 1039 Financial Instruments: Recognition and Measurement, is measured at fair value with changes in fair value recognized either in profit or loss or as a change to OCI. If the contingent consideration is not within the scope of KIFRS 1039, it is measured in accordance with the appropriate KIFRS. Contingent consideration that is classified as equity is not re-measured and subsequent settlement is accounted for within equity.
Goodwill is initially measured at cost, being the excess of the aggregate of the consideration transferred and the amount recognized for non-controlling interests, and any previous interest held over the net identifiable assets acquired and liabilities assumed. If the fair value of the net assets acquired is in excess of the aggregate consideration transferred, the Group re-assesses whether it has correctly identified all of the assets acquired and all of the liabilities assumed and reviews the procedures used to measure the amounts to be recognized at the acquisition date. If the re-assessment still results in an excess of the fair value of net assets acquired over the aggregate consideration transferred, then the gain is recognized in profit or loss.
After initial recognition, goodwill is measured at cost less any accumulated impairment losses. For the purpose of impairment testing, goodwill acquired in a business combination is, from the acquisition date, allocated to each of the Group’s cash-generating units that are expected to benefit from the combination, irrespective of whether other assets or liabilities of the acquiree are assigned to those units. Where goodwill has been allocated to a cash-generating unit and part of the operation within that unit is disposed of, the goodwill associated with the disposed operation is included in the carrying amount of the operation when determining the gain or loss on disposal. Goodwill disposed in these circumstances is measured based on the relative values of the disposed operation and the portion of the cash-generating unit retained. 2-4 Investment in associates An associate is an entity over which the Group has significant influence. Significant influence is the power to participate in the financial and operating policy decisions of the investee, but is not control or joint control over those policies.
The Group’s investments in its associate are accounted for using the equity method. Under the equity method, the investment in an associate is initially recognized at cost. The carrying amount of the investment is adjusted to recognize changes in the Group’s share of net assets of the associate since the acquisition date. Goodwill relating to the associate is included in the carrying amount of the investment and is neither amortized nor individually tested for impairment. The consolidated statement of comprehensive income reflects the Group’s share of the results of operations of the associate. Any change in OCI of those investees is presented as part of the Group’s OCI. In addition, when there has been a change recognized directly in the equity of the associate, the Group recognizes its share of any changes, when applicable, in the consolidated statement of changes in equity. Unrealized gains and losses resulting from transactions between the Group and the associate are eliminated to the extent of the interest in the associate.
The aggregate of the Group’s share of profit or loss of an associate is shown on the face of the consolidated statement of comprehensive income outside operating profit and represents profit or loss after tax and non-controlling interests in the subsidiaries of the associate.
The financial statements of the associate are prepared for the same reporting period as the Group. When
necessary, adjustments are made to bring the accounting policies in line with those of the Group.
11

Green Cross Coporation and its subsidiaries Notes to the consolidated financial statements December 31, 2016 and 2015
2. Basis of preparation and summary of significant accounting policies (cont’d) 2-4 Investment in associates (cont’d) After application of the equity method, the Group determines whether it is necessary to recognize an impairment loss on its investment in its associate. At each reporting date, the Group determines whether there is objective evidence that the investment in the associate is impaired. If there is such evidence, the Group calculates the amount of impairment as the difference between the recoverable amount of the associate and its carrying value, and then recognizes the amount in the statement of other comprehensive income.
Upon loss of significant influence over the associate, the Group measures and recognizes any retained investment at its fair value. Any difference between the carrying amount of the associate upon loss of significant influence and the fair value of the retained investment and proceeds from disposal is recognized in profit or loss. 2-5 Current / non-current classification The Group presents assets and liabilities in the consolidated statement of financial position based on current/non-current classification.
An asset is current when it is: - Expected to be realized or intended to be sold or consumed in the normal operating cycle - Held primarily for the purpose of trading - Expected to be realized within twelve months after the reporting period, or - Cash or cash equivalent unless restricted from being exchanged or used to settle a liability for at least
twelve months after the reporting period
All other assets are classified as non-current.
A liability is current when: - It is expected to be settled in the normal operating cycle - It is held primarily for the purpose of trading - It is due to be settled within twelve months after the reporting period, or - There is no unconditional right to defer the settlement of the liability for at least twelve months after the
reporting period
The Group classifies all other liabilities as non-current. Deferred tax assets and liabilities are classified as non-current assets and liabilities. 2-6 Foreign currency translation The Group’s consolidated financial statements are presented in Korean won, which is also the parent company’s functional currency. For each entity, the Group determines the functional currency and items included in the financial statements of each entity are measured using that functional currency. (1) Transactions and balances Transactions in foreign currencies are initially recorded by the Group’s entities at their respective functional currency spot rates at the date the transaction first qualifies for recognition. Monetary assets and liabilities denominated in foreign currencies are retranslated at the functional currency spot rate of exchange at the reporting date. Differences arising on settlement or translation of monetary items are recognized in profit or loss with the exception of monetary items that are designated as part of the hedge of the Group’s net investment of a foreign operation. These are recognized in OCI until the net investment is disposed of, at which time, the cumulative amount is reclassified to the income statement. Tax charges and credits attributable to exchange differences on those monetary items are also recorded in OCI.
12

Green Cross Coporation and its subsidiaries Notes to the consolidated financial statements December 31, 2016 and 2015
2. Basis of preparation and summary of significant accounting policies (cont’d) 2-6 Foreign currency translation (cont’d) Non-monetary items that are measured in terms of historical cost in a foreign currency are translated using the exchange rates as at the dates of the initial transactions. Non-monetary items measured at fair value in a foreign currency are translated using the exchange rates at the date when the fair value is determined. The gain or loss arising on translation of non-monetary items is treated in line with the recognition of gain or loss on change in fair value of the item (i.e. translation differences on items whose fair value gain or loss is recognized in OCI or profit or loss is also recognized in OCI or profit or loss, respectively). Any goodwill arising on the acquisition of a foreign operation and any fair value adjustments to the carrying amounts of assets and liabilities arising on the acquisition are treated as assets and liabilities of the foreign operation and translated at the spot rate of exchange at the reporting date. (2) Foreign operations On consolidation, the assets and liabilities of foreign operations are translated into Korean won at the rate of exchange prevailing at the reporting date and their income statements are translated at exchange rates prevailing at the dates of the transactions. The exchange differences arising on translation for consolidation are recognized in OCI. On disposal of a foreign operation, the component of OCI relating to that particular foreign operation is recognized in profit or loss. 2-7 Cash and cash equivalents Cash and cash equivalents in the consolidated statement of financial position comprise cash at banks and on hand and short-term deposits with a maturity of three months or less, which represent cash and cash equivalents on the consolidated statements of cash flows.
2-8 Financial instruments: Initial recognition and subsequent measurement A financial instrument is any contract that gives rise to a financial asset of one entity and a financial liability or equity instrument of another entity.
(1) Financial assets (a) Initial recognition and measurement Financial assets within the scope of KIFRS 1039 are classified as financial assets at fair value through profit or loss, loans and receivables, held-to-maturity investments, available-for-sale financial assets, or as derivatives designated as hedging instruments in an effective hedge, as appropriate. All financial assets are recognized initially at fair value plus, in the case of financial assets not recorded at fair value through profit or loss, transaction costs that are attributable to the acquisition of the financial asset. Purchases or sales of financial assets that require delivery of assets within a time frame established by regulation or convention in the market place (regular way trades) are recognized on the trade date, i.e., the date that the Group commits to purchase or sell the asset. (b) Subsequent measurement For purposes of subsequent measurement, financial assets are classified in four categories: • Financial assets at fair value through profit or loss Financial assets at fair value through profit or loss include financial assets held for trading and financial assets designated upon initial recognition at fair value through profit or loss. Financial assets are classified as held for trading if they are acquired for the purpose of selling or repurchasing in the near term. Derivatives, including separated embedded derivatives, are also classified as held for trading unless they are designated as effective hedging instruments as defined by KIFRS 1039. The Group has not designated any financial assets at fair value through profit or loss.
13

Green Cross Coporation and its subsidiaries Notes to the consolidated financial statements December 31, 2016 and 2015
2. Basis of preparation and summary of significant accounting policies (cont’d) 2-8 Financial instruments: Initial recognition and subsequent measurement (cont’d) Derivatives embedded in host contracts are accounted for as separate derivatives and recorded at fair value if their economic characteristics and risks are not closely related to those of the host contracts and the host contracts are not held for trading or designated at fair value though profit or loss. These embedded derivatives are measured at fair value with changes in fair value recognized in profit or loss. Reassessment only occurs if there is a change in the terms of the contract that significantly modifies the cash flows that would otherwise be required. • Loans and receivables Loans and receivables are non-derivative financial assets with fixed or determinable payments that are not quoted in an active market. After initial measurement, such financial assets are subsequently measured at amortized cost using the effective interest rate method (EIR), less impairment. Amortized cost is calculated by taking into account any discount or premium on acquisition and fees or costs that are an integral part of the EIR. The EIR amortization is included in finance income in the consolidated statements of comprehensive income. The losses arising from impairment are recognized in the consolidated statements of comprehensive income in finance costs. • Held-to-maturity investments Non-derivative financial assets with fixed or determinable payments and fixed maturities are classified as held-to-maturity when the Group has the positive intention and ability to hold them to maturity. After initial measurement, held-to-maturity investments are measured at amortized cost using the EIR, less impairment. Amortized cost is calculated by taking into account any discount or premium on acquisition and fees or costs that are an integral part of the EIR. The EIR amortization is included as finance income in the consolidated statements of comprehensive income. • Available-for-sale financial investments Available-for-sale financial investments include equity and debt securities. Equity investments classified as available-for sale are those, which are neither classified as held for trading nor designated at fair value through profit or loss. Debt securities in this category are those which are intended to be held for an indefinite period of time and which may be sold in response to needs for liquidity or in response to changes in the market conditions. After initial measurement, available-for-sale financial investments are subsequently measured at fair value with unrealized gains or losses recognized as OCI in the available-for-sale reserve until the investment is derecognized, at which time the cumulative gain or loss is recognized in other operating income, or the investment is determined to be impaired, at which time the cumulative loss is recognized in the consolidated statement of comprehensive income in finance costs and removed from the available-for-sale reserve. Interest earned whilst holding available-for-sale financial assets is reported as interest income using the EIR method. The Group evaluated its available-for-sale financial assets whether the ability and intention to sell them in the near term is still appropriate. When the Group is unable to trade these financial assets due to inactive markets and management’s intent significantly changes to do so in the foreseeable future, the Group may elect to reclassify these financial assets in rare circumstances. Reclassification to loans and receivables is permitted when the financial asset meets the definition of loans and receivables and has the intent and ability to hold these assets for the foreseeable future or maturity. The reclassification to held-to-maturity is permitted only when the entity has the ability and intent to hold the financial asset until its maturity accordingly. For a financial asset reclassified from the available-for-sale financial assets category, the fair value carrying amount at the date of reclassification becomes its new amortized cost and any previous gain or loss on the asset that has been recognized in equity is amortized to profit or loss over the remaining life of the investment using the EIR. Any difference between the new amortized cost and the maturity amount is also amortized over the remaining life of the asset using the EIR. If the asset is subsequently determined to be impaired, then the amount recorded in equity is reclassified to the consolidated statements of comprehensive income.
14
Green Cross Coporation and its subsidiaries Notes to the consolidated financial statements December 31, 2016 and 2015
2. Basis of preparation and summary of significant accounting policies (cont’d) 2-8 Financial instruments: Initial recognition and subsequent measurement (cont’d) (c) Derecognition A financial asset (or, where applicable, a part of a financial asset or part of a group of similar financial assets) is derecognized when: - The rights to receive cash flows from the asset have expired, or - The Group has transferred its rights to receive cash flows from the asset or has assumed an obligation to
pay the received cash flows in full without material delay to a third party under a ‘pass-through’ arrangement; and either (a) the Group has transferred substantially all the risks and rewards of the asset, or (b) the Group has neither transferred nor retained substantially all the risks and rewards of the asset, but has transferred control of the asset.
When the Group has transferred its rights to receive cash flows from an asset or has entered into a pass-through arrangement, it evaluates if, and to what extent, it has retained the risks and rewards of ownership. When it has neither transferred nor retained substantially all of the risks and rewards of the asset, nor transferred control of the asset, the Group continues to recognize the transferred asset to the extent of the Group’s continuing involvement. In that case, the Group also recognizes an associated liability. The transferred asset and the associated liability are measured on a basis that reflects the rights and obligations that the Group has retained. (2) Impairment of financial assets The Group assesses, at each reporting date, whether there is objective evidence that a financial asset or a group of financial assets is impaired. An impairment exists if one or more events that has occurred since the initial recognition of the asset (an incurred ‘loss event’), has an impact on the estimated future cash flows of the financial asset or the group of financial assets that can be reliably estimated. Evidence of impairment may include indications that the debtors or a group of debtors is experiencing significant financial difficulty, default or delinquency in interest or principal payments, the probability that they will enter bankruptcy or other financial reorganization and observable data indicating that there is a measurable decrease in the estimated future cash flows, such as changes in arrears or economic conditions that correlate with defaults. • Financial assets carried at amortized cost For financial assets carried at amortized cost, the Group first assesses whether impairment exists individually for financial assets that are individually significant, or collectively for financial assets that are not individually significant. If the Group determines that no objective evidence of impairment exists for an individually assessed financial asset, whether significant or not, it includes the asset in a group of financial assets with similar credit risk characteristics and collectively assesses them for impairment. Assets that are individually assessed for impairment and for which an impairment loss is, or continues to be, recognized are not included in a collective assessment of impairment. The amount of any impairment loss identified is measured as the difference between the asset’s carrying amount and the present value of estimated future cash flows (excluding future expected credit losses that have not yet been incurred). The present value of the estimated future cash flows is discounted at the financial asset’s original EIR. The carrying amount of the asset is reduced through the use of an allowance account and the loss is recognized in the consolidated statements of comprehensive income. Interest income (recorded as finance income in the consolidated statements of comprehensive income) continues to be accrued on the reduced carrying amount and is accrued using the rate of interest used to discount the future cash flows for the purpose of measuring the impairment loss. Loans, together with the associated allowance, are written off when there is no realistic prospect of future recovery and all collateral has been realized or has been transferred to the Group. If, in a subsequent year, the amount of the estimated impairment loss increases or decreases because of an event occurring after the impairment was recognized, the previously recognized impairment loss is increased or reduced by adjusting the allowance account. If a write-off is later recovered, the recovery is credited to finance costs in the consolidated statements of comprehensive income.
15
Green Cross Coporation and its subsidiaries Notes to the consolidated financial statements December 31, 2016 and 2015
2. Basis of preparation and summary of significant accounting policies (cont’d) 2-8 Financial instruments: Initial recognition and subsequent measurement (cont’d) • Available-for-sale financial investments For available-for-sale financial investments, the Group assesses, at each reporting date, whether there is objective evidence that an investment or a group of investments is impaired. In the case of equity investments classified as available-for-sale, objective evidence would include a significant or prolonged decline in the fair value of the investment below its cost. ‘Significant’ is evaluated against the original cost of the investment and ‘prolonged’ against the period in which the fair value has been below its original cost. When there is evidence of impairment, the cumulative loss – measured as the difference between the acquisition cost and the current fair value, less any impairment loss on that investment previously recognized in the consolidated statements of comprehensive income – is removed from OCI and recognized in the consolidated statements of comprehensive income. Impairment losses on equity investments are not reversed through profit or loss; increases in their fair value after impairment are recognized in OCI. In the case of debt instruments classified as available-for-sale, impairment is assessed based on the same criteria as financial assets carried at amortized cost. However, the amount recorded for impairment is the cumulative loss measured as the difference between the amortized cost and the current fair value, less any impairment loss on that investment previously recognized in the consolidated statements of comprehensive income. Future interest income continues to be accrued based on the reduced carrying amount of the asset, using the rate of interest used to discount the future cash flows for the purpose of measuring the impairment loss. The interest income is recorded as part of finance income. If, in a subsequent year, the fair value of a debt instrument increases and the increase can be objectively related to an event occurring after the impairment loss was recognized in the consolidated statement of comprehensive income, the impairment loss is reversed through the consolidated statements of comprehensive income. (3) Financial liabilities (a) Initial recognition and measurement Financial liabilities within the scope of KIFRS 1039 are classified at initial recognition, as financial liabilities at fair value through profit or loss, loans and borrowings, payables, or as derivatives designated as hedging instruments in an effective hedge, as appropriate. All financial liabilities are recognized initially at fair value and, in the case of loans and borrowings and payables, net of directly attributable transaction costs. The Group’s financial liabilities include trade and other payables and borrowings. (b) Subsequent measurement The measurement of financial liabilities depends on their classification: • Financial liabilities at fair value through profit or loss Financial liabilities at fair value through profit or loss include financial liabilities held for trading and financial liabilities designated upon initial recognition as at fair value through profit or loss. Financial liabilities are classified as held for trading if they are acquired for the purpose of selling in the near term. This category includes derivative financial instruments entered into by the Group that are not designated as hedging instruments in hedge relationships as defined by KIFRS 1039. Separated embedded derivatives are also classified as held for trading unless they are designated as effective hedging instruments. Gains or losses on liabilities held for trading are recognized in the consolidated statements of comprehensive income. The Group has not designated any financial liabilities upon initial recognition as at fair value through profit or loss.
16

Green Cross Coporation and its subsidiaries Notes to the consolidated financial statements December 31, 2016 and 2015
2. Basis of preparation and summary of significant accounting policies (cont’d) 2-8 Financial instruments: Initial recognition and subsequent measurement (cont’d) • Loans and borrowings After initial recognition, interest-bearing loans and borrowings are subsequently measured at amortized cost using the EIR method. Gains and losses are recognized in the consolidated statements of comprehensive income when the liabilities are derecognized as well as through the EIR amortization process. Amortized cost is calculated by taking into account any discount or premium on acquisition and fees or costs that are an integral part of the EIR. The EIR amortization is included in finance costs in the consolidated statement of comprehensive income. • Financial guarantee contracts Financial guarantee contracts issued by the Group are those contracts that require a payment to be made to reimburse the holder for a loss it incurs because the specified debtor fails to make a payment when due in accordance with the terms of a debt instrument. Financial guarantee contracts are recognized initially as a liability at fair value, adjusted for transaction costs that are directly attributable to the issuance of the guarantee. Subsequently, the liability is measured at the higher of the best estimate of the expenditure required to settle the present obligation at the reporting date and the amount recognized less cumulative amortization. (c) Derecognition A financial liability is derecognized when the obligation under the liability is discharged or cancelled or expires. When an existing financial liability is replaced by another from the same lender on substantially different terms, or the terms of an existing liability are substantially modified, such an exchange or modification is treated as a derecognition of the original liability and the recognition of a new liability. The difference in the respective carrying amounts is recognized in the consolidated statement of comprehensive income. (4) Offsetting of financial instruments Financial assets and financial liabilities are offset and the net amount reported in the consolidated statement of financial position if there is a currently enforceable legal right to offset the recognized amounts and there is an intention to settle on a net basis, or to realize the assets and settle the liabilities simultaneously. 2-9 Fair value measurement The Group measures financial instruments and non-financial assets such as investment properties, at fair value at each balance sheet date. Fair value related disclosures for financial instruments and non-financial assets that are measured at fair value or where fair values are disclosed are summarized in the following notes:
Notes
Disclosure for valuation methods, significant estimates and assumptions 6,34 Quantitative disclosures of fair value measurement hierarchy 34 Investment in unquoted equity shares (discontinued operations) 6 Investment property 11 Financial instruments (including those carried at amortized cost) 34
Fair value is the price that would be received to sell an asset or paid to transfer a liability in an orderly transaction between market participants at the measurement date. The fair value measurement is based on the presumption that the transaction to sell the asset or transfer the liability takes place either:
- In the principal market for the asset or liability, or - In the absence of a principal market, in the most advantageous market for the asset or liability
The principal or the most advantageous market must be accessible by the Group. The fair value of an asset or a liability is measured using the assumptions that market participants would use when pricing the asset or liability, assuming that market participants act in their economic best interest.
17

Green Cross Coporation and its subsidiaries Notes to the consolidated financial statements December 31, 2016 and 2015
2. Basis of preparation and summary of significant accounting policies (cont’d) 2-9 Fair value measurement (cont’d) A fair value measurement of a non-financial asset takes into account a market participant's ability to generate economic benefits by using the asset in its highest and best use or by selling it to another market participant that would use the asset in its highest and best use. The Group uses valuation techniques that are appropriate in the circumstances and for which sufficient data are available to measure fair value, maximizing the use of relevant observable inputs and minimizing the use of unobservable inputs. All assets and liabilities for which fair value is measured or disclosed in the financial statements are categorized within the fair value hierarchy, described as follows, based on the lowest level input that is significant to the fair value measurement as a whole:
- Level 1 — Quoted (unadjusted) market prices in active markets for identical assets or liabilities - Level 2 — Valuation techniques for which the lowest level input that is significant to the fair value
measurement is directly or indirectly observable - Level 3 — Valuation techniques for which the lowest level input that is significant to the fair value
measurement is unobservable For assets and liabilities that are recognized in the financial statements at fair value on a recurring basis, the Group determines whether transfers have occurred between levels in the hierarchy by re-assessing categorization (based on the lowest level input that is significant to the fair value measurement as a whole) at the end of each reporting period.
For the purpose of fair value disclosures, the Group has determined classes of assets and liabilities on the basis of the nature, characteristics and risks of the asset or liability and the level of the fair value hierarchy as explained above.
2-10 Inventories Inventories are valued at the lower of cost and net realizable value. Purchase costs, transfer costs and costs incurred in bringing each product to its present location and conditions are accounted for initial cost of inventories. Unit costs of inventories are measured by total average method, except merchandise-in-transit, whose cost is determined using the specific identification method, and raw materials and supplies, whose cost is determined using the weighted-average basis method. Net realizable value is the estimated selling price in the ordinary course of business, less estimated costs of completion and the estimated costs necessary to make the sale. 2-11 Property, plant and equipment Property, plant and equipment are stated at cost, net of accumulated depreciation and accumulated impairment losses, if any. Such cost includes the cost of replacing part of the property, plant and equipment and borrowing costs for long-term construction projects if the recognition criteria are met. When significant parts of property, plant and equipment are required to be replaced at intervals, the Group recognizes such parts as individual assets with specific useful lives and depreciates them accordingly. Likewise, when a major inspection is performed, its cost is recognized in the carrying amount of the plant and equipment as a replacement if the recognition criteria are satisfied. All other repair and maintenance costs are recognized in profit or loss as incurred.
Depreciation of property, plant and equipment is provided using the straight-line method over the estimated useful life of the assets as follows: Years Buildings 43 – 50 Structures 21 – 25 Machinery 5 – 12 Other tangible assets 3 – 11
18

Green Cross Coporation and its subsidiaries Notes to the consolidated financial statements December 31, 2016 and 2015
2. Basis of preparation and summary of significant accounting policies (cont’d) 2-11 Property, plant and equipment (cont’d) An item of property, plant and equipment and any significant part initially recognized are derecognized upon disposal or when no future economic benefits are expected from its use or disposal. Any gain or loss arising on derecognition of the asset (calculated as the difference between the net disposal proceeds and the carrying amount of the asset) is included in the income statement when the asset is derecognized. The residual values, useful lives and methods of depreciation of property, plant and equipment are reviewed at each financial year end and adjusted prospectively, if appropriate. 2-12 Investment property Investment properties are measured initially at cost, including transaction costs. Subsequent to initial recognition, investment properties are stated at fair value, which reflects market conditions at the reporting date. Gains or losses arising from changes in the fair values of investment properties are included in profit or loss in the period in which they arise.
Investment properties are derecognized either when they have been disposed of or when they are permanently withdrawn from use and no future economic benefit is expected from their disposal. The difference between the net disposal proceeds and the carrying amount of the asset is recognized in the income statement in the period of derecognition.
Transfers are made to (or from) investment property only when there is a change in use. For a transfer from investment property to owner-occupied property, the deemed cost for subsequent accounting is the fair value at the date of change in use. If owner-occupied property becomes an investment property, the Group accounts for such property in accordance with the policy stated under property, plant and equipment up to the date of change in use. 2-13 Leases The determination of whether an arrangement is (or contains) a lease is based on the substance of the arrangement at the inception date. The arrangement is assessed for (i) whether fulfilment of the arrangement is dependent on the use of a specific asset or assets and (ii) the arrangement conveys a right to use the asset or assets, even if that right is not explicitly specified in an arrangement. A lease is classified at the inception date as a finance lease or an operating lease. A lease that transfers substantially all the risks and rewards incidental to ownership to the Group is classified as a finance lease. Finance leases are capitalized at the commencement of the lease at the inception date at fair value of the leased property or, if lower, at the present value of the minimum lease payments. Lease payments are apportioned between finance charges and reduction of the lease liability so as to achieve a constant rate of interest on the remaining balance of the liability. Finance charges are recognized in finance costs in the consolidated statement of profit or loss. A leased asset is depreciated over the useful life of the asset. However, if there is no reasonable certainty that the Group will obtain ownership by the end of the lease term, the asset is depreciated over the shorter of the estimated useful life of the asset and the lease term. An operating lease is a lease other than a finance lease. Operating lease payments are recognized as an operating expense in the consolidated statement of profit or loss on a straight-line basis over the lease term. 2-14 Borrowing costs Borrowing costs directly attributable to the acquisition, construction or production of an asset that necessarily takes a substantial period of time to get ready for its intended use or sale are capitalized as part of the cost of the respective assets. All other borrowing costs are expensed in the period they occur.
19

Green Cross Coporation and its subsidiaries Notes to the consolidated financial statements December 31, 2016 and 2015
2. Basis of preparation and summary of significant accounting policies (cont’d) 2-15 Intangible assets Intangible assets acquired separately are measured on initial recognition at cost. The cost of intangible assets acquired in a business combination is its fair value at the date of acquisition. Following initial recognition, intangible assets are carried at cost less any accumulated amortization and any accumulated impairment losses. Internally generated intangible assets, excluding capitalized development costs, are not capitalized and the related expenditure is reflected in the consolidated statement of comprehensive income in the year in which the expenditure is incurred.
The useful lives of intangible assets are assessed as either finite or indefinite. Intangible assets with finite lives are amortized over the useful economic life and assessed for impairment whenever there is an indication that the intangible asset may be impaired. The amortization period and the amortization method for an intangible asset with a finite useful life are reviewed at least at each financial year end. Changes in the expected useful life or the expected pattern of consumption of future economic benefits embodied in the asset are accounted for by changing the amortization period or method, as appropriate, and are treated as changes in accounting estimates. The amortization expense on intangible assets with finite lives is recognized in the consolidated statement of comprehensive income in the expense category consistent with the function of the intangible asset.
Intangible assets with indefinite useful lives are not amortized, but are tested for impairment annually, either individually or at the cash-generating unit level. The assessment of indefinite life is reviewed annually to determine whether the indefinite life continues to be supportable. If not, the change in useful life from indefinite to finite is made on a prospective basis.
Gains or losses arising from derecognition of an intangible asset are measured as the difference between the net disposal proceeds and the carrying amount of the asset and are recognized in the consolidated statements of comprehensive income when the asset is derecognized.
Research costs are expensed as incurred. Development expenditures on an individual project are recognized as an intangible asset when the Group can demonstrate:
- The technical feasibility of completing the intangible asset so that it will be available for use or sale - Its intention to complete and its ability to use or sell the asset - How the asset will generate future economic benefits - The availability of resources to complete the asset - The ability to measure reliably the expenditure during development
Following initial recognition of the development expenditure as an asset, the asset is carried at cost less any accumulated amortization and accumulated impairment losses. Amortization of the asset begins when development is complete and the asset is available for use. It is amortized over the period of expected future benefit. During the period of development, the asset is tested for impairment annually. The intangible assets, of which the residual values are zero ("0"), are amortized on a straight-line basis over useful lives as follows. However, some intangible assets are not amortized because the useful lives of the intangible assets cannot be estimated and the useful lives are deemed to be indefinite.
Years Development costs 5 – 10 Industrial property rights 10 Other intangible assets 5 – 20
20

Green Cross Coporation and its subsidiaries Notes to the consolidated financial statements December 31, 2016 and 2015
2. Basis of preparation and summary of significant accounting policies (cont’d) 2-16 Impairment of non-financial assets The Group assesses, at each reporting date, whether there is an indication that an asset may be impaired. If any indication exists, or when annual impairment testing for an asset is required, the Group estimates the asset’s recoverable amount. An asset’s recoverable amount is the higher of an asset’s or cash-generating unit’s (CGU) fair value less costs of disposal and its value in use. The recoverable amount is determined for an individual asset, unless the asset does not generate cash inflows that are largely independent of those from other assets or groups of assets. When the carrying amount of an asset or CGU exceeds its recoverable amount, the asset is considered impaired and is written down to its recoverable amount.
In assessing value in use, the estimated future cash flows are discounted to their present value using a pre-tax discount rate that reflects current market assessments of the time value of money and the risks specific to the asset. In determining fair value less costs of disposal, recent market transactions are taken into account. If no such transactions can be identified, an appropriate valuation model is used. These calculations are corroborated by valuation multiples, quoted share prices for publicly traded companies or other available fair value indicators.
The Group bases its impairment calculation on detailed budgets and forecast calculations, which are prepared separately for each of the Group’s CGUs to which the individual assets are allocated. These budgets and forecast calculations generally cover a period of five years. For longer periods, a long-term growth rate is calculated and applied to project future cash flows after the fifth year.
Impairment losses of continuing operations are recognized in the consolidated statements of comprehensive income in expense categories consistent with the function of the impaired asset, except for property previously revalued with the revaluation taken to OCI. In this case, the impairment is also recognized in OCI up to the amount of any previous revaluation.
For assets excluding goodwill, an assessment is made at each reporting date to determine whether there is an indication that previously recognized impairment losses no longer exist or have decreased. If such indication exists, the Group estimates the asset’s or CGU’s recoverable amount. A previously recognized impairment loss is reversed only if there has been a change in the assumptions used to determine the asset’s recoverable amount since the last impairment loss was recognized. The reversal is limited so that the carrying amount of the asset does not exceed its recoverable amount, nor exceed the carrying amount that would have been determined, net of depreciation, had no impairment loss been recognized for the asset in prior years. Such reversal is recognized in the consolidated statement of profit or loss unless the asset is carried at a revalued amount, in which case, the reversal is treated as a revaluation increase.
The following criteria are also applied in assessing impairment of specific assets: • Goodwill Goodwill is tested for impairment annually (as at December 31) and when circumstances indicate that the carrying value may be impaired. Impairment is determined for goodwill by assessing the recoverable amount of each CGU (or group of CGUs) to which the goodwill relates. When the recoverable amount of the CGU is less than its carrying amount, an impairment loss is recognized. Impairment losses relating to goodwill cannot be reversed in future periods.
• Intangible assets Intangible assets with indefinite useful lives are tested for impairment annually as at December 31 either individually or at the CGU level, as appropriate, and when circumstances indicate that the carrying value may be impaired.
21

Green Cross Coporation and its subsidiaries Notes to the consolidated financial statements December 31, 2016 and 2015
2. Basis of preparation and summary of significant accounting policies (cont’d) 2-17 Provisions Provisions are recognized when the Group has a present obligation (legal or constructive) as a result of a past event, it is probable that an outflow of resources embodying economic benefits will be required to settle the obligation and a reliable estimate can be made of the amount of the obligation. When the Group expects some or all of a provision to be reimbursed, for example, under an insurance contract, the reimbursement is recognized as separate asset, but only when the reimbursement is virtually certain. The expense relating to a provision is presented in the consolidated statements of comprehensive income net of any reimbursement. The Group accrues provision for warranty corresponding to the estimated costs of future repairs and returns, based on the past experience. The provision for product warranties is charged to selling and administrative expenses when the goods covered by warranties are sold to customers. If the effect of the time value of money is material, provisions are discounted using a current pre-tax rate that reflects, when appropriate, the risks specific to the liability. When discounting is used, the increase in the provision due to the passage of time is recognized as a finance cost. The initial estimates for provisons are revised annually and accrued at the end of each reporting period based on the latest estimates. A previously recognized provision is reversed when the possibility of the outflow of resources embodying economic benefits is no longer required to settle the obligation. Such reversal is recognized in the consolidated statement of comprehensive income. When discounting is used, the increase in the provision due to the passage of time is recognized as borrowing costs. 2-18 Pension benefits The Group operates a defined benefit pension plan in Korea, and the cost of providing benefits under the defined benefit plan is determined using the projected unit credit method. Re-measurements, comprising of actuarial gains and losses, the effect of the asset ceiling, excluding net interest (not applicable to the Group) and the return on plan assets (excluding net interest), are recognized immediately in the consolidated statement of financial position with a corresponding debit or credit to retained earnings through OCI in the period in which they occur. Re-measurements are not reclassified to profit or loss in subsequent periods.
Past service costs are recognized in profit or loss on the earlier of: - The date of the plan amendment or curtailment, and - The date that the Group recognizes restructuring-related costs
Net interest is calculated by applying the discount rate to the net defined benefit liability or asset. The Group recognizes the following changes in the net defined benefit obligation under ‘cost of sales’ and ‘selling and administrative expenses’ in the consolidated statements of comprehensive income: - Service costs comporising current service costs, past-service costs, gains and losses on curtailments and
non-routine settlements - Net interest expense or income
2-19 Treasury shares Own equity instruments which are reacquired (treasury shares) are recognized at cost and deducted from equity. No gain or loss is recognized in the consolidated statement of comprehensive income on the purchase, sale, issue or cancellation of the Group’s own equity instruments. Any difference between the carrying amount and the consideration is recognized in other capital reserves.
22

Green Cross Coporation and its subsidiaries Notes to the consolidated financial statements December 31, 2016 and 2015
2. Basis of preparation and summary of significant accounting policies (cont’d) 2-20 Revenue recognition Revenue is recognized to the extent that it is probable that economic benefits will flow to the Group and the revenue can be reliably measured, regardless of when the payment is being made. Revenue is measured at the fair value of the consideration received or receivable, taking into account contractually defined terms of payment and excluding taxes or duty. The Group has concluded that it is the principal in all of its revenue arrangements since it is the primary obligor in all the revenue arrangements, has pricing latitude and is also exposed to inventory and credit risks.
The specific recognition criteria described below must also be met before revenue is recognized: (1) Sale of goods Revenue from sale of goods is recognized when the significant risks and rewards of ownership of the goods have passed to the buyer, usually on delivery of the goods. (2) Interest income For all financial instruments measured at amortized cost and interest-bearing financial assets classified as available-for-sale, interest income is recorded using the EIR. The EIR is the rate that exactly discounts the estimated future cash payments or receipts over the expected life of the financial instrument or a shorter period, where appropriate, to the net carrying amount of the financial asset or liability. Interest income is included in finance income in the consolidated statements of comprehensive income. (3) Dividends Revenue is recognized when the Group’s right to receive the payment is established, which is generally when shareholders approve the dividend. (4) Construction contracts If the Group reliably estimates the income and cost of a construction contract, it recognizes the income and cost of the contract on a percentage-of-completion basis at the end of each reporting period. The Group determines the percentage-of-completion of a construction contract by using a reliable measurement method. If the result of the construction contract is not reliably estimated, an income is recognized within a range of recoverable contract costs, and a contractual expense is recognized as an expense when it is incurred. If losses from construction contracts are expected (in the case that total contractual cost is likely to exceed total contractual income), the expected losses are immediately recognized as expenses. (5) Other revenue The Group recognizes revenue when amount of revenue is earned, can be reliably measured, and it is probable that future economic benefits will flow to the Group. 2-21 Taxes (1) Current income tax Current income tax assets and liabilities for the current and prior periods are measured at the amount expected to be recovered from or paid to the taxation authorities. The tax rates and tax laws used to compute the amount are those that are enacted or substantively enacted at the reporting date in the countries where the Group operates and generates taxable income. Current income tax relating to items recognized directly in equity is recognized in equity and not in the consolidated statement of comprehensive income. Management periodically evaluates positions taken in the tax returns with respect to situations, in which applicable tax regulations are subject to interpretation, and establishes provisions where appropriate.
23

Green Cross Coporation and its subsidiaries Notes to the consolidated financial statements December 31, 2016 and 2015
2. Basis of preparation and summary of significant accounting policies (cont’d) 2-21 Taxes (cont’d) (2) Deferred tax Deferred tax is provided using the liability method on temporary differences between the tax bases of assets and liabilities and their carrying amounts for financial reporting purposes at the reporting date. Deferred tax liabilities are recognized for all taxable temporary differences, except: - When the deferred tax liability arises from the initial recognition of goodwill - When the deferred tax liability arises from the initial recognition of an asset or liability in a transaction that is
not a business combination and, at the time of the transaction, affects neither the accounting profit nor taxable profit or loss
- In respect of taxable temporary differences associated with investments in subsidiaries, associates and interests in joint arrangements, where the timing of the reversal of the temporary differences can be controlled and it is probable that the temporary differences will not reverse in the foreseeable future
Deferred tax assets are recognized for all deductible temporary differences, the carry forward of unused tax credits and unused tax losses, to the extent that it is probable that taxable profit will be available against which the deductible temporary differences, and the carry forward of unused tax credits and unused tax losses can be utilized except: - When the deferred tax asset relating to the deductible temporary difference arises from the initial recognition
of an asset or liability in a transaction that is not a business combination and, at the time of the transaction, affects neither the accounting profit nor taxable profit or loss
- In respect of deductible temporary differences associated with investments in subsidiaries, associates and interests in joint arrangements, deferred tax assets are recognized only to the extent that it is probable that the temporary differences will reverse in the foreseeable future and taxable profit will be available against which the temporary differences can be utilized
The carrying amount of deferred tax assets is reviewed at each reporting date and reduced to the extent that it is no longer probable that sufficient taxable profit will be available to allow all or part of the deferred tax asset to be utilized. Unrecognized deferred tax assets are reassessed at each reporting date and are recognized to the extent that it has become probable that future taxable profits will allow the deferred tax asset to be recovered. Deferred tax assets and liabilities are measured at the tax rates that are expected to apply in the year when the asset is realized or the liability is settled, based on tax rates (and tax laws) that have been enacted or substantively enacted at the reporting date. Deferred tax relating to items recognized outside profit or loss is recognized outside profit or loss. Deferred tax items are recognized in correlation to the underlying transaction either in OCI or directly in equity. Deferred tax assets and deferred tax liabilities are offset, if a legally enforceable right exists to set off current tax assets against current income tax liabilities and the deferred taxes relate to the same taxable entity and the same taxation authority.
2-22 Government grants Government grants are recognized where there is reasonable assurance that the grant will be received and all attached conditions will be complied with. Government grants, which are used for the acquisition of certain assets, are accounted for as a deduction from the acquisition cost of the acquired assets. Such grants amount is offset against the depreciation or amortization of the acquired assets during such assets’ useful lives.
24

Green Cross Coporation and its subsidiaries Notes to the consolidated financial statements December 31, 2016 and 2015
2. Basis of preparation and summary of significant accounting policies (cont’d) 2-23 New and amended standards and interpretations The Group applied for the first time certain standards and amendments, which are effective for annual periods beginning on or after January 1, 2016. The nature and the impact of each new standard and amendment are described below: Amendments to KIFRS 1016 and KIFRS 1038 Clarification of Acceptable Methods of Depreciation and Amortisation The amendments clarify the principle in KIFRS 1016 Property, Plant and Equipment and KIFRS 1038 Intangible Assets that revenue reflects a pattern of economic benefits that are generated from operating a business (of which the asset is a part) rather than the economic benefits that are consumed through use of the asset. As a result, a revenue-based method cannot be used to depreciate property, plant and equipment and may only be used in very limited circumstances to amortise intangible assets. The amendments are applied prospectively and do not have any impact on the Group, given that it has not used a revenue-based method to depreciate its non-current assets. Annual Improvements 2012-2014 Cycle These amendments do not have any impact on the Group’s consolidated financial statements. The improvements include: • KIFRS 1105 Non-current Assets Held for Sale and Discontinued Operations Non-current assets (or disposal groups) are generally disposed of either through sale or distribution to the owners. The amendment clarifies that changing from one of these disposal methods to the other would not be considered a new plan of disposal, rather it is a continuation of the original plan. There is, therefore, no interruption of the application of the requirements in KIFRS 1105. This amendment is applied prospectively. • KIFRS 1107 Financial Instruments: Disclosures (i) Servicing contracts The amendment clarifies that a servicing contract that includes a fee can constitute continuing involvement in a financial asset. An entity must assess the nature of the fee and the arrangement against the guidance for continuing involvement in KIFRS 1107 in order to assess whether the disclosures are required. The assessment of which servicing contracts constitute continuing involvement must be made retrospectively. However, the required disclosures need not be provided for any period beginning before the annual period in which the entity first applies the amendments. (ii) Applicability of the amendments to KIFRS 1107 to condensed interim financial statements The amendment clarifies that the offsetting disclosure requirements do not apply to condensed interim financial statements, unless such disclosures provide a significant update to the information reported in the most recent annual report. This amendment is applied retrospectively. • KIFRS 1019 Employee Benefits The amendment clarifies that market depth of high quality corporate bonds is assessed based on the currency in which the obligation is denominated, rather than the country where the obligation is located. When there is no deep market for high quality corporate bonds in that currency, government bond rates must be used. This amendment is applied prospectively. • KIFRS 1034 Interim Financial Reporting The amendment clarifies that the required interim disclosures must either be in the interim financial statements or incorporated by cross-reference between the interim financial statements and wherever they are included within the interim financial report (e.g., in the management commentary or risk report). The other information within the interim financial report must be available to users on the same terms as the interim financial statements and at the same time. This amendment is applied retrospectively.
25

Green Cross Coporation and its subsidiaries Notes to the consolidated financial statements December 31, 2016 and 2015
2. Basis of preparation and summary of significant accounting policies (cont’d) 2-23 New and amended standards and interpretations (cont’d) Amendments to KIFRS 1001 Disclosure Initiative The amendments to KIFRS 1001 clarify, rather than significantly change, existing KIFRS 1001 requirements. The amendments clarify: - The materiality requirements in KIFRS 1001 - That specific line items in the statement(s) of profit or loss and OCI and the statement of financial position
may be disaggregated - That entities have flexibility as to the order in which they present the notes to financial statements - That the share of OCI of associates and joint ventures accounted for using the equity method must be
presented in aggregate as a single line item, and classified between those items that will or will not be subsequently reclassified to profit or loss
Furthermore, the amendments clarify the requirements that apply when additional subtotals are presented in the statement of financial position and the statement(s) of profit or loss and OCI. These amendments do not have any impact on the Group. Amendments to KIFRS 1110, KIFRS 1112: Applying the Consolidation Exception The amendments address issues that have arisen in applying the investment entities exception under KIFRS 1110 Consolidated Financial Statements. The amendments to KIFRS 1110 clarify that the exemption from presenting consolidated financial statements applies to a parent entity that is a subsidiary of an investment entity, when the investment entity measures all of its subsidiaries at fair value. Furthermore, the amendments to KIFRS 1110 clarify that only a subsidiary of an investment entity that is not an investment entity itself and that provides support services to the investment entity is consolidated. All other subsidiaries of an investment entity are measured at fair value. The amendments to KIFRS 1028 Investments in Associates and Joint Ventures allow the investor, when applying the equity method, to retain the fair value measurement applied by the investment entity associate or joint venture to its interests in subsidiaries. These amendments do not have any impact on the Group.
The amendments require additional disclosures of information on construction contracts when the percentage of work completed is measured based on the ratio of the total costs incurred to date to the total estimated contract costs, and the contract revenue exceeds 5% of the preceding year’s total revenue. The amendments are effective for annual periods beginning on or after 1 January 2016, and require prospective application in the year in which an entity adopts it for the first time. These amendments are not relevant for the Group as it did not enter into any construction contract during the current period. 2-24 Significant accounting judgements, estimates and assumptions The preparation of the Group’s consolidated financial statements requires management to make judgments, estimates and assumptions that affect the reported amounts of revenues, expenses, assets and liabilities, and the accompanying disclosures, and the disclosure of contingent liabilities. Uncertainty about these assumptions and estimates could result in outcomes that require a material adjustment to the carrying amount of assets or liabilities affected in future periods.
Other disclosures relating to the Group’s exposure to risks and uncertainties includes:
Note Capital management 33 Financial risk management and policies 33 Sensitivity analysis and disclosure 33
KIFRS 1011 Construction Contract and KIFRS 2115 Agreements for the Construction of Real Estate
26

Green Cross Coporation and its subsidiaries Notes to the consolidated financial statements December 31, 2016 and 2015
2. Basis of preparation and summary of significant accounting policies (cont’d) 2-24 Significant accounting judgements, estimates and assumptions (cont’d) (1) Accounting assumptions and changes The key assumptions concerning the future and other key sources of estimation uncertainty at the reporting date, that have a significant risk of causing a material adjustments to the carrying amounts of assets and liabilities within the next financial year, are descdribed below. The Group based its assumptions and estimates on parameters available when the consolidated financial statements were prepared. Existing circumstances and assumptions about future developments, however, may change due to market changes or circumstances arising beyond control of the Group. Such changes are reflected in the assumptions when they occur. • Impairment of non-financial assets The Group assesses, at each reporting date, whether there is an indication that a non-financial asset may be impaired. Annual impairment testing for goodwill and intangible assets with indefined useful lives are required. Impairment testing for other non-financial assets is performed, when there is an indication that the carrying value of assets exceeds its recoverable amount. In determining a value in use, management estimates future cash flows to be derived from the asset or CGU, and applies the appropriate discount rate to those future cash flows.
• Pension benefits The cost of defined benefit pension plans and the present value of the pension obligation are determined using actuarial valuations. An actuarial valuation involves making various assumptions. These include the determination of the discount rate, future salary increases, mortality rates and future pension increases. Due to the complexity of the valuation, the underlying assumptions and its long-term nature, a defined benefit obligation is highly sensitive to changes in these assumptions. All assumptions are reviewed at each reporting date. • Fair value measurement of contingent consideration The contingent consideration in a business combination shall be measured at the acquisition date at fair value. If the contingent consideration meets the definition of a derivative and classifies as financial liabilities, it shall be measured at fair value at each reporting date. The fair value shall be measured based on the discount cash flow(DCF) model and the major assumptions are reviewd at the end of each reporting period. • Fair value of financial instruments When the fair values of financial assets and financial liabilities recorded in the consolidated statement of financial position cannot be measured based on quoted prices in active markets, their fair value is measured using valuation techniques including the DCF model. The inputs to these models are taken from observable markets where possible, but where this is not feasible, a degree of judgment is required in establishing fair values. Judgments include considerations of inputs such as liquidity risk, credit risk and volatility. Changes in assumptions about these factors could affect the reported fair value of financial instruments. • Development costs Development costs are capitalized in accordance with the accounting policies as mentioned in Note 2-15. Initial capitalization of costs is based on management’s judgment that technological and economic feasibility is confirmed. In determining the amounts to be capitalized, management makes assumptions regarding the expected future cash generation of the project, discount rates to be applied and the expected period of benefits. • Provisions As described in Note 2-17 ‘Provisions’, the Group recognized a provision for sales returns by estimating an outflow of resources embodying economic benefits reasonably. The management believed that valuation methods and assumptions used to estimate the provision were appropriate.
27

Green Cross Coporation and its subsidiaries Notes to the consolidated financial statements December 31, 2016 and 2015
2. Basis of preparation and summary of significant accounting policies (cont’d) 2-24 Significant accounting judgements, estimates and assumptions (cont’d) (2) Judgments • Consolidation of entities in which the Group holds less than a majority of voting right The Company considers that it controls Green Cross LabCell Co., Ltd., Green Cross Medical Science Co., Ltd., and Green Cross Wellbeing Co., Ltd. even though it owns less than 50% of the voting rights of those entities: the Company owns 38.66% equity interest in Green Cross LabCell Co., Ltd., 42.10% equity interest in Green Cross Medical Science Co., Ltd., and 31.83% equity interest in Green Cross Wellbeing Co., Ltd. The Company is the largest shareholder of the entities, and the remaining equity shares are widely held by many other shareholders. Since the date of acquisition of the entity, there has been no history of the other shareholders collaborating to exercise their votes collectively or to outvote the Group. Under the contract with Green Cross Holdings Corporation who is the largest shareholder of the Company, Green Cross Holdings Corporation delegated 16.93% of voting rights to the Company. 2-25 Standards issued but not yet effective The standards and interpretations that are issued, but not yet effective, up to the date of issuance of the Group’s financial statements are disclosed below. The Group intends to adopt these standards, if applicable, when they become effective. (1) KIFRS 1109 Financial Instruments The KASB issued the final version of KIFRS 1109 Financial Instruments that replaces KIFRS 1039 Financial Instruments: Recognition and Measurement and all previous versions. KIFRS 1109 brings together all three aspects of the accounting for financial instruments project: classification and measurement, impairment and hedge accounting. KIFRS 1109 is effective for annual periods beginning on or after January 1, 2018, with early application permitted. Except for hedge accounting, retrospective application is required but providing comparative information is not compulsory. For hedge accounting, the requirements are generally applied prospectively, with some limited exceptions. The Group plans to adopt the new standard on the required effective date. The impact on its consolidated financial statements is as follows: Classification and measurement of financial assets If the new KIFRS 1109 is applied, the Group will classify financial assets as subsequently measured at amortized cost, fair value through other comprehensive income or fair value through profit or loss on the basis of both:
1) The Group’s business model for managing the financial assets, and 2) The contractual cash flow characteristics of the financial assets
For hybrid contracts with financial asset hosts, embedded derivatives are not separated and financial assets are classified in their entirety.
Business model Principal and interest cash flows Estimated useful livesCollection of contractual cash flows Amortised cost (*1)
Fair value through profit or loss
(*2)
Collection and sale of contractual cash flows
Fair value through other comprehensive income
Sale and others Fair value through profit or loss (*1) In order to reduce or eliminate an accounting mismatch, the Group may make an irrevocable election to designate assets into fair value measurement at profit or loss. (*2) For equity instruments other than held-for-trading assets, the Group may make an irrevocable election to designate assets into fair value measurement at other comprehensive income. The requirements for classifying the financial assets as measured at amortized cost or fair value through other comprehensive income under KIFRS 1109, are more stringent than the requirements of the current KIFRS 1039; as a result, the proportion of financial assets subject to fair value measurement at profit or loss may increase upon adoption of KIFRS 1109. As at December 31, 2016, the Group has loans and receivables of \470,322 million and available-for-sale financial assets of \26,078 million.
28
Green Cross Coporation and its subsidiaries Notes to the consolidated financial statements December 31, 2016 and 2015
2. Basis of preparation and summary of significant accounting policies (cont’d) 2-25 Standards issued but not yet effective (cont’d) Classification and measurement of financial liabilities Based on the new KIFRS 1109, changes in the fair value of a financial liability designated as measured at FVTPL that arise from changes in the liability’s credit risk are presented in other comprehensive income, instead of profit or loss. The changes in the liability’s credit risk are recognized in profit or loss if the changes create or enlarge an accounting mismatch had it been presented in other comprehensive income. Some of the changes in the fair value of financial liabilities designated as at FVTPL, which were recognized in profit or loss under the current KIFRS 1039, are presented in other comprehensive income; therefore, gains and losses on valuation of financial liabilities may decrease. (2) KIFRS 1115 Revenue from Contracts with Customers Under KIFRS 1115, revenue is recognized at an amount that reflects the consideration to which an entity expects to be entitled in exchange for transferring goods or services to a customer. The new revenue standard will supersede all current revenue recognition requirements under KIFRS. Either a full retrospective application or a modified retrospective application is required for annual periods beginning on or after January 1, 2018. Early adoption is permitted. The Group plans to adopt the new standard on the required effective date using the full retrospective method. (3) Amendments to KIFRS 1110 and KIFRS 1028: Sale or Contribution of Assets between an Investor and its Associate or Joint Venture The amendments address the conflict between KIFRS 1110 and KIFRS 1028 in dealing with the loss of control of a subsidiary that is sold or contributed to an associate or joint venture. The amendments clarify that the gain or loss resulting from the sale or contribution of assets that constitute a business, as defined in KIFRS 1103, between an investor and its associate or joint venture, is recognized in full. Any gain or loss resulting from the sale or contribution of assets that do not constitute a business, however, is recognized only to the extent of unrelated investors’ interests in the associate or joint venture. The IASB has deferred the effective date of these amendments indefinitely, but an entity that early adopts the amendments must apply them prospectively. These amendments are not expected to have any impact on the Group. (4) Amendments to KIFRS 1007 Statement of Cash Flows: Disclosure Initiative The amendments to KIFRS 1007 Statement of Cash Flows are part of the IASB’s Disclosure Initiative and require an entity to provide disclosures that enable users of financial statements to evaluate changes in liabilities arising from financing activities, including both changes arising from cash flows and non-cash changes. On initial application of the amendment, entities are not required to provide comparative information for preceding periods. These amendments are effective for annual periods beginning on or after 1 January 2017, with early application permitted. Application of the amendments will result in additional disclosures provided by the Group. (5) Amendments to KIFRS 1012 Recognition of Deferred Tax Assets for Unrealised Losses The amendments clarify that an entity needs to consider whether tax law restricts the sources of taxable profits against which it may make deductions on the reversal of that deductible temporary difference. Furthermore, the amendments provide guidance on how an entity should determine future taxable profits and explain the circumstances in which taxable profit may include the recovery of some assets for more than their carrying amount. Entities are required to apply the amendments retrospectively. However, on initial application of the amendments, the change in the opening equity of the earliest comparative period may be recognized in the opening retained earnings (or in another component of equity, as appropriate), without allocating the change between opening retained earnings and other components of equity. Entities applying this relief must disclose that fact. These amendments are effective for annual periods beginning on or after 1 January 2017 with early application permitted. If an entity applies the amendments for an earlier period, it must disclose that fact. These amendments are not expected to have any impact on the Group.
29

Green Cross Coporation and its subsidiaries Notes to the consolidated financial statements December 31, 2016 and 2015
2. Basis of preparation and summary of significant accounting policies (cont’d) 2-26 Restatement The Group reclassified withholding deposits and withholdings for certain research and development from trade and other payables to other current liabilities in 2016. This reclassification had no impacts on its financial position and performance in 2016 and 2015. In addition, the comparative statement of financial position as at December 31, 2015 was restated to reflect the Group’s current practice. 2-27 Approval of the financial statements The consolidated financial statements of the Group for the year ended December 31, 2016 were approved by the Board of Directors’ meeting on Feburary 2, 2017 for submission to the general shareholders’ meeting. 3. Operating segment information The Group has 7 reprtable segments, which represent business units. The business units provide different products and services, use different technology and marketing strategies and are separately operated and managed. For management purposes, the business units are determined based on their goods and services, and the 7 reportable operating segments are as follows:
Principal operation Green Cross Corp. Manufacture and sale of pharmaceuticals
Green Cross Medical Science Co., Ltd. Manufacture of diagnostic reagents
Green Cross Wellbeing Co., Ltd. Manufacture and sale of pharmaceuticals
Green Cross LabCell Co., Ltd. Blood diagnostics
Invac Pharm Corp. Farming
Green Cross Genome Co., Ltd. Gene analysis
Green Cross Medis Corp. Manufacture of blood glucose monitoring devices
The following table presents sales information by reportable segment for the years ended December 31, 2016 and 2015 (Korean won in millions):
2016 2015
Sales
Operatingprofit
Profit for theyear Sales
Operating profit
Profit for theyear
Green Cross Corp. ₩ 1,033,114 ₩ 69,392 ₩ 62,903 ₩ 912,911 ₩ 84,905 ₩110,601Green Cross Medical Science Co., Ltd.
86,163 (945) (2,047) 89,301 1,627 695
Green Cross HS Co., Ltd. - - - 7,527 (738) (727)
Green Cross Wellbeing Co., Ltd. 36,651 4,585 3,597 7,875 299 512
Green Cross LabCell Co., Ltd. 42,419 1,998 2,328 34,489 3,220 2,260
Invac Pharm Corp. 16,310 1,872 1,399 14,923 1,535 1,258
Green Cross Genome Co., Ltd. 5,144 378 354 2,533 (1,112) (1,120)
Green Cross Medis Corp. 6,581 (1,027) (1,015) 5,933 (45) 5
GCAM (*1) - - - 9,257 (169) (448)
1,226,382 76,253 67,519 1,084,749 89,522 113,036
Consolidation adjustments (28,478) 2,199 (2,367) (36,937) 2,158 (17,349)
Consolidated financial position ₩ 1,197,904 ₩ 78,452 ₩ 65,152 ₩ 1,047,812 ₩ 91,680 ₩ 95,687
(*1) The Company’s equity interest decreased as third parties participated in a public capital increase of Green Cross America Inc.(“GCAM”) in 2015, and accordingly, an investment in GCAM was reclassified from investment in a subsidiary to investment in an associate.
30
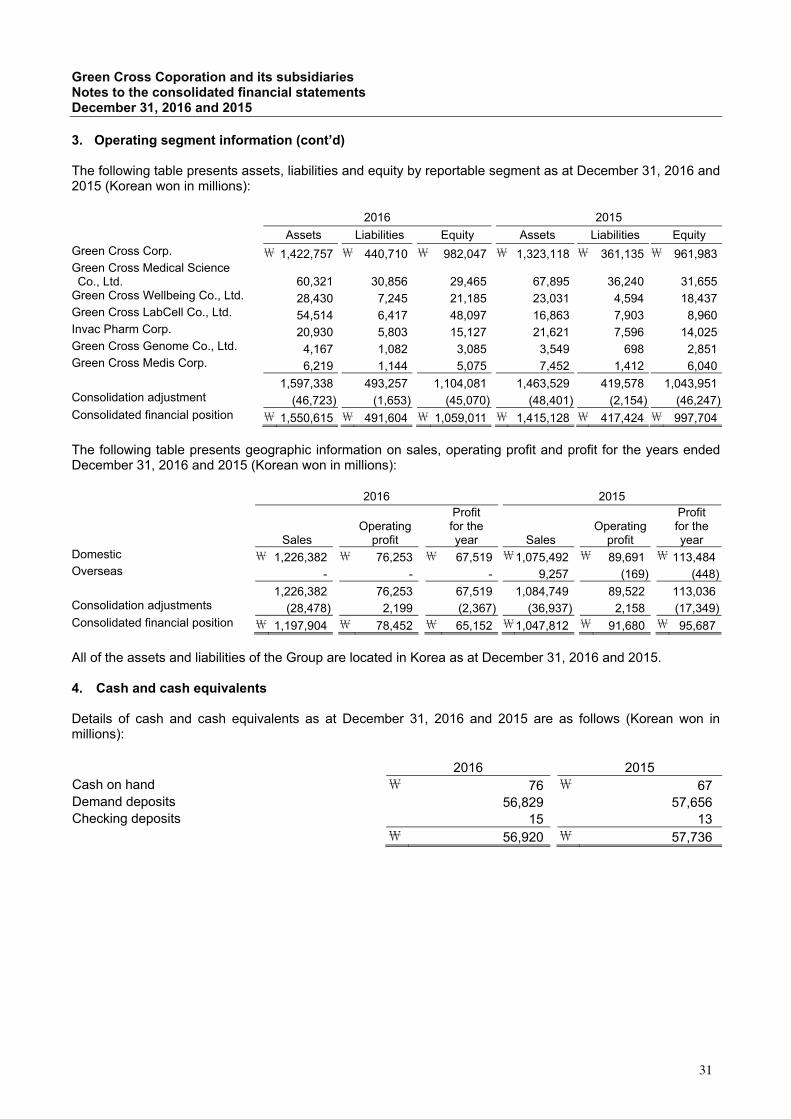
Green Cross Coporation and its subsidiaries Notes to the consolidated financial statements December 31, 2016 and 2015
3. Operating segment information (cont’d) The following table presents assets, liabilities and equity by reportable segment as at December 31, 2016 and 2015 (Korean won in millions):
2016 2015 Assets Liabilities Equity Assets Liabilities Equity Green Cross Corp. ₩ 1,422,757 ₩ 440,710 ₩ 982,047 ₩ 1,323,118 ₩ 361,135 ₩ 961,983Green Cross Medical Science Co., Ltd.
60,321 30,856 29,465 67,895 36,240 31,655
Green Cross Wellbeing Co., Ltd. 28,430 7,245 21,185 23,031 4,594 18,437Green Cross LabCell Co., Ltd. 54,514 6,417 48,097 16,863 7,903 8,960Invac Pharm Corp. 20,930 5,803 15,127 21,621 7,596 14,025Green Cross Genome Co., Ltd. 4,167 1,082 3,085 3,549 698 2,851Green Cross Medis Corp. 6,219 1,144 5,075 7,452 1,412 6,040 1,597,338 493,257 1,104,081 1,463,529 419,578 1,043,951Consolidation adjustment (46,723) (1,653) (45,070) (48,401) (2,154) (46,247)Consolidated financial position ₩ 1,550,615 ₩ 491,604 ₩ 1,059,011 ₩ 1,415,128 ₩ 417,424 ₩ 997,704
The following table presents geographic information on sales, operating profit and profit for the years ended December 31, 2016 and 2015 (Korean won in millions):
2016 2015
Sales Operating
profit
Profit for the year Sales
Operating profit
Profit for the year
Domestic ₩ 1,226,382 ₩ 76,253 ₩ 67,519 ₩1,075,492 ₩ 89,691 ₩ 113,484Overseas - - - 9,257 (169) (448) 1,226,382 76,253 67,519 1,084,749 89,522 113,036Consolidation adjustments (28,478) 2,199 (2,367) (36,937) 2,158 (17,349)Consolidated financial position ₩ 1,197,904 ₩ 78,452 ₩ 65,152 ₩1,047,812 ₩ 91,680 ₩ 95,687
All of the assets and liabilities of the Group are located in Korea as at December 31, 2016 and 2015. 4. Cash and cash equivalents Details of cash and cash equivalents as at December 31, 2016 and 2015 are as follows (Korean won in millions):
2016 2015
Cash on hand ₩ 76 ₩ 67Demand deposits 56,829 57,656Checking deposits 15 13
₩ 56,920 ₩ 57,736
31

Green Cross Coporation and its subsidiaries Notes to the consolidated financial statements December 31, 2016 and 2015
5. Trade and other receivables Details of trade and other receivables as at December 31, 2016 and 2015 are as follows (Korean won in millions):
2016 2015
Current Non-current Current Non-current
Trade receivables ₩ 341,295 ₩ - ₩ 286,925 ₩ -
Other receivables 3,612 - 1,395 -
Accrued income 64 - 64 -
Loans - 50 - -
Guarantee deposits - 8,086 - 8,197₩ 344,971 ₩ 8,136 ₩ 288,384 ₩ 8,197
Trade and other receivables as at December 31, 2016 and 2015 have been reported in the consolidated statements of financial position, net of allowances as follows (Korean won in millions):
2016 2015
Gross trade and other receivables ₩ 356,375 ₩ 298,831
Allowance for doubtful accounts:
Trade receivables (2,416) (1,356)
Other receivables (752) (746)
Guarantee deposits (100) (148)
(3,268) (2,250)
₩ 353,107 ₩ 296,581 Changes in the allowance accounts for the years ended December 31, 2016 and 2015 are as follows (Korean won in millions):
2016 2015
Trade receivables
Other receivables
Guaranteedeposits
Trade receivables
Other receivables
Guarantee deposits
As at January 1 ₩ 1,356 ₩ 746 ₩ 148 ₩ 1,239 ₩ 615 ₩ 196
Impairment 1,090 6 - 200 23 -
Reclassification - - - (108) 108 -
Write-off and others (30) - (48) (189) - (48)Changes in the scope of consolidation
- - - 214 - -
As at December 31 ₩ 2,416 ₩ 752 ₩ 100 ₩ 1,356 ₩ 746 ₩ 148
Significant receivables having indicators of impairment are individually tested for impairment. Receivables that are not individually significant are collectively tested for impairment, and an aging alalysis is conducted based on historical data. An allowance for doubtful accounts is included in selling, general and administrative expenses and other expenses in the consolidated statement of comprehensive income.
32
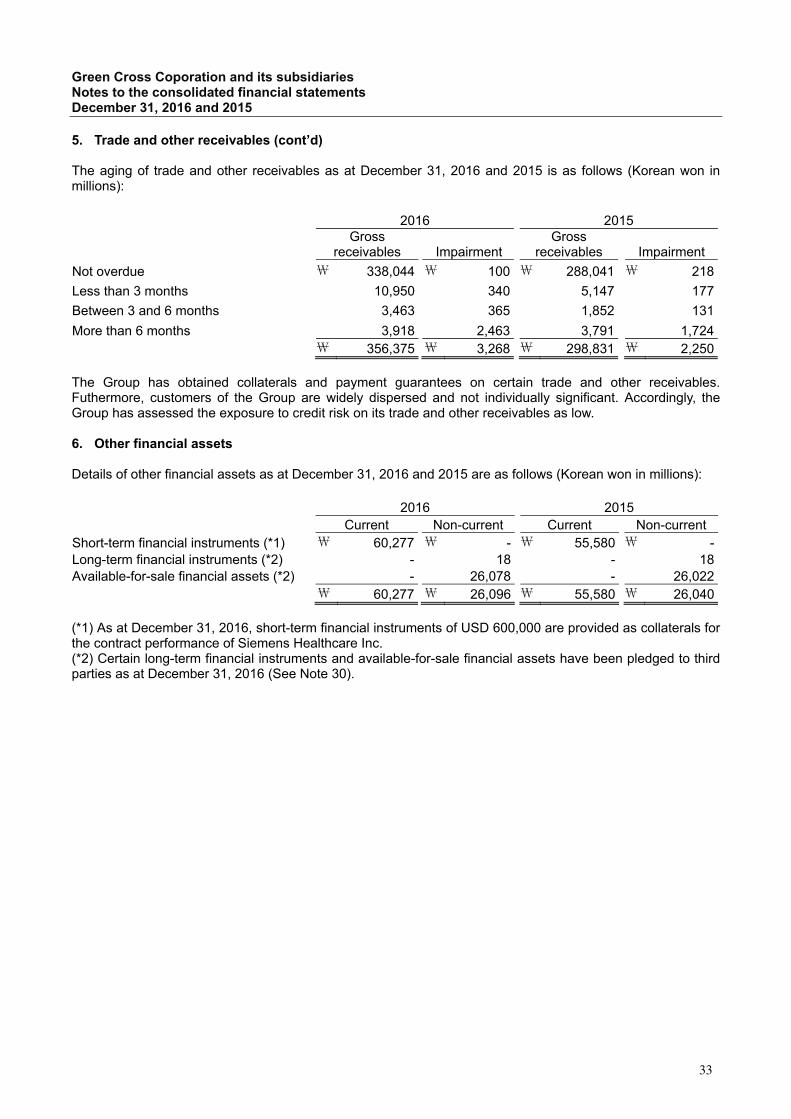
Green Cross Coporation and its subsidiaries Notes to the consolidated financial statements December 31, 2016 and 2015
5. Trade and other receivables (cont’d) The aging of trade and other receivables as at December 31, 2016 and 2015 is as follows (Korean won in millions):
2016 2015 Gross
receivables ImpairmentGross
receivables Impairment
Not overdue ₩ 338,044 ₩ 100 ₩ 288,041 ₩ 218
Less than 3 months 10,950 340 5,147 177
Between 3 and 6 months 3,463 365 1,852 131
More than 6 months 3,918 2,463 3,791 1,724₩ 356,375 ₩ 3,268 ₩ 298,831 ₩ 2,250
The Group has obtained collaterals and payment guarantees on certain trade and other receivables. Futhermore, customers of the Group are widely dispersed and not individually significant. Accordingly, the Group has assessed the exposure to credit risk on its trade and other receivables as low. 6. Other financial assets
Details of other financial assets as at December 31, 2016 and 2015 are as follows (Korean won in millions):
2016 2015
Current Non-current Current Non-currentShort-term financial instruments (*1) ₩ 60,277 ₩ - ₩ 55,580 ₩ -Long-term financial instruments (*2) - 18 - 18Available-for-sale financial assets (*2) - 26,078 - 26,022
₩ 60,277 ₩ 26,096 ₩ 55,580 ₩ 26,040 (*1) As at December 31, 2016, short-term financial instruments of USD 600,000 are provided as collaterals for the contract performance of Siemens Healthcare Inc. (*2) Certain long-term financial instruments and available-for-sale financial assets have been pledged to third parties as at December 31, 2016 (See Note 30).
33
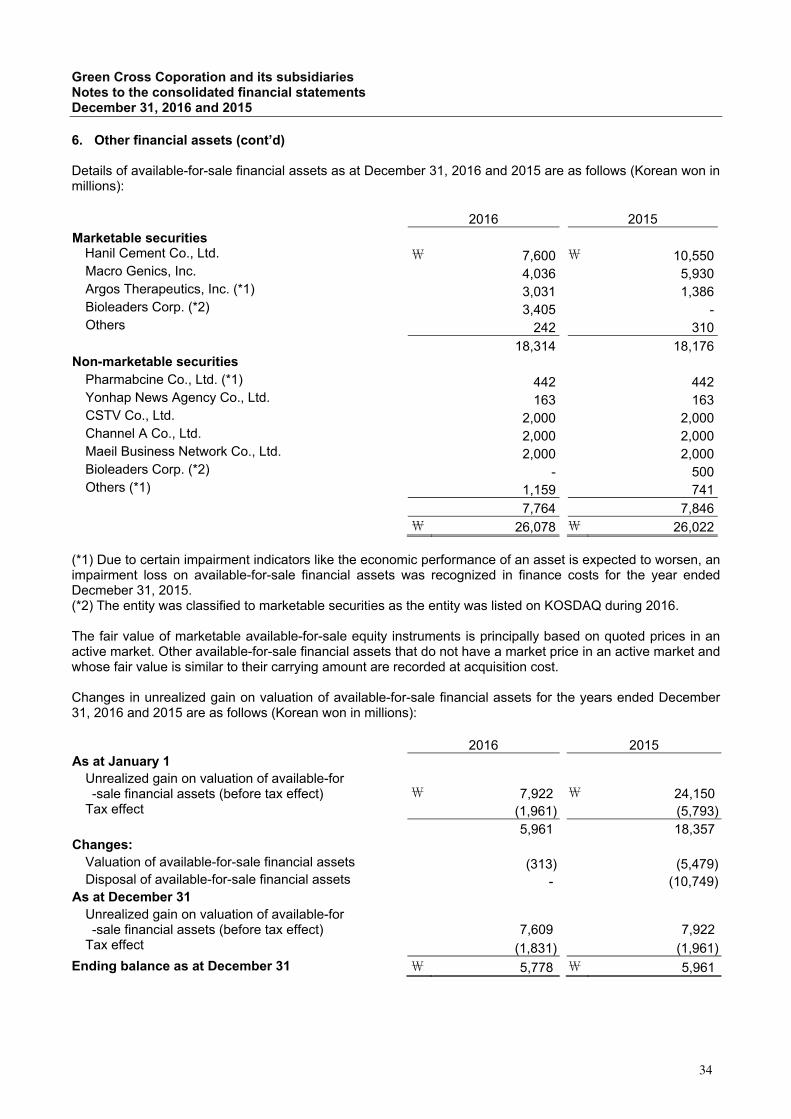
Green Cross Coporation and its subsidiaries Notes to the consolidated financial statements December 31, 2016 and 2015
6. Other financial assets (cont’d) Details of available-for-sale financial assets as at December 31, 2016 and 2015 are as follows (Korean won in millions):
2016 2015
Marketable securities Hanil Cement Co., Ltd. ₩ 7,600 ₩ 10,550Macro Genics, Inc. 4,036 5,930Argos Therapeutics, Inc. (*1) 3,031 1,386Bioleaders Corp. (*2) 3,405 -Others 242 310
18,314 18,176Non-marketable securities
Pharmabcine Co., Ltd. (*1) 442 442Yonhap News Agency Co., Ltd. 163 163CSTV Co., Ltd. 2,000 2,000Channel A Co., Ltd. 2,000 2,000Maeil Business Network Co., Ltd. 2,000 2,000Bioleaders Corp. (*2) - 500Others (*1) 1,159 741
7,764 7,846 ₩ 26,078 ₩ 26,022
(*1) Due to certain impairment indicators like the economic performance of an asset is expected to worsen, an impairment loss on available-for-sale financial assets was recognized in finance costs for the year ended Decmeber 31, 2015. (*2) The entity was classified to marketable securities as the entity was listed on KOSDAQ during 2016. The fair value of marketable available-for-sale equity instruments is principally based on quoted prices in an active market. Other available-for-sale financial assets that do not have a market price in an active market and whose fair value is similar to their carrying amount are recorded at acquisition cost. Changes in unrealized gain on valuation of available-for-sale financial assets for the years ended December 31, 2016 and 2015 are as follows (Korean won in millions):
2016 2015 As at January 1
Unrealized gain on valuation of available-for -sale financial assets (before tax effect) ₩ 7,922 ₩ 24,150
Tax effect (1,961) (5,793) 5,961 18,357Changes:
Valuation of available-for-sale financial assets (313) (5,479)Disposal of available-for-sale financial assets - (10,749)
As at December 31 Unrealized gain on valuation of available-for -sale financial assets (before tax effect) 7,609 7,922
Tax effect (1,831) (1,961)Ending balance as at December 31 ₩ 5,778 ₩ 5,961
34

Green Cross Coporation and its subsidiaries Notes to the consolidated financial statements December 31, 2016 and 2015
7. Inventories Details of inventories as at December 31, 2016 and 2015 are as follows (Korean won in millions):
2016 Acquisition cost Valuation allowance Book value
Merchandise ₩ 60,917 ₩ (5,913) ₩ 55,004
Finished goods 25,695 (867) 24,828
Work-in-progress 158,038 (47) 157,991
Raw materials 71,865 (336) 71,529
Materials-in-transit 11,214 - 11,214
Stored goods 187 - 187₩ 327,916 ₩ (7,163) ₩ 320,753
2015 Acquisition cost Valuation allowance Book value
Merchandise ₩ 63,837 ₩ (222) ₩ 63,615Finished goods 44,393 (504) 43,889Work-in-progress 123,052 (66) 122,986Raw materials 91,162 (11,352) 79,810Materials-in-transit 14,223 - 14,223Stored goods 208 - 208
₩ 336,875 ₩ (12,144) ₩ 324,731
For the years ended December 31, 2016 and 2015, reversal of loss on valuation of inventories included in cost of sales is as follows (Korean won in millions):
2016 2015 Cost of sales Reversal of loss on valuation of inventories ₩ 4,981 ₩ 357
35

Green Cross Coporation and its subsidiaries Notes to the consolidated financial statements December 31, 2016 and 2015
8. Investments in associates Details of investments in associates as at December 31, 2016 and 2015 are as follows (Korean won in millions):
2016
Associate Equity
ownership (%)Carrying amount
Acquisition cost Net assets
Medigen Biotech Corp. 50.00 ₩ 906 ₩ 455 ₩ 718Green Cross Cell Co., Ltd. 25.03 20,114 25,024 9,810PBS Biotech, Inc. (*1) 27.51 - 5,267 56Green Cross North America Inc. (*2) 46.85 40,067 40,681 40,011Green Cross America, Inc. (*2) 25.93 6,266 5,776 6,268 ₩ 67,353 ₩ 77,203 ₩ 56,863 (*1) Before the previous reporting period, due to impairment indicators, the Group recognized impairment loss. The Company’s equity interest in the entity excludes preferred shares. (*2) The Company’s equity interest changed as third parties participated in a public capital increase in 2016.
2015
Associate Equity
ownership (%)Carrying amount
Acquisition cost Net assets
Medigen Biotech Corp. 50.00 ₩ 822 ₩ 455 ₩ 634Green Cross Cell Co., Ltd. 25.03 20,104 25,024 9,868PBS Biotech, Inc. 27.51 - 5,267 (148)Green Cross North America Inc. 46.24 31,836 32,769 31,836Green Cross America, Inc. 37.50 5,891 5,776 5,891 ₩ 58,653 ₩ 69,291 ₩ 48,081 In accordance with a resolution of the Board of Directors on May 29, 2015, the Group disposed its equity interest in Ildong Pharmaceutical Co., Ltd. to reinforce its core competencies and have investment resources through improved asset utilization. As a result of the equity sale, a gain on disposal of equity investment in associates amounting to ₩32,762 million was recognized. Details of the fair value of marketable investments in associates as at December 31, 2016 and 2015 are as follows (Korean won in millions):
Associate 2016 2015
Green Cross Cell Co., Ltd. ₩ 79,616 ₩ 133,327
36

Green Cross Coporation and its subsidiaries Notes to the consolidated financial statements December 31, 2016 and 2015
8. Investments in associates (cont’d)
Changes in investments in associates for the years ended December, 2016 and 2015 are as follows (Korean won in millions):
2016
January 1 Acquisitions andreclassifications
Share of profitto associates Others December 31
Medigen Biotech Corp. ₩ 822 ₩ - ₩ 334 ₩ (250) ₩ 906
Green Cross Cell Co., Ltd. 20,104 - 35 (25) 20,114Green Cross North America
Inc. 31,836 7,912 (2,627) 2,946 40,067
Green Cross America, lnc. 5,891 - 150 225 6,266
₩ 58,653 ₩ 7,912 ₩ (2,108) ₩ 2,896 ₩ 67,353
2015
January 1 Acquisitions and reclassifications
Share of profitto associates Disposals Others
December 31
Medigen Biotech Corp. ₩ 739 ₩ - ₩ 293 ₩ - ₩ (210) ₩ 822
Green Cross Cell Co., Ltd. 19,364 - 829 - (89) 20,104Il-Dong Phamaceutical Co.,
Ltd. 94,260 - 3,988 (97,052) (1,196) -Green Cross North America
Inc. 4,116 28,033 26 - (339) 31,836
Green Cross America, lnc. - 5,776 (135) - 250 5,891
₩ 118,479 ₩ 33,809 ₩ 5,001 ₩ (97,052) ₩ (1,584) ₩ 58,653
Summarized financial information of the associates as at and for the years ended December 31, 2016 and 2015 are as follows (Korean won in millons):
2016
Total
assets Total
liabilities Sales Profit (loss) for the year
Medigen Biotech Corp. ₩ 1,549 ₩ 113 ₩ 967 ₩ 668PBS Biotech, Inc. 4,244 4,051 1,675 (1,673)Green Cross Cell Co., Ltd. 51,749 12,559 28,456 (93)Green Cross North America Inc. 202,652 57,832 44,250 (5,720)Green Cross America, lnc. 28,176 4,006 44,250 (3,951)
2015
Total
assets Total
liabilities Sales Profit (loss) for the year
Medigen Biotech Corp. ₩ 1,405 ₩ 137 ₩ 850 ₩ 585PBS Biotech, Inc. 3,122 3,659 913 (2,442)Green Cross Cell Co., Ltd. 51,871 12,443 29,750 3,038Green Cross North America Inc. 151,760 18,177 12,481 (143)Green Cross America, lnc. 24,694 8,984 21,612 (807)
37

Green Cross Coporation and its subsidiaries Notes to the consolidated financial statements December 31, 2016 and 2015
9. Property, plant and equipment Changes in property, plant and equipment for the years ended December 31, 2016 and 2015 are as follows (Korean won in millions):
2016
Land
Buildings and
structures MachineryOther tangible
assets Construction -in-progress Total
As at January 1, 2016 ₩ 18,761 ₩ 288,344 ₩ 92,723 ₩ 9,253 ₩ 91,322 ₩ 500,403
Acquisitions and capitalized cost (*1) - 1,640 6,736 2,625 70,138 81,139
Transfers - 23,767 8,570 515 (32,852) -
Disposals - - (15) (117) - (132)
Depreciation - (7,322) (16,605) (3,457) - (27,384)
As at December 31, 2016 ₩ 18,761 ₩ 306,429 ₩ 91,409 ₩ 8,819 ₩ 128,608 ₩ 554,026
Acquisition cost 18,761 351,265 198,686 31,966 128,608 729,286
Accumulated depreciation - (44,836) (107,277) (23,147) - (175,260) (*1) As at December 31, 2016, acquisitions of property, plant and equipment amounting to ₩2,362 million were recognized in other payables.
2015
Land
Buildings and
structures MachineryOther tangible
assets Construction -in-progress Total
As at January 1, 2015 ₩ 18,761 ₩ 269,343 ₩ 83,560 ₩ 11,997 ₩ 25,203 ₩ 408,864
Acquisitions and capitalized cost (*1) - 1,329 9,056 5,152 104,176 119,713
Transfers (*2) - 24,435 12,425 760 (38,057) (437)
Disposals - - (47) (73) - (120)
Depreciation - (6,763) (14,631) (3,866) - (25,260)
Changes in the scope of consolidation - - 2,360 (4,717) - (2,357)
As at December 31, 2015 ₩ 18,761 ₩ 288,344 ₩ 92,723 ₩ 9,253 ₩ 91,322 ₩ 500,403
Acquisition cost 18,761 325,858 183,665 29,995 91,322 649,601
Accumulated depreciation - (37,514) (90,942) (20,742) - (149,198) (*1) As at December 31, 2015, acquisitions of property, plant and equipment amounting to ₩1,891 million were recognized in other payables. (*2) During the current reporting period, transfers from construction-in-progress include ₩63 million transferred to intangible assets, ₩314 million to advance payments and ₩60 million to merchandise.
38

Green Cross Coporation and its subsidiaries Notes to the consolidated financial statements December 31, 2016 and 2015
10. Intangible assets Changes in intangible assets for the years ended December 31, 2016 and 2015 are as follows (Korean won in millions):
(*1) During the current reporting period, the Group recognized as impairment loss of ₩607 million due to impairment indicators.
(*1) During the previous reporting period, the Group recognized as impairment loss of ₩11,833 million due to impairment indicators. Goodwill allocated to each operating segment as at December 31, 2016, which is an individual CGU, is as follows (Korean won in millions):
2016 Green Cross Wellbeing Co., Ltd. ₩ 6,346Green Cross Vaccine Co., Ltd. 1,714Green Cross LabCell Corp. 1,029Invac Pharm Corp. 1,234Green Cross Medical Science Co., Ltd. 198Green Cross Genome Co., Ltd. 11Green Cross Medis Corp. 7,314 ₩ 17,846
2016
Goodwill Development
costs
Industrial property
rights
Other intangible
assets Total
As at January 1, 2016 ₩ 18,382 ₩ 17,846 ₩ 8,032 ₩ 15,966 ₩ 60,226
Acquisitions and capitalized cost - 15,267 2,566 165 17,998
Disposals - - (140) (266) (406)
Amortization - (1,496) (1,132) (939) (3,567)
Impairment (*1) (505) (102) - - (607)
Others (31) - - - (31)
As at December 31, 2016 ₩ 17,846 ₩ 31,515 ₩ 9,326 ₩ 14,926 ₩ 73,613
Acquisition cost 18,351 52,554 12,959 23,584 107,448
Accumulated amortization - (9,348) (3,633) (8,083) (21,064)
Accumulated impairment loss (505) (11,691) - (575) (12,771)
2015
Goodwill Development
costs
Industrial property
rights
Other intangible
assets Total
As at January 1, 2015 ₩ 12,594 ₩ 20,606 ₩ 4,574 ₩ 16,858 ₩ 54,632
Acquisitions and capitalized cost - 10,106 4,142 239 14,487
Transfers - - 32 31 63
Disposals - - (19) - (19)
Amortization - (1,277) (849) (918) (3,044)
Impairment (*1) - (11,589) - (244) (11,833)
Foreign currency translation 6 - - - 6
Changes in the scope of consolidation 5,782 - 152 - 5,934
As at December 31, 2015 ₩ 18,382 ₩ 17,846 ₩ 8,032 ₩ 15,966 ₩ 60,226
Acquisition cost 18,382 37,288 10,711 23,691 90,072
Accumulated amortization - (7,852) (2,679) (7,150) (17,681)
Accumulated impairment loss - (11,590) - (575) (12,165)
39

Green Cross Coporation and its subsidiaries Notes to the consolidated financial statements December 31, 2016 and 2015
10. Intangible assets (cont’d)
The recoverable amount of each CGU is calculated based on its value in use. Cash flow projections on the financial budgets approved by management are used in measuring value in use. Cash flow projections are estimated based on past performance, business forecasts, increases in future salaries, selling costs and inflation rates. The pre-tax rate used to discount future cash flows is a discount rate that reflects current market assessments of the risks specific to the asset.
With respect to the goodwill related to the cord blood segment in Green Cross LabCell Corp., the present value of future cash flows is extrapolated using a discount rate of 14.60% and a risk-free interest rate of 1.45%. The discount rate calculations are based on weighted-average capical costs (WACC) determined by considering the associated cash-generating units' risks. The recoverable amount of the cash-generating units, determined by these assumptions, does not exceed its carrying amount and as a result, an impairment loss of ₩505 million was recognized. 11. Investment property
Changes in investment property for the years ended December 31, 2016 and 2015 are as follows (Korean won in millions):
2016
Land Buildings Total
As at January 1, 2016 ₩ 4,114 ₩ 4,436 ₩ 8,550Depreciation - (123) (123)
As at December 31, 2016 ₩ 4,114 ₩ 4,313 ₩ 8,427
Acquisition cost 4,114 5,557 9,671Accumulated depreciation - (1,244) (1,244)
2015
Land Buildings Total
As at January 1, 2015 ₩ 4,114 ₩ 4,558 ₩ 8,672Depreciation - (122) (122)
As at December 31, 2015 ₩ 4,114 ₩ 4,436 ₩ 8,550
Acquisition cost 4,114 5,557 9,671Accumulated depreciation - (1,121) (1,121) Gain and loss from investment property for the years ended December 31, 2016 and 2015 are as follows (Korean won in millions):
2016 2015 Gain: Lease income ₩ 111 ₩ 117
Loss: Depreciation ₩ (123) ₩ (122)
The Group determined that the changes in fair value of land are insignificant and accordingly, fair value measurements were not performed.
40

Green Cross Coporation and its subsidiaries Notes to the consolidated financial statements December 31, 2016 and 2015
12. Other assets and other liabilities
Details of other assets as at December 31, 2016 and 2015 are as follows (Korean won in millions):
2016 2015
Advance payments ₩ 11,369 ₩ 11,930Prepaid expenses 6,856 1,546Current income tax assets 160 247Value added tax refunds 72 3,308
₩ 18,457 ₩ 17,031
Details of other liabilities as at December 31, 2016 and 2015 are as follows (Korean won in millions):
2016 2015
Current Non-current Current Non-current
Advance ₩ 2,976 ₩ - ₩ 2,420 ₩ -
Financial guarantee debt (Note 32) 774 4,669 40 -
Value added tax withheld 3,272 - 835 -
Unearned revenue 173 7,047 164 7,421
Withholdings 10,127 - 5,384 -Withholdings for certain research and development 1,594 - 4,112 -
Other financial liabilites - 7,130 - 6,921₩ 18,916 ₩ 18,846 ₩ 12,955 ₩ 14,342
13. Trade and other payables
Details of trade and other payables as at December 31, 2016 and 2015 are as follows (Korean won in millions):
2016 2015
Current Non-current Current Non-current
Trade payables ₩ 118,265 ₩ - ₩ 131,367 ₩ -
Other payables 7,696 - 19,808 -
Accrued expenses 37,368 - 36,914 -
Withholding deposits 731 - 646 -
Leasehold deposits received - 1,351 - 980
Other long term payables - 564 - 425₩ 164,060 ₩ 1,915 ₩ 188,735 ₩ 1,405
41

Green Cross Coporation and its subsidiaries Notes to the consolidated financial statements December 31, 2016 and 2015
14. Borrowings Details of borrowings as at December 31, 2016 and 2015 are as follows (Korean won in millions):
Annual interest
rate (%)
2016
2015
Short-term borrowings:
Woori Bank General loan 2.85 ₩ 2,500 ₩ 3,000
Citibank Overdraft loan - - 5,000
General loan 2.49 ~ 2.50 4,800 20,000
KEB Hana Bank General loan - - 1,300
Facility loan - - 1,200
Trade finance loan - - 20,000
Factoring of export exchange notes (*1) - - 186
Nonghyup Bank General loan - - 2,000
Korea Development Bank General loan 2.60 3,000 3,000
Kookmin Bank General loan - - 3,000
Tokyo-Mitsubishi UFJ Bank General loan 1.84 5,000 -
15,300 58,686
Current portion of long-term borrowings:
Nonghyup Bank General loan 2.72 30,000 -
Kwangju Bank Facility loan 2.49 4,000 -
Korea Development Bank Facility loan 1.72 ~ 2.20 50,000 -
84,000 -
99,300 58,686
Long-term borrowings:
Korea Development Bank Facility loan - - 40,000
Nonghyup Bank General loan - - 30,000
Kwangju Bank Facility loan - - 4,000
Public offering bonds General bonds 1.82 ~ 2.11 149,545 -
149,545 74,000
₩ 248,845 ₩ 132,686
(*1) Export exchange notes were factored with recourse to financial institutions as at December 31, 2015 (See Note 34). Details of bonds issued by the Group as at December 31, 2016 are as follows (Korean won in millions):
Date of maturity
Annual interest rate (%) 2016
40-1 non-guaranteed bonds 2019.05.26 1.82 ₩ 60,000
40-2 non-guaranteed bonds 2021.05.26 2.11 90,000
150,000
Discount on bonds payable (455)
₩ 149,545
42
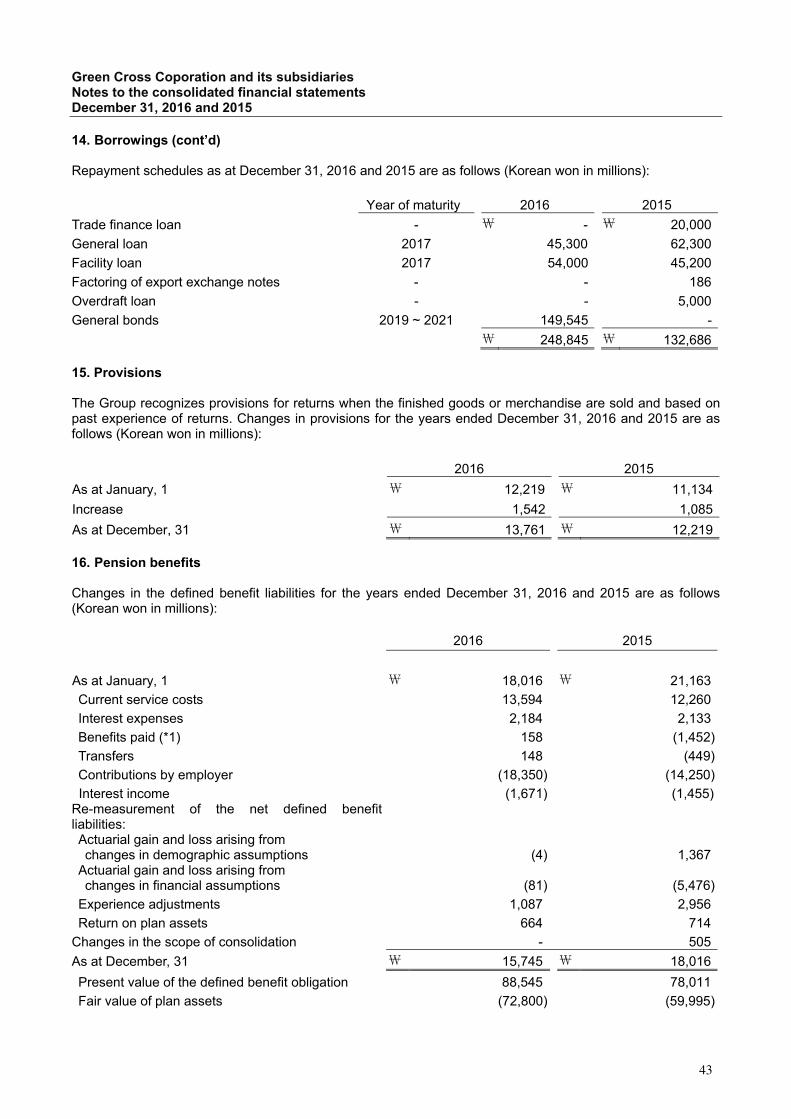
Green Cross Coporation and its subsidiaries Notes to the consolidated financial statements December 31, 2016 and 2015
14. Borrowings (cont’d) Repayment schedules as at December 31, 2016 and 2015 are as follows (Korean won in millions):
Year of maturity 2016 2015
Trade finance loan - ₩ - ₩ 20,000
General loan 2017 45,300 62,300
Facility loan 2017 54,000 45,200
Factoring of export exchange notes - - 186
Overdraft loan - - 5,000
General bonds 2019 ~ 2021 149,545 -
₩ 248,845 ₩ 132,686 15. Provisions The Group recognizes provisions for returns when the finished goods or merchandise are sold and based on past experience of returns. Changes in provisions for the years ended December 31, 2016 and 2015 are as follows (Korean won in millions):
2016 2015
As at January, 1 ₩ 12,219 ₩ 11,134
Increase 1,542 1,085
As at December, 31 ₩ 13,761 ₩ 12,219
16. Pension benefits
Changes in the defined benefit liabilities for the years ended December 31, 2016 and 2015 are as follows (Korean won in millions):
2016 2015
As at January, 1 ₩ 18,016 ₩ 21,163
Current service costs 13,594 12,260
Interest expenses 2,184 2,133
Benefits paid (*1) 158 (1,452)
Transfers 148 (449)
Contributions by employer (18,350) (14,250)
Interest income (1,671) (1,455)Re-measurement of the net defined benefit liabilities: Actuarial gain and loss arising from changes in demographic assumptions (4) 1,367
Actuarial gain and loss arising from changes in financial assumptions (81) (5,476)
Experience adjustments 1,087 2,956
Return on plan assets 664 714
Changes in the scope of consolidation - 505
As at December, 31 ₩ 15,745 ₩ 18,016
Present value of the defined benefit obligation 88,545 78,011
Fair value of plan assets (72,800) (59,995)
43

Green Cross Coporation and its subsidiaries Notes to the consolidated financial statements December 31, 2016 and 2015
16. Pension benefits (cont’d) (*1) Retirement benefits of ₩2,124 million, which belongs to 2015, but were paid in 2016 and retirement benefits of ₩116 million, which belong to 2016, but have not paid yet, are included. Re-measurement gains on defined benefit plans (net of tax) of \1,268 million (2015: \386 million) were recognized as other comprehensive income. Net benefit expense (recognized in profit or loss) for the years ended December 31, 2016 and 2015 are as follows (Korean won in millions):
2016 2015
Current service costs ₩ 13,594 ₩ 12,260Interest expenses 2,184 2,133Interest income (1,671) (1,455)
₩ 14,107 ₩ 12,938 Requirements for contribution by the Group are based on actuarial valuations conducted by an independent acturary. The Group expects to contribute ₩31,096 million to the defined benefit plan in 2017. Plan assets as at December 31, 2016 and 2015 are as follows (Korean won in millions):
2016 2015
Time deposits ₩ 8,780 ₩ 52,154Securities 53,654 7,841Others 10,366 - ₩ 72,800 ₩ 59,995 Principal actuarial assumptions as at December 31, 2016 and 2015 are as follows:
2016 2015
Discount rate 2.39 ~ 2.90% 2.37 ~ 2.93%
Expected rate of return on plan assets 2.39 ~ 2.90% 2.37 ~ 2.93%
Future salary increases 4.96 ~ 6.07% 4.96 ~ 6.44%
In order to measure the present value of the defined benefit obligations, the Group used the discount rate determined by reference to market yields at the end of the reporting period on high quality corporate bonds consistent with the currency and estimated term of the defined benefit obligations. The weighted average duration of defined benefit obligations as at December 31, 2016 and 2015 are 12.13 and 13.70 years, respectively.
A quantitative sensitivity analysis for significant assumptions as at December 31, 2016 is as shown below (Korean won in millions):
Present value of defined benefit obligations
Increase Decrease Discount rate (change of 1% point) ₩ (8,062) ₩ 9,581Rate of future salary (change of 1% point) 9,565 (8,199)
The above the sensitivity analysis does not consider all possible variances in cash flows generated from the defined benefit plan, as it is intended to provide an approximate sensitivity analysis based on the assumptions used.
44

Green Cross Coporation and its subsidiaries Notes to the consolidated financial statements December 31, 2016 and 2015
17. Issued capital Details of ordinary shares as at December 31, 2016 and 2015 are as follows (Korean won in millions, except par value per share amounts):
2016 2015 Number of shares authorized 30,000,000 30,000,000 Par value per share ₩ 5,000 ₩ 5,000Number of shares issued 11,686,538 11,686,538Issued capital ₩ 58,433 ₩ 58,433
There were no changes in issued capital and paid-in-capital in excess of par value in 2016 and 2015. 18. Share premium Details of share premium as at December 31, 2016 and 2015 are as follows (Korean won in millions):
2016 2015
Paid-in-capital in excess of par value ₩ 291,835 ₩ 291,835Gain on capital reduction 5,616 5,616Gain on disposal of treasury shares 11,792 11,792Others 15,289 2,071 ₩ 324,532 ₩ 311,314 19. Other components of equity Other components of equity as at December 31, 2016 and 2015 consist solely of treasury stock. Changes in other components of equity for the years ended December 31, 2016 and 2015 are as follows (Korean won in millions):
2016 2015
Number of
shares Book value Number of
shares Book value As at January, 1 123,360 ₩ 13,912 123,360 ₩ 13,912Acquisition 150,000 21,790 - -As at December, 31 273,360 ₩ 35,702 123,360 ₩ 13,912 20. Accumulated other comprehensive income Components of accumulated other comprehensive income as at December 31, 2016 and 2015 are as follows (Korean won in millions):
2016 2015
Gain on valuation of available-for-sale financial assets (see Note 6) ₩ 5,778 ₩ 5,961
Change in equity in equity method 2,787 (439) ₩ 8,565 ₩ 5,522
45

Green Cross Coporation and its subsidiaries Notes to the consolidated financial statements December 31, 2016 and 2015
21. Retained earnings Details of retained earnings as at December 31, 2016 and 2015 are as follows (Korean won in millions):
2016 2015
Legal reserve (*1) ₩ 13,485 ₩ 11,461Voluntary reserve 516,000 451,000Unappropriated retained earnings 107,758 132,992 ₩ 637,243 ₩ 595,453
(*1) In accordance with the Korean Commercial Code, an amount equal to at least 10% of cash dividends is required to be appropriated as a legal reserve until the reserve equals 50% of issued capital. The legal reserve may not be utilized for cash dividends but may only be used to offset a deficit, if any, or be transferred to capital.
The statements of appropriation of retained earnings for the years ended December 31, 2016 and 2015 are as follows (Korean won in millions, except dividend distributions amounts):
2016 2015 Retained earnings before appropriations: ₩ 101,336 ₩ 126,338Unappropriated retained earnings carried forward from the prior year 39,079 14,670Re-measurement gain (loss) on defined benefit plans (646) 1,067Profit for the year 62,903 110,601
Appropriations: 70,693 87,259Legal reserve 1,427 2,023Voluntary reserve (reserve for dividends) 15,000 25,000Voluntary reserve (reserve for business expansion) 40,000 40,000Dividend distributions (2016: ₩1,250 (25%), 2015: ₩1,750 (35%) per share) 14,266 20,236
Unappropriated retained earnings to be carried forward to the next year ₩ 30,643 ₩ 39,079
The above statement of appropriation of retained earnings is based on the separate financial statements of the Company. 22. Earnings per share Basic earnings per share for the years ended December 31, 2016 and 2015 are as follows (Korean won in millions, except earnings per share amounts):
(1) Basic earnings per share
2016 2015 Profit attributable to equity holders of the parent ₩ 62,970 ₩ 94,967Profit attributable to ordinary shareholders 62,970 94,967Weighted-average number of ordinary shares 11,552,407 shares 11,563,178 sharesEarnings per share ₩ 5,451 ₩ 8,213 (2) Weighted-average number of ordinary shares
2016 2015 Issued ordinary shares as at January 1 11,686,538 11,686,538Effect of treasury shares held (134,131) (123,360)Weighted-average number of ordinary shares 11,552,407 11,563,178 Diluted earnings per share are equal to basic earnings per share.
46
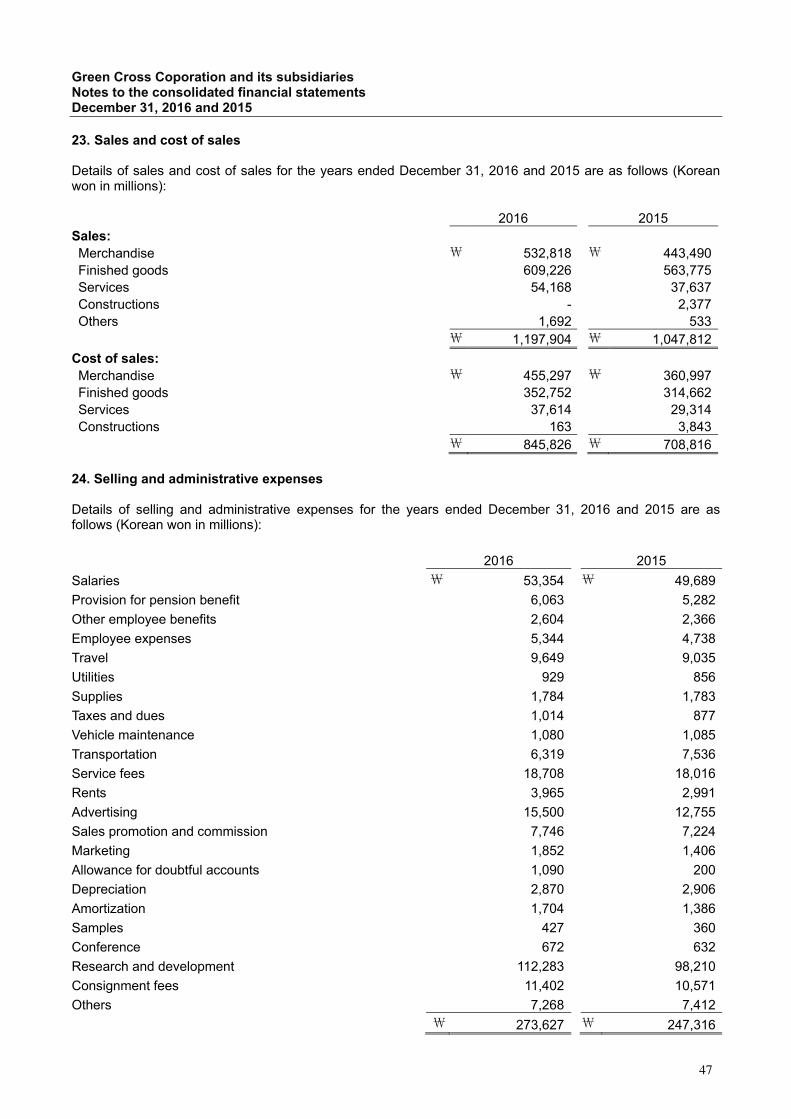
Green Cross Coporation and its subsidiaries Notes to the consolidated financial statements December 31, 2016 and 2015
23. Sales and cost of sales
Details of sales and cost of sales for the years ended December 31, 2016 and 2015 are as follows (Korean won in millions):
2016 2015
Sales: Merchandise ₩ 532,818 ₩ 443,490Finished goods 609,226 563,775Services 54,168 37,637Constructions - 2,377Others 1,692 533
₩ 1,197,904 ₩ 1,047,812
Cost of sales: Merchandise ₩ 455,297 ₩ 360,997Finished goods 352,752 314,662Services 37,614 29,314Constructions 163 3,843
₩ 845,826 ₩ 708,816 24. Selling and administrative expenses
Details of selling and administrative expenses for the years ended December 31, 2016 and 2015 are as follows (Korean won in millions):
2016 2015
Salaries ₩ 53,354 ₩ 49,689
Provision for pension benefit 6,063 5,282
Other employee benefits 2,604 2,366
Employee expenses 5,344 4,738
Travel 9,649 9,035
Utilities 929 856
Supplies 1,784 1,783
Taxes and dues 1,014 877
Vehicle maintenance 1,080 1,085
Transportation 6,319 7,536
Service fees 18,708 18,016
Rents 3,965 2,991
Advertising 15,500 12,755
Sales promotion and commission 7,746 7,224
Marketing 1,852 1,406
Allowance for doubtful accounts 1,090 200
Depreciation 2,870 2,906
Amortization 1,704 1,386
Samples 427 360
Conference 672 632
Research and development 112,283 98,210
Consignment fees 11,402 10,571
Others 7,268 7,412
₩ 273,627 ₩ 247,316
47
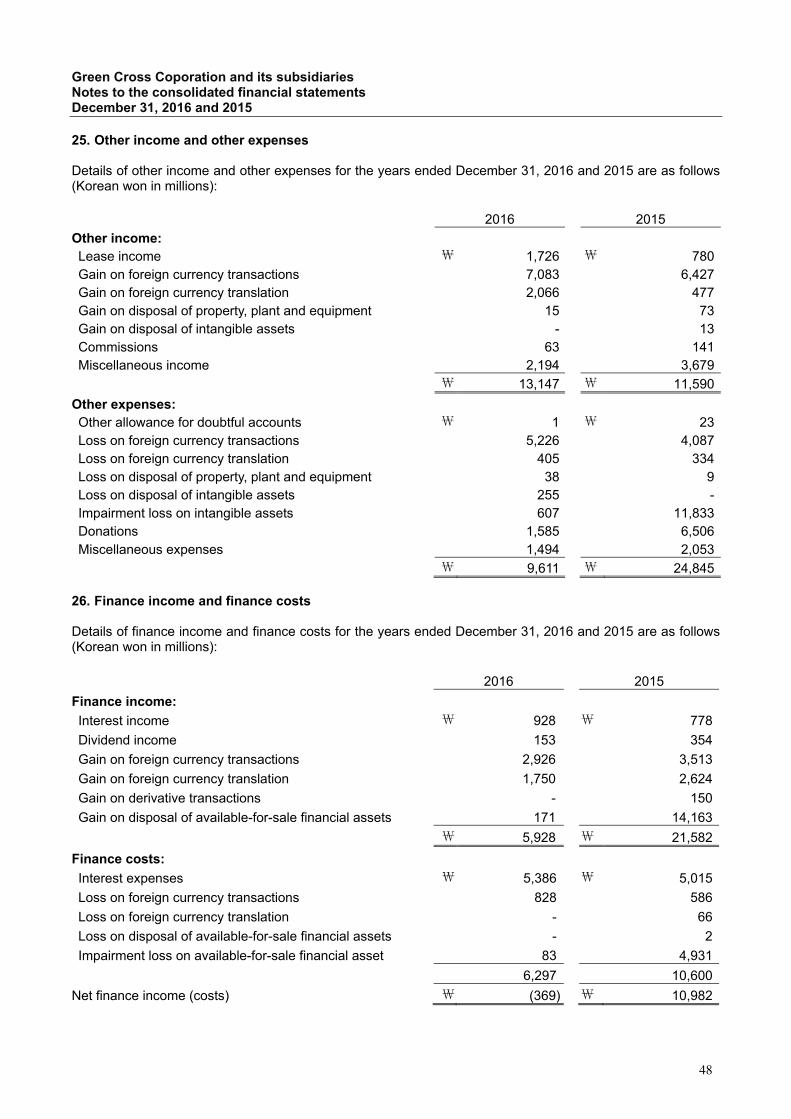
Green Cross Coporation and its subsidiaries Notes to the consolidated financial statements December 31, 2016 and 2015
25. Other income and other expenses
Details of other income and other expenses for the years ended December 31, 2016 and 2015 are as follows (Korean won in millions):
2016 2015
Other income:
Lease income ₩ 1,726 ₩ 780Gain on foreign currency transactions 7,083 6,427Gain on foreign currency translation 2,066 477Gain on disposal of property, plant and equipment 15 73Gain on disposal of intangible assets - 13Commissions 63 141Miscellaneous income 2,194 3,679
₩ 13,147 ₩ 11,590
Other expenses:
Other allowance for doubtful accounts ₩ 1 ₩ 23Loss on foreign currency transactions 5,226 4,087Loss on foreign currency translation 405 334Loss on disposal of property, plant and equipment 38 9Loss on disposal of intangible assets 255 -Impairment loss on intangible assets 607 11,833Donations 1,585 6,506Miscellaneous expenses 1,494 2,053
₩ 9,611 ₩ 24,845 26. Finance income and finance costs
Details of finance income and finance costs for the years ended December 31, 2016 and 2015 are as follows (Korean won in millions):
2016 2015
Finance income:
Interest income ₩ 928 ₩ 778
Dividend income 153 354
Gain on foreign currency transactions 2,926 3,513
Gain on foreign currency translation 1,750 2,624
Gain on derivative transactions - 150
Gain on disposal of available-for-sale financial assets 171 14,163
₩ 5,928 ₩ 21,582
Finance costs:
Interest expenses ₩ 5,386 ₩ 5,015
Loss on foreign currency transactions 828 586
Loss on foreign currency translation - 66
Loss on disposal of available-for-sale financial assets - 2
Impairment loss on available-for-sale financial asset 83 4,931
6,297 10,600
Net finance income (costs) ₩ (369) ₩ 10,982
48

Green Cross Coporation and its subsidiaries Notes to the consolidated financial statements December 31, 2016 and 2015
27. Expenses based on nature of expenses
Details of expenses based on nature of expenses for the years ended December 31, 2016 and 2015 are as follows (Korean won in millions): 2016
Cost of sales
Selling and administrative
expenses Total Changes in inventories ₩ 3,978 ₩ - ₩ 3,978Purchase of raw materials and merchandise 690,245 - 690,245Salaries 57,416 79,205 136,621Provison for pension benefit 5,572 8,535 14,107Depreciation 15,822 11,685 27,507Amortization 1,243 2,324 3,567Others 71,550 171,878 243,428
₩ 845,826 ₩ 273,627 ₩ 1,119,453
2015
Cost of sales
Selling and administrative
expenses Total Changes in inventories ₩ (26,335) ₩ - ₩ (26,335)Purchase of raw materials and merchandise 601,987 - 601,987Salaries 51,164 72,181 123,345Provison for pension benefit 5,225 7,713 12,938Depreciation 14,153 11,229 25,382Amortization 1,268 1,776 3,044Others 61,354 154,417 215,771
₩ 708,816 ₩ 247,316 ₩ 956,132
49
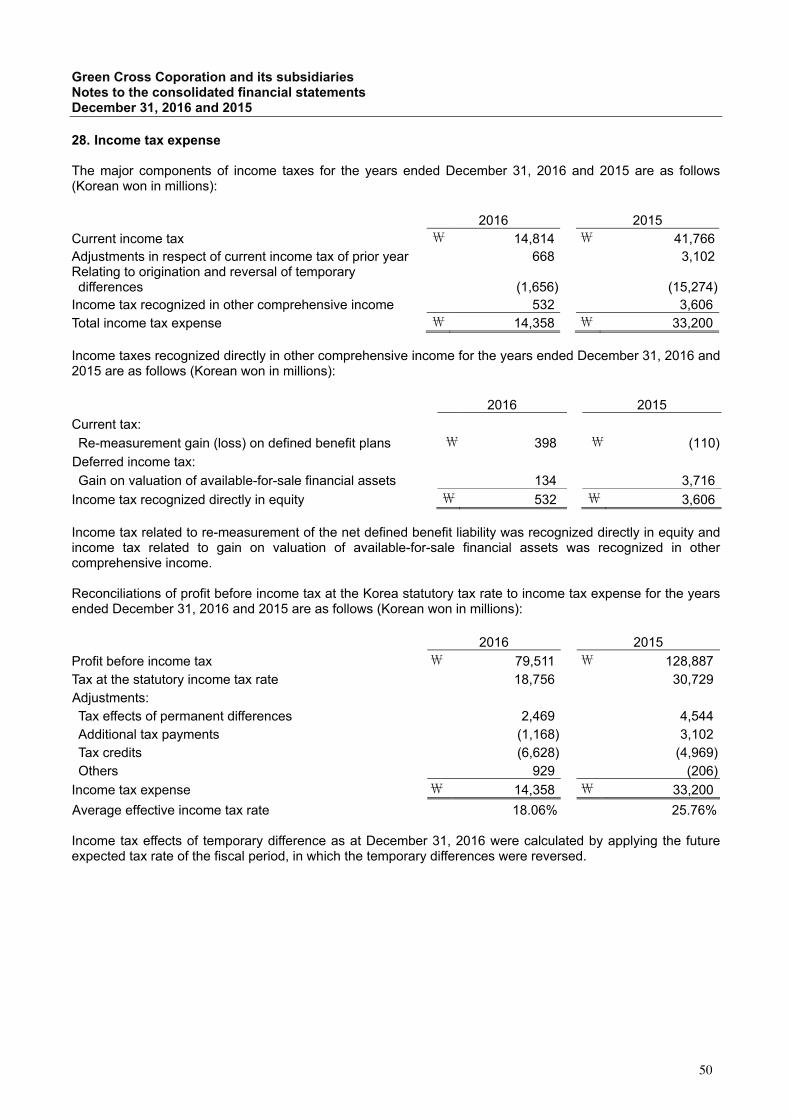
Green Cross Coporation and its subsidiaries Notes to the consolidated financial statements December 31, 2016 and 2015
28. Income tax expense
The major components of income taxes for the years ended December 31, 2016 and 2015 are as follows (Korean won in millions):
2016 2015 Current income tax ₩ 14,814 ₩ 41,766Adjustments in respect of current income tax of prior year 668 3,102Relating to origination and reversal of temporary differences (1,656) (15,274)Income tax recognized in other comprehensive income 532 3,606Total income tax expense ₩ 14,358 ₩ 33,200 Income taxes recognized directly in other comprehensive income for the years ended December 31, 2016 and 2015 are as follows (Korean won in millions):
2016 2015
Current tax:
Re-measurement gain (loss) on defined benefit plans ₩ 398 ₩ (110)
Deferred income tax:
Gain on valuation of available-for-sale financial assets 134 3,716
Income tax recognized directly in equity ₩ 532 ₩ 3,606 Income tax related to re-measurement of the net defined benefit liability was recognized directly in equity and income tax related to gain on valuation of available-for-sale financial assets was recognized in other comprehensive income. Reconciliations of profit before income tax at the Korea statutory tax rate to income tax expense for the years ended December 31, 2016 and 2015 are as follows (Korean won in millions): 2016 2015
Profit before income tax ₩ 79,511 ₩ 128,887Tax at the statutory income tax rate 18,756 30,729Adjustments:
Tax effects of permanent differences 2,469 4,544Additional tax payments (1,168) 3,102Tax credits (6,628) (4,969)Others 929 (206)
Income tax expense ₩ 14,358 ₩ 33,200
Average effective income tax rate 18.06% 25.76%
Income tax effects of temporary difference as at December 31, 2016 were calculated by applying the future expected tax rate of the fiscal period, in which the temporary differences were reversed.
50

Green Cross Coporation and its subsidiaries Notes to the consolidated financial statements December 31, 2016 and 2015
28. Income tax expense (cont’d) The Group sets off a deferred tax asset against a deferred tax liability of the same taxable entity only if the deferred taxes related to income taxes are levied by the same taxation authority and the entity has a legally enforceable right to set off current tax assets against current tax liabilities. Changes in deferred tax assets (liabilities) for the years ended December 31, 2016 and 2015 are as follows (Korean won in millions): 2016
Beginning
balance Increase
(decrease) Ending balance
Defined benefit liability ₩ 15,115 ₩ 1,589 ₩ 16,704
Accrued expenses 1,481 246 1,727
Defined benefit plan (13,903) (2,209) (16,112)
Depreciation (1,936) 101 (1,835)
Provision for returns 2,955 228 3,183
Provision for valuation of inventories 2,908 (1,259) 1,649
Others 1,054 2,960 4,014
₩ 7,674 ₩ 1,656 ₩ 9,330
Deferred tax assets 9,599 1,987 11,586
Deferred tax liabilities (1,925) (331) (2,256) 2015
Beginning
balance Increase
(decrease) Ending balance
Defined benefit liability ₩ 12,738 ₩ 2,377 ₩ 15,115
Accrued expenses 826 655 1,481
Defined benefit plan (11,602) (2,301) (13,903)
Depreciation (2,377) 441 (1,936)
Provision for returns 2,642 313 2,955
Provision for valuation of inventories 2,823 85 2,908
Others (12,650) 13,704 1,054
₩ (7,600) ₩ 15,274 ₩ 7,674
Deferred tax assets 662 8,937 9,599
Deferred tax liabilities (8,263) 6,338 (1,925) The Group recognizes deferred tax assets for all deductible temporary differences when the aggregate amount of the total taxable temporary difference and the expected future taxable income before reflecting tax exceed the total of all deductible temporary differences and tax loss carry forwards. However, unrecognized deferred tax assets for deductible temporary differences are as follows (Korean won in millions): 2016 2015 Subsidiaries ₩ 1,175 ₩ 988Associates 12,638 9,674 ₩ 13,813 ₩ 10,662
Realization of future tax benefits related to deferred tax assets is dependant of numorous factors, including the Group’s ability to generate taxable income within the period during which temporary differences reverse, the outlook on business environments and overall future industry outlook. Management periodically considers these factors in reaching its conclusions.
51

Green Cross Coporation and its subsidiaries Notes to the consolidated financial statements December 31, 2016 and 2015
29. Commitments and contingencies
A significant litigation the Group is currently involved in as at December 31, 2016 is as follows (Korean won in millions):
Court of jurisdiction Plaintiff Defendant Particulars Claim amount Status
Seoul East District Court Taeyoung Pharm Co., Ltd.
Green Cross Corporation
Compensation for damage ₩ 1,283 Second stage
The outcome of this lawsuit and impact on the consolidated financial statements cannot be reasonably estimated as at December 31, 2016. Details of financial arrangements the Group holds with financial institutions as at December 31, 2016 are as follows (Korean won in million and US dollar in thousand):
Type Financial institution Amount
General loan Nonghyup Bank ₩ 30,000 Korea Development Bank ₩ 5,000
Shinhan Bank ₩ 21,000 Citibank ₩ 35,000 Woori Bank ₩ 26,500 KEB Hana Bank ₩ 16,000 Korea Eximbank ₩ 30,000 Tokyo-Mitsubishi UFJ Bank ₩ 30,000
Facility loan Korea Development Bank ₩ 50,000 Kwangju Bank ₩ 4,000Overdraft loan KEB Hana Bank ₩ 10,000
Trade finance loan Industrial Bank of Korea ₩ 3,000 KEB Hana Bank ₩ 42,000Others Shinhan Bank USD 4,000
₩ 10,000 Kookmin Bank ₩ 10,000 Woori Bank USD 1,500
KEB Hana Bank USD 10,600 ₩ 40,000 Details of the Group’s payment guarantees provided by financial institutions as at December 31, 2016 are as follows (Korean won in millions and US dollar in thousands):
Financial institution
Description Limit of
payment guarantee Amount of
payment guaranteeKEB Hana Bank Sales guarantee of Ipsen Korea
₩ 25,000 ₩ 2,500
Sales guarantee of Abbott Korea ₩ 3,500 Sales guarantee of Galderma Korea ₩ 400 Contract guarantee of
Thai Red Cross Society USD 5,600 USD 5,104
Foreign payment guarantees USD 350 USD 204 Import letter of credit USD 500 USD 167 Import letter of credit USD 273 USD - Import letter of credit USD 5,000 USD 220Woori Bank Import letter of credit USD 500 USD 333Shinhan Bank Import letter of credit USD 4,000 USD 73
52

Green Cross Coporation and its subsidiaries Notes to the consolidated financial statements December 31, 2016 and 2015
29. Commitments and contingencies (cont’d)
The Group holds a performance guarantee amounting to ₩715 million from Seoul Guarantee Insurance Company. As at December 31, 2016, the Group is provided with payment guarantees from Seoul Guarantee Insurance Co., Ltd., amounting to ₩1,349 million in connection with performance guarantees and payment guarantees of Red Cross Blood Center and Korea National Red Cross. 30. Collaterilized assets
The following assets have been pledged as collateral for the Group’s liabilities as at December 31, 2016 (Korean won in millions):
Related company
or institution Account Borrowings Asset pledged Description Carryingamount
Astrazeneca Korea Accounts payable ₩ 3,336
Available-for-sale financial assets
Hanil Cement Co., Ltd.
₩ 6,460
Centers for Disease Control and Prevention Contract guarantee -
Available-for-sale financial assets
Hanil Cement Co., Ltd.
71
Citibank and etc. Overdraft loan -Other financial assets
Long-term financial assets 8
Hwasun County Contract guarantee -Property, plant and equipment Buildings 7,440
Cheongju City Contract guarantee -Property, plant and equipment Buildings 3,300
Siemens Healthcare Inc Contract guarantee -Other financial assets
Short-term financial assets 725
₩ 3,336 ₩ 18,004
53

Green Cross Coporation and its subsidiaries Notes to the consolidated financial statements December 31, 2016 and 2015
31. Cash flows from operating activities
Details of adjustments and changes of net working capital in cash generated from operation for the years ended December 31, 2016 and 2015 are as follows (Korean won in millions): 2016 2015 Profit for the year ₩ 65,152 ₩ 95,687Adjustments to reconcile profit for the year to net cash flows: 59,448 38,656 Income tax expenses 14,358 33,200 Interest expense 5,386 5,015 Provision for pension benefit 14,107 12,938 Depreciation 27,507 25,382 Amortization 3,567 3,044 Allowance for doubtful accounts 1,090 200 Loss on foreign currency translation 405 400 Loss on disposal of property, plant and equipment 38 9 Loss on diposal of intangible assets 255 - Impairment loss on intangible assets 607 11,833 Other allowance for doubtful accounts 1 23 Impairment loss on available-for-sale financial assets 83 4,931 Loss on disposal of available-for-sale financial assets - 2 Loss on investments in associates 4,109 135 Interest income (928) (778) Dividend income (153) (354) Gain on foreign currency translation (3,816) (3,101) Gain on disposal of property, plant and equipment (15) (73) Gain on disposal of intangible assets - (13) Gain on investments in associates (370) (5,136) Gain on disposal of investments in associates (1,631) (32,886) Gain on disposal of investments in subsidiaries - (1,595) Gain on disposal of available-for-sale financial assets (171) (14,163) Reversal of loss on valuation of inventories (4,981) (357)
Working capital adjustments: (79,802) (54,848) Trade and other receivables – trade (53,469) (42,302) Trade and other receivables – construction contracts - 9,145 Trade and other receivables – others (2,222) 2,743 Other current assets 3,854 1,084 Inventories 8,958 (31,812) Leasehold deposits 159 -Trade and other payables – trade (13,433) 10,938Trade and other payables – others (12,582) 2,164
Accrued expenses (3) 3,616 Withholdings 4,744 2,513Value added tax refund 2,437 928
Deposits received 84 (35) Withholdings for certain research and development (2,518) 1,277 Provisions for returns 1,542 1,085 Other current liabilities 556 (884) Other non-current liabilities (236) (416) Deposits received 371 - Long-term and other payables - 162Defined benefit plan assets 6,575 3,029
Transfer of defined benefit liabilities 148 (449) Payment of retirement benefit (6,417) (3,567)Contributions to defined benefit plan assets (18,350) (14,250)Translation of foreign operations - 183
Cash flows from operating activities ₩ 44,798 ₩ 79,495
54

Green Cross Coporation and its subsidiaries Notes to the consolidated financial statements December 31, 2016 and 2015
31. Cash flows from operating activities (cont’d)
Significant transactions not involving cash flows for the years ended December 31, 2016 and 2015 are as follows (Korean won in millions):
2016 2015
Transfer of construction-in-progress ₩ 32,852 ₩ 38,057
Valuation gain on available-for-sale financial assets 218 12,367Transfer of share premium to other financial liabilities - 4,441Transfer of investments in subsidiaries to investments in associates - 5,776
Transfer of current portion of long-term borrowings 84,000 30,000 32. Related parties Related parties as at December 31, 2016 and 2015 are as follows:
Relationship 2016 2015
Parent company Green Cross Holdings Corp. Green Cross Holdings Corp. Associates Medigen Biotech Corp. Medigen Biotech Corp. Green Cross Cell Co., Ltd. Green Cross Cell Co., Ltd.
PBS Biotech, Inc. PBS Biotech, Inc. Green Cross North America Inc. (“GCNA”) Green Cross North America Inc. (“GCNA”) Green Cross America, Inc. (“GCAM”) Green Cross America, Inc. (“GCAM”) Others Green Cross Healthcare Co., Ltd. Green Cross Healthcare Co., Ltd.
Green Cross EM Corp. Green Cross EM Corp.
MOGAM Biotechnology Research Institute MOGAM Biotechnology Research Institute
Medical Corporation Green Cross Medical Laboratories (“GCML”)
Medical Corporation Green Cross Medical Laboratories (“GCML”)
Green Cross Welfare Co., Ltd. Green Cross Welfare Co., Ltd.
Green Cross China Corp. (GC China) Green Cross China Corp. (GC China)
Green Cross Hong Kong Holdings Limited (“GCHK”)
Green Cross Hong Kong Holdings Limited (“GCHK”)
Korea Hitech Co., Ltd. Korea Hitech Co., Ltd.
Anhui Green Cross Pharmaceutical Co.,Ltd.
Anhui Green Cross Pharmaceutical Co.,Ltd.
Green Cross BioTherapeutics Inc. (“GCBT”)
Green Cross BioTherapeutics Inc. (“GCBT”)
Amuseway, Inc. Amuseway, Inc.
TaoJiang Green Cross Pharmaceutical distribution Co.,Ltd.
GC Labtech, Inc.(“GCLT”)
Lymphotec Inc.
Ajin D&M Co., Ltd.
55

Green Cross Coporation and its subsidiaries Notes to the consolidated financial statements December 31, 2016 and 2015
32. Related parties (cont’d)
Significant transactions with the related parties for the years ended December 31, 2016 and 2015 are as follows (Korean won in millions):
2016
Sales Other
income Dividend income
Purchase ofraw materials
Acquisitionof assets
Service fees
Research and development
fees Other
expenses Contribution
Parent company: Green Cross
Holdings Corp. ₩ 189 ₩ - ₩ - ₩ 5,499 ₩ 309 ₩ 21,406 ₩ 2,286 ₩ 2,006 ₩ -
Associates: Medigen Biotech Corp. - - 250 667 - - - - -
Green Cross Cell Co., Ltd. 12 - - 11,524 - - 131 229 -
PBS Biotech, Inc. - - - - - - 31 - -
GCNA - - - - - - - - 7,912
GCAM - - - 35,070 - - - - -
Others: Green Cross EM
Corp. 54 - - 5,252 35,944 196 1,805 81 -MOGAM Biotechnology
Research Institute 87 1,120 - 76 - - 7,246 16 -Anhui Green Cross
Pharmaceutical Co., Ltd. 17,327 - - - - - - - -
GCML 56,982 - - 2,052 34 1 245 223 -
Others 592 - - 15 - 245 104 341 -
₩ 75,243 ₩ 1,120 ₩ 250 ₩ 60,155 ₩ 36,287 ₩ 21,848 ₩ 11,848 ₩ 2,896 ₩ 7,912
2015
Sales Other
income Dividend income
Purchase ofraw materials
Acquisitionof assets
Disposal ofassets
Servicefees
Research and development
fees Other
expenses Contribution
Parent company: Green Cross
Holdings Corp. ₩ 182 ₩ - ₩ - ₩ 5,190 ₩ 404 ₩ 71 ₩18,574 ₩ 2,142 ₩ 2,764 ₩ -
Associates: Green Cross Cell
Co., Ltd. 22 - - 10,062 - - - 53 225 -Ildong
Pharmaceutical Co., Ltd. 779 - 1,378 - - - - - - -
GCAM - - - 12,459 - - - - - 2,184
GCNA - - - - - - - - - 28,033
Others - - 210 650 - - - 11 - -
Others: Green Cross EM
Corp. 52 2 - 10,873 63,139 - 9 1,766 143 -MOGAM Biotechnology
Research Institute 173 53 - 76 - - - 5,090 3 -Anhui Green Cross
Pharmaceutical Co., Ltd. 20,327 - - - - - - - - -
GCML 47,809 - - 2,287 - - 9 193 193 -
Others 9 - - 29 - - 3 25 324 -
₩ 69,353 ₩ 55 ₩ 1,588 ₩ 41,626 ₩ 63,543 ₩ 71 ₩18,595 ₩ 9,280 ₩ 3,652 ₩ 30,217
Inter-group transactions have been eliminated and excluded from the above tables.
56

Green Cross Coporation and its subsidiaries Notes to the consolidated financial statements December 31, 2016 and 2015
32. Related parties (cont’d)
Outstanding balances with the related parties as at December 31, 2016 and 2015 are as follows (Korean won in millions):
2016
Trade
receivables Other
receivablesLeasehold deposits
Trade payables
Accrued expenses
Other payables
Deposits received
Parent company:
Green Cross Holdings Corp.
₩ 10 ₩ 4 ₩ 3,635 ₩ - ₩ 8,007 ₩ -
₩ -
Associates:
Medigen Biotech Corp. - - - - 667 - -
Green Cross Cell Co., Ltd. 5 - - 1,102 63 - -
GCAM - - - 3,529 - - -
Others:
Green Cross EM Corp. 5 1 - - 806 530 -MOGAM
Biotechnology Research Institute
26 634 - - 76 - 546
Anhui Green Cross Pharmaceutical Co., Ltd.
14,139 - - - - - -
GCML 9,589 - - 24 133 - -
Others 569 - - - 263 - -
₩ 24,343 ₩ 639 ₩ 3,635 ₩ 4,655 ₩ 10,015 ₩ 530 ₩ 546
2015
Trade
receivables Other
receivables Leasehold deposits
Trade payables
Accrued expenses
Other payables
Parent company:
Green Cross Holdings
Corp. ₩ 16 ₩ 94 ₩ 3,710 ₩ - ₩ 6,984 ₩ 4
Associates:
Medigen Biotech Corp. - - - - 650 -
Green Cross Cell Co., Ltd. 8 - - 1,094 24 -
Others:
Green Cross EM Corp. 4 1 - 1,052 648 799MOGAM
Biotechnology Research Institute
13 127 27 - 172 -
Anhui Green Cross Pharmaceutical Co., Ltd.
12,233 - - - - -
GCML 8,489 - - 21 162 -
Others 1 - - - 7 -
₩ 20,764 ₩ 222 ₩ 3,737 ₩ 2,167 ₩ 8,647 ₩ 803
Inter-group transactions have been eliminated and excluded from the above tables.
57
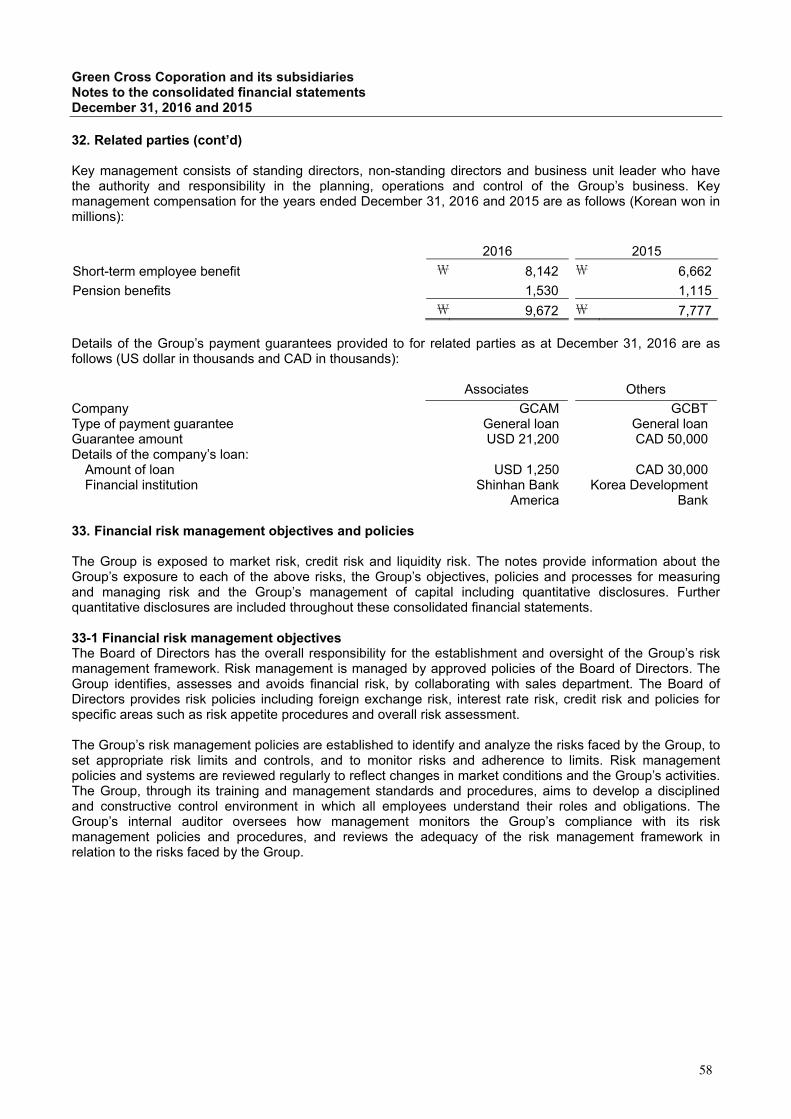
Green Cross Coporation and its subsidiaries Notes to the consolidated financial statements December 31, 2016 and 2015
32. Related parties (cont’d)
Key management consists of standing directors, non-standing directors and business unit leader who have the authority and responsibility in the planning, operations and control of the Group’s business. Key management compensation for the years ended December 31, 2016 and 2015 are as follows (Korean won in millions):
2016 2015
Short-term employee benefit ₩ 8,142 ₩ 6,662
Pension benefits 1,530 1,115
₩ 9,672 ₩ 7,777 Details of the Group’s payment guarantees provided to for related parties as at December 31, 2016 are as follows (US dollar in thousands and CAD in thousands):
Associates Others
Company GCAM GCBTType of payment guarantee General loan General loanGuarantee amount USD 21,200 CAD 50,000 Details of the company’s loan:
Amount of loan USD 1,250 CAD 30,000Financial institution Shinhan Bank
America Korea Development
Bank 33. Financial risk management objectives and policies The Group is exposed to market risk, credit risk and liquidity risk. The notes provide information about the Group’s exposure to each of the above risks, the Group’s objectives, policies and processes for measuring and managing risk and the Group’s management of capital including quantitative disclosures. Further quantitative disclosures are included throughout these consolidated financial statements. 33-1 Financial risk management objectives The Board of Directors has the overall responsibility for the establishment and oversight of the Group’s risk management framework. Risk management is managed by approved policies of the Board of Directors. The Group identifies, assesses and avoids financial risk, by collaborating with sales department. The Board of Directors provides risk policies including foreign exchange risk, interest rate risk, credit risk and policies for specific areas such as risk appetite procedures and overall risk assessment.
The Group’s risk management policies are established to identify and analyze the risks faced by the Group, to set appropriate risk limits and controls, and to monitor risks and adherence to limits. Risk management policies and systems are reviewed regularly to reflect changes in market conditions and the Group’s activities. The Group, through its training and management standards and procedures, aims to develop a disciplined and constructive control environment in which all employees understand their roles and obligations. The Group’s internal auditor oversees how management monitors the Group’s compliance with its risk management policies and procedures, and reviews the adequacy of the risk management framework in relation to the risks faced by the Group.
58

Green Cross Coporation and its subsidiaries Notes to the consolidated financial statements December 31, 2016 and 2015
33. Financial risk management objectives and policies (cont’d) 33-2 Market risk Market risk is the risk that the fair value or future cash flows of a financial instrument will fluctuate because of changes in market prices, such as foreign exchange rates, interest rates and equity prices. The objective of market risk management is to manage and control market risk exposures within acceptable parameters, while optimizing the return. (1) Currency risk Currency risk is the risk that the fair value or future cash flows of a financial instrument will fluctuate because of changes in foreign exchange rates arising from international business activities. Foreign currency risk takes place with respect to anticipated future transactions and recognized assets and liabilities and net investment in overseas sales.
The Group manages exchange rate fluctuation risk by foreign currency regulations.The objective of managing currency risk is to minimize the effect of volatility in foreign exchange rates on the Group’s profit or loss. The Group minimizes exposure to exchange rate volatility using natural hedge in its imports and exports denominated in foreign currencies. The Group also enters into derivative arrangements including foreign currency contracts and options to minimize currency risk exposure.
The Group’s exposure to foreign currency risk as at December 31, 2016 and 2015 are as follows based on notional amounts (Korean won in millions, US dollar in thousands, EUR in thousands, JPY in thousands, CAD in thousands, THB in thousands, GBP in thousands and INR in thousands):
2016 2015
Assets Liabilities Assets Liabilities
USD 92,108 8,036 109,557 11,907
EUR 659 1,125 3,497 4,200
JPY 5,940 50,733 7,146 18,274
CAD 533 - 356 -
THB 1,165 - 18,151 -
GBP - 20 - 1
INR 773 - - -
Total (conversion won) ₩ 112,738 ₩ 11,694 ₩ 133,839 ₩ 19,512 As at December 31, 2016 and 2015, the effects of a 10% strengthening or weakening of functional currency against foreign currencies other than functional currency on profit before tax are as follows (Korean won in millions):
2016 2015
10% strengthening 10% weakening 10% strengthening 10% weakeningForeign assets (A) ₩ 101,464 ₩ 124,012 ₩ 120,455 ₩ 147,223Foreign liabilities (B) 10,524 12,864 17,561 21,463(A)-(B) 90,940 111,148 102,894 125,760Book value 101,044 101,044 114,327 114,327Net effect ₩ (10,104) ₩ 10,104 ₩ (11,433) ₩ 11,433
59

Green Cross Coporation and its subsidiaries Notes to the consolidated financial statements December 31, 2016 and 2015
33. Financial risk management objectives and policies (cont’d) 33-2 Market risk (cont’d) (2) Interest rate risk Interest rate risk of the Group is mainly associated with deposits and borrowings with variable rates and the related interest income and expenses are exposed to interest rate risk. Interest rate risk mainly occurs from short-term borrowings with variable interest rates. In case of deposits and borrowings with fixed interest rate, changes in interest rates do not impact on net profit or equity.
As at December 31, 2016 and 2015, the financial assets and liabilities exposed to interest rate risk are as follows (Korean won in millions):
2016 2015
Financial assets ₩ 60,277 ₩ 55,580
Financial liabilities 19,300 62,500
A 100 basis points change in interest rates at the reporting date would have increased (decreased) profit or loss by the amounts shown below. This analysis assumes that all other variables, in particular foreign currency rates, remain constant (Korean won in millions):
2016 2015
100bp increase 100bp decrease 100bp increase 100bp decrease
Interest income ₩ 603 ₩ (603) ₩ 556 ₩ (556)
Interest expenses (193) 193 (625) 625 (3) Price risk The Group’s investments in listed entities, which are classified as available-for-sale financial assets, are exposed to market price risk where the fair value or future cash flows of those investments may change due to changes in market price. Management periodically assesses the price risk of the fair value or future cash flow in its investments in listed entities. Significant investment assets in the Group’s investment portfolio are managed individually and any acquisitions and disposals are approved by management. As at December 31, 2016 and 2015, a 5% change in market price would impact the price of listed equity instruments on other comprehensive income (gain (loss) on valuation of available-for-sale financial assets) as follows (Korean won in millions): 2016: + 5% - 5% Other comprehensive income ₩ 916 ₩ (916)Tax effect (222) 222Other comprehensive income, net of tax effect ₩ 694 ₩ (694)
2015: + 5% - 5%
Other comprehensive income ₩ 909 ₩ (909)Tax effect (220) 220Other comprehensive income, net of tax effect ₩ 689 ₩ (689)
60
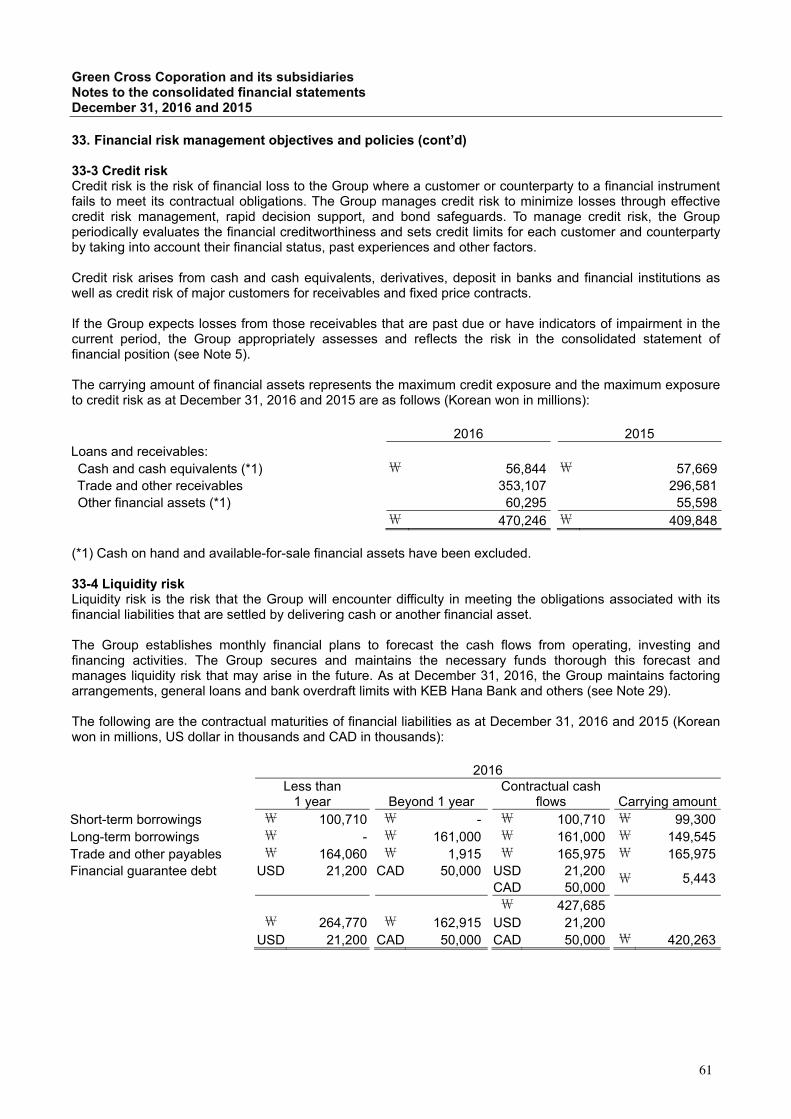
Green Cross Coporation and its subsidiaries Notes to the consolidated financial statements December 31, 2016 and 2015
33. Financial risk management objectives and policies (cont’d) 33-3 Credit risk Credit risk is the risk of financial loss to the Group where a customer or counterparty to a financial instrument fails to meet its contractual obligations. The Group manages credit risk to minimize losses through effective credit risk management, rapid decision support, and bond safeguards. To manage credit risk, the Group periodically evaluates the financial creditworthiness and sets credit limits for each customer and counterparty by taking into account their financial status, past experiences and other factors.
Credit risk arises from cash and cash equivalents, derivatives, deposit in banks and financial institutions as well as credit risk of major customers for receivables and fixed price contracts.
If the Group expects losses from those receivables that are past due or have indicators of impairment in the current period, the Group appropriately assesses and reflects the risk in the consolidated statement of financial position (see Note 5).
The carrying amount of financial assets represents the maximum credit exposure and the maximum exposure to credit risk as at December 31, 2016 and 2015 are as follows (Korean won in millions):
2016 2015
Loans and receivables: Cash and cash equivalents (*1) ₩ 56,844 ₩ 57,669Trade and other receivables 353,107 296,581Other financial assets (*1) 60,295 55,598
₩ 470,246 ₩ 409,848
(*1) Cash on hand and available-for-sale financial assets have been excluded. 33-4 Liquidity risk Liquidity risk is the risk that the Group will encounter difficulty in meeting the obligations associated with its financial liabilities that are settled by delivering cash or another financial asset.
The Group establishes monthly financial plans to forecast the cash flows from operating, investing and financing activities. The Group secures and maintains the necessary funds thorough this forecast and manages liquidity risk that may arise in the future. As at December 31, 2016, the Group maintains factoring arrangements, general loans and bank overdraft limits with KEB Hana Bank and others (see Note 29).
The following are the contractual maturities of financial liabilities as at December 31, 2016 and 2015 (Korean won in millions, US dollar in thousands and CAD in thousands):
2016 Less than
1 year
Beyond 1 year Contractual cash
flows Carrying amountShort-term borrowings ₩ 100,710 ₩ - ₩ 100,710 ₩ 99,300Long-term borrowings ₩ - ₩ 161,000 ₩ 161,000 ₩ 149,545Trade and other payables ₩ 164,060 ₩ 1,915 ₩ 165,975 ₩ 165,975Financial guarantee debt USD 21,200 CAD 50,000 USD 21,200
₩ 5,443 CAD 50,000
₩ 427,685 ₩ 264,770 ₩ 162,915 USD 21,200 USD 21,200 CAD 50,000 CAD 50,000 ₩ 420,263
61

Green Cross Coporation and its subsidiaries Notes to the consolidated financial statements December 31, 2016 and 2015
33. Financial risk management objectives and policies (cont’d) 33-4 Liquidity risk (cont’d)
2015
Less than 1 year
Beyond 1 year
Contractual cash flows Carrying amount
Short-term borrowings ₩ 59,631 ₩ - ₩ 59,631 ₩ 58,686Long-term borrowings ₩ - ₩ 77,128 ₩ 77,128 ₩ 74,000Trade and other payables ₩ 188,735 ₩ 1,405 ₩ 190,140 ₩ 190,140Financial guarantee debt USD 6,400 ₩ - USD 6,400 ₩ 40 ₩ 248,366 ₩ 326,899 USD 6,400 ₩ 78,533 USD 6,400 ₩ 322,866 33-5 Capital management The purpose of capital risk management of the Group is to maintain a optimal capital structure to reduce cost of capital and protect ability to provide benefits constantly to shareholders and interested parties as going concern.
The Group maintains and adjusts capital structure through measures such as adjusting dividends to shareholders, returning capital to shareholders or reducing liability by issuing new shares or disposal of assets. The Group also conducts capital risk management based on debt to equity ratio which is the common method within the industry. Debt ratio is calculated by dividing total equity from total liabilities and net borrowings ratio is calculated by dividing total equity from net borrowing deducting cash and deposits from borrowings and debts.
As at December 31, 2016 and 2015, debt ratio and net borrowings ratio are as follows (Korean won in millions):
2016 2015 Total liabilities (A) ₩ 491,604 ₩ 417,424Total equity (B) 1,059,011 997,704Cash and deposits (C) 117,215 113,334Borrowings (D) 248,845 132,686Debt ratio (A/B) 46.42% 41.84%Net borrowings ratio (D-C)/B 12.43% 1.94% 34. Category of financial instruments
Details of financial assets by category as at December 31, 2016 and 2015 are as follows (Korean won in millions):
2016
Loans and receivables
Available-for-sale
financial assetsOther financial
liabilities
Book value
Fair value
Cash and cash equivalents ₩ 56,920 ₩ - ₩ - ₩ 56,920 ₩ 56,920
Trade and other receivables 353,107 - - 353,107 353,107
Other financial assets 60,295 26,078 - 86,373 86,373
Trade and other payables - - (165,975) (165,975) (165,975)
Short-term borrowings - - (99,300) (99,300) (99,300)
Long-term borrowings - - (149,545) (149,545) (149,545)
Other financial liabilities - - (7,130) (7,130) (7,130)
62

Green Cross Coporation and its subsidiaries Notes to the consolidated financial statements December 31, 2016 and 2015
Financial guarantee debt - - (5,443) (5,443) (5,443)
₩ 470,322 ₩ 26,078 ₩ (427,393) ₩ 69,007 ₩ 69,007
34. Category of financial instruments (cont’d) 2015
Loans and receivables
Available-for-sale
financial assetsOther financial
liabilities
Book value
Fair value
Cash and cash equivalents ₩ 57,736 ₩ - ₩ - ₩ 57,736 ₩ 57,736
Trade and other receivables 296,581 - - 296,581 296,581
Other financial assets 55,598 26,022 - 81,620 81,620
Trade and other payables - - (190,140) (190,140) (190,140)
Short-term borrowings - - (58,686) (58,686) (58,686)
Long-term borrowings - - (74,000) (74,000) (74,000)
Other financial liabilities - - (6,921) (6,921) (6,921)
Financial guarantee debt - - (40) (40) (40)
₩ 409,915 ₩ 26,022 ₩ (329,787) ₩ 106,150 ₩ 106,150
As at December 31, 2016 and 2015, the carrying amount of those financial instruments recorded at amortized cost is a reasonable estimate of its fair value and therefore the amortized cost is presented as its fair value. Also, unlisted equity instruments for available-for-sale equity investments that do not have a quoted market price in an active market and whose fair value cannot be reliably measured are measured at cost.
Details of gain on financial instruments by category for the years ended December 31, 2016 and 2015 are as follows (Korean won in millions): 2016
Loans and receivables
Other financial assets
Available-for-sale financial assets Total
Other income: Gain on foreign currency transactions \ 7,083 \ - \ - \ 7,083Gain on foreign currency translation 2,066 - - 2,066
Finance income: Interest income 928 - - 928Dividend income - - 153 153Gain on foreign currency
transactions - 2,926 - 2,926Gain on foreign currency translation 1,500 250 - 1,750Gain on derivative transactions - - - -Gain on disposal of available-for-sale financial assets - - 171 171
\ 11,577 \ 3,176 \ 324 \ 15,077
63

Green Cross Coporation and its subsidiaries Notes to the consolidated financial statements December 31, 2016 and 2015
34. Category of financial instruments (cont’d) 2015
Financial assetsat fair value
through profit or loss
Loans and receivables
Other financial assets
Available-for -sale
financial assets
Total Other income:
Gain on foreign currency transactions \ - \ 6,427 \ - \ - \ 6,427Gain on foreign currency translation - 477 - - 477
Finance income: Interest income - 778 - - 778Dividend income - - - 354 354Gain on foreign currency
transactions - - 3,513 -
3,513Gain on foreign currency translation - 341 2,283 - 2,624Gain on derivative transactions 150 - - - 150Gain on disposal of available-for-sale financial assets - - - 14,163
14,163
\ 150 \ 8,023 \ 5,796 \ 14,517 \ 28,486
Details of loss on financial instruments by category for the years ended December 31, 2016 and 2015 are as follows (Korean won in millions):
2016
Loans and receivables
Other financialliabilities
Available-for-sale financial
assets
Total
Selling and administrative expenses:
Allowance for doubtful accounts ₩ 1,090 ₩ - ₩ - ₩ 1,090
Other expenses:
Other allowance for doubtful accounts 1 - - 1
Loss on foreign currency transactions 5,226 - - 5,226
Loss on foreign currency translation - 405 - 405
Finance costs:
Interest expenses - 5,386 - 5,386
Loss on foreign currency transactions - 828 - 828
Loss on foreign currency translation - - - -Loss on disposal of available-for-sale financial assets
- - - -
Impairment loss on available-for-sale financial assets
- - 83 83
Other comprehensive loss: Loss on valuation of available-for-sale financial assets - - 218 218
₩ 6,317 ₩ 6,619 ₩ 301 ₩ 13,237
64

Green Cross Coporation and its subsidiaries Notes to the consolidated financial statements December 31, 2016 and 2015
34. Category of financial instruments (cont’d) 2015
Loans and receivables
Other financialliabilities
Available-for-sale financial
assets
Total
Selling and administrative expenses:
Allowance for doubtful accounts ₩ 200 ₩ - ₩ - ₩ 200
Other expenses:
Other allowance for doubtful accounts 23 - - 23
Loss on foreign currency transactions 4,087 - - 4,087
Loss on foreign currency translation 102 232 - 334Finance costs:
Interest expenses - 5,015 - 5,015
Loss on foreign currency transactions - 586 - 586
Loss on foreign currency translation - 66 - 66Loss on disposal of available-for-sale financial assets
- - 2 2
Impairment loss on available-for-sale financial assets
- - 4,931 4,931
Other comprehensive loss: Loss on valuation of available-for-sale financial assets - - 12,367 12,367
₩ 4,412 ₩ 5,899 ₩ 17,300 ₩ 27,611
The Group classifies fair value measurements using a fair value hierarchy that reflects the significance of the inputs used in making the measurements. The levels of fair value hierarchy are as follows (Korean won in millions):
Level Ⅰ - The quoted prices in active markets for identical assets or liabilities Level Ⅱ - The inputs that are observable for the asset or liability, either directly or indirectly
Level Ⅲ - The inputs for the asset or liability that are not based on observable market data
Level Ⅰ Level Ⅱ Level Ⅲ Total
2016
Assets that are measured at fair value: Available-for-sale financial assets ₩ 18,314 ₩ - ₩ 7,764 ₩ 26,078
Assets for which the fair valuehave been disclosed: Cash and cash equivalents 76 56,844 - 56,920Trade and other receivables - - 353,107 353,107Other financial assets - 60,295 - 60,295
Liabilities for which the fair value have been disclosed:
Trade and other payables - - 165,975 165,975Short-term borrowings - 99,300 - 99,300Long-term borrowings - 149,545 - 149,545Other financial liabilities - - 7,130 7,130Financial guarantee debt - - 5,443 5,443
The available-for-sale financial assets at level Ⅲ were classified to levelⅠas Bioleaders Corp. was listed on KOSDAQ in 2016.
65

Green Cross Coporation and its subsidiaries Notes to the consolidated financial statements December 31, 2016 and 2015
34. Category of financial instruments (cont’d)
Level Ⅰ Level Ⅱ Level Ⅲ Total
2015
Assets that are measured at fair value: Available-for-sale financial assets ₩ 18,176 ₩ - ₩ 7,846 ₩ 26,022
Assets for which the fair valuehave been disclosed: Cash and cash equivalents 67 57,669 - 57,736Trade and other receivables - - 296,581 296,581Other financial assets - 55,598 - 55,598
Liabilities for which the fair value have been disclosed:
Trade and other payables - - 190,140 190,140Short-term borrowings - 58,686 - 58,686Long-term borrowings - 74,000 - 74,000Other financial liabilities - - 6,921 6,921Financial guarantee debt - - 40 40
Fair values The Group measured the fair value of financial instruments as follows:
(1) Current assets and liabilities
As the maturities of current assets and liabilities are short-term, their fair value approximates their carrying amounts.
(2) Trade and other receivables The fair value of trade and other receivables is determined as the present value of estimated future cash flows discounted at the current market rate. The fair value is calculated for the disclosures in the notes. In addition, the fair value of current receivables approximates their carrying amounts.
(3) Equity and debt investments The fair value of available-for-sale financial assets traded within the market is measured at the closing bid price quoted at the end of the reporting period. The fair value of unquoted investments is measured by the valuation results from an external valuer.
(4) Non-derivative financial liabilities The fair value of other financial liabilities approximates present value of discounted cash flows as at the end of the reporting period.
Factored financial assets with recourse as at December 31, 2016 and 2015 are as follows (Korean won in millions):
2016 2015 Book value of assets ₩ - ₩ 186Book value of associated liabilities - 186Factored liabilities with recourse:
Fair value of assets - 186Fair value of associated liabilities - 186
₩ - ₩ -
The Group transacts on D/A(Document against Acceptance) and Usance with recourse until contract maturities.
66
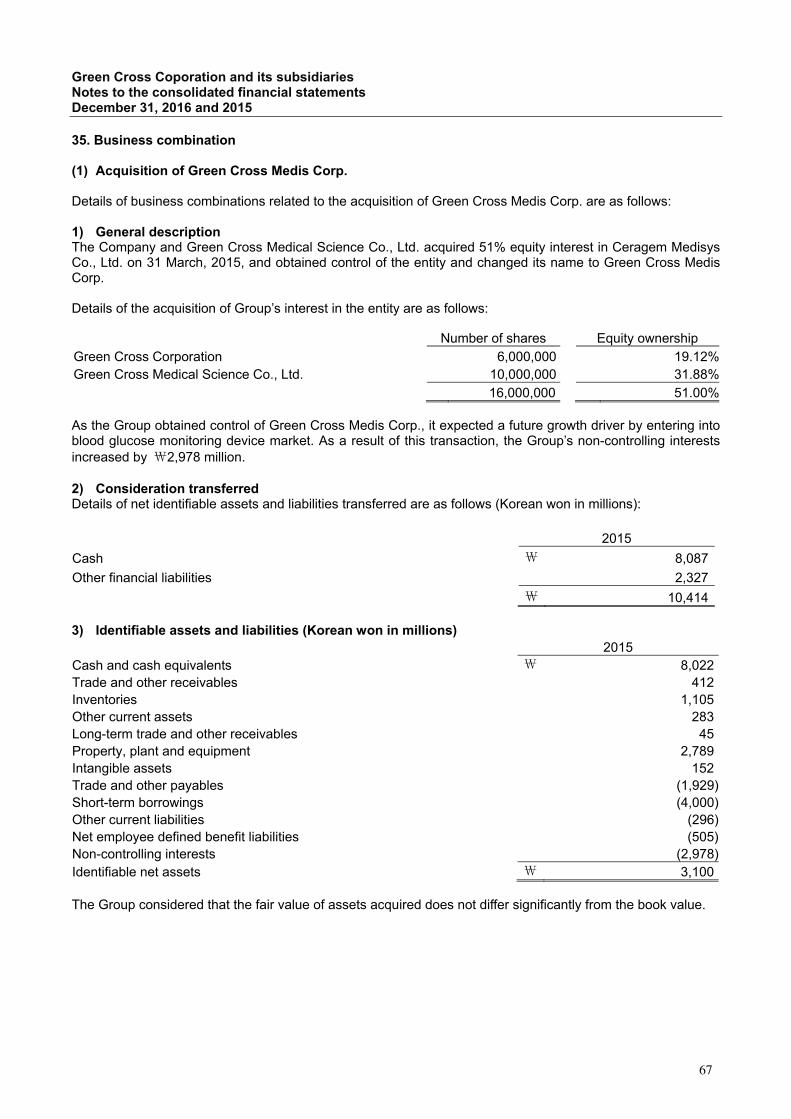
Green Cross Coporation and its subsidiaries Notes to the consolidated financial statements December 31, 2016 and 2015
35. Business combination
(1) Acquisition of Green Cross Medis Corp. Details of business combinations related to the acquisition of Green Cross Medis Corp. are as follows: 1) General description The Company and Green Cross Medical Science Co., Ltd. acquired 51% equity interest in Ceragem Medisys Co., Ltd. on 31 March, 2015, and obtained control of the entity and changed its name to Green Cross Medis Corp. Details of the acquisition of Group’s interest in the entity are as follows:
Number of shares Equity ownership Green Cross Corporation 6,000,000 19.12%Green Cross Medical Science Co., Ltd. 10,000,000 31.88%
16,000,000 51.00% As the Group obtained control of Green Cross Medis Corp., it expected a future growth driver by entering into blood glucose monitoring device market. As a result of this transaction, the Group’s non-controlling interests increased by ₩2,978 million. 2) Consideration transferred Details of net identifiable assets and liabilities transferred are as follows (Korean won in millions):
2015
Cash ₩ 8,087
Other financial liabilities 2,327
₩ 10,414 3) Identifiable assets and liabilities (Korean won in millions)
2015 Cash and cash equivalents ₩ 8,022Trade and other receivables 412Inventories 1,105Other current assets 283Long-term trade and other receivables 45Property, plant and equipment 2,789Intangible assets 152Trade and other payables (1,929)Short-term borrowings (4,000)Other current liabilities (296)Net employee defined benefit liabilities (505)Non-controlling interests (2,978)Identifiable net assets ₩ 3,100 The Group considered that the fair value of assets acquired does not differ significantly from the book value.
67

Green Cross Coporation and its subsidiaries Notes to the consolidated financial statements December 31, 2016 and 2015
35. Business combination (cont’d) 4) Goodwill (Korean won in millions)
2015
Total value of consideration transferred ₩ 10,414Book value of net assets (3,100)Goodwill ₩ 7,314 5) Other arrangements When the Group acquired equity interest in Green Cross Medis Corp., it granted a put option to Ceragem Co., Ltd., a seller. Details of the put option are as follows: Shares Ordinary shares of Green Cross Medis Corp.
Date of contract January 27, 2015 Debtors Green Cross Corporation, Green Cross Medical Science Co., Ltd. Holders Ceragem Co., Ltd. Terms of exercise, Exercise prices, Life of options
1) If Medical Science Co., Ltd. and Green Cross Medis Corp. are not merged in 3 years after the date of granting the put option, debtors should pay a put option holder the greater of ₩7.4 billion and the fair value of equity investment in Green Cross Medis Corp. within 3 months after 3 years have passed after the date of granting the put option 2) If the fair value of equity investment in Green Cross Medis Corp. is lessthan ₩7.4 billion upon merger, debtors should pay the put option holder₩7.4 billion within 3 months after the merger registration date
Exercisable number of shares 14,825,475 The put option was evaluated by an outside appraisal agency using the binomial option pricing model whose input variables were stock price, risk-free interest rate, and volatility, and the Company recorded the fair market value of the put option at the acquisition date, which amounted to ₩2,327 million, as other financial liabilities. The Group reclassified the difference between the present value of the exercise price of the put option and the fair value of the put option from equity to liabilities. As a result of this transaction, other non-current liabilities increased by ₩4,441 million and share premium decreased by ₩4,441 million. (2) Merger between subsidiaries Green Cross Wellbeing Co., Ltd. mergered with Green Cross HS Co., Ltd. on October 31, 2015, at a share exchange ratio of 1:0.056456. Total new shares issued resulting from the business combination totals 212,608. Significant details on Green Cross Wellbeing Co., Ltd. and Green Cross HS Co., Ltd., respectively, the acquirer and acquiree to the business combination are as follows:
Acquirer Acquiree Name of company Green Cross Wellbeing Co., Ltd. Green Cross HS Co., Ltd. Date of establishment September 2, 2004 May 26, 2000 Chief Executive Officer Yong Jun Huh Young Hyo Yoo
Principal activity Manufacture and sale of pharmaceutical products
Ginseng production and sale
68
Green Cross Coporation and its subsidiaries Notes to the consolidated financial statements December 31, 2016 and 2015
35. Business combination (cont’d) Significant financial information of the subsidiaries as at and for the year ended October 31, 2015 (prior to the business combination) is as follows (Korean won in millions): 1) Statements of financial position
Green Cross WB Co., Ltd. Green Cross HS Co., Ltd.
Current assets ₩ 14,227 ₩ 2,241Non-current assets 2,295 870Total assets ₩ 16,522 ₩ 3,111
Current liabilities 1,431 686Non-current liabilities 480 246Total liabilities 1,911 932Issued capital 4,869 1,130Share premium 4,111 50Retained earnings 5,669 999Other components of equity (38) -Total equity 14,611 2,179Total liabilities and equity ₩ 16,522 ₩ 3,111 2) Statements of comprehensive income
Green Cross WB Co., Ltd. Green Cross HS Co., Ltd.
Sales ₩ 6,431 ₩ 7,527
Cost of sales 4,593 6,244
Gross profit 1,838 1,283
Selling and administrative expenses 1,269 2,021
Operating profit (loss) 569 (738)
Net other income and expenses 46 (15)
Finance income and costs 324 14
Profit (loss) before income tax 939 (739)
Income tax expense (benefit) 181 (12)
Profit (loss) for the year 758 (727)
Other comprehensive income 62 1
Total comprehensive income (loss) ₩ 820 ₩ (726)
69