keyspan corporation and subsidiaries
TRANSCRIPT
1
KeySpan Corporation and Subsidiaries Consolidated Financial Statements For the years ended March 31, 2011 and March 31, 2010
2
KEYSPAN CORPORATION AND SUBSIDIARIES
TABLE OF CONTENTS
Page No.
Report of Independent Auditors …………………………………………………………………………………………… 2
Consolidated Balance Sheets…………………………………………………………………………………………… 3
March 31, 2011 and March 31, 2010
Consolidated Statements of Income…………………………………………………………………………………………… 5
Years Ended March 31, 2011 and March 31, 2010
Consolidated Statements of Cash Flows……………………………………………………………………………………………6
Years Ended March 31, 2011 and March 31, 2010
Consolidated Statements of Comprehensive Income……………………………………………………………………………………………7
Years Ended March 31, 2011 and March 31, 2010
Consolidated Statements of Retained Earnings……………………………………………………………………………………………7
Years Ended March 31, 2011 and March 31, 2010
Consolidated Statements of Capitalization……………………………………………………………………………………………8
March 31, 2011 and March 31, 2010
Notes to Consolidated Financial Statements …………………………………………………….……………………………………9

PricewaterhouseCoopers LLP,T: (646) 471 3000, F: (813) 286 600
To the Stockholder and Board of Directors ofKeySpan Corporation:
In our opinion, the accompanying consolidated balance sheets and the related consolidatedstatements of income, comprehensive income, retained earnings, capitalization and cash flowspresent fairly, in all material respects, the financial position ofsubsidiaries at March 31, 2011 and March 31, 2010, and the results of their operations and their cashflows for the years then ended in conformity with accounting principles generally accepted in theUnited States of America. Thesemanagement. Our responsibility is to express an opinion on these financial statements based on ouraudits. We conducted our audits of these statements in accordance with auditing standardsgenerally accepted in the United States of America. Those standards require that we plan andperform the audit to obtain reasonable assurance about whether the financial statements are free ofmaterial misstatement. An audit includes examining, on a test basamounts and disclosures in the financial statements, assessing the accounting principles used andsignificant estimates made by management, and evaluating the overall financial statementpresentation. We believe that our audits
July 8, 2011
PricewaterhouseCoopers LLP, PricewaterhouseCoopers Center, 300 Madison Avenue, New York, NY 10017T: (646) 471 3000, F: (813) 286 6000, www.pwc.com/us
Report of Independent Auditors
and Board of Directors of
In our opinion, the accompanying consolidated balance sheets and the related consolidatedstatements of income, comprehensive income, retained earnings, capitalization and cash flowspresent fairly, in all material respects, the financial position of KeySpan Corporationsubsidiaries at March 31, 2011 and March 31, 2010, and the results of their operations and their cashflows for the years then ended in conformity with accounting principles generally accepted in theUnited States of America. These financial statements are the responsibility of the Company’smanagement. Our responsibility is to express an opinion on these financial statements based on ouraudits. We conducted our audits of these statements in accordance with auditing standards
rally accepted in the United States of America. Those standards require that we plan andperform the audit to obtain reasonable assurance about whether the financial statements are free ofmaterial misstatement. An audit includes examining, on a test basis, evidence supporting theamounts and disclosures in the financial statements, assessing the accounting principles used andsignificant estimates made by management, and evaluating the overall financial statementpresentation. We believe that our audits provide a reasonable basis for our opinion.
300 Madison Avenue, New York, NY 10017
In our opinion, the accompanying consolidated balance sheets and the related consolidatedstatements of income, comprehensive income, retained earnings, capitalization and cash flows
an Corporation and itssubsidiaries at March 31, 2011 and March 31, 2010, and the results of their operations and their cashflows for the years then ended in conformity with accounting principles generally accepted in the
financial statements are the responsibility of the Company’smanagement. Our responsibility is to express an opinion on these financial statements based on ouraudits. We conducted our audits of these statements in accordance with auditing standards
rally accepted in the United States of America. Those standards require that we plan andperform the audit to obtain reasonable assurance about whether the financial statements are free of
is, evidence supporting theamounts and disclosures in the financial statements, assessing the accounting principles used andsignificant estimates made by management, and evaluating the overall financial statement
provide a reasonable basis for our opinion.
4
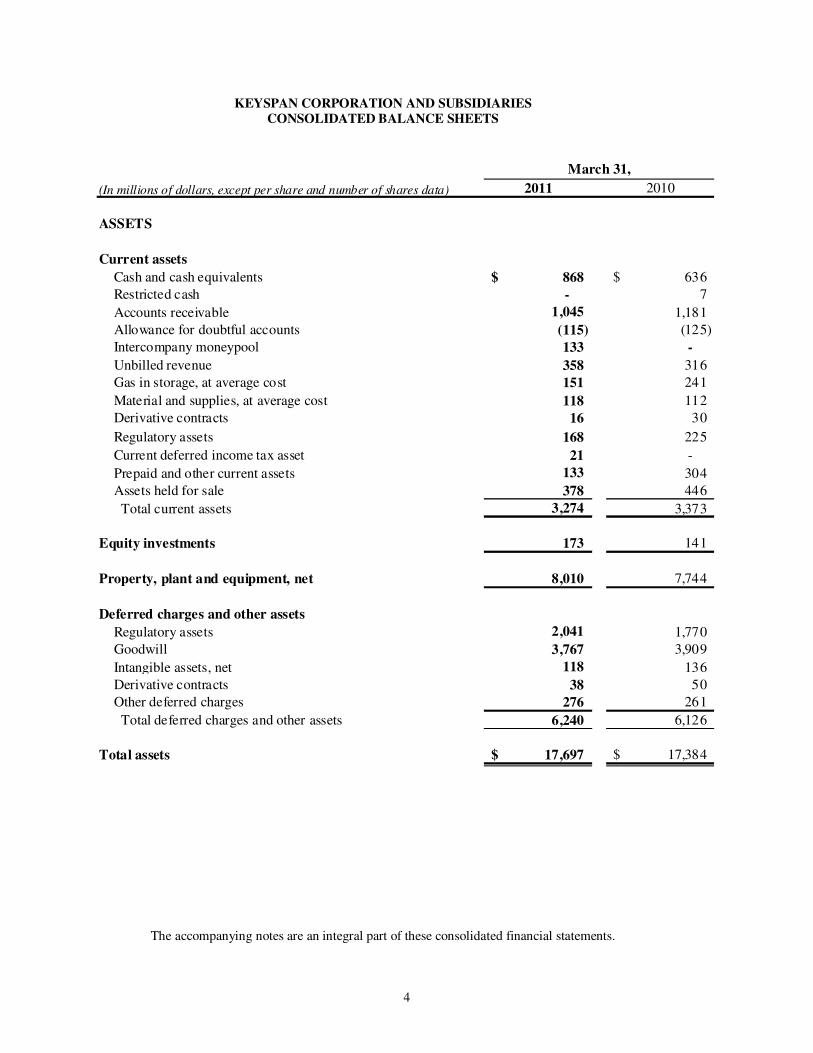
KEYSPAN CORPORATION AND SUBSIDIARIES CONSOLIDATED BALANCE SHEETS
(In millions of dollars, except per share and number of shares data) 2011 2010
ASSETS
Current assets
Cash and cash equivalents 868$ 636$
Restricted cash - 7
Accounts receivable 1,045 1,181
Allowance for doubtful accounts (115) (125)
Intercompany moneypool 133 -
Unbilled revenue 358 316
Gas in storage, at average cost 151 241
Material and supplies, at average cost 118 112
Derivative contracts 16 30
Regulatory assets 168 225
Current deferred income tax asset 21 -
Prepaid and other current assets 133 304
Assets held for sale 378 446
Total current assets 3,274 3,373
Equity investments 173 141
Property, plant and equipment, net 8,010 7,744
Deferred charges and other assets
Regulatory assets 2,041 1,770
Goodwill 3,767 3,909
Intangible assets, net 118 136
Derivative contracts 38 50
Other deferred charges 276 261
Total deferred charges and other assets 6,240 6,126
Total assets 17,697$ 17,384$
March 31,
The accompanying notes are an integral part of these consolidated financial statements.
5
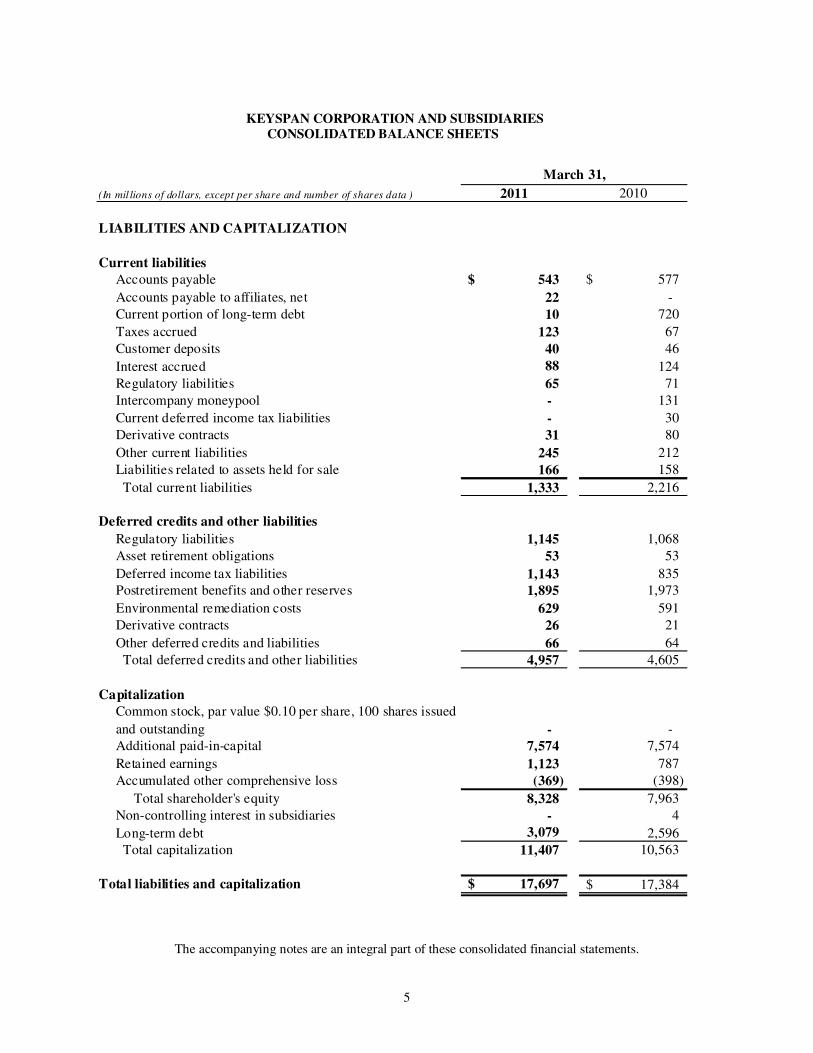
KEYSPAN CORPORATION AND SUBSIDIARIES
CONSOLIDATED BALANCE SHEETS
(In mil lions of dollars, except per share and number of shares data ) 2011 2010
LIABILITIES AND CAPITALIZATION
Current liabilities
Accounts payable 543$ 577$
Accounts payable to affiliates, net 22 -
Current portion of long-term debt 10 720
Taxes accrued 123 67
Customer deposits 40 46
Interest accrued 88 124
Regulatory liabilities 65 71
Intercompany moneypool - 131
Current deferred income tax liabilities - 30
Derivative contracts 31 80
Other current liabilities 245 212
Liabilities related to assets held for sale 166 158
Total current liabilities 1,333 2,216
Deferred credits and other liabilities
Regulatory liabilities 1,145 1,068
Asset retirement obligations 53 53
Deferred income tax liabilities 1,143 835
Postretirement benefits and other reserves 1,895 1,973
Environmental remediation costs 629 591
Derivative contracts 26 21
Other deferred credits and liabilities 66 64
Total deferred credits and other liabilities 4,957 4,605
Capitalization
Common stock, par value $0.10 per share, 100 shares issued
and outstanding - -
Additional paid-in-capital 7,574 7,574
Retained earnings 1,123 787
Accumulated other comprehensive loss (369) (398)
Total shareholder's equity 8,328 7,963
Non-controlling interest in subsidiaries - 4
Long-term debt 3,079 2,596
Total capitalization 11,407 10,563
Total liabilities and capitalization 17,697$ 17,384$
March 31,
The accompanying notes are an integral part of these consolidated financial statements.
6
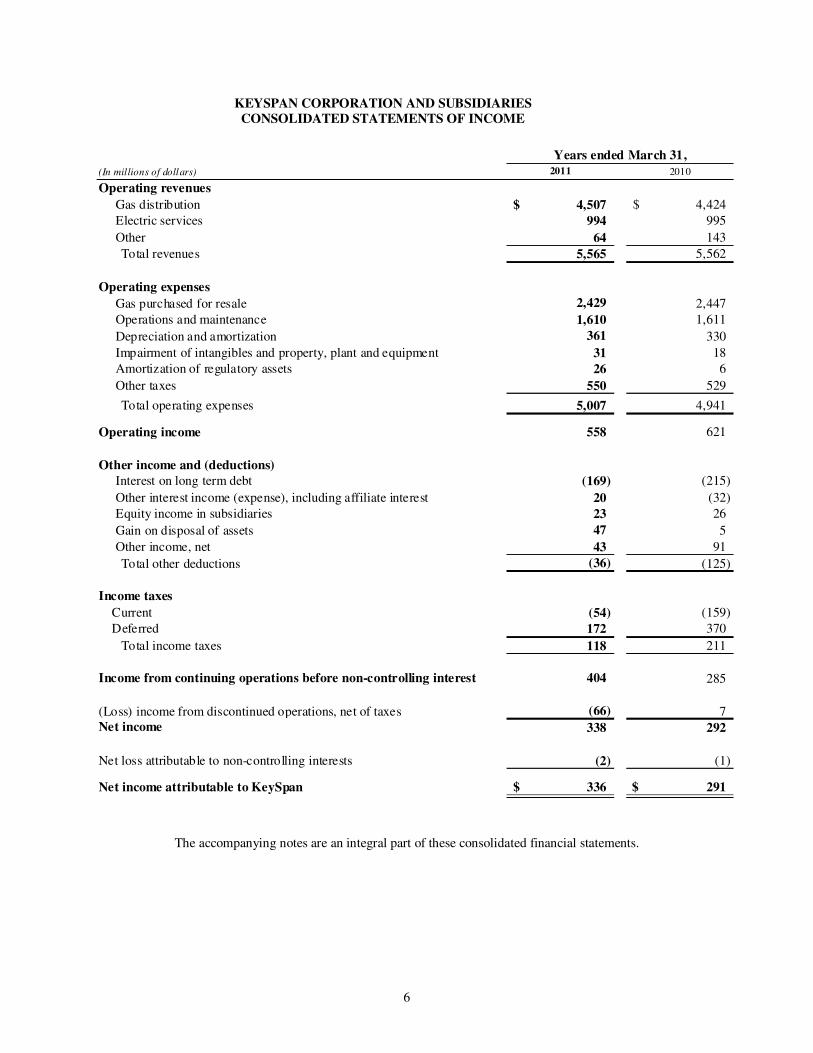
KEYSPAN CORPORATION AND SUBSIDIARIES CONSOLIDATED STATEMENTS OF INCOME
(In millions of dollars) 2011 2010
Operating revenues
Gas distribution 4,507$ 4,424$
Electric services 994 995
Other 64 143
Total revenues 5,565 5,562
Operating expenses
Gas purchased for resale 2,429 2,447
Operations and maintenance 1,610 1,611
Depreciation and amortization 361 330
Impairment of intangibles and property, plant and equipment 31 18
Amortization of regulatory assets 26 6
Other taxes 550 529
Total operating expenses 5,007 4,941
Operating income 558 621
Other income and (deductions) Interest on long term debt (169) (215)
Other interest income (expense), including affiliate interest 20 (32)
Equity income in subsidiaries 23 26
Gain on disposal of assets 47 5
Other income, net 43 91
Total other deductions (36) (125)
Income taxes
Current (54) (159)
Deferred 172 370
Total income taxes 118 211
Income from continuing operations before non-controlling interest 404 285
(Loss) income from discontinued operations, net of taxes (66) 7 Net income 338 292
Net loss attributable to non-controlling interests (2) (1)
Net income attributable to KeySpan 336$ 291$
Years ended March 31,
The accompanying notes are an integral part of these consolidated financial statements.
7
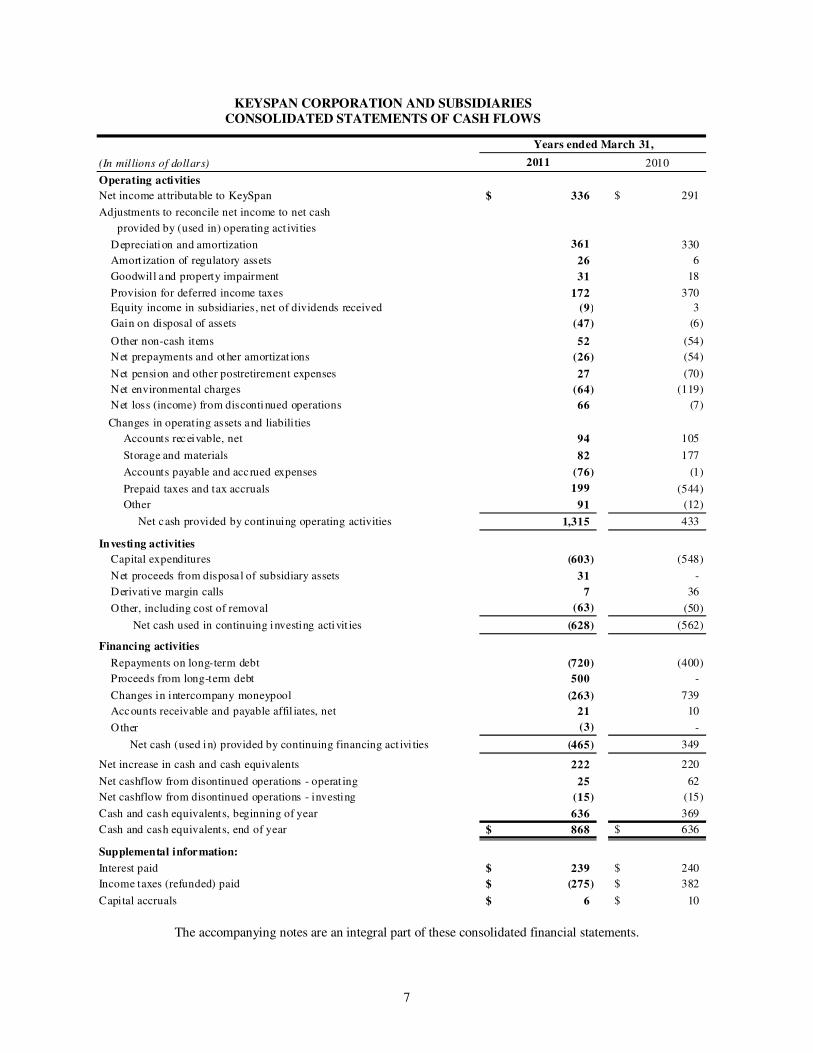
KEYSPAN CORPORATION AND SUBSIDIARIES CONSOLIDATED STATEMENTS OF CASH FLOWS
(In millions of dollars) 2011 2010
Operating activities
Net income attributable to KeySpan 336$ 291$
Adjustments to reconcile net income to net cash
provided by (used in) opera ting act ivities
Depreciation and amortization 361 330
Amort ization of regulatory assets 26 6
Goodwill and property impairment 31 18
Provision for deferred income taxes 172 370
Equity income in subsidiaries, net of dividends received (9) 3
Gain on disposal of assets (47) (6)
Other non-cash items 52 (54)
Net prepayments and other amortizat ions (26) (54)
Net pension and other postretirement expenses 27 (70)
Net environmental charges (64) (119)
Net loss (income) from discontinued operations 66 (7)
Changes in operating assets and liabilities
Accounts receivable, net 94 105
Storage and materials 82 177
Accounts payable and accrued expenses (76) (1)
Prepaid taxes and tax accruals 199 (544)
Other 91 (12)
Net cash provided by continuing operating activities 1,315 433
Investing activities
Capital expenditures (603) (548)
Net proceeds from disposa l of subsidiary assets 31 -
Derivative margin calls 7 36
Other, including cost of removal (63) (50)
Net cash used in continuing investing activit ies (628) (562)
Financing activities
Repayments on long-term debt (720) (400)
Proceeds from long-term debt 500 -
Changes in intercompany moneypool (263) 739
Accounts receivable and payable affil iates, net 21 10
Other (3) -
Net cash (used in) provided by continuing financing act ivi ties (465) 349
Net increase in cash and cash equivalents 222 220
Net cashflow from disontinued operations - operat ing 25 62
Net cashflow from disontinued operations - investing (15) (15)
Cash and cash equivalents, beginning of year 636 369
Cash and cash equivalents, end of year 868$ 636$
Supplemental information:
Interest paid 239$ 240$
Income taxes (refunded) paid (275)$ 382$
Capital accruals 6$ 10$
Years ended March 31,
The accompanying notes are an integral part of these consolidated financial statements.
8
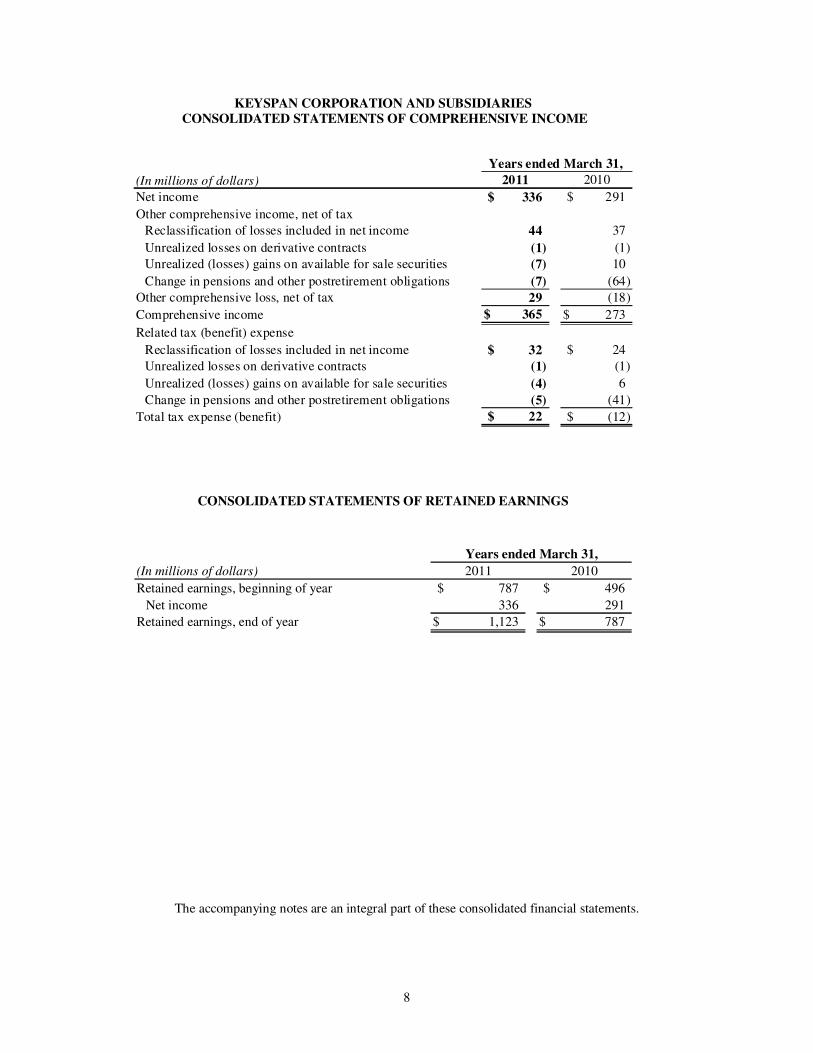
KEYSPAN CORPORATION AND SUBSIDIARIES CONSOLIDATED STATEMENTS OF COMPREHENSIVE INCOME
Years ended March 31,
(In millions of dollars) 2011 2010
Net income 336$ 291$
Other comprehensive income, net of tax
Reclassification of losses included in net income 44 37
Unrealized losses on derivative contracts (1) (1)
Unrealized (losses) gains on available for sale securities (7) 10
Change in pensions and other postretirement obligations (7) (64)
Other comprehensive loss, net of tax 29 (18)
Comprehensive income 365$ 273$
Related tax (benefit) expense
Reclassification of losses included in net income 32$ 24$
Unrealized losses on derivative contracts (1) (1)
Unrealized (losses) gains on available for sale securities (4) 6
Change in pensions and other postretirement obligations (5) (41)
Total tax expense (benefit) 22$ (12)$
CONSOLIDATED STATEMENTS OF RETAINED EARNINGS
(In millions of dollars) 2011 2010
Retained earnings, beginning of year 787$ 496$
Net income 336 291
Retained earnings, end of year 1,123$ 787$
Years ended March 31,
The accompanying notes are an integral part of these consolidated financial statements.
9
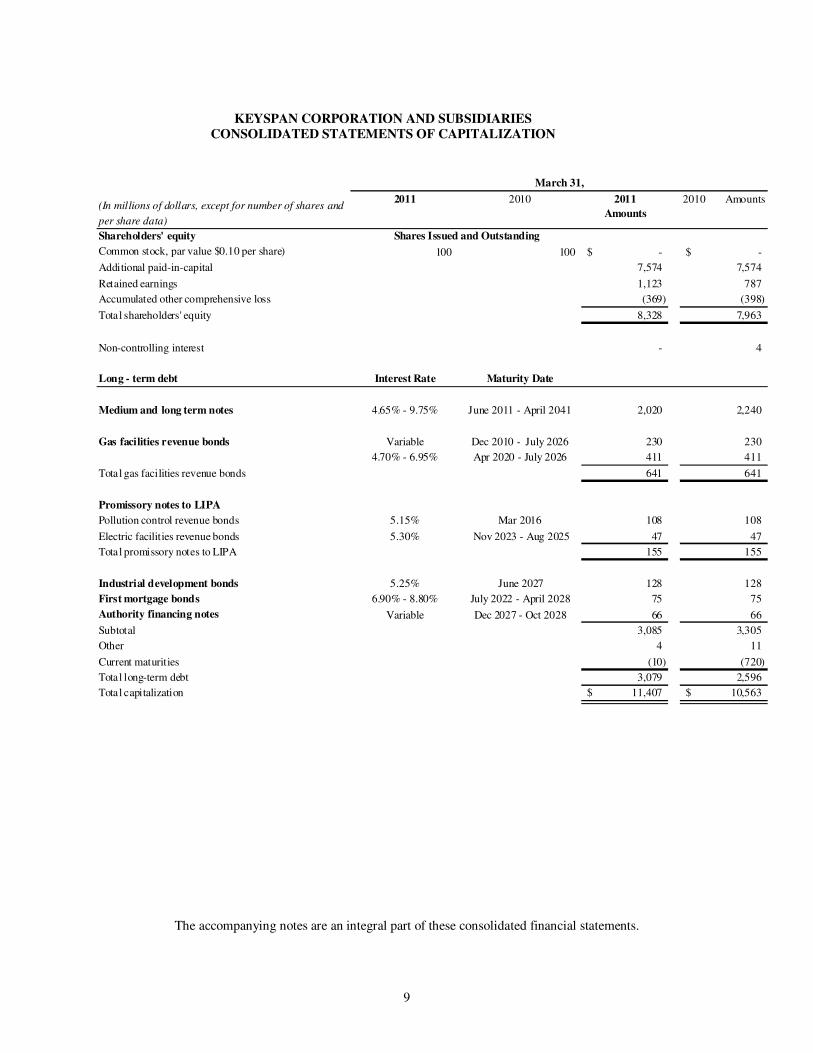
KEYSPAN CORPORATION AND SUBSIDIARIES
CONSOLIDATED STATEMENTS OF CAPITALIZATION
(In millions of dollars, except for number of shares and
per share data)
2011 2010 2011
Amounts
2010 Amounts
Shareholders' equity
Common stock, par value $0.10 per share) 100 100 -$ -$
Additional paid-in-capital 7,574 7,574
Retained earnings 1,123 787
Accumulated other comprehensive loss (369) (398)
Total shareholders' equity 8,328 7,963
Non-controlling interest - 4
Long - term debt Interest Rate Maturity Date
Medium and long term notes 4.65% - 9.75% June 2011 - April 2041 2,020 2,240
Gas facilities revenue bonds Variable Dec 2010 - July 2026 230 230
4.70% - 6.95% Apr 2020 - July 2026 411 411
Total gas facilities revenue bonds 641 641
Promissory notes to LIPA
Pollution control revenue bonds 5.15% Mar 2016 108 108
Electric facilities revenue bonds 5.30% Nov 2023 - Aug 2025 47 47
Total promissory notes to LIPA 155 155
Industrial development bonds 5.25% June 2027 128 128
First mortgage bonds 6.90% - 8.80% July 2022 - April 2028 75 75
Authority financing notes Variable Dec 2027 - Oct 2028 66 66
Subtotal 3,085 3,305
Other 4 11
Current maturities (10) (720)
Total long-term debt 3,079 2,596
Total capitalization 11,407$ 10,563$
Shares Issued and Outstanding
March 31,
The accompanying notes are an integral part of these consolidated financial statements.
10
KEYSPAN CORPORATION AND SUBSIDIARIES NOTES TO THE CONSOLIDATED FINANCIAL STATEMENTS Note 1. Summary of Significant Accounting Policies
A. Nature of Operations KeySpan Corporation (referred to as “KeySpan”, the “Company”, “we”, “us” and “our”) is a public utility holding company that distributes natural gas to customers in New York City, Long Island, Massachusetts and New Hampshire. We also own and operate 53 electric generating plants in Nassau and Suffolk Counties on Long Island. Under contractual arrangements, we provide power, electric transmission and distribution services, billing and other customer services for approximately 1.1 million electric customers of the Long Island Power Authority (“LIPA”). KeySpan’s other operating subsidiaries are primarily involved in gas production and development; underground gas and liquefied natural gas storage. We also invest and participate in the development of natural gas pipelines and other energy-related projects. KeySpan is a wholly-owned subsidiary of National Grid USA (“NGUSA”), a public utility holding company with regulated subsidiaries engaged in the generation of electricity and the transmission, distribution and sale of both natural gas and electricity. NGUSA is an indirectly-owned subsidiary of National Grid plc, a public limited company incorporated under the laws of England and Wales. KeySpan had two major lines of business: “Gas Distribution” and “Electric Services” and operates various energy services and investment companies.
Gas Distribution The Gas Distribution business consists of five gas distribution subsidiaries. The Brooklyn Union Gas Company (“Brooklyn Union”) provides gas distribution services to customers in the New York City Boroughs of Brooklyn, Queens and Staten Island. KeySpan Gas East Corporation (“KeySpan Gas East”) provides gas distribution services to customers in the Long Island Counties of Nassau and Suffolk and the Rockaway Peninsula of Queens County. The remaining gas distribution subsidiaries, Boston Gas Company (“Boston Gas”), Essex Gas Company (“Essex Gas”), Colonial Gas Company (“Colonial Gas”), and EnergyNorth Natural Gas, Inc. (“Energy North”), provide gas distribution service to customers in Massachusetts and New Hampshire. Effective November 1, 2010, Essex Gas was consolidated into Boston Gas. At March 31, 2011, assets and liabilities of EneryNorth are classified as held for sale in the accompanying consolidated balance sheet pending regulatory approvals of its sale to a third party as discussed in Note 14. Electric Services The Electric Services business consists of subsidiaries that operate the electric transmission and distribution system owned by LIPA. The Company also own and provide capacity to and produce energy for LIPA from our generating facilities located on Long Island, and manage fuel supplies for LIPA to fuel our Long Island generating facilities. These services are provided in accordance with existing long-term service contracts having a remaining term of two years and power purchase agreements having remaining terms that range from two to sixteen years. The Electric Services business also conducts retail marketing of electricity to commercial customers. KeySpan derives approximately 17% of its consolidated revenues from LIPA. Other Services Energy Services business includes companies that provide energy-related services to customers located primarily within the northeastern United States. Subsidiaries provide residential and small commercial customers with service and maintenance of energy systems and appliances, as well as operation and maintenance, and design to commercial, institutional and industrial customers. Energy Investments business consists of our gas production and development investments, as well as certain other domestic energy-related investments. KeySpan’s gas production and development activities
11
include its wholly-owned subsidiary Seneca Upshur Petroleum, Inc. (“Seneca-Upshur”). Seneca-Upshur is engaged in gas production and development activities primarily in West Virginia. Additionally, through its wholly-owned subsidiary, National Grid LNG, the Company owns a 600,000 barrel liquefied natural gas storage and receiving facility in Providence, Rhode Island. The Company’s consolidated financial statements also include a 26.25% interest in Millennium Pipeline Company LLC and a 20.4% interest in Iroquois Gas Transmission System, which are accounted for under the equity method of accounting. In September 2010 the Company‘s indirectly wholly-owned subsidiary, National Grid Development
Holding's sold it’s 52.14% interest in Honeoye Storage Corporation, as discussed in Note 14.
“Discontinued Operations and Other Dispositions “.
Under our holding company structure, we have no independent operations or source of income of our own and conduct all of our operations through our subsidiaries and, as a result, we depend on the earnings and cash flow of, and dividends or distributions from, our subsidiaries to provide the funds necessary to meet our debt and contractual obligations. Furthermore, a substantial portion of our consolidated assets, earnings and cash flow is derived from the operations of our regulated utility subsidiaries, whose legal authority to pay dividends or make other distributions to us is subject to regulation by state regulatory authorities. B. Basis of Presentation
The consolidated financial statements for the years ended March 31, 2011 and March 31, 2010, are
prepared in accordance with accounting principles generally accepted in the United States of America
(“GAAP”), including the accounting principles for rate-regulated entities with respect to the Company’s
subsidiaries engaged in the transmission and distribution of gas and electricity (regulated subsidiaries), and
are in accordance with the accounting requirements and ratemaking practices of the regulatory authorities
having jurisdiction over such entities.
The preparation of financial statements in conformity with GAAP requires management to make estimates
and assumptions that affect the reported amounts of assets and liabilities and disclosure of contingent assets
and liabilities at the date of the financial statements and the reported amounts of revenues and expenses
during the reporting period. Actual results could differ from those estimates.
The consolidated financial statements include the accounts of the Company and its wholly and majority-
owned subsidiaries. Noncontrolling interests of majority-owned subsidiaries are calculated based upon the
respective noncontrolling interest ownership percentages. All material intercompany transactions have been
eliminated in consolidation.
The Company uses the equity method of accounting for its investments in affiliates, which are 50% or less
owned, as the Company has the ability to exercise significant influence over the operating and financial
policies of the affiliates but does not control the affiliate. The Company’s share of the earnings or losses of
the affiliates is included as equity income of subsidiaries in the consolidated financial statements.
C. Accounting for the Effects of Rate Regulation
The New York State Public Service Commission (“NYPSC”), the Massachusetts Department of Public Utilities (“MADPU”) and the New Hampshire Public Utilities Commission (“NHPUC”) provide the final determination of the rates we charge our customers. In certain cases, the actions of the state regulatory bodies would result in an accounting treatment different from that used by non-regulated companies to determine the rates we charge our customers. In this case, the Company is required to defer the recognition of costs (a regulatory asset) or the recognition of obligations (a regulatory liability) if it is probable that, through the rate-making process, there will be a corresponding increase or decrease in future rates. The
12
Company believes its rates are based on its costs and investments and it should continue to apply the current guidance for rate regulated enterprises. In the event the Company determines that its net regulatory assets are not probable of recovery, the Company would be required to record an after-tax, non-cash charge against income for any remaining regulatory assets and liabilities. The resulting charge could be material to the Company’s reported financial condition and results of operations. D. Revenue Recognition Gas Distribution Customers are generally billed on a monthly basis. Revenues include unbilled amounts related to the estimated gas usage that occurred from the most recent meter reading to the end of each month. The unbilled revenue at March 31, 2011 and March 31, 2010 was $358 million and $316 million, respectively. The cost of gas used is recovered when billed to firm customers through the operation of cost of gas adjustment factor (“CGAF”) included in utility tariffs. The CGAF provision requires an annual reconciliation of recoverable gas costs and revenues. Any difference is deferred pending recovery from or refund to firm customers. Further, net revenues from tariff gas balancing services, off-system sales and certain on-system interruptible sales are refunded, for the most part, to firm customers subject to certain sharing provisions. We recover the gas cost portion of bad debt write-offs through the CGAF. The gas distribution business is influenced by seasonal weather conditions. Annual revenues are principally realized during the heating season (November through April) as a result of the large proportion of heating sales in these months. Accordingly, results of operations are most favorable in the first calendar quarter of the year, followed by the fourth calendar quarter. Operating losses are generally incurred in the second and third calendar quarters. The New York and Long Island gas utility tariffs contain weather normalization adjustments that provides for recovery from, or refund to, firm customers of material shortfalls or excesses of firm delivery revenues (revenues less applicable gas costs and revenue taxes) during a heating season due to variations from normal weather as measured by heating degree days. Revenues are adjusted each month the clause is in effect. The New England gas utility rate structures contain no weather normalization feature; therefore their net revenues are subject to weather related demand fluctuations. As a result, fluctuations from normal weather may have a significant positive or negative effect on the results of these operations. Additionally, certain of our gas distribution utilities have revenue decoupling mechanisms that permit each utility company to reconcile actual revenue per customer to target revenue per customer for certain customer classes on an annual basis. The revenue decoupling mechanism is designed to eliminate the disincentive to implement energy efficiency programs. Electric Services
Electric revenues are derived from billings to LIPA for operation of LIPA’s electric distribution and transmission system and the sales of capacity and energy made under terms of the power supply agreement with rates approved by the FERC, as discuss in Note 11. “Commitments and Contingencies” under “Power Supply Agreement”. Other Revenues
Revenues earned for service and maintenance contracts associated with small commercial and residential appliances are recognized as earned or over the life of the service contract, as appropriate. E. Property, Plant and Equipment Property, plant, and equipment are stated at original cost. The cost of additions to property, plant, and equipment and replacements of retired units of property are capitalized. Costs include direct material, labor, overhead and an allowance for funds used during construction (“AFUDC”). Replacement of minor items of
13
property, plant, and equipment and the cost of current repairs and maintenance are charged to expense. Whenever property, plant, and equipment is retired, its original cost, together with cost of removal, less salvage, is charged to accumulated depreciation. F. Goodwill and Other Intangible Assets
Goodwill Goodwill represents the excess of the purchase price of a business combination over the fair value of tangible and intangible assets acquired, net of the fair value of liabilities assumed and the fair value of any non-controlling interest in the acquisition. The Company tests goodwill for impairment on an annual basis and, on an interim basis, when certain events or circumstances exist. The goodwill impairment analysis is comprised of two steps. In the first step, the Company compares the fair value of each reporting unit to its carrying value. The Company can consider both an income-based approach using projected discounted cash flows and a market-based approach using valuation multiples of comparable companies to determine fair value. The Company’s estimate of fair value of each reporting unit is based on a number of subjective factors, including: (i) the appropriate weighting of valuation approaches (income-based approach and market-based approach), (ii) estimates of the future revenue and cash flows, (iii) discount rate for estimated cash flows, (iv) selection of peer group companies for the market-based approach, (v) required levels of working capital, (vi) assumed terminal value, (vii) the time horizon of cash flow forecasts; and (viii) control premium. If the fair value of the reporting unit exceeds the carrying value of the net assets assigned to that unit, goodwill is not considered impaired and no further analysis is required to be performed. If the carrying value of the net assets assigned to the reporting unit exceeds the fair value, then a second step is performed to determine the implied fair value of the reporting unit’s goodwill. If the carrying value of a reporting unit’s goodwill exceeds its implied fair value, then an impairment charge equal to the difference is recorded. The Company utilizes a discounted cash flow approach incorporating its most recent business plan forecasts together with a projected terminal year calculation in the performance of the annual goodwill impairment test. Critical assumptions used in the Company’s analysis include a discount rate of 5.9% and a terminal year growth rate of 2.4% based upon expected long-term average growth rates. Within its calculation of forecasted returns, the Company made certain assumptions with respect to the amount of pension and environmental costs to be recovered in future periods. Should the Company not continue to receive the same level of recovery in these areas, the result could be a reduction in fair value of the Company, which in turn could give rise to an impairment of goodwill. Our forecasts assume long-term recovery and rate of returns that are in line with historical levels within the utility industry. The resulting fair value of the annual analyses determined that no adjustment of the goodwill carrying value was required for our continuing operations at March 31, 2011 and March 31, 2010. Intangible Assets Amortizable intangible assets are amortized over their estimated useful lives and reviewed for impairment on an interim basis when certain events or circumstances exist. For amortizable intangible assets, an impairment exists when the carrying amount of the intangible asset exceeds its fair value. An impairment loss will be recognized only if the carrying amount of the intangible asset is not recoverable and exceeds its fair value. Indefinite-lived intangible assets are not amortized but are reviewed annually (or more frequently when certain events or circumstances exist) for impairment. For indefinite-lived intangible assets, an impairment exists when the carrying amount exceeds its fair value.
14
G. Cash and Cash Equivalents
The Company classifies short-term investments that are highly liquid and have maturities of three months or less at the date of purchase as cash equivalents. These short-term investments are carried at cost which approximates fair value. H. Restricted Cash
Restricted cash consists of margin accounts for commodity hedging activity.
I. Income and Other Taxes
Federal and state income taxes are recorded under the current accounting provisions for the accounting and reporting of income taxes. Income taxes have been computed utilizing the asset and liability approach that requires the recognition of deferred tax assets and liabilities for the tax consequences of temporary differences by applying enacted statutory tax rates applicable to future years to differences between the financial statement carrying amounts and the tax basis of existing assets and liabilities. Deferred income taxes reflect the tax effect of net operating losses, capital losses and general business credit carryforwards and the net tax effects of temporary differences between the carrying amount of assets and liabilities for financial statement and income tax purposes, as determined under enacted tax laws and rates. The financial effect of changes in tax laws or rates is accounted for in the period of enactment. Deferred investment tax credits are amortized over the useful life of the underlying property. Additionally, the Company follows the current accounting guidance relating to uncertainty in income taxes which applies to all income tax positions reflected on the Company’s balance sheets that have been included in previous tax returns or are expected to be included in future tax returns. Other taxes in the accompanying consolidated statements of income primarily includes excise tax, property tax and payroll tax. We report our collections and payments of excise taxes on a gross basis. J. Comprehensive Income (Loss) Comprehensive income (loss) is the change in the equity of a company, not including those changes that result from shareholder transactions. While the primary component of comprehensive income (loss) is reported as net income or loss, the other components include amounts related to defined benefit pension and postretirement plans, deferred gains and losses on derivative contracts associated with hedging activity, and unrealized gains and losses associated with certain investments held as available for sale.
K. Employee Benefits The Company follows the provisions of the FASB accounting guidance related to the accounting for defined benefit pension and postretirement plans which requires employers to fully recognize all postretirement plans’ funded status on the Balance Sheet as a net liability or asset and required an offsetting adjustment to accumulated other comprehensive income in shareholders’ equity upon implementation or, in the case of regulated enterprises, to regulatory assets or liabilities. Consistent with past practice, and as required by the guidance, the Company values its pension and postretirement benefits other than pensions (“PBOP’) assets using the year-end market value of those assets. Benefit obligations are also measured at year-end.
L. Supplemental Executive Retirement Plans
KeySpan has corporate assets recorded on the Consolidated Balance Sheets representing funds designated for
Supplemental Executive Retirement Plans. These funds are invested in corporate owned life insurance policies.
KeySpan records changes in the value of these assets in accordance with Accounting for the Purchase of Life
Insurance. As such, increases and decreases in the value of these assets are recorded through earnings in the
Consolidated Statements of Income concurrent with the change in the value of the underlying assets.
15
M. Derivatives We employ derivative instruments to hedge a portion of our exposure to commodity price risk. Whenever hedge positions are in effect, we are exposed to credit risks in the event of non-performance by counter-parties to derivative contracts, as well as non-performance by the counter-parties of the transactions against which they are hedged. We believe the credit risk related to derivative instruments is no greater than that associated with the primary commodity contracts that they hedge. Commodity Derivative Instruments – Regulated Utilities
We use derivative financial instruments to reduce cash flow variability associated with the purchase price for a portion of future natural gas purchases associated with our gas distribution operations. Our strategy is to minimize fluctuations in firm gas sales prices to our regulated firm gas sales customers in our New York and New England service territories. The accounting for these derivative instruments is subject to the current accounting guidance for rate regulated enterprises. Therefore, the fair value of these derivatives is recorded as current or deferred assets and liabilities, with offsetting positions recorded as regulatory assets and regulatory liabilities on the Consolidated Balance Sheets. Gains or losses on the settlement of these contracts are initially deferred and then refunded to or collected from our firm gas sales customers consistent with regulatory requirements.
Certain of our contracts for the physical purchase of natural gas were assessed as no longer being exempt from the requirements of current accounting guidance for derivative instruments as normal purchases. As such, these contracts are recorded on the Consolidated Balance Sheets at fair market value. However, since such contracts were executed for the purchases of natural gas that is sold to regulated firm gas sales customers, and pursuant to the requirements of current accounting guidance for regulated enterprises, changes in the fair market value of these contracts are recorded as a regulatory asset or regulatory liability on the Consolidated Balance Sheets. Commodity Derivative Instruments – Hedge Accounting We also use derivative financial instruments, such as futures, options and swaps, for the purpose of hedging cash flow variability associated with forecasted purchases and sales of various energy-related commodities. All such derivative instruments are accounted for pursuant to the requirements of current accounting guidance for derivative instruments and hedging activities. With respect to those commodity derivative instruments that are designated and accounted for as cash flow hedges, the effective portion of periodic changes in the fair market value of cash flow hedges is recorded as accumulated other comprehensive income on the Consolidated Balance Sheets, while the ineffective portion of such changes in fair value is recognized in earnings. Unrealized gains and losses (on such cash flow hedges) that are recorded as accumulated other comprehensive income are subsequently reclassified into earnings concurrent when hedged transactions impact earnings. With respect to those commodity derivative instruments that are not designated as hedging instruments, such derivatives are accounted for on the Consolidated Balance Sheets at fair value, with all changes in fair value reported in earnings.
N. Fair Value Measurements
Fair value is the price that would be received to sell an asset or paid to transfer a liability in an orderly transaction between market participants at the measurement date. The following is the fair value hierarchy that prioritizes the inputs to valuation techniques used to measure fair value into three levels as follows: Level 1 — quoted prices (unadjusted) in active markets for identical assets or liabilities that a company has the ability to access as of the reporting date.; Level 2 — inputs other than quoted prices included within Level 1 that are directly observable for the asset or liability or indirectly observable through corroboration with observable market data;
16
Level 3 — unobservable inputs, such as internally-developed forward curves and pricing models for the asset or liability due to little or no market activity for the asset or liability with low correlation to observable market inputs. The asset or liability’s fair value measurement level within the fair value hierarchy is based on the lowest level of any input that is significant to the fair value measurement. Valuation techniques used maximize the use of observable inputs and minimize the use of unobservable inputs. O. Storage and Materials
Storage and materials is comprised primarily of gas in storage and materials and supplies. Gas in storage is recorded initially at average weighted cost and is expensed when delivered to customers as gas purchased for resale. Materials and supplies are recorded when purchased and expensed as used or capitalized into specific capital additions as utilized. The Company’s policy is to write off obsolete materials and supplies. The Company evaluates the value of storage and materials at the lower of cost or market. Existing rate orders allow the Company to pass through the cost of gas purchased for resale directly to the rate payers along with any applicable authorized delivery surcharge adjustments. Accordingly, the value of gas in storage does not fall below the cost to the Company. Gas costs passed through to the rate payers are subject to periodic regulatory approval and are reported periodically to the relevant regulatory authorities. P. Emission Allowance Credit
The US Environmental Protection Agency (“EPA”) issued the Clean Air Interstate Rule (“CAIR”) which was intended to permanently cap emission of sulfur dioxide (“SO2”) and nitrogen oxide (“NOx”) in 28 eastern states and the District of Columbia. The CAIR requirements were supplemental to the existing emission reductions required under the Clean Air Act. The Company has recorded an asset for its emission allowance credits of $26 million and $29 million at March 31, 2011 and 2010, respectively, which is recorded in “materials and supplies, at average cost” on the consolidated balance sheets. On a periodic basis, the emission allowance credit is reviewed for impairment at the balance sheet date the allowance could have been traded or sold in an active market. For the years ended March 31, 2011 and March 31, 2010, we reduced the inventory value resulting in a charge to “operations and maintenance” on the consolidated statements of income of $3 million and $7 million, respectively.
Q. Other Interest and Other Income Other interest expense primarily consists of interest on tax reserves, interest paid to Parent and, carrying charges on regulatory assets. Other income primarily consists of interest income and AFUDC equity. R. Change in Accounting Estimate The Company calculates its bad debt reserve on its customer accounts receivable (including purchased receivables) based on the bad debt write-offs compared to actual billed sales and transportation revenues (with a six month lag). All receivables over 360 days past due are 80% reserved. Certain identified "at risk" customers are 100% reserved. As of March 31, 2011, there were no "at risk" customers identified. Economic conditions and other factors are considered in addition to the historic write-off rate. The Company reduced the write-off rate for the year ended March, 31 2011, for improved economic conditions which were evidenced by improved collection patterns for overdue receivables. The aggregate effect of these changes in methodology for calculating the bad debt reserve resulted in a pre-tax benefit of $22 million.
17
S. Recent Accounting Pronouncements Prospective Accounting Pronouncements
In the preceding twelve months, the FASB and other authoritative bodies have issued numerous updates to GAAP. The Company has evaluated various guidelines and has deemed them as not applicable based on its nature of operations. A discussion of the more significant and relevant updates is as follows: In June 2011, the FASB issued accounting guidance that eliminated the option to present the components of other comprehensive income as part of the statement of changes in stockholders’ equity. This update seeks to improve financial statement users’ ability to understand the causes of an entity’s change in financial position and results of operations. While this update does not change the items that are reported in other comprehensive income or circumstances that require a change in comprehensive income to be reclassified to net income, the entity is now required to present reclassification adjustments from items in other comprehensive income to net income on the face of the financial statements where the components of net income and other comprehensive income are presented. Additionally, the update does not change an entity’s option to present components of other comprehensive income net of or before related tax effects. This guidance is effective for public companies for fiscal years, and interim periods within that year, beginning after December 15, 2011, and it is to be applied retrospectively. Early adoption is permitted. The Company is currently in compliance with this update and expects no impact to its financial position, results of operations and operating cash flows. In April 2011, the FASB issued accounting guidance that substantially amended existing guidance with respect to the fair value measurement topic (“the Topic”). The guidance seeks to amend the Topic in order to achieve common fair value measurement and disclosure requirements in GAAP and International Financial Reporting Standards. Consequently, the guidance changes the wording used to describe many of the requirements in GAAP for measuring fair value and for disclosing information about fair value measurements as well as changing specific applications of the Topic. Some of the amendments clarify the FASB’s intent about the application of existing fair value measurement requirements. Other amendments change a particular principle or requirement for measuring fair value or for disclosing information about fair value measurements including, but not limited to, fair value measurement of a portfolio of financial instruments, fair value measurement of premiums and discounts and additional disclosures about fair value measurements. This guidance is effective for financial statements issued for interim and annual periods beginning after December 15, 2011. The early adoption of this guidance is not permitted and can only be applied prospectively. The Company is currently determining the potential impact of the guidance on its financial position, results of operations and cash flows. In March 2011, the FASB issued updated guidance over the agreements between two entities to transfer financial assets. Prior to this update, an entity could recognize this transfer when it was deemed that the transferee had effective control over the transferred asset, specifically whether the entity has the ability to repurchase substantially the same asset based on the transferor’s collateral. This accounting update evaluates the effectiveness of the entity's control by focusing on the transferor's contractual rights and obligations as opposed to the entity’s ability to perform on those rights and obligations. This update also eliminates the requirement to demonstrate that the transferor possesses adequate collateral to fund substantially all the cost of purchasing replacement financial assets. This guidance is treated prospectively and effective for annual or interim reporting periods beginning on or after December 15, 2011. The Company does not expect adoption of this guidance to have an impact on the Company’s financial position, results of operations or cash flows. In December 2010, the FASB issued an accounting update to address inconsistencies in the application of accounting guidance related to reporting pro forma revenue and earnings of business combinations. This update is effective for entities who entered into an acquisition and whose acquisition date is on or after the beginning of the first annual reporting period beginning on or after December 15, 2010. This disclosure requires revenue and earnings of the combined entity to be disclosed as though the combination had occurred at the beginning of the prior reporting period. The supplemental disclosure related to this activity now is required to provide a description of the nature and amount of material, nonrecurring pro forma
18
adjustments directly attributable to the business combination. The Company does not expect the adoption of this guidance to have an impact on the Company’s financial position, results of operations or cash flows. In December 2010, the FASB issued an accounting update that modified the goodwill impairment procedures necessary for entities with zero or negative carrying value. The FASB created this guidance to require entities to complete Step 2 of the impairment test, which requires the entity to assess whether or not it was likely that impairment existed throughout the period. To do this, an entity should consider whether there were adverse qualitative factors throughout the period that would contribute to impairment. This update is effective for fiscal years and interim periods beginning after December 15, 2011. The Company does not expect the adoption of this guidance to have an impact on the Company’s financial position, results of operations or cash flows. Recently Adopted Accounting Pronouncements
In March 2010, the FASB issued updated guidance that provides for scope exceptions applicable to financial instrument contracts with embedded credit derivative features. This FASB guidance is effective for financial statements issued for interim periods beginning after June 15, 2010. On an ongoing basis, the Company evaluates new and existing transactions and agreements to determine whether they are derivatives, or have provisions that meet the characteristics of embedded derivatives. Those transactions designated for any of the elective accounting treatments for derivatives must meet specific, restrictive criteria, both at the time of designation and on an ongoing basis. None of the financial instrument contracts or credit agreements the Company has entered were identified and designated as meeting the criteria for derivative or embedded derivative treatment. The adoption of this guidance did not have an impact on the Company’s financial position, results of operations or cash flows. In February 2010, the FASB issued an amendment to certain recognition and disclosure requirements for events that occur after the balance sheet date but before the financial statements are issued or are available to be issued. The amendment applies to both issued financial statements and financial statements revised as a result of either a correction of an error or retrospective application of GAAP. The new provisions require non-public entities to disclose both the date that the financial statements were issued, or available to be issued, and the date the revised financial statements were issued or available to be issued. The amendment is effective for interim or annual periods ending after June 15, 2010. The adoption of this guidance did not have an impact on the Company’s financial position, results of operations or cash flows. In January 2010, the FASB issued an amendment to the accounting guidance for fair value measurements that will provide for additional disclosures about (a) the different classes of assets and liabilities measured at fair value, (b) the valuation techniques and inputs used, (c) the activity in Level 3 fair value measurements, and (d) the transfers between Levels 1, 2, and 3. This FASB guidance is effective for financial statements issued for interim and annual periods beginning after December 15, 2009, except for the disclosures about purchases, sales, issuances, and settlements in the roll forward of activity in Level 3 fair value measurements. Those disclosures are effective for fiscal years beginning after December 15, 2010, and for interim periods within those fiscal years. The adoption of this guidance did not have an impact on the Company’s financial position, results of operations or cash flows. In June 2009, the FASB issued an amendment to the accounting and disclosure requirements for transfers and servicing of financial assets and extinguishment of liabilities. The objective of the amendment is to improve the relevance, representational faithfulness, and comparability of the information that a reporting entity provides in its financial statements about a transfer of financial assets; and effects of a transfer on its financial position, financial performance and cash flows; and transferor’s continuing involvement, if any, in transferred financial assets. The new provisions must be applied as of the beginning of each reporting entity’s first annual reporting period beginning after November 15, 2009 and are to be applied to transfers occurring on or after the date of adoption. The adoption of this guidance did not have an impact on the Company’s financial position, results of operations or cash flows. In June 2009, the FASB issued an amendment to the accounting and disclosure requirements for the consolidation of variable interest entities. The objective of the amendment is to improve financial reporting
19
by enterprises involved with variable interest entities and to provide more relevant and reliable information to users of financial statements. The amendment requires an enterprise to perform an analysis to determine whether the enterprise’s variable interest or interests give it a controlling financial interest in a variable interest entity. The new requirements shall be effective as of the beginning of each reporting entity’s first annual reporting period that begins after November 15, 2009. The adoption of this guidance did not have an impact on the Company’s financial position, results of operations or cash flows. In May 2009, the FASB issued accounting guidance establishing the general standards of accounting for the disclosure of events that occur after the balance sheet date but before the financial statements are issued or are available to be issued. In particular, this FASB guidance requires enhanced disclosures about (a) events or transactions that may occur for potential recognition or disclosure in the financial statements in the period after the balance sheet date, (b) circumstances under which an entity should recognize such events, and (c) date through which an entity has evaluated subsequent events, including the basis for that date, and whether that date represents the date the financial statements were issued or available to be issued. The FASB guidance is effective for financial statements issued for interim and annual periods ending after June 15, 2009. The Company adopted this standard for the reporting period beginning April 1, 2010 and noted no impact on the Company’s financial position, results of operations or cash flows due to the adoption of this standard. T. Reclassifications
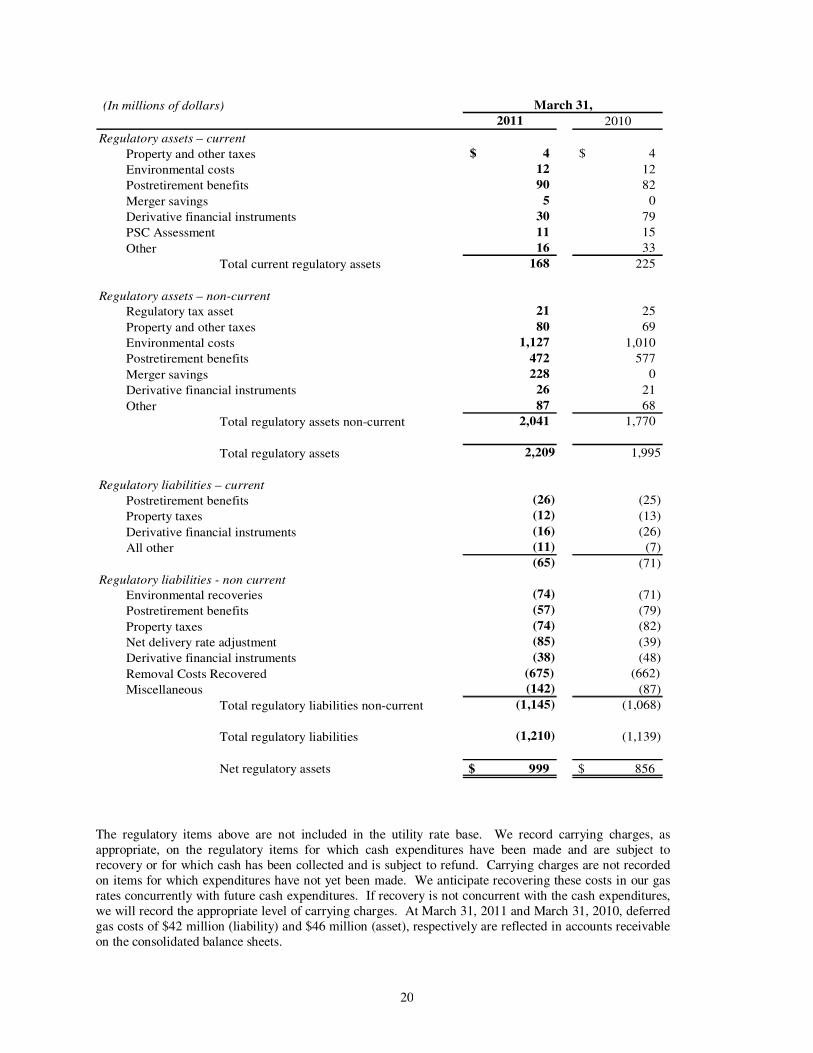
Certain reclassifications have been made to conform prior periods' data to the current presentation. Certain component of accounts receivable was reclassified to regulatory assets. In addition, the Company reclassed asset balance of executive retirement plans from equity investments to other deferred charges. Further, prior year assets and liabilities of EnergyNorth are reclassified as “assets held for sale” and “liabilities related to assets held for sale”. The Company also determined that certain derivative contracts or discrete, separable components of derivative contracts do not qualify for hedge or derivative accounting and should therefore, be excluded from the balance sheet. The Company adjusted the prior period by decreasing the net derivative liabilities and net regulatory assets by $98 million in the accompanying consolidated balance sheet. These reclassifications had no effect on the Company’s results of continuing operations and cash flows. Note 2. Rates and Regulatory The following table presents the Company’s regulatory assets and regulatory liabilities at March 31, 2011 and March 31, 2010:
20
(In millions of dollars)
2011 2010
Regulatory assets – current
Property and other taxes 4$ 4$
Environmental costs 12 12
Postretirement benefits 90 82
Merger savings 5 0
Derivative financial instruments 30 79
PSC Assessment 11 15
Other 16 33
Total current regulatory assets 168 225
Regulatory assets – non-current
Regulatory tax asset 21 25
Property and other taxes 80 69
Environmental costs 1,127 1,010
Postretirement benefits 472 577
Merger savings 228 0
Derivative financial instruments 26 21
Other 87 68
Total regulatory assets non-current 2,041 1,770
Total regulatory assets 2,209 1,995
Regulatory liabilities – current
Postretirement benefits (26) (25)
Property taxes (12) (13)
Derivative financial instruments (16) (26)
All other (11) (7)
(65) (71)
Regulatory liabilities - non current
Environmental recoveries (74) (71)
Postretirement benefits (57) (79)
Property taxes (74) (82)
Net delivery rate adjustment (85) (39)
Derivative financial instruments (38) (48)
Removal Costs Recovered (675) (662)
Miscellaneous (142) (87)
Total regulatory liabilities non-current (1,145) (1,068)
Total regulatory liabilities (1,210) (1,139)
Net regulatory assets $ 999 $ 856
March 31,
The regulatory items above are not included in the utility rate base. We record carrying charges, as appropriate, on the regulatory items for which cash expenditures have been made and are subject to recovery or for which cash has been collected and is subject to refund. Carrying charges are not recorded on items for which expenditures have not yet been made. We anticipate recovering these costs in our gas rates concurrently with future cash expenditures. If recovery is not concurrent with the cash expenditures, we will record the appropriate level of carrying charges. At March 31, 2011 and March 31, 2010, deferred gas costs of $42 million (liability) and $46 million (asset), respectively are reflected in accounts receivable on the consolidated balance sheets.
21
Regulatory Developments The Company’s regulated operating companies are involved in several regulatory rate cases, as follows:
Brooklyn Union and KeySpan Gas East (the “Companies”) The Companies are currently subject to a five year rate plan through December 2012. Base delivery rates are based on an allowed return on equity (ROE) of 9.8%. From 2008 through 2012, the combined delivery rate surcharge is increased each year by $15 million. However, the incremental revenue from the increase in the delivery rate surcharge will be deferred and used to offset deferred special franchise taxes with incremental revenue above that level deferred and used to offset future increases in rates for costs such as environmental investigation and remediation or other cost deferrals. Cumulative annual earnings above a 10.5% ROE will be shared with customers. During the year ended March 31, 2011, the Companies recorded a combined excess earnings of $34 million related to the rate year 2010. The Companies are not eligible to submit a new rate plan until January 2012 for rates to take effect January 2013. In January 2010, the Companies filed the status of its regulatory deferrals so that the NYPSC can determine whether in 2011 the Companies should adjust the level of revenue they receive under the existing rate plan to minimize outstanding deferrals. The Companies proposed an increase to 2009 revenues of 1.7% and 2.48%, respectively, through an existing surcharge, to take effect January 1, 2011, subject to NYPSC approval. The Companies are proposing to recover a combined $65.0 million of regulatory assets, which is comprised of a combined annual amortization of deferral balances on the balance sheet at December 31, 2009 of $55.4 million, and a half year annual amortization of the 2010 forecasted deferral balances of $9.7 million. The discovery phase of the proceeding remains ongoing at the NYPSC and a completion date can not be predicted at this time. In June 2009, the Companies made a compliance filing with the NYPSC regarding the implementation of the Temporary State Energy & Utility Conservation Assessment. The NYPSC authorized recovery of the revenues required for payment of the Temporary State Assessment subject to reconciliation over five years, July 1, 2009 through June 30, 2014. In a second compliance filing in June 2010, the Companies increased its combined Temporary State Assessment surcharge to $70.8 million for the period from July 1, 2010 through June 30, 2011. At March 31, 2011, a combined $11.4 million was deferred pending recovery; a combined $15 million was recorded at March 31, 2010. On June 15, 2011, the Companies submitted another compliance filing in which it once again proposed to maintain the surcharge for the July 1, 2011 through June 30, 2012 recovery period. In April 2008, Brooklyn Union filed with the NYPSC to recover an incentive earned in 2002-2007 relating to lost and unaccounted for (“LAUF”) gas. Brooklyn Union was entitled to earn an incentive during that period by reducing LAUF below an amount specified in a prior rate case. Due to an error in the methodology that had been used to calculate LAUF for the years 2002-2007, the incentive amount earned and recovered in rates was understated by approximately $27 million. The 2008 petition sought recovery of the understated amount. The gain contingency is not reflected in the consolidated financial statements. In April 2011, the NYPSC issued a ruling denying Brooklyn Union’s request. Other Regulatory Matters
In December 2009, the NYPSC adopted the terms of a Joint Proposal between NYPSC Staff and the Company that provided for a revenue decoupling mechanism to take effect as of January 1, 2010. The revenue decoupling mechanism applies only to the Company’s firm residential heating sales and transportation customers, and permits the Company to reconcile actual revenue per customer to target revenue per customer for the affected customer classes on an annual basis. The revenue decoupling mechanism is designed to eliminate the disincentive for the Company to implement energy efficiency programs. The deferred amount was $10.9 million and $1.4 million at March 31, 2011 and March 31, 2010, respectively, which is fully recoverable from the affected customer class.
22
In February 2011, in regards to KeySpan Gas East ,the NYPSC instituted a statewide investigation to review its policies regarding the funding mechanisms supporting site investigation and remediation (“SIR”) expenditures and directing the state's utilities to assist the Commission in developing a comprehensive record of: (1) the current and future scope of utility site investigation SIR programs; (2) the current cost controls in place by utilities and opportunities to improve such cost controls; (3) the appropriate allocation of costs among customers and potentially shareholders; and (4) methods for recovering costs appropriately borne by ratepayers in a way that minimizes the impact. The NYPSC has requested that the Administrative Law Judge provide a presentation of recommendations before the end of 2011. In August 2010, KeySpan Gas East filed an initial Verified Petition for Authority to Issue Securities with the NYPSC seeking multi-year authority to issue, prior to March 31, 2014, up to $1.1 billion in new long-term debt securities, which was revised to $1.0 billion in February 2011. In March 2011, the NYPSC granted this authority and during the same month KeySpan Gas East issued $500 million in long term debt. Boston Gas and Colonial Gas (the “Gas Companies”) In April 2010, the Gas Companies filed an initial request with the DPU for a combined rate increase of $106 million, which was revised to $104.1 million in September, 2010. In November 2010, the DPU issued an order approving a combined revenue increase of $58 million based upon a 9.75% rate of return on equity and a 50% equity ratio. In May 2011, the Gas Companies made their first filing with the DPU for recovery of capital costs related to infrastructure replacement. The reported combined revenue requirement associated with these capital costs are approximately $10.4 million. Since this amount is below the ordered cap of 1% of the Gas Companies’ prior year total revenues, the entire amount is eligible for recovery. The DPU order also provided for a revenue decoupling mechanism to take effect as of November 1, 2010.
The revenue decoupling mechanism applies to the Gas Companies’ firm rate classes, excluding gas lamps
and negotiated contracts and permits the Gas Companies to reconcile actual revenue per customer to target
revenue per customer for the affected customer classes on a seasonal basis. The revenue decoupling
mechanism is designed to eliminate the disincentive for the Gas Companies to implement energy efficiency
programs. At March 31, 2011, the combined deferred amount under the decouple mechanism was a
payable of $17.9 million which is fully refundable to the affected customer classes.
In November 2010, the Gas Companies’ filed two motions in response to the DPU order (1) in its motion
for recalculation, the Gas Companies have requested that the DPU recalculate certain adjustments that it
made in determining the $58 million increases approved in its order. If approved, the rate increase for the
Gas Companies would increase by an additional $10.4 million to a total of approximately $68.4 million (2)
in its motion for reconsideration and clarification; the Gas Companies are seeking reconsideration of the
DPU’s disposition of four issues they believe were based on legal error or lack of substantial evidence, and
clarification on three non-financial matters. The most significant of the four items for reconsideration
involves that DPU’s disallowance of $11.3 million from Boston Gas rate base related to certain fixed asset
additions from calendar years 1996 to 1998 as well as disallowance of depreciation expenses of
approximately $0.8 million per year associated with those assets. These assets have been impaired in the
accompanying financial statements. If the Gas Companies are unsuccessful with their request for
reconsideration, they could appeal the matter to the Massachusetts Supreme Judicial Court. The motions
remain pending at the DPU.
Other Regulatory Matters In November 2008, the Gas Companies filed a combined request for approval of a three year gas portfolio optimization agreement with ConocoPhillips, which was approved in April 2009 but limited the term to a one year period. This agreement was extended for one additional year upon the approval of DPU in April 2010. In November 2010, a combined request was filed for approval of a new gas portfolio optimization co-management agreement with BG Energy Merchants, LLC for a term of two years commencing in April 2011, which was rejected by DPU in May 2011. Since the former ConocoPhillips agreement terminated as
23
of Mach 31, 2011, the Gas Companies have been managing and optimizing its assets on its own while the DPU proceeding was pending. The Gas Companies are presently evaluating their options with respect to portfolio management in light of the DPU’s rejection of the proposed co-management agreement. On June 1, 2011, in conjunction with the DPU's annual investigation of the Gas Companies calendar year 2009 pension and PBOP rate reconciliation mechanism, the Massachusetts Attorney General has argued that the Company be obligated to provide carrying charges to the benefit of customers on its PBOP liability balances related to its 2003 to 2006 rate reconciliation filings. In August 2010, the DPU ordered the Gas Companies to provide carrying charges on its PBOP liability balances on its 2007 and 2008 rate reconciliation filings, but the order was silent about providing carrying charges prior to those years. The DPU is expected to decide this matter during the summer of 2011. Green Communities Act
The Gas Companies EE plan is run as a single combined plan. For the calendar years 2010 through 2012, the plan significantly expands EE programs for customers with a concomitant increase in spending. The budget for the Gas Companies in Massachusetts, exclusive of lost base revenue (revenues reduced as a result of installed EE measures) for the calendar years 2010 through 2012 is $203.4 million. In addition to cost recovery, the Company has the opportunity to earn a performance incentive. On March 31, 2011, the DPU approved a combined performance incentive for 2009 of $1.0 million, net of taxes. The DPU also approved an increase to the 2009 EE budget of approximately $8.8 million. The Gas Companies’ request for recovery of lost base revenue for 2008 and 2009 is pending before the DPU. National Grid Generation
In January 2009, our wholly-owned subsidiary, National Grid Generation filed an application with FERC for a rate increase of $92 million for the five year rate term of the fifteen year contract under the power supply agreement. In December 2009, the FERC approved the tariff rates, effective from February 1, 2009 subject to refund and the outcome of any proceedings instituted by the FERC. In October 2009, LIPA and National Grid Generation filed a settlement with the FERC for a revenue requirement of $436 million, an annual increase of approximately $66 million, an ROE of 10.75% and a capital structure of 50% debt and 50% equity, which was approved by the FERC in January 2010. All outstanding balances associated with the revenue increases were settled in March 2010. Service Company Audits In November 2008, the FERC commenced an audit of NGUSA, including its service companies and other affiliates in the National Grid holding company system. The audit evaluated our compliance with: 1) cross-subsidization restrictions on affiliate transactions; 2) accounting, recordkeeping and reporting requirements; 3) preservation of records requirements for holding companies and service companies; and 4) Uniform System of Accounts for centralized service companies. The final audit report from the FERC was received in February 2011. In April 2011, NGUSA replied to the FERC and outlined its plan to address the findings in the report, which we are currently in the process of implementing. None of the findings had a material impact on the financial statements of the Company. In February 2011, the NYPSC selected Overland Consulting Inc., a management consulting firm, to
perform a management audit of National Grid's affiliate cost allocation, policies and procedures. The audit
of these service company charges seeks to determine if any service company transactions have resulted in
unreasonable costs to New York customers for the provision of delivery service. If potentially material
levels of misallocated or inappropriate service company costs are discovered, at the direction of the
NYPSC, the investigation will be expanded to prior years to determine if a material amount of misallocated
or inappropriate costs under these service company contracts have been charged to the New York utilities.
A report of this review to the NYPSC is anticipated in November 2011. At the present time we are not
aware of any material misallocation of costs among our affiliates and we do not expect the audit to result in
any material adjustment to our financial statements.
24
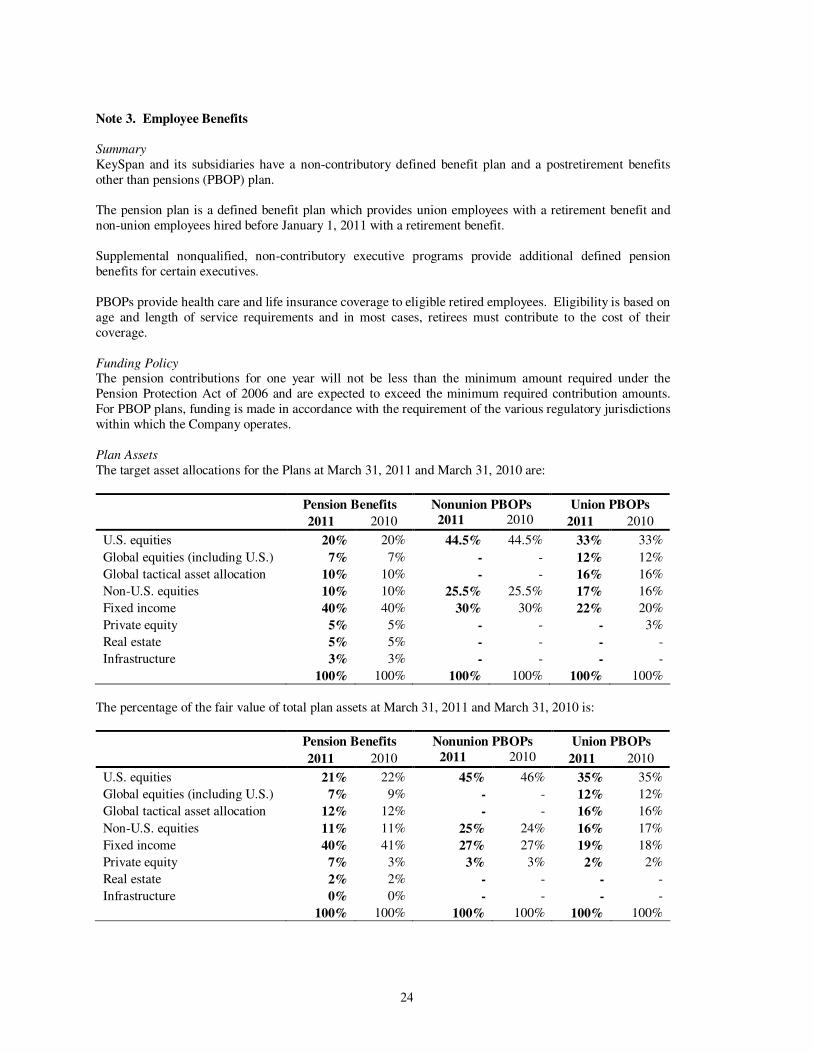
Note 3. Employee Benefits Summary
KeySpan and its subsidiaries have a non-contributory defined benefit plan and a postretirement benefits other than pensions (PBOP) plan. The pension plan is a defined benefit plan which provides union employees with a retirement benefit and non-union employees hired before January 1, 2011 with a retirement benefit. Supplemental nonqualified, non-contributory executive programs provide additional defined pension benefits for certain executives. PBOPs provide health care and life insurance coverage to eligible retired employees. Eligibility is based on age and length of service requirements and in most cases, retirees must contribute to the cost of their coverage. Funding Policy
The pension contributions for one year will not be less than the minimum amount required under the Pension Protection Act of 2006 and are expected to exceed the minimum required contribution amounts. For PBOP plans, funding is made in accordance with the requirement of the various regulatory jurisdictions within which the Company operates.
Plan Assets
The target asset allocations for the Plans at March 31, 2011 and March 31, 2010 are:
Pension Benefits Nonunion PBOPs Union PBOPs
2011 2010 2011 2010 2011 2010
U.S. equities 20% 20% 44.5% 44.5% 33% 33%
Global equities (including U.S.) 7% 7% - - 12% 12%
Global tactical asset allocation 10% 10% - - 16% 16%
Non-U.S. equities 10% 10% 25.5% 25.5% 17% 16%
Fixed income 40% 40% 30% 30% 22% 20%
Private equity 5% 5% - - - 3%
Real estate 5% 5% - - - -
Infrastructure 3% 3% - - - -
100% 100% 100% 100% 100% 100%
The percentage of the fair value of total plan assets at March 31, 2011 and March 31, 2010 is:
Pension Benefits Nonunion PBOPs Union PBOPs
2011 2010 2011 2010 2011 2010
U.S. equities 21% 22% 45% 46% 35% 35%
Global equities (including U.S.) 7% 9% - - 12% 12%
Global tactical asset allocation 12% 12% - - 16% 16%
Non-U.S. equities 11% 11% 25% 24% 16% 17%
Fixed income 40% 41% 27% 27% 19% 18%
Private equity 7% 3% 3% 3% 2% 2%
Real estate 2% 2% - - - -
Infrastructure 0% 0% - - - -
100% 100% 100% 100% 100% 100%
25
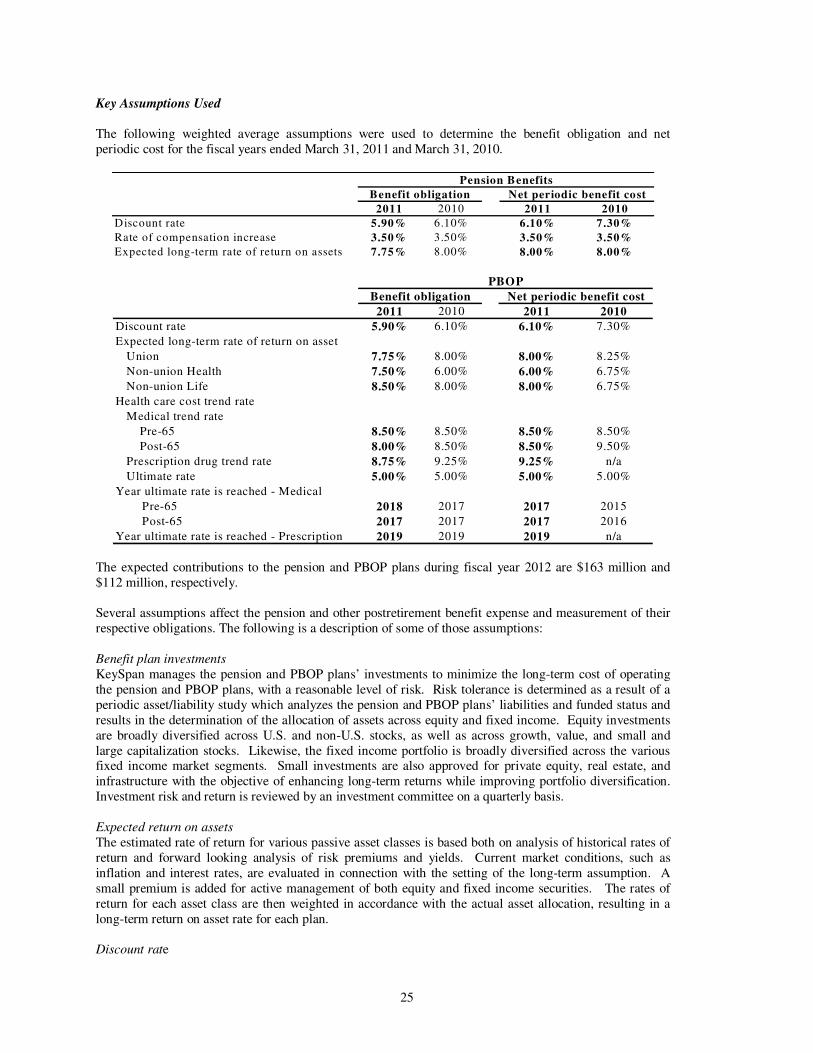
Key Assumptions Used
The following weighted average assumptions were used to determine the benefit obligation and net periodic cost for the fiscal years ended March 31, 2011 and March 31, 2010.
Pension Benefits
Benefit obligation
2011 2010 2011 2010
Discount rate 5.90% 6.10% 6.10% 7.30%
Rate of compensation increase 3.50% 3.50% 3.50% 3.50%
Expected long-term rate of return on assets 7.75% 8.00% 8.00% 8.00%
Net periodic benefit cost
PBOP
Benefit obligation Net periodic benefit cost
2011 2010 2011 2010
Discount rate 5.90% 6.10% 6.10% 7.30%
Expected long-term rate of return on asset
Union 7.75% 8.00% 8.00% 8.25%
Non-union Health 7.50% 6.00% 6.00% 6.75%
Non-union Life 8.50% 8.00% 8.00% 6.75%
Health care cost trend rate
Medical trend rate
Pre-65 8.50% 8.50% 8.50% 8.50%
Post-65 8.00% 8.50% 8.50% 9.50%
Prescription drug trend rate 8.75% 9.25% 9.25% n/a
Ultimate rate 5.00% 5.00% 5.00% 5.00%
Year ultimate rate is reached - Medical
Pre-65 2018 2017 2017 2015
Post-65 2017 2017 2017 2016
Year ultimate rate is reached - Prescription 2019 2019 2019 n/a The expected contributions to the pension and PBOP plans during fiscal year 2012 are $163 million and $112 million, respectively. Several assumptions affect the pension and other postretirement benefit expense and measurement of their respective obligations. The following is a description of some of those assumptions:
Benefit plan investments KeySpan manages the pension and PBOP plans’ investments to minimize the long-term cost of operating the pension and PBOP plans, with a reasonable level of risk. Risk tolerance is determined as a result of a periodic asset/liability study which analyzes the pension and PBOP plans’ liabilities and funded status and results in the determination of the allocation of assets across equity and fixed income. Equity investments are broadly diversified across U.S. and non-U.S. stocks, as well as across growth, value, and small and large capitalization stocks. Likewise, the fixed income portfolio is broadly diversified across the various fixed income market segments. Small investments are also approved for private equity, real estate, and infrastructure with the objective of enhancing long-term returns while improving portfolio diversification. Investment risk and return is reviewed by an investment committee on a quarterly basis.
Expected return on assets
The estimated rate of return for various passive asset classes is based both on analysis of historical rates of return and forward looking analysis of risk premiums and yields. Current market conditions, such as inflation and interest rates, are evaluated in connection with the setting of the long-term assumption. A small premium is added for active management of both equity and fixed income securities. The rates of return for each asset class are then weighted in accordance with the actual asset allocation, resulting in a long-term return on asset rate for each plan. Discount rate
26
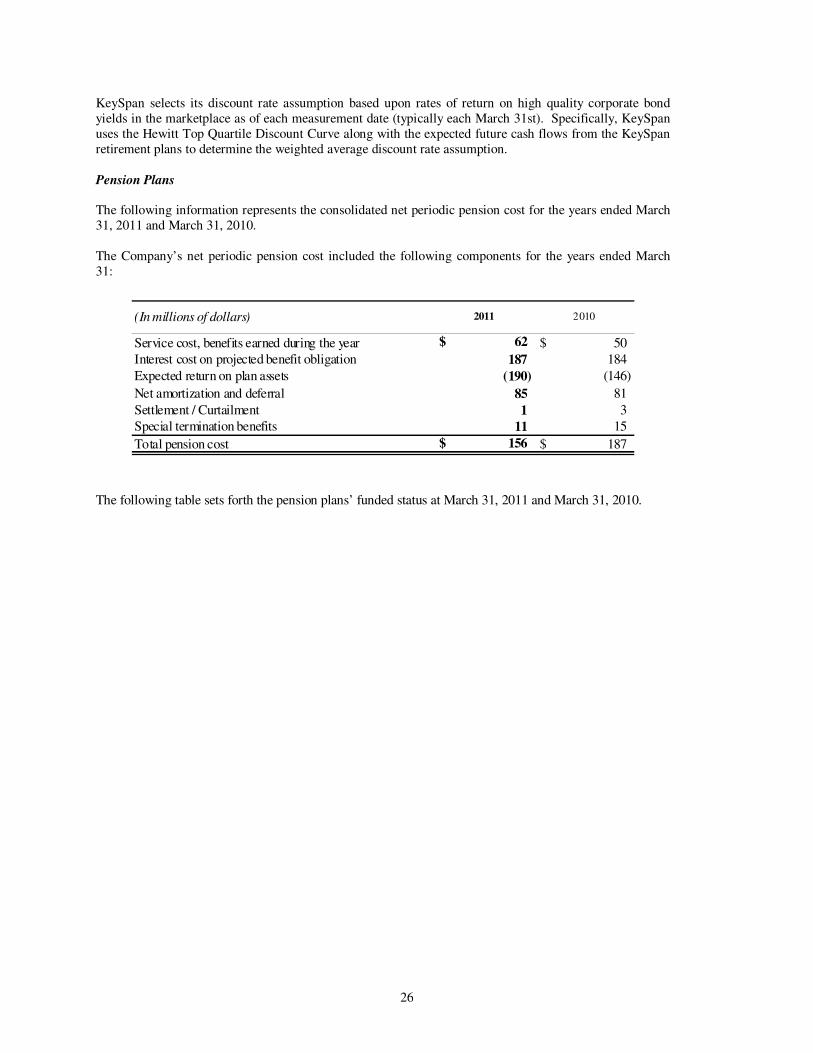
KeySpan selects its discount rate assumption based upon rates of return on high quality corporate bond yields in the marketplace as of each measurement date (typically each March 31st). Specifically, KeySpan uses the Hewitt Top Quartile Discount Curve along with the expected future cash flows from the KeySpan retirement plans to determine the weighted average discount rate assumption. Pension Plans
The following information represents the consolidated net periodic pension cost for the years ended March 31, 2011 and March 31, 2010. The Company’s net periodic pension cost included the following components for the years ended March 31:
(In millions of dollars) 2011 2010
Service cost, benefits earned during the year 62$ 50$
Interest cost on projected benefit obligation 187 184
Expected return on plan assets (190) (146)
Net amortization and deferral 85 81
Settlement / Curtailment 1 3
Special termination benefits 11 15
Total pension cost 156$ 187$
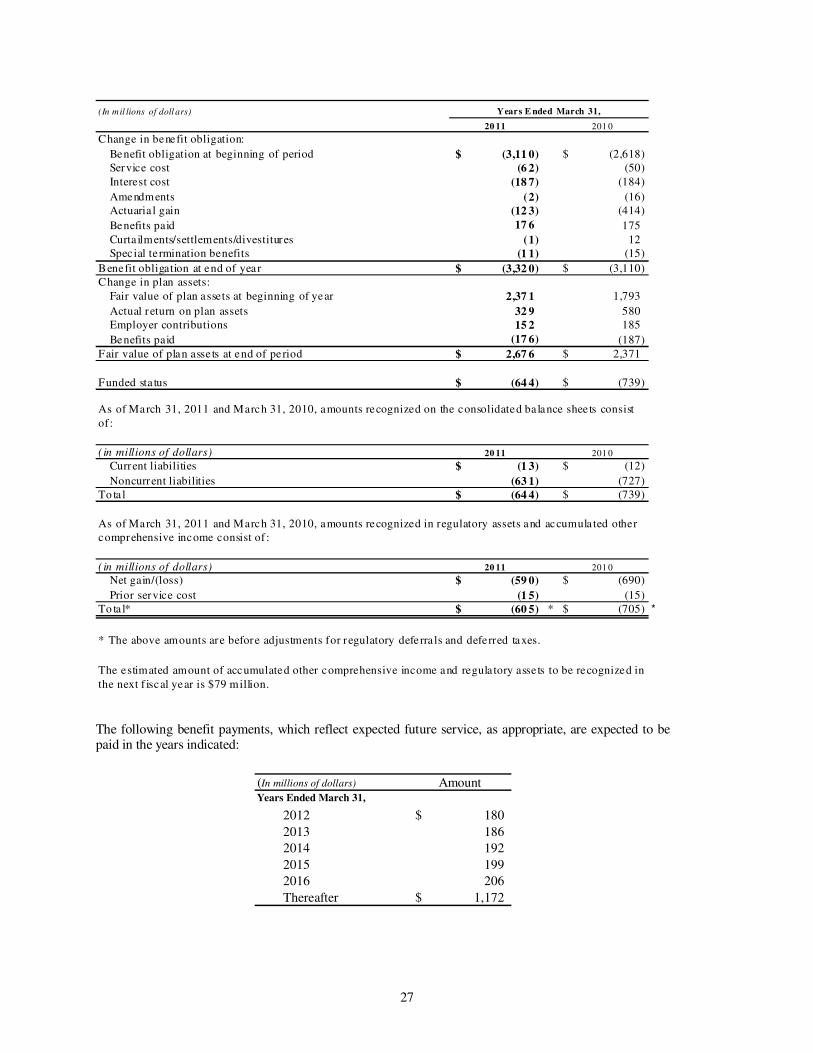
The following table sets forth the pension plans’ funded status at March 31, 2011 and March 31, 2010.
27
(In mil lions of doll ars)
20 11 201 0
Change in benefit obligation:
Benefit obligation at beginning of period (3,11 0)$ (2,618)$
Service cost (6 2) (50)
Interest cost (18 7) (184)
Amendments (2) (16)
Actuaria l gain (12 3) (414)
Benefits paid 17 6 175
Curta ilments/settlements/divestitures (1) 12
Spec ial te rmination benefits (1 1) (15)
Benefit obligation at end of year (3,32 0)$ (3,110)$
Change in plan assets:
Fair value of plan assets at beginning of year 2,37 1 1,793
Actual return on plan assets 32 9 580
Employer contributions 15 2 185
Benefits paid (17 6) (187)
Fair value of plan asse ts at end of period 2,67 6$ 2,371$
Funded sta tus (64 4)$ (739)$
( in millions of dollars) 20 11 201 0
Current liabilities (1 3)$ (12)$
Noncurrent liabilities (63 1) (727)
To ta l (64 4)$ (739)$
( in millions of dollars) 20 11 201 0
Net gain/(loss) (59 0)$ (690)$
Prior service cost (1 5) (15)
To ta l* (60 5)$ * (705)$ *
* The above amounts are before adjustments for regulatory deferra ls and deferred taxes.
The estimated amount of accumulated other comprehensive income and regula tory asse ts to be recognized in
the next f iscal year is $79 million.
Years E nded March 31,
As of March 31, 2011 and March 31, 2010, amounts recognized on the consolidated ba lance shee ts consist
of :
As of March 31, 2011 and March 31, 2010, amounts recognized in regulatory assets and accumula ted other
comprehensive income consist of :
The following benefit payments, which reflect expected future service, as appropriate, are expected to be paid in the years indicated:
(In millions of dollars) AmountYears Ended March 31,
2012 180$
2013 186
2014 192
2015 199
2016 206
Thereafter 1,172$
28
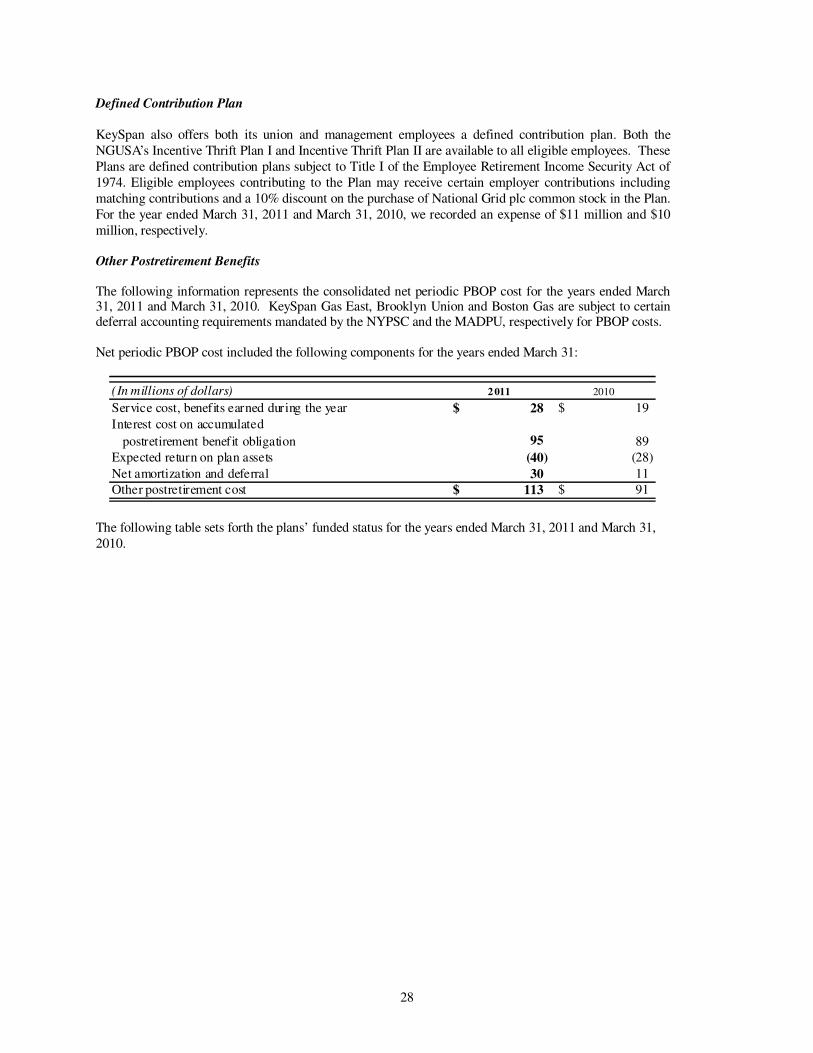
Defined Contribution Plan
KeySpan also offers both its union and management employees a defined contribution plan. Both the NGUSA’s Incentive Thrift Plan I and Incentive Thrift Plan II are available to all eligible employees. These Plans are defined contribution plans subject to Title I of the Employee Retirement Income Security Act of 1974. Eligible employees contributing to the Plan may receive certain employer contributions including matching contributions and a 10% discount on the purchase of National Grid plc common stock in the Plan. For the year ended March 31, 2011 and March 31, 2010, we recorded an expense of $11 million and $10 million, respectively.
Other Postretirement Benefits The following information represents the consolidated net periodic PBOP cost for the years ended March 31, 2011 and March 31, 2010. KeySpan Gas East, Brooklyn Union and Boston Gas are subject to certain deferral accounting requirements mandated by the NYPSC and the MADPU, respectively for PBOP costs. Net periodic PBOP cost included the following components for the years ended March 31:
(In millions of dollars) 2 011 2010
Service cost, benefits earned during the year 28$ 19$
Interest cost on accumulated
postretirement benefit obligation 95 89
Expected return on plan assets (40) (28)
Net amortization and deferral 30 11
Other postretirement cost 113$ 91$
The following table sets forth the plans’ funded status for the years ended March 31, 2011 and March 31, 2010.
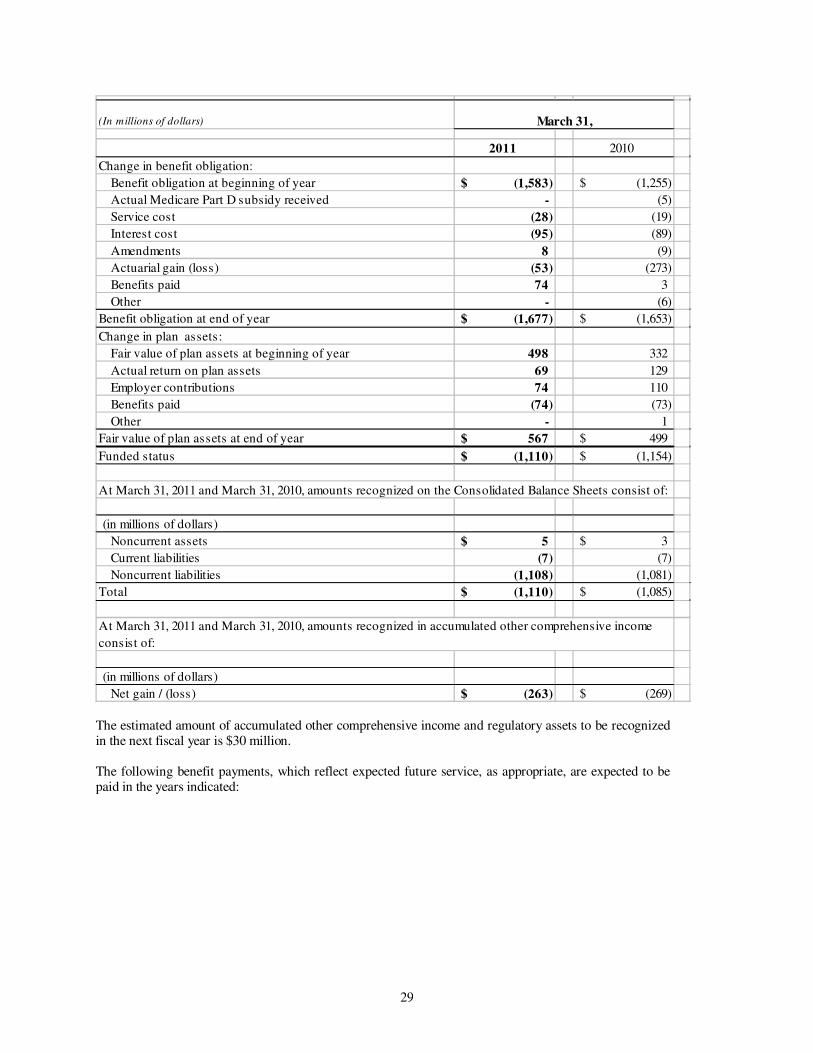
29
(In millions of dollars)
2011 2010
Change in benefit obligation:
Benefit obligation at beginning of year (1,583)$ (1,255)$
Actual Medicare Part D subsidy received - (5)
Service cost (28) (19)
Interest cost (95) (89)
Amendments 8 (9)
Actuarial gain (loss) (53) (273)
Benefits paid 74 3
Other - (6)
Benefit obligation at end of year (1,677)$ (1,653)$
Change in plan assets:
Fair value of plan assets at beginning of year 498 332
Actual return on plan assets 69 129
Employer contributions 74 110
Benefits paid (74) (73)
Other - 1
Fair value of plan assets at end of year 567$ 499$
Funded status (1,110)$ (1,154)$
(in millions of dollars)
Noncurrent assets 5$ 3$
Current liabilities (7) (7)
Noncurrent liabilities (1,108) (1,081)
Total (1,110)$ (1,085)$
(in millions of dollars)
Net gain / (loss) (263)$ (269)$
March 31,
At March 31, 2011 and March 31, 2010, amounts recognized on the Consolidated Balance Sheets consist of:
At March 31, 2011 and March 31, 2010, amounts recognized in accumulated other comprehensive income
consist of:
The estimated amount of accumulated other comprehensive income and regulatory assets to be recognized in the next fiscal year is $30 million. The following benefit payments, which reflect expected future service, as appropriate, are expected to be paid in the years indicated:
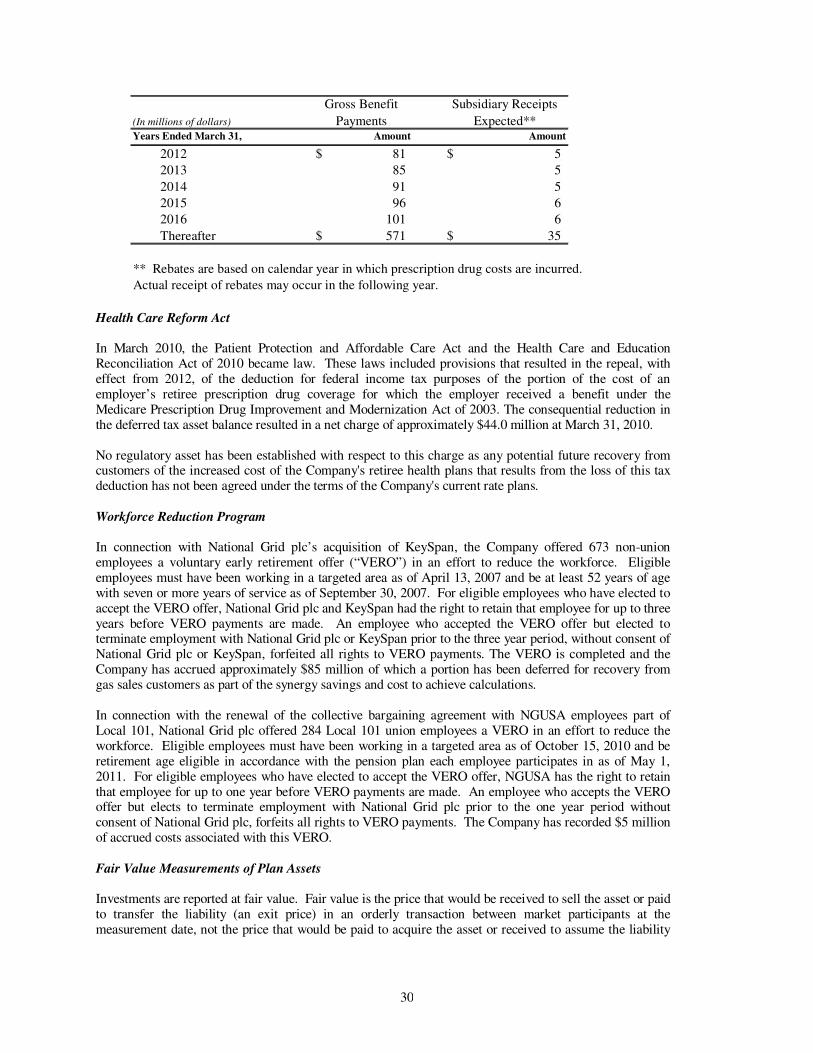
30
(In millions of dollars)
Gross Benefit
Payments
Subsidiary Receipts
Expected**Years Ended March 31, Amount Amount
2012 81$ 5$
2013 85 5
2014 91 5
2015 96 6
2016 101 6
Thereafter 571$ 35$
** Rebates are based on calendar year in which prescription drug costs are incurred.
Actual receipt of rebates may occur in the following year.
Health Care Reform Act In March 2010, the Patient Protection and Affordable Care Act and the Health Care and Education Reconciliation Act of 2010 became law. These laws included provisions that resulted in the repeal, with effect from 2012, of the deduction for federal income tax purposes of the portion of the cost of an employer’s retiree prescription drug coverage for which the employer received a benefit under the Medicare Prescription Drug Improvement and Modernization Act of 2003. The consequential reduction in the deferred tax asset balance resulted in a net charge of approximately $44.0 million at March 31, 2010. No regulatory asset has been established with respect to this charge as any potential future recovery from customers of the increased cost of the Company's retiree health plans that results from the loss of this tax deduction has not been agreed under the terms of the Company's current rate plans.
Workforce Reduction Program
In connection with National Grid plc’s acquisition of KeySpan, the Company offered 673 non-union employees a voluntary early retirement offer (“VERO”) in an effort to reduce the workforce. Eligible employees must have been working in a targeted area as of April 13, 2007 and be at least 52 years of age with seven or more years of service as of September 30, 2007. For eligible employees who have elected to accept the VERO offer, National Grid plc and KeySpan had the right to retain that employee for up to three years before VERO payments are made. An employee who accepted the VERO offer but elected to terminate employment with National Grid plc or KeySpan prior to the three year period, without consent of National Grid plc or KeySpan, forfeited all rights to VERO payments. The VERO is completed and the Company has accrued approximately $85 million of which a portion has been deferred for recovery from gas sales customers as part of the synergy savings and cost to achieve calculations. In connection with the renewal of the collective bargaining agreement with NGUSA employees part of Local 101, National Grid plc offered 284 Local 101 union employees a VERO in an effort to reduce the workforce. Eligible employees must have been working in a targeted area as of October 15, 2010 and be retirement age eligible in accordance with the pension plan each employee participates in as of May 1, 2011. For eligible employees who have elected to accept the VERO offer, NGUSA has the right to retain that employee for up to one year before VERO payments are made. An employee who accepts the VERO offer but elects to terminate employment with National Grid plc prior to the one year period without consent of National Grid plc, forfeits all rights to VERO payments. The Company has recorded $5 million of accrued costs associated with this VERO. Fair Value Measurements of Plan Assets
Investments are reported at fair value. Fair value is the price that would be received to sell the asset or paid to transfer the liability (an exit price) in an orderly transaction between market participants at the measurement date, not the price that would be paid to acquire the asset or received to assume the liability
31
(an entry price). The company used valuation which maximized the use of observable inputs and minimized the use of unobservable inputs Following is a description of the valuation methodologies used at March 31, 2011 for plan assets measured at fair value.
Cash equivalents are valued at the investment principal plus all accrued interest. Temporary cash investment and short-term investments are valued at either the investment principal plus all accrued interest or the net asset value of shares held by the Plan at year end. Common and preferred stocks, and real estate investment trusts are valued using the official close for the National Association of Securities Dealers Automated Quotations (“NASDAQ”), the last trade, or bid of the ask offer price reported on the active market on which the individual securities are traded. Fixed income securities, convertible securities, collateral received from securities lending (which include corporate debt securities, municipal fixed income securities, US Government and Government agency securities) are comprised of government agency securities, government mortgage-backed securities, index linked government bonds, and state and local bonds. Fixed income securities are valued with an institutional bid valuation or an institutional mid evaluation. A bid evaluation is an estimated price at which a dealer would pay for a security (typically in an institutional round lot). A mid evaluation is the average of the estimated price at which a dealer would sell a security and the estimated price at which a dealer would pay for a security (typically in an institutional round lot). Oftentimes, these evaluations are based on proprietary models which pricing vendors establish for these purposes. In some cases, there may be manual sources used when primary price vendors do not supply prices. Derivatives (except certain options traded on an exchange) and forward foreign exchange contracts (comprised of interest rate swaps, credit default swaps, index swaps, financial futures, and other derivatives), and investment of securities lending collateral (comprised of repurchase agreements, asset-backed securities, floating rate notes and time deposits) are valued with an institutional bid valuation or an institutional mid evaluation. A bid evaluation is an estimated price at which a dealer would pay for a security (typically in an institutional round lot). A mid- evaluation is the average of the estimated price at which a dealer would sell a security and the estimated price at which a dealer would pay for a security (typically in an institutional round lot). Oftentimes, these evaluations are based on proprietary models which pricing vendors establish for these purposes. In some cases, there may be manual sources used when primary price vendors do not supply prices.
Mutual funds are valued at the net asset value of shares held by the plan at year end. Commingled equity funds, commingled special equity funds, limited partnerships, real estate, venture capital and other investments are valued using evaluations (a good faith opinion as to what a buyer in the marketplace would pay for a security–typically in an institutional round lot-in a current sale), based on proprietary models, or based on the net asset value. Index funds include investments that seek to match the return performance and characteristics of a specified index. The index funds are controlled by investment managers, which balance the funds to track the specified index. Non-US equity funds are typically invested in at least 80% foreign equity securities. Registered investment companies and common and collective trusts, and pooled separate accounts are valued at the net asset value of shares held by the plans at year end.
The methods described above may produce a fair value calculation that may not be indicative of net realizable value or reflective of future fair values. Furthermore, while Management believes its valuation methodologies are appropriate and consistent with other market participants, the use of different methodologies or assumptions to determine the fair value of certain financial instruments could result in a different fair value measurement at the reporting date. The table depicted below sets forth by level, within the fair value hierarchy, the investments in the KeySpan Master Trust pension plans at fair value as of March 31, 2011.
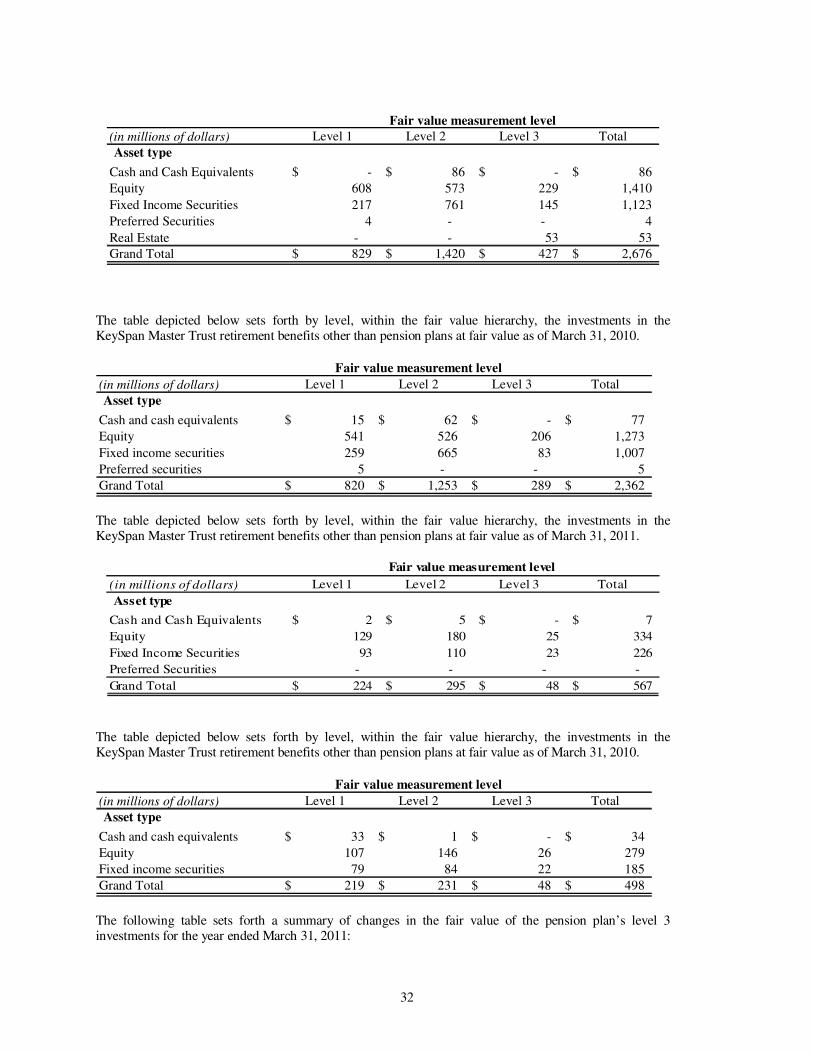
32
(in millions of dollars) Level 1 Level 2 Level 3 Total
Asset type
Cash and Cash Equivalents -$ 86$ -$ 86$
Equity 608 573 229 1,410
Fixed Income Securities 217 761 145 1,123
Preferred Securities 4 - - 4
Real Estate - - 53 53
Grand Total 829$ 1,420$ 427$ 2,676$
Fair value measurement level
The table depicted below sets forth by level, within the fair value hierarchy, the investments in the KeySpan Master Trust retirement benefits other than pension plans at fair value as of March 31, 2010.
(in millions of dollars) Level 1 Level 2 Level 3 Total
Asset type
Cash and cash equivalents 15$ 62$ -$ 77$
Equity 541 526 206 1,273
Fixed income securities 259 665 83 1,007
Preferred securities 5 - - 5
Grand Total 820$ 1,253$ 289$ 2,362$
Fair value measurement level
The table depicted below sets forth by level, within the fair value hierarchy, the investments in the KeySpan Master Trust retirement benefits other than pension plans at fair value as of March 31, 2011.
(in millions of dollars) Level 1 Level 2 Level 3 Total
Asset type
Cash and Cash Equivalents 2$ 5$ -$ 7$
Equity 129 180 25 334
Fixed Income Securities 93 110 23 226
Preferred Securities - - - -
Grand Total 224$ 295$ 48$ 567$
Fair value measurement level
The table depicted below sets forth by level, within the fair value hierarchy, the investments in the KeySpan Master Trust retirement benefits other than pension plans at fair value as of March 31, 2010.
(in millions of dollars) Level 1 Level 2 Level 3 Total
Asset type
Cash and cash equivalents 33$ 1$ -$ 34$
Equity 107 146 26 279
Fixed income securities 79 84 22 185
Grand Total 219$ 231$ 48$ 498$
Fair value measurement level
The following table sets forth a summary of changes in the fair value of the pension plan’s level 3 investments for the year ended March 31, 2011:
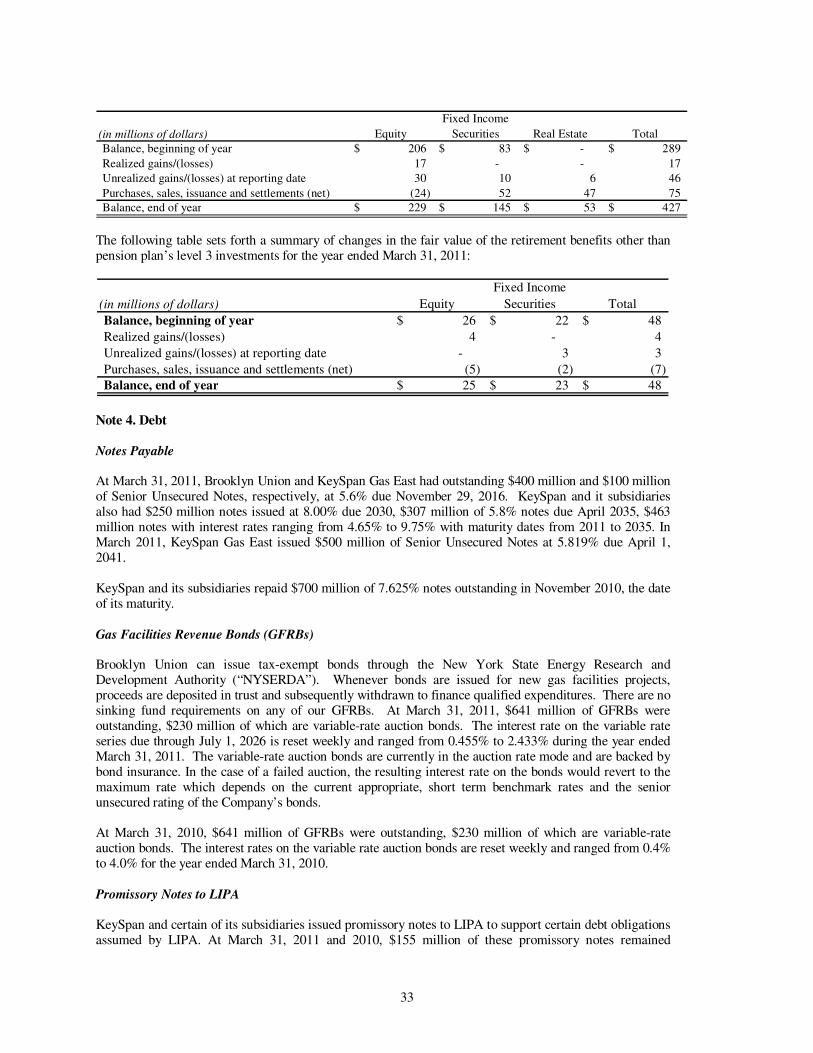
33
(in millions of dollars) Equity
Fixed Income
Securities Real Estate Total
Balance, beginning of year 206$ 83$ -$ 289$
Realized gains/(losses) 17 - - 17
Unrealized gains/(losses) at reporting date 30 10 6 46
Purchases, sales, issuance and settlements (net) (24) 52 47 75
Balance, end of year 229$ 145$ 53$ 427$
The following table sets forth a summary of changes in the fair value of the retirement benefits other than pension plan’s level 3 investments for the year ended March 31, 2011:
(in millions of dollars) Equity
Fixed Income
Securities Total
Balance, beginning of year 26$ 22$ 48$
Realized gains/(losses) 4 - 4
Unrealized gains/(losses) at reporting date - 3 3
Purchases, sales, issuance and settlements (net) (5) (2) (7)
Balance, end of year 25$ 23$ 48$
Note 4. Debt Notes Payable At March 31, 2011, Brooklyn Union and KeySpan Gas East had outstanding $400 million and $100 million of Senior Unsecured Notes, respectively, at 5.6% due November 29, 2016. KeySpan and it subsidiaries also had $250 million notes issued at 8.00% due 2030, $307 million of 5.8% notes due April 2035, $463 million notes with interest rates ranging from 4.65% to 9.75% with maturity dates from 2011 to 2035. In March 2011, KeySpan Gas East issued $500 million of Senior Unsecured Notes at 5.819% due April 1, 2041. KeySpan and its subsidiaries repaid $700 million of 7.625% notes outstanding in November 2010, the date of its maturity.
Gas Facilities Revenue Bonds (GFRBs) Brooklyn Union can issue tax-exempt bonds through the New York State Energy Research and Development Authority (“NYSERDA”). Whenever bonds are issued for new gas facilities projects, proceeds are deposited in trust and subsequently withdrawn to finance qualified expenditures. There are no sinking fund requirements on any of our GFRBs. At March 31, 2011, $641 million of GFRBs were outstanding, $230 million of which are variable-rate auction bonds. The interest rate on the variable rate series due through July 1, 2026 is reset weekly and ranged from 0.455% to 2.433% during the year ended March 31, 2011. The variable-rate auction bonds are currently in the auction rate mode and are backed by bond insurance. In the case of a failed auction, the resulting interest rate on the bonds would revert to the maximum rate which depends on the current appropriate, short term benchmark rates and the senior unsecured rating of the Company’s bonds. At March 31, 2010, $641 million of GFRBs were outstanding, $230 million of which are variable-rate auction bonds. The interest rates on the variable rate auction bonds are reset weekly and ranged from 0.4% to 4.0% for the year ended March 31, 2010.
Promissory Notes to LIPA KeySpan and certain of its subsidiaries issued promissory notes to LIPA to support certain debt obligations assumed by LIPA. At March 31, 2011 and 2010, $155 million of these promissory notes remained
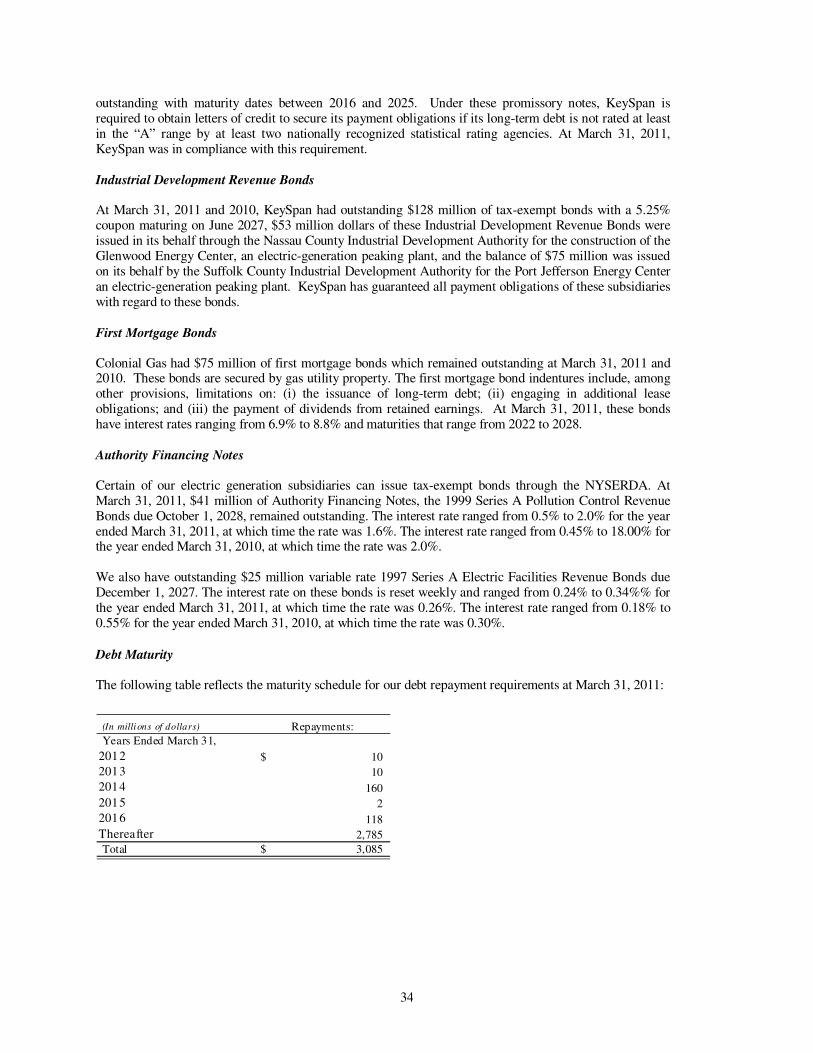
34
outstanding with maturity dates between 2016 and 2025. Under these promissory notes, KeySpan is required to obtain letters of credit to secure its payment obligations if its long-term debt is not rated at least in the “A” range by at least two nationally recognized statistical rating agencies. At March 31, 2011, KeySpan was in compliance with this requirement. Industrial Development Revenue Bonds At March 31, 2011 and 2010, KeySpan had outstanding $128 million of tax-exempt bonds with a 5.25% coupon maturing on June 2027, $53 million dollars of these Industrial Development Revenue Bonds were issued in its behalf through the Nassau County Industrial Development Authority for the construction of the Glenwood Energy Center, an electric-generation peaking plant, and the balance of $75 million was issued on its behalf by the Suffolk County Industrial Development Authority for the Port Jefferson Energy Center an electric-generation peaking plant. KeySpan has guaranteed all payment obligations of these subsidiaries with regard to these bonds.
First Mortgage Bonds Colonial Gas had $75 million of first mortgage bonds which remained outstanding at March 31, 2011 and 2010. These bonds are secured by gas utility property. The first mortgage bond indentures include, among other provisions, limitations on: (i) the issuance of long-term debt; (ii) engaging in additional lease obligations; and (iii) the payment of dividends from retained earnings. At March 31, 2011, these bonds have interest rates ranging from 6.9% to 8.8% and maturities that range from 2022 to 2028. Authority Financing Notes
Certain of our electric generation subsidiaries can issue tax-exempt bonds through the NYSERDA. At March 31, 2011, $41 million of Authority Financing Notes, the 1999 Series A Pollution Control Revenue Bonds due October 1, 2028, remained outstanding. The interest rate ranged from 0.5% to 2.0% for the year ended March 31, 2011, at which time the rate was 1.6%. The interest rate ranged from 0.45% to 18.00% for the year ended March 31, 2010, at which time the rate was 2.0%. We also have outstanding $25 million variable rate 1997 Series A Electric Facilities Revenue Bonds due December 1, 2027. The interest rate on these bonds is reset weekly and ranged from 0.24% to 0.34%% for the year ended March 31, 2011, at which time the rate was 0.26%. The interest rate ranged from 0.18% to 0.55% for the year ended March 31, 2010, at which time the rate was 0.30%.
Debt Maturity
The following table reflects the maturity schedule for our debt repayment requirements at March 31, 2011:
(In millions of dollars) Repayments:
Years Ended March 31,
2012 10$
2013 10
2014 160
2015 2
2016 118
Thereafter 2,785
Total 3,085$
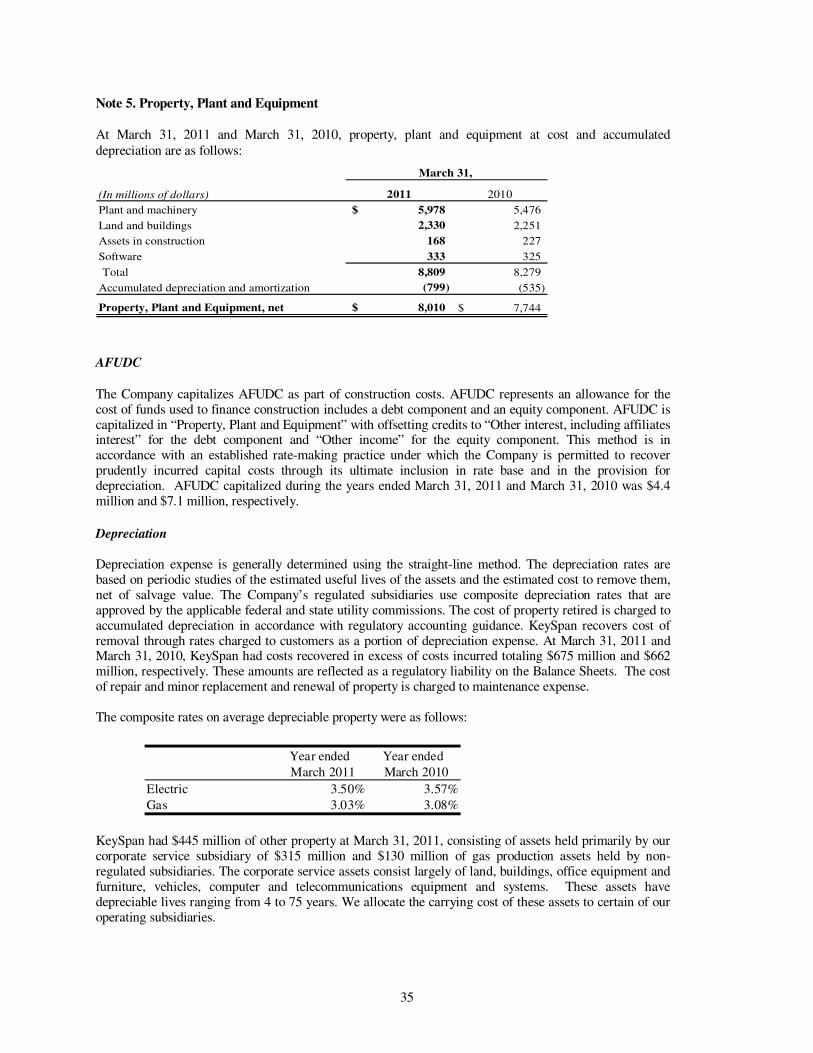
35
Note 5. Property, Plant and Equipment At March 31, 2011 and March 31, 2010, property, plant and equipment at cost and accumulated depreciation are as follows:
(In millions of dollars) 2011 2010
Plant and machinery 5,978$ 5,476
Land and buildings 2,330 2,251
Assets in construction 168 227
Software 333 325
Total 8,809 8,279
Accumulated depreciation and amortization (799) (535)
Property, Plant and Equipment, net 8,010$ 7,744$
March 31,
AFUDC
The Company capitalizes AFUDC as part of construction costs. AFUDC represents an allowance for the cost of funds used to finance construction includes a debt component and an equity component. AFUDC is capitalized in “Property, Plant and Equipment” with offsetting credits to “Other interest, including affiliates interest” for the debt component and “Other income” for the equity component. This method is in accordance with an established rate-making practice under which the Company is permitted to recover prudently incurred capital costs through its ultimate inclusion in rate base and in the provision for depreciation. AFUDC capitalized during the years ended March 31, 2011 and March 31, 2010 was $4.4 million and $7.1 million, respectively.
Depreciation
Depreciation expense is generally determined using the straight-line method. The depreciation rates are based on periodic studies of the estimated useful lives of the assets and the estimated cost to remove them, net of salvage value. The Company’s regulated subsidiaries use composite depreciation rates that are approved by the applicable federal and state utility commissions. The cost of property retired is charged to accumulated depreciation in accordance with regulatory accounting guidance. KeySpan recovers cost of removal through rates charged to customers as a portion of depreciation expense. At March 31, 2011 and March 31, 2010, KeySpan had costs recovered in excess of costs incurred totaling $675 million and $662 million, respectively. These amounts are reflected as a regulatory liability on the Balance Sheets. The cost of repair and minor replacement and renewal of property is charged to maintenance expense. The composite rates on average depreciable property were as follows:
Year ended Year ended
March 2011 March 2010
Electric 3.50% 3.57%
Gas 3.03% 3.08%
KeySpan had $445 million of other property at March 31, 2011, consisting of assets held primarily by our corporate service subsidiary of $315 million and $130 million of gas production assets held by non-regulated subsidiaries. The corporate service assets consist largely of land, buildings, office equipment and furniture, vehicles, computer and telecommunications equipment and systems. These assets have depreciable lives ranging from 4 to 75 years. We allocate the carrying cost of these assets to certain of our operating subsidiaries.
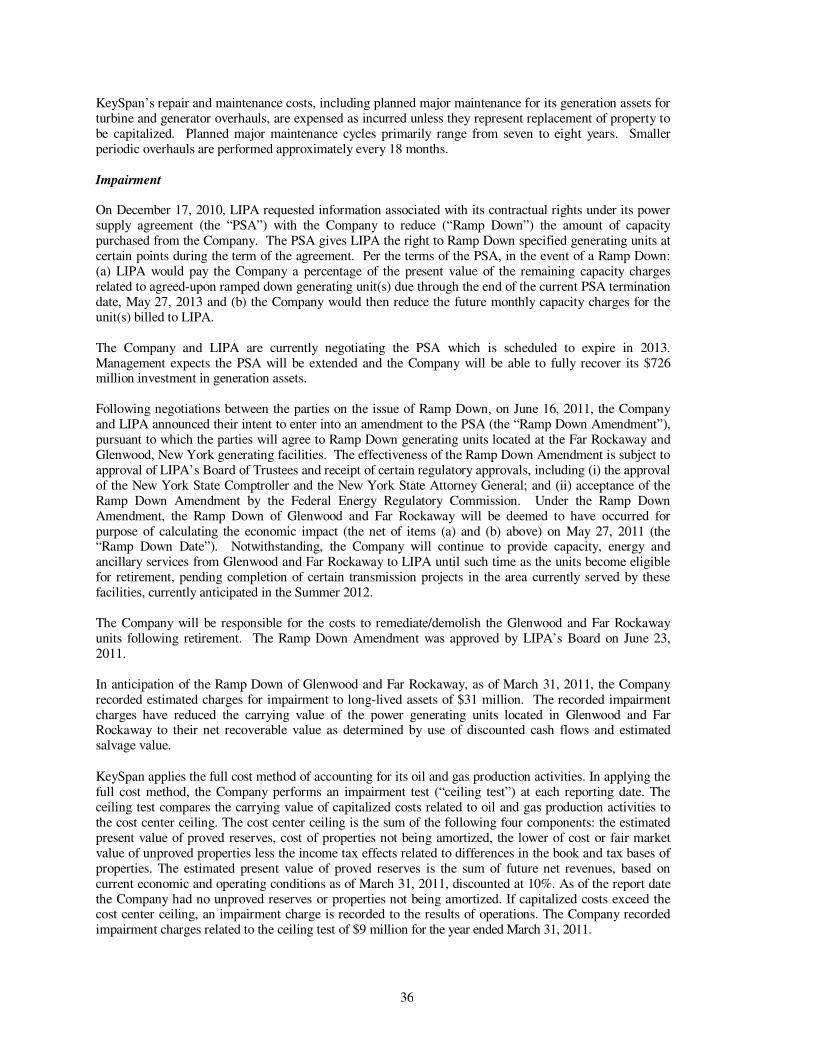
36
KeySpan’s repair and maintenance costs, including planned major maintenance for its generation assets for turbine and generator overhauls, are expensed as incurred unless they represent replacement of property to be capitalized. Planned major maintenance cycles primarily range from seven to eight years. Smaller periodic overhauls are performed approximately every 18 months. Impairment On December 17, 2010, LIPA requested information associated with its contractual rights under its power supply agreement (the “PSA”) with the Company to reduce (“Ramp Down”) the amount of capacity purchased from the Company. The PSA gives LIPA the right to Ramp Down specified generating units at certain points during the term of the agreement. Per the terms of the PSA, in the event of a Ramp Down: (a) LIPA would pay the Company a percentage of the present value of the remaining capacity charges related to agreed-upon ramped down generating unit(s) due through the end of the current PSA termination date, May 27, 2013 and (b) the Company would then reduce the future monthly capacity charges for the unit(s) billed to LIPA. The Company and LIPA are currently negotiating the PSA which is scheduled to expire in 2013. Management expects the PSA will be extended and the Company will be able to fully recover its $726 million investment in generation assets. Following negotiations between the parties on the issue of Ramp Down, on June 16, 2011, the Company and LIPA announced their intent to enter into an amendment to the PSA (the “Ramp Down Amendment”), pursuant to which the parties will agree to Ramp Down generating units located at the Far Rockaway and Glenwood, New York generating facilities. The effectiveness of the Ramp Down Amendment is subject to approval of LIPA’s Board of Trustees and receipt of certain regulatory approvals, including (i) the approval of the New York State Comptroller and the New York State Attorney General; and (ii) acceptance of the Ramp Down Amendment by the Federal Energy Regulatory Commission. Under the Ramp Down Amendment, the Ramp Down of Glenwood and Far Rockaway will be deemed to have occurred for purpose of calculating the economic impact (the net of items (a) and (b) above) on May 27, 2011 (the “Ramp Down Date”). Notwithstanding, the Company will continue to provide capacity, energy and ancillary services from Glenwood and Far Rockaway to LIPA until such time as the units become eligible for retirement, pending completion of certain transmission projects in the area currently served by these facilities, currently anticipated in the Summer 2012. The Company will be responsible for the costs to remediate/demolish the Glenwood and Far Rockaway units following retirement. The Ramp Down Amendment was approved by LIPA’s Board on June 23, 2011. In anticipation of the Ramp Down of Glenwood and Far Rockaway, as of March 31, 2011, the Company recorded estimated charges for impairment to long-lived assets of $31 million. The recorded impairment charges have reduced the carrying value of the power generating units located in Glenwood and Far Rockaway to their net recoverable value as determined by use of discounted cash flows and estimated salvage value.
KeySpan applies the full cost method of accounting for its oil and gas production activities. In applying the full cost method, the Company performs an impairment test (“ceiling test”) at each reporting date. The ceiling test compares the carrying value of capitalized costs related to oil and gas production activities to the cost center ceiling. The cost center ceiling is the sum of the following four components: the estimated present value of proved reserves, cost of properties not being amortized, the lower of cost or fair market value of unproved properties less the income tax effects related to differences in the book and tax bases of properties. The estimated present value of proved reserves is the sum of future net revenues, based on current economic and operating conditions as of March 31, 2011, discounted at 10%. As of the report date the Company had no unproved reserves or properties not being amortized. If capitalized costs exceed the cost center ceiling, an impairment charge is recorded to the results of operations. The Company recorded impairment charges related to the ceiling test of $9 million for the year ended March 31, 2011.
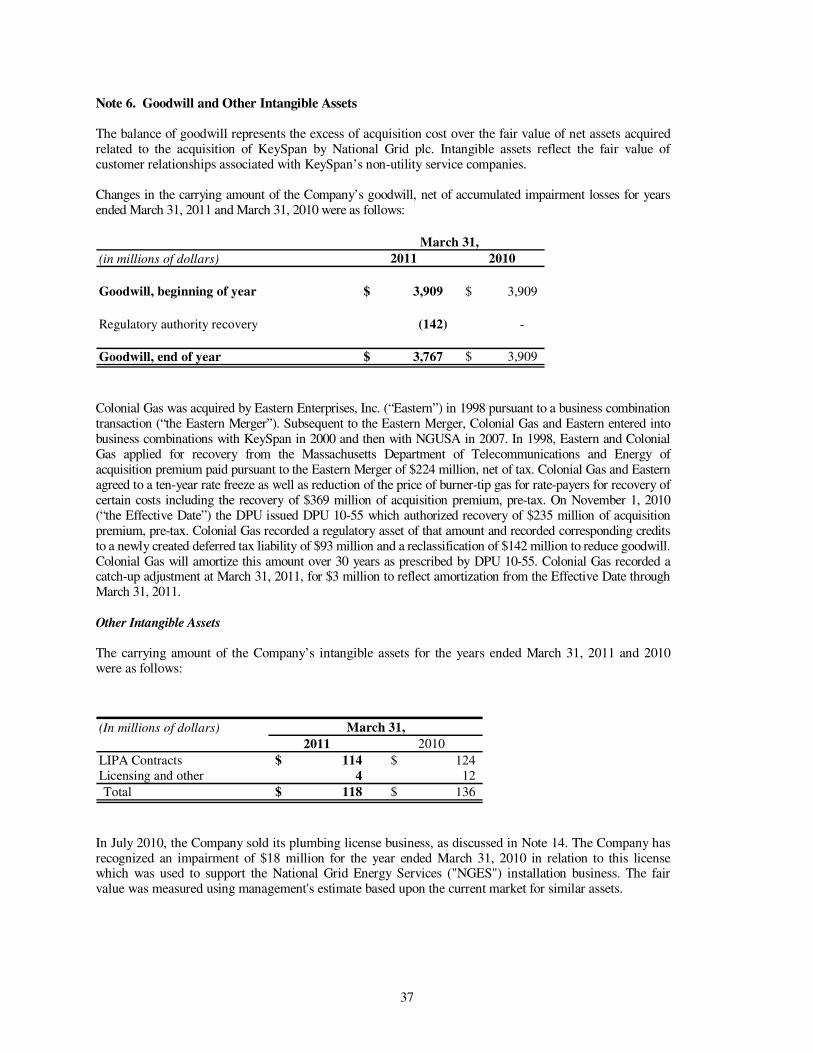
37
Note 6. Goodwill and Other Intangible Assets The balance of goodwill represents the excess of acquisition cost over the fair value of net assets acquired related to the acquisition of KeySpan by National Grid plc. Intangible assets reflect the fair value of customer relationships associated with KeySpan’s non-utility service companies. Changes in the carrying amount of the Company’s goodwill, net of accumulated impairment losses for years ended March 31, 2011 and March 31, 2010 were as follows:
(in millions of dollars) 2011 2010
Goodwill, beginning of year 3,909$ 3,909$
Regulatory authority recovery (142) -
Goodwill, end of year 3,767$ 3,909$
March 31,
Colonial Gas was acquired by Eastern Enterprises, Inc. (“Eastern”) in 1998 pursuant to a business combination transaction (“the Eastern Merger”). Subsequent to the Eastern Merger, Colonial Gas and Eastern entered into business combinations with KeySpan in 2000 and then with NGUSA in 2007. In 1998, Eastern and Colonial Gas applied for recovery from the Massachusetts Department of Telecommunications and Energy of acquisition premium paid pursuant to the Eastern Merger of $224 million, net of tax. Colonial Gas and Eastern agreed to a ten-year rate freeze as well as reduction of the price of burner-tip gas for rate-payers for recovery of certain costs including the recovery of $369 million of acquisition premium, pre-tax. On November 1, 2010 (“the Effective Date”) the DPU issued DPU 10-55 which authorized recovery of $235 million of acquisition premium, pre-tax. Colonial Gas recorded a regulatory asset of that amount and recorded corresponding credits to a newly created deferred tax liability of $93 million and a reclassification of $142 million to reduce goodwill. Colonial Gas will amortize this amount over 30 years as prescribed by DPU 10-55. Colonial Gas recorded a catch-up adjustment at March 31, 2011, for $3 million to reflect amortization from the Effective Date through March 31, 2011. Other Intangible Assets
The carrying amount of the Company’s intangible assets for the years ended March 31, 2011 and 2010 were as follows:
(In millions of dollars)
2011 2010
LIPA Contracts 114$ 124$ Licensing and other 4 12
Total 118$ 136$
March 31,
In July 2010, the Company sold its plumbing license business, as discussed in Note 14. The Company has recognized an impairment of $18 million for the year ended March 31, 2010 in relation to this license which was used to support the National Grid Energy Services ("NGES") installation business. The fair value was measured using management's estimate based upon the current market for similar assets.
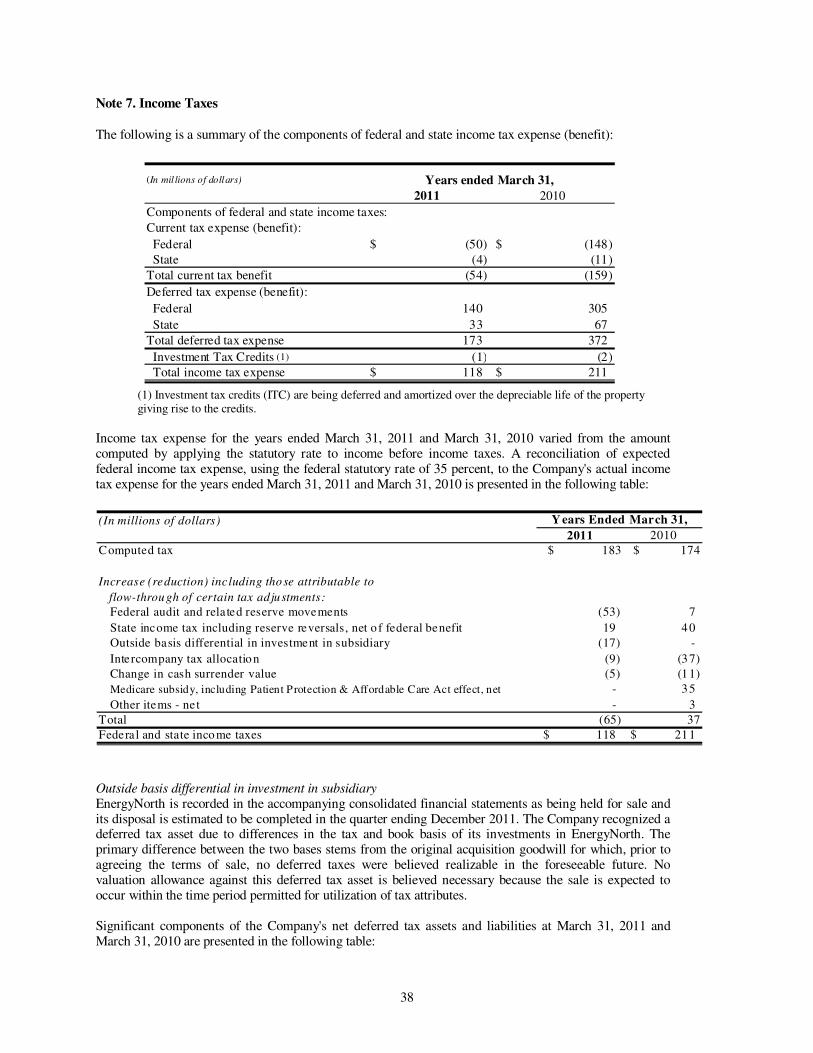
38
Note 7. Income Taxes
The following is a summary of the components of federal and state income tax expense (benefit):
(In mil lions of dollars)
2011 2010
Components of federal and state income taxes:
Current tax expense (benefit):
Federal (50)$ (148)$
State (4) (11)
Total current tax benefit (54) (159)
Deferred tax expense (benefit):
Federal 140 305
State 33 67
Total deferred tax expense 173 372
Investment Tax Credits (1) (1) (2)
Total income tax expense 118$ 211$
Years ended March 31,
(1) Investment tax credits (ITC) are being deferred and amortized over the depreciable life of the property giving rise to the credits.
Income tax expense for the years ended March 31, 2011 and March 31, 2010 varied from the amount computed by applying the statutory rate to income before income taxes. A reconciliation of expected federal income tax expense, using the federal statutory rate of 35 percent, to the Company's actual income tax expense for the years ended March 31, 2011 and March 31, 2010 is presented in the following table:
(In millions of dollars)
2011 2010
Computed tax $ 183 $ 174
Increase (reduction) including those attributable to
flow-through of certain tax adjustments:
Federal audit and related reserve movements (53) 7
State income tax including reserve reversals, net o f federal benefit 19 40
Outside basis differential in investment in subsidiary (17) -
Intercompany tax allocation (9) (37)
Change in cash surrender value (5) (11)
Medicare subsidy, including Patient Protection & Affordable Care Act effect, net - 35
Other items - net - 3
Total (65) 37
Federal and state income taxes 118$ 211$
Y ears Ended March 31,
Outside basis differential in investment in subsidiary
EnergyNorth is recorded in the accompanying consolidated financial statements as being held for sale and its disposal is estimated to be completed in the quarter ending December 2011. The Company recognized a deferred tax asset due to differences in the tax and book basis of its investments in EnergyNorth. The primary difference between the two bases stems from the original acquisition goodwill for which, prior to agreeing the terms of sale, no deferred taxes were believed realizable in the foreseeable future. No valuation allowance against this deferred tax asset is believed necessary because the sale is expected to occur within the time period permitted for utilization of tax attributes. Significant components of the Company's net deferred tax assets and liabilities at March 31, 2011 and March 31, 2010 are presented in the following table:
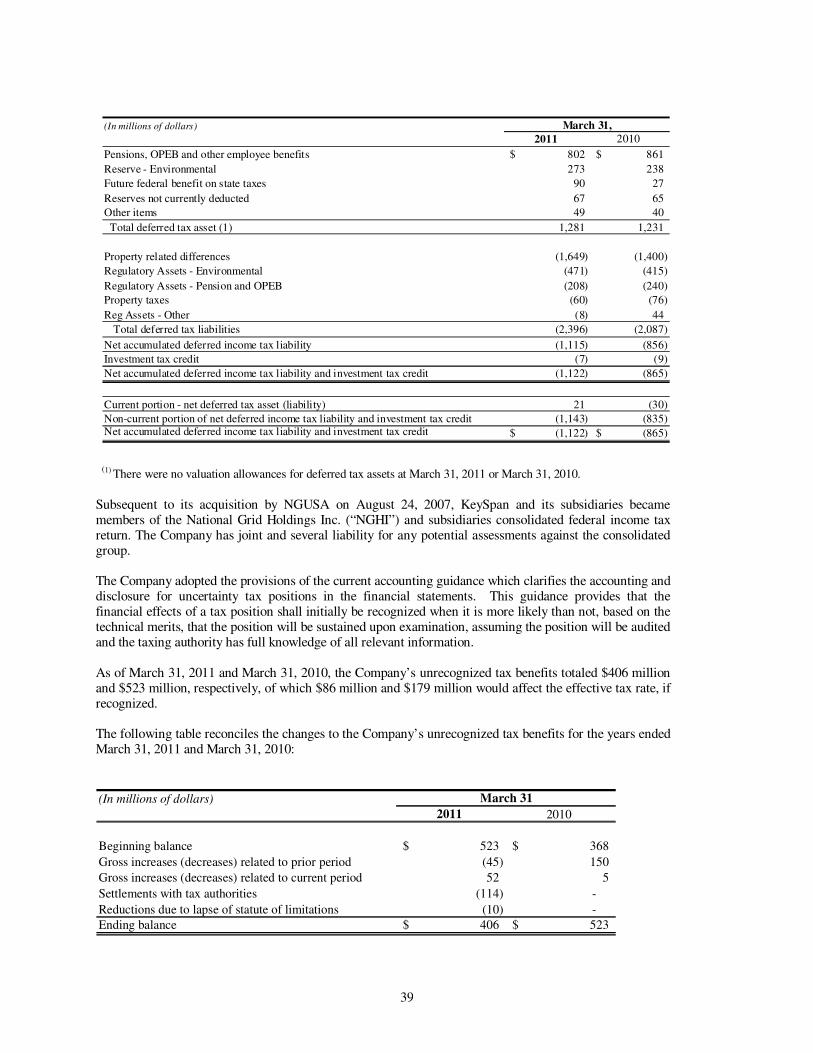
39
(In millions of dollars)
2011 2010
Pensions, OPEB and other employee benefits 802$ 861$
Reserve - Environmental 273 238
Future federal benefit on state taxes 90 27
Reserves not currently deducted 67 65
Other items 49 40
Total deferred tax asset (1) 1,281 1,231
Property related differences (1,649) (1,400)
Regulatory Assets - Environmental (471) (415)
Regulatory Assets - Pension and OPEB (208) (240)
Property taxes (60) (76)
Reg Assets - Other (8) 44
Total deferred tax liabilities (2,396) (2,087)
Net accumulated deferred income tax liability (1,115) (856)
Investment tax credit (7) (9)
Net accumulated deferred income tax liability and investment tax credit (1,122) (865)
Current portion - net deferred tax asset (liability) 21 (30)
Non-current portion of net deferred income tax liability and investment tax credit (1,143) (835) Net accumulated deferred income tax liability and investment tax credit (1,122)$ (865)$
March 31,
(1) There were no valuation allowances for deferred tax assets at March 31, 2011 or March 31, 2010.
Subsequent to its acquisition by NGUSA on August 24, 2007, KeySpan and its subsidiaries became members of the National Grid Holdings Inc. (“NGHI”) and subsidiaries consolidated federal income tax return. The Company has joint and several liability for any potential assessments against the consolidated group. The Company adopted the provisions of the current accounting guidance which clarifies the accounting and disclosure for uncertainty tax positions in the financial statements. This guidance provides that the financial effects of a tax position shall initially be recognized when it is more likely than not, based on the technical merits, that the position will be sustained upon examination, assuming the position will be audited and the taxing authority has full knowledge of all relevant information. As of March 31, 2011 and March 31, 2010, the Company’s unrecognized tax benefits totaled $406 million and $523 million, respectively, of which $86 million and $179 million would affect the effective tax rate, if recognized. The following table reconciles the changes to the Company’s unrecognized tax benefits for the years ended March 31, 2011 and March 31, 2010:
(In millions of dollars)
2011 2010
Beginning balance 523$ 368$
Gross increases (decreases) related to prior period (45) 150
Gross increases (decreases) related to current period 52 5
Settlements with tax authorities (114) -
Reductions due to lapse of statute of limitations (10) -
Ending balance 406$ 523$
March 31
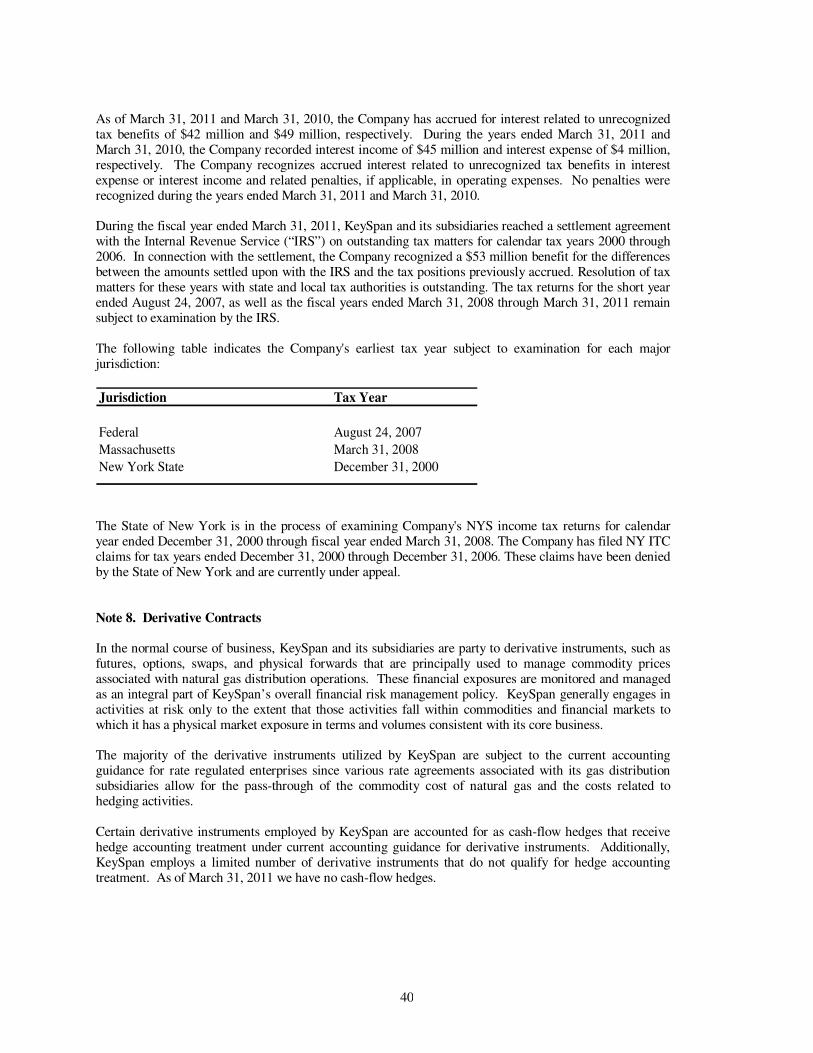
40
As of March 31, 2011 and March 31, 2010, the Company has accrued for interest related to unrecognized tax benefits of $42 million and $49 million, respectively. During the years ended March 31, 2011 and March 31, 2010, the Company recorded interest income of $45 million and interest expense of $4 million, respectively. The Company recognizes accrued interest related to unrecognized tax benefits in interest expense or interest income and related penalties, if applicable, in operating expenses. No penalties were recognized during the years ended March 31, 2011 and March 31, 2010. During the fiscal year ended March 31, 2011, KeySpan and its subsidiaries reached a settlement agreement with the Internal Revenue Service (“IRS”) on outstanding tax matters for calendar tax years 2000 through 2006. In connection with the settlement, the Company recognized a $53 million benefit for the differences between the amounts settled upon with the IRS and the tax positions previously accrued. Resolution of tax matters for these years with state and local tax authorities is outstanding. The tax returns for the short year ended August 24, 2007, as well as the fiscal years ended March 31, 2008 through March 31, 2011 remain subject to examination by the IRS. The following table indicates the Company's earliest tax year subject to examination for each major jurisdiction:
Jurisdiction Tax Year
Federal August 24, 2007
Massachusetts March 31, 2008
New York State December 31, 2000
The State of New York is in the process of examining Company's NYS income tax returns for calendar year ended December 31, 2000 through fiscal year ended March 31, 2008. The Company has filed NY ITC claims for tax years ended December 31, 2000 through December 31, 2006. These claims have been denied by the State of New York and are currently under appeal. Note 8. Derivative Contracts In the normal course of business, KeySpan and its subsidiaries are party to derivative instruments, such as futures, options, swaps, and physical forwards that are principally used to manage commodity prices associated with natural gas distribution operations. These financial exposures are monitored and managed as an integral part of KeySpan’s overall financial risk management policy. KeySpan generally engages in activities at risk only to the extent that those activities fall within commodities and financial markets to which it has a physical market exposure in terms and volumes consistent with its core business. The majority of the derivative instruments utilized by KeySpan are subject to the current accounting guidance for rate regulated enterprises since various rate agreements associated with its gas distribution subsidiaries allow for the pass-through of the commodity cost of natural gas and the costs related to hedging activities. Certain derivative instruments employed by KeySpan are accounted for as cash-flow hedges that receive hedge accounting treatment under current accounting guidance for derivative instruments. Additionally, KeySpan employs a limited number of derivative instruments that do not qualify for hedge accounting treatment. As of March 31, 2011 we have no cash-flow hedges.
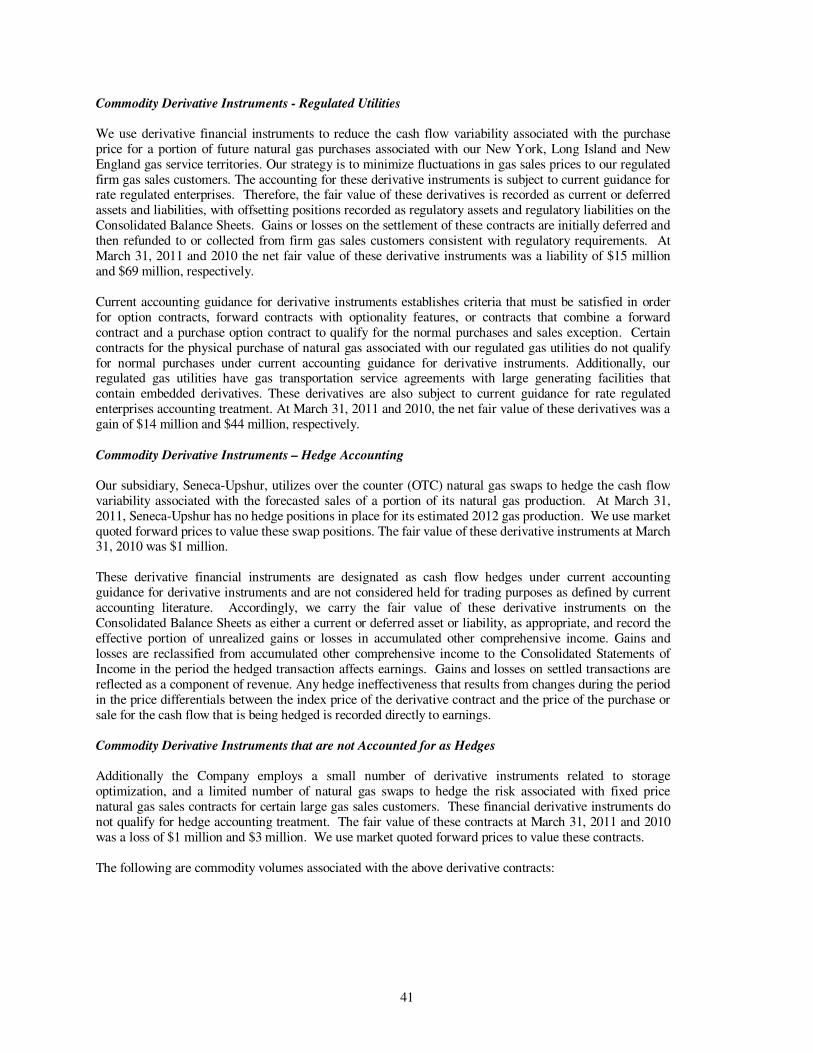
41
Commodity Derivative Instruments - Regulated Utilities We use derivative financial instruments to reduce the cash flow variability associated with the purchase price for a portion of future natural gas purchases associated with our New York, Long Island and New England gas service territories. Our strategy is to minimize fluctuations in gas sales prices to our regulated firm gas sales customers. The accounting for these derivative instruments is subject to current guidance for rate regulated enterprises. Therefore, the fair value of these derivatives is recorded as current or deferred assets and liabilities, with offsetting positions recorded as regulatory assets and regulatory liabilities on the Consolidated Balance Sheets. Gains or losses on the settlement of these contracts are initially deferred and then refunded to or collected from firm gas sales customers consistent with regulatory requirements. At March 31, 2011 and 2010 the net fair value of these derivative instruments was a liability of $15 million and $69 million, respectively. Current accounting guidance for derivative instruments establishes criteria that must be satisfied in order for option contracts, forward contracts with optionality features, or contracts that combine a forward contract and a purchase option contract to qualify for the normal purchases and sales exception. Certain contracts for the physical purchase of natural gas associated with our regulated gas utilities do not qualify for normal purchases under current accounting guidance for derivative instruments. Additionally, our regulated gas utilities have gas transportation service agreements with large generating facilities that contain embedded derivatives. These derivatives are also subject to current guidance for rate regulated enterprises accounting treatment. At March 31, 2011 and 2010, the net fair value of these derivatives was a gain of $14 million and $44 million, respectively. Commodity Derivative Instruments – Hedge Accounting Our subsidiary, Seneca-Upshur, utilizes over the counter (OTC) natural gas swaps to hedge the cash flow variability associated with the forecasted sales of a portion of its natural gas production. At March 31, 2011, Seneca-Upshur has no hedge positions in place for its estimated 2012 gas production. We use market quoted forward prices to value these swap positions. The fair value of these derivative instruments at March 31, 2010 was $1 million. These derivative financial instruments are designated as cash flow hedges under current accounting guidance for derivative instruments and are not considered held for trading purposes as defined by current accounting literature. Accordingly, we carry the fair value of these derivative instruments on the Consolidated Balance Sheets as either a current or deferred asset or liability, as appropriate, and record the effective portion of unrealized gains or losses in accumulated other comprehensive income. Gains and losses are reclassified from accumulated other comprehensive income to the Consolidated Statements of Income in the period the hedged transaction affects earnings. Gains and losses on settled transactions are reflected as a component of revenue. Any hedge ineffectiveness that results from changes during the period in the price differentials between the index price of the derivative contract and the price of the purchase or sale for the cash flow that is being hedged is recorded directly to earnings. Commodity Derivative Instruments that are not Accounted for as Hedges Additionally the Company employs a small number of derivative instruments related to storage optimization, and a limited number of natural gas swaps to hedge the risk associated with fixed price natural gas sales contracts for certain large gas sales customers. These financial derivative instruments do not qualify for hedge accounting treatment. The fair value of these contracts at March 31, 2011 and 2010 was a loss of $1 million and $3 million. We use market quoted forward prices to value these contracts. The following are commodity volumes associated with the above derivative contracts:
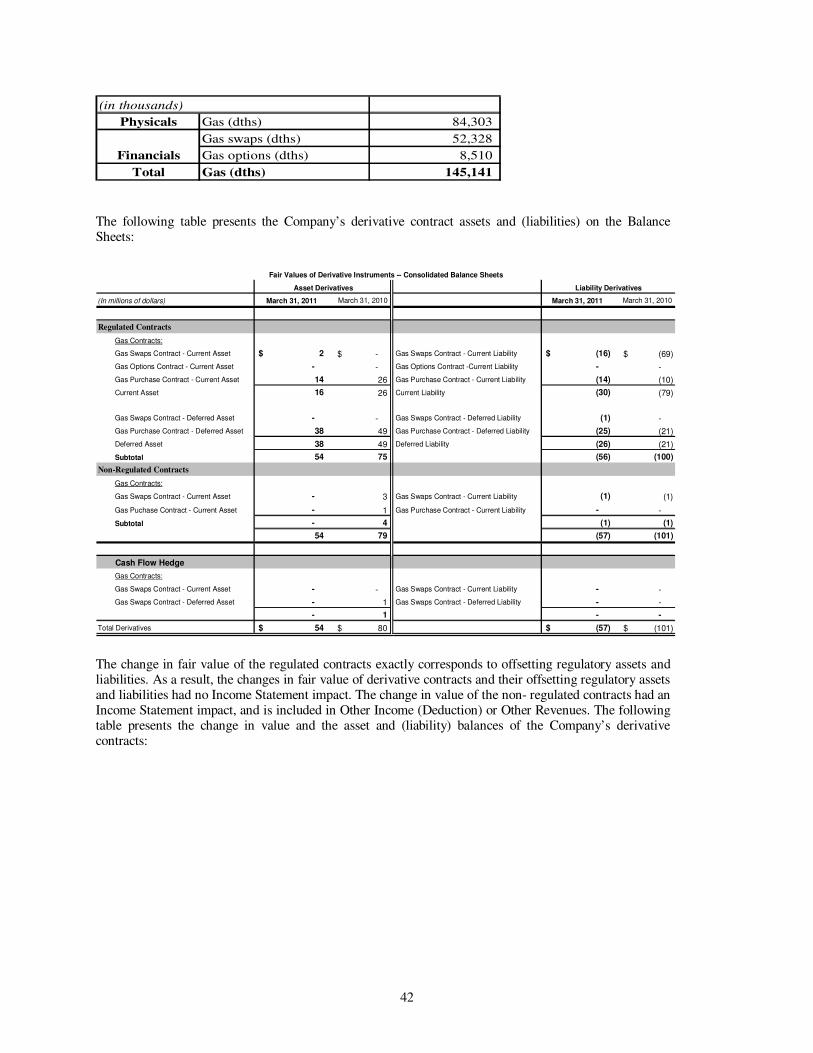
42
Physicals Gas (dths) 84,303
Gas swaps (dths) 52,328
Gas options (dths) 8,510
Total Gas (dths) 145,141
(in thousands)
Financials
The following table presents the Company’s derivative contract assets and (liabilities) on the Balance Sheets:
(In millions of dollars) March 31, 2011 March 31, 2010 March 31, 2011 March 31, 2010
Regulated Contracts
Gas Contracts:
Gas Swaps Contract - Current Asset 2$ -$ Gas Swaps Contract - Current Liability (16)$ (69)$
Gas Options Contract - Current Asset - - Gas Options Contract -Current Liability - -
Gas Purchase Contract - Current Asset 14 26 Gas Purchase Contract - Current Liability (14) (10)
Current Asset 16 26 Current Liability (30) (79)
Gas Swaps Contract - Deferred Asset - - Gas Swaps Contract - Deferred Liability (1) -
Gas Purchase Contract - Deferred Asset 38 49 Gas Purchase Contract - Deferred Liability (25) (21)
Deferred Asset 38 49 Deferred Liability (26) (21)
Subtotal 54 75 (56) (100)
Non-Regulated Contracts
Gas Contracts:
Gas Swaps Contract - Current Asset - 3 Gas Swaps Contract - Current Liability (1) (1)
Gas Puchase Contract - Current Asset - 1 Gas Purchase Contract - Current Liability - -
Subtotal - 4 (1) (1)
54 79 (57) (101)
Cash Flow Hedge
Gas Contracts:
Gas Swaps Contract - Current Asset - - Gas Swaps Contract - Current Liability - -
Gas Swaps Contract - Deferred Asset - 1 Gas Swaps Contract - Deferred Liability - -
- 1 - -
Total Derivatives 54$ 80$ (57)$ (101)$
Fair Values of Derivative Instruments -- Consolidated Balance Sheets
Asset Derivatives Liability Derivatives
The change in fair value of the regulated contracts exactly corresponds to offsetting regulatory assets and liabilities. As a result, the changes in fair value of derivative contracts and their offsetting regulatory assets and liabilities had no Income Statement impact. The change in value of the non- regulated contracts had an Income Statement impact, and is included in Other Income (Deduction) or Other Revenues. The following table presents the change in value and the asset and (liability) balances of the Company’s derivative contracts:
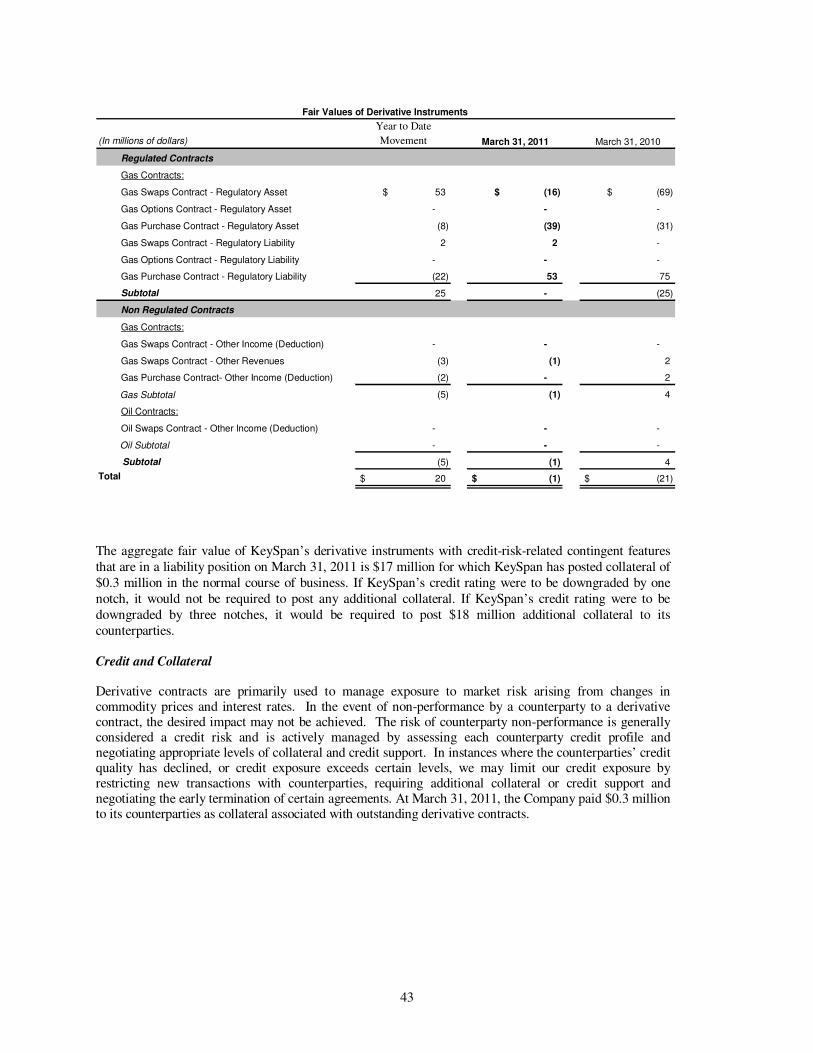
43
(In millions of dollars)
Year to Date
Movement March 31, 2011 March 31, 2010
Regulated Contracts
Gas Contracts:
Gas Swaps Contract - Regulatory Asset 53$ (16)$ (69)$
Gas Options Contract - Regulatory Asset - - -
Gas Purchase Contract - Regulatory Asset (8) (39) (31)
Gas Swaps Contract - Regulatory Liability 2 2 -
Gas Options Contract - Regulatory Liability - - -
Gas Purchase Contract - Regulatory Liability (22) 53 75
Subtotal 25 - (25)
Non Regulated Contracts
Gas Contracts:
Gas Swaps Contract - Other Income (Deduction) - - -
Gas Swaps Contract - Other Revenues (3) (1) 2
Gas Purchase Contract- Other Income (Deduction) (2) - 2
Gas Subtotal (5) (1) 4
Oil Contracts:
Oil Swaps Contract - Other Income (Deduction) - - -
Oil Subtotal - - -
Subtotal (5) (1) 4
Total 20$ (1)$ (21)$
Fair Values of Derivative Instruments
The aggregate fair value of KeySpan’s derivative instruments with credit-risk-related contingent features that are in a liability position on March 31, 2011 is $17 million for which KeySpan has posted collateral of $0.3 million in the normal course of business. If KeySpan’s credit rating were to be downgraded by one notch, it would not be required to post any additional collateral. If KeySpan’s credit rating were to be downgraded by three notches, it would be required to post $18 million additional collateral to its counterparties. Credit and Collateral Derivative contracts are primarily used to manage exposure to market risk arising from changes in commodity prices and interest rates. In the event of non-performance by a counterparty to a derivative contract, the desired impact may not be achieved. The risk of counterparty non-performance is generally considered a credit risk and is actively managed by assessing each counterparty credit profile and negotiating appropriate levels of collateral and credit support. In instances where the counterparties’ credit quality has declined, or credit exposure exceeds certain levels, we may limit our credit exposure by restricting new transactions with counterparties, requiring additional collateral or credit support and negotiating the early termination of certain agreements. At March 31, 2011, the Company paid $0.3 million to its counterparties as collateral associated with outstanding derivative contracts.
44
Note 9. Fair Value Measurements Fair value is the price that would be received to sell an asset or paid to transfer a liability in an orderly transaction between market participants at the measurement date. The following is a fair value hierarchy that prioritizes the inputs to valuation techniques used to measure fair value into three levels as follows: The Company’s Level 1 fair value derivative instruments primarily consist of quoted prices (unadjusted) in active markets for identical assets or liabilities that a company has the ability to access as of the reporting date. Derivative assets and liabilities utilizing Level 1 inputs include active exchange-based derivatives (e.g. natural gas futures traded on New York Mercantile Exchange (“NYMEX”). The Company’s Level 2 fair value derivative instruments primarily consist of over-the-counter (“OTC”) gas swaps and forward physical gas deals where market data for pricing inputs is observable. Level 2 pricing inputs are obtained from the New York Mercantile Exchange (“NYMEX”) and and Intercontinental Exchange (“ICE), except cases when ICE publishes seasonal averages or there were no transactions within last seven days. During periods prior to March 31, 2011, Level 2 pricing inputs were obtained from NYMEX and Platts M2M (industry standard, non-exchange-based editorial commodity forward curves) when it can be verified by available market data from ICE based on transactions within last seven days. Level 2 derivative instruments may utilize discounting based on quoted interest rate curve as well as have liquidity reserve calculated based on bid/ask spread. Substantially all of these price curves are observable in the marketplace throughout at least 95% of the remaining contractual quantity, or they could be constructed from market observable curves with correlation coefficients of 0.95 or higher. Level 3 fair value derivative instruments primarily consist of our gas OTC forwards, options, and physical gas transactions where pricing inputs are unobservable, as well as other complex and structured transactions. Complex or structured transactions can introduce the need for internally-developed models based on reasonable assumptions. Industry-standard valuation techniques, such as Black-Scholes pricing model, Monte Carlo simulation, and FEA libraries are used for valuing such instruments. Level 3 is also applied in cases when forward curve is internally developed, extrapolated or derived from market observable curve with correlation coefficients less than 0.95, or optionality is present, or non-economical assumptions are made. The internally developed forward curves have a high level of correlation with Platts M2M curves. Available for sale securities are primarily in equities and are investments based on quoted market prices (Level 1) and municipal and corporate bonds based on quoted prices of similar traded assets in open markets (Levels 2 and 3). The following table presents assets and liabilities measured and recorded at fair value on the Company’s Consolidated Balance Sheet on a recurring basis and their level within the fair value hierarchy as of March 31, 2011:
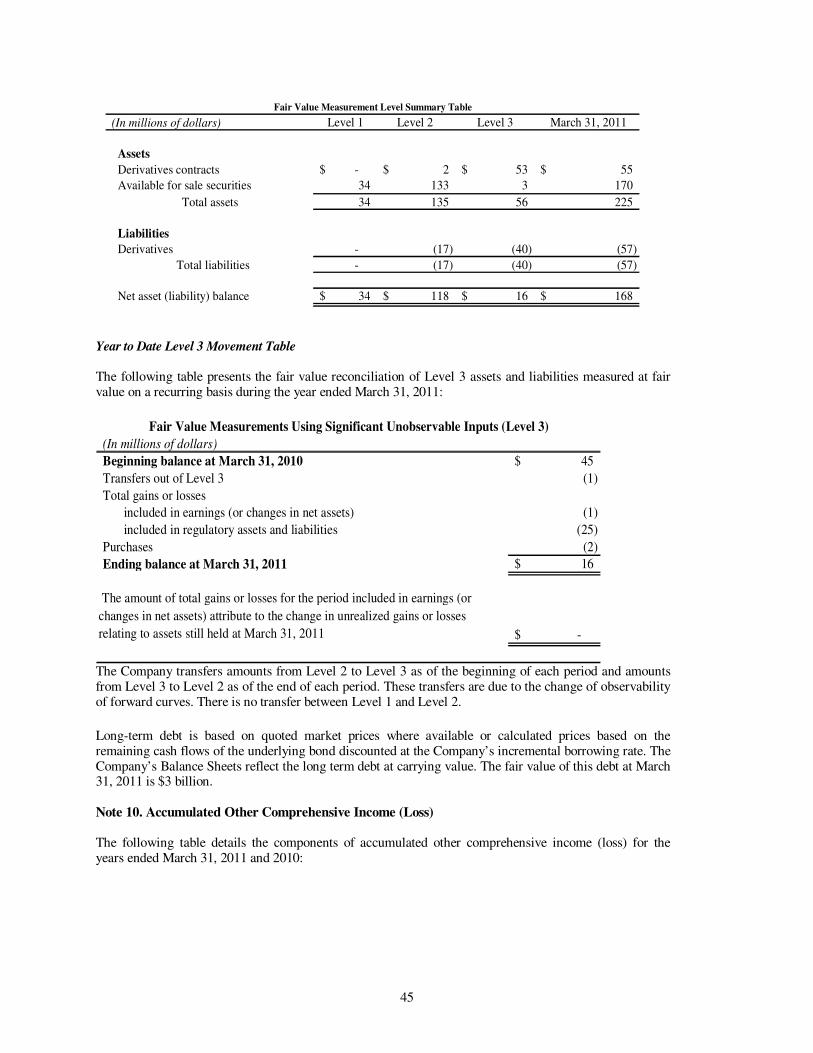
45
(In millions of dollars) Level 1 Level 2 Level 3 March 31, 2011
Assets
Derivatives contracts -$ 2$ 53$ 55$
Available for sale securities 34 133 3 170 Other - - - -
Total assets 34 135 56 225
Liabilities
Derivatives - (17) (40) (57)
Total liabilities - (17) (40) (57)
Net asset (liability) balance 34$ 118$ 16$ 168$
Fair Value Measurement Level Summary Table
Year to Date Level 3 Movement Table The following table presents the fair value reconciliation of Level 3 assets and liabilities measured at fair value on a recurring basis during the year ended March 31, 2011:
(In millions of dollars)
Beginning balance at March 31, 2010 45$
Transfers out of Level 3 (1)
Total gains or losses
included in earnings (or changes in net assets) (1)
included in regulatory assets and liabilities (25)
Purchases (2)
Ending balance at March 31, 2011 16$
The amount of total gains or losses for the period included in earnings (or
changes in net assets) attribute to the change in unrealized gains or losses
relating to assets still held at March 31, 2011 -$
Fair Value Measurements Using Significant Unobservable Inputs (Level 3)
The Company transfers amounts from Level 2 to Level 3 as of the beginning of each period and amounts from Level 3 to Level 2 as of the end of each period. These transfers are due to the change of observability of forward curves. There is no transfer between Level 1 and Level 2.
Long-term debt is based on quoted market prices where available or calculated prices based on the remaining cash flows of the underlying bond discounted at the Company’s incremental borrowing rate. The Company’s Balance Sheets reflect the long term debt at carrying value. The fair value of this debt at March 31, 2011 is $3 billion. Note 10. Accumulated Other Comprehensive Income (Loss) The following table details the components of accumulated other comprehensive income (loss) for the years ended March 31, 2011 and 2010:
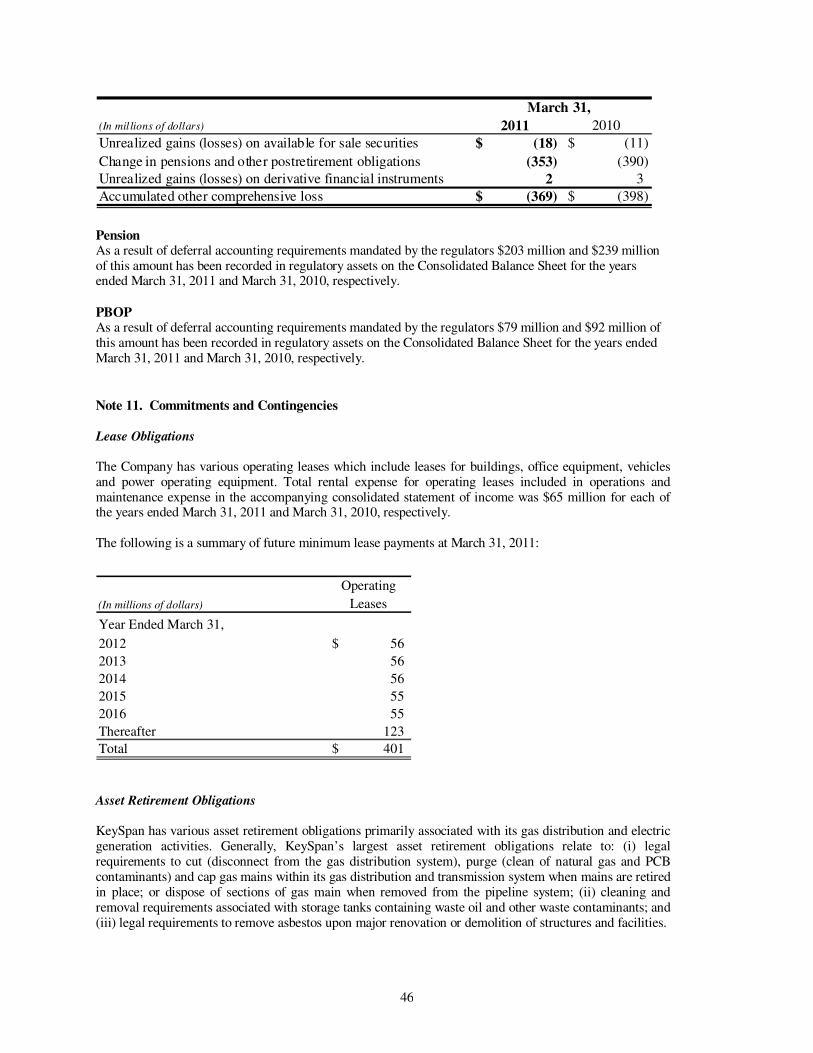
46
(In millions of dollars) 2011 2010
Unrealized gains (losses) on available for sale securities (18)$ (11)$
Change in pensions and other postretirement obligations (353) (390)
Unrealized gains (losses) on derivative financial instruments 2 3
Accumulated other comprehensive loss (369)$ (398)$
March 31,
Pension As a result of deferral accounting requirements mandated by the regulators $203 million and $239 million of this amount has been recorded in regulatory assets on the Consolidated Balance Sheet for the years ended March 31, 2011 and March 31, 2010, respectively.
PBOP As a result of deferral accounting requirements mandated by the regulators $79 million and $92 million of this amount has been recorded in regulatory assets on the Consolidated Balance Sheet for the years ended March 31, 2011 and March 31, 2010, respectively.
Note 11. Commitments and Contingencies Lease Obligations The Company has various operating leases which include leases for buildings, office equipment, vehicles and power operating equipment. Total rental expense for operating leases included in operations and maintenance expense in the accompanying consolidated statement of income was $65 million for each of the years ended March 31, 2011 and March 31, 2010, respectively. The following is a summary of future minimum lease payments at March 31, 2011:
Operating
(In millions of dollars) Leases
Year Ended March 31,
2012 56$
2013 56
2014 56
2015 55
2016 55
Thereafter 123
Total 401$
Asset Retirement Obligations
KeySpan has various asset retirement obligations primarily associated with its gas distribution and electric generation activities. Generally, KeySpan’s largest asset retirement obligations relate to: (i) legal requirements to cut (disconnect from the gas distribution system), purge (clean of natural gas and PCB contaminants) and cap gas mains within its gas distribution and transmission system when mains are retired in place; or dispose of sections of gas main when removed from the pipeline system; (ii) cleaning and removal requirements associated with storage tanks containing waste oil and other waste contaminants; and (iii) legal requirements to remove asbestos upon major renovation or demolition of structures and facilities.
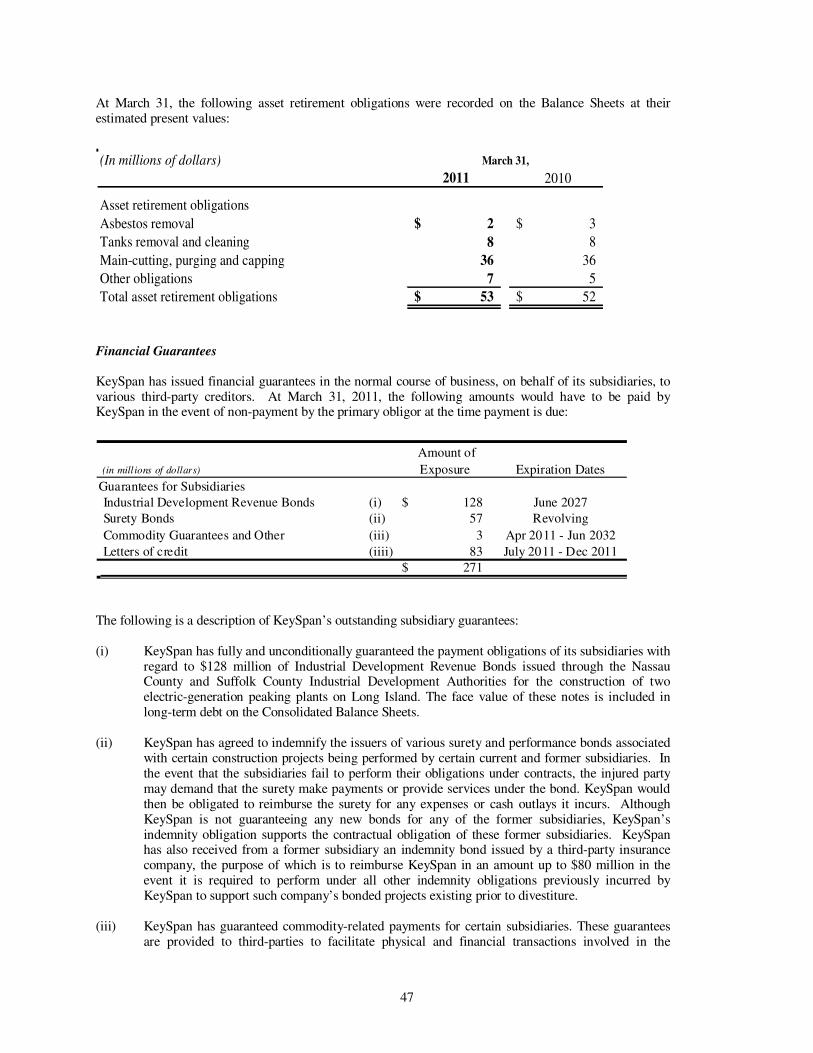
47
At March 31, the following asset retirement obligations were recorded on the Balance Sheets at their estimated present values:
(In millions of dollars)
2011 2010
Asset retirement obligations
Asbestos removal 2$ 3$
Tanks removal and cleaning 8 8
Main-cutting, purging and capping 36 36
Other obligations 7 5
Total asset retirement obligations 53$ 52$
March 31,
Financial Guarantees
KeySpan has issued financial guarantees in the normal course of business, on behalf of its subsidiaries, to various third-party creditors. At March 31, 2011, the following amounts would have to be paid by KeySpan in the event of non-payment by the primary obligor at the time payment is due:
(in mill ions of dollars)
Amount of
Exposure Expiration Dates
Guarantees for Subsidiaries
Industrial Development Revenue Bonds (i) 128$ June 2027
Surety Bonds (ii) 57 Revolving
Commodity Guarantees and Other (iii) 3 Apr 2011 - Jun 2032
Letters of credit (iiii) 83 July 2011 - Dec 2011
271$
The following is a description of KeySpan’s outstanding subsidiary guarantees: (i) KeySpan has fully and unconditionally guaranteed the payment obligations of its subsidiaries with
regard to $128 million of Industrial Development Revenue Bonds issued through the Nassau County and Suffolk County Industrial Development Authorities for the construction of two electric-generation peaking plants on Long Island. The face value of these notes is included in long-term debt on the Consolidated Balance Sheets.
(ii) KeySpan has agreed to indemnify the issuers of various surety and performance bonds associated
with certain construction projects being performed by certain current and former subsidiaries. In the event that the subsidiaries fail to perform their obligations under contracts, the injured party may demand that the surety make payments or provide services under the bond. KeySpan would then be obligated to reimburse the surety for any expenses or cash outlays it incurs. Although KeySpan is not guaranteeing any new bonds for any of the former subsidiaries, KeySpan’s indemnity obligation supports the contractual obligation of these former subsidiaries. KeySpan has also received from a former subsidiary an indemnity bond issued by a third-party insurance company, the purpose of which is to reimburse KeySpan in an amount up to $80 million in the event it is required to perform under all other indemnity obligations previously incurred by KeySpan to support such company’s bonded projects existing prior to divestiture.
(iii) KeySpan has guaranteed commodity-related payments for certain subsidiaries. These guarantees
are provided to third-parties to facilitate physical and financial transactions involved in the
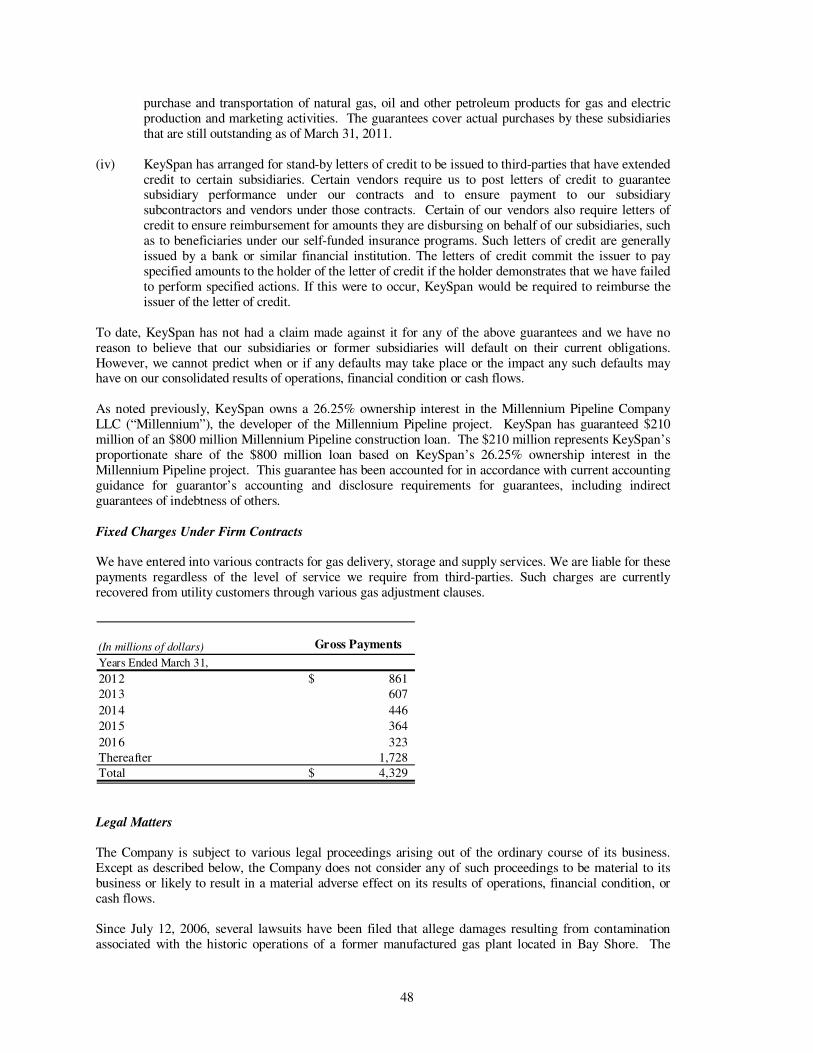
48
purchase and transportation of natural gas, oil and other petroleum products for gas and electric production and marketing activities. The guarantees cover actual purchases by these subsidiaries that are still outstanding as of March 31, 2011.
(iv) KeySpan has arranged for stand-by letters of credit to be issued to third-parties that have extended
credit to certain subsidiaries. Certain vendors require us to post letters of credit to guarantee subsidiary performance under our contracts and to ensure payment to our subsidiary subcontractors and vendors under those contracts. Certain of our vendors also require letters of credit to ensure reimbursement for amounts they are disbursing on behalf of our subsidiaries, such as to beneficiaries under our self-funded insurance programs. Such letters of credit are generally issued by a bank or similar financial institution. The letters of credit commit the issuer to pay specified amounts to the holder of the letter of credit if the holder demonstrates that we have failed to perform specified actions. If this were to occur, KeySpan would be required to reimburse the issuer of the letter of credit.
To date, KeySpan has not had a claim made against it for any of the above guarantees and we have no reason to believe that our subsidiaries or former subsidiaries will default on their current obligations. However, we cannot predict when or if any defaults may take place or the impact any such defaults may have on our consolidated results of operations, financial condition or cash flows. As noted previously, KeySpan owns a 26.25% ownership interest in the Millennium Pipeline Company LLC (“Millennium”), the developer of the Millennium Pipeline project. KeySpan has guaranteed $210 million of an $800 million Millennium Pipeline construction loan. The $210 million represents KeySpan’s proportionate share of the $800 million loan based on KeySpan’s 26.25% ownership interest in the Millennium Pipeline project. This guarantee has been accounted for in accordance with current accounting guidance for guarantor’s accounting and disclosure requirements for guarantees, including indirect guarantees of indebtness of others. Fixed Charges Under Firm Contracts We have entered into various contracts for gas delivery, storage and supply services. We are liable for these payments regardless of the level of service we require from third-parties. Such charges are currently recovered from utility customers through various gas adjustment clauses.
(In millions of dollars) Gross Payments
Years Ended March 31,
2012 861$
2013 607
2014 446
2015 364
2016 323
Thereafter 1,728
Total 4,329$
Legal Matters
The Company is subject to various legal proceedings arising out of the ordinary course of its business. Except as described below, the Company does not consider any of such proceedings to be material to its business or likely to result in a material adverse effect on its results of operations, financial condition, or cash flows. Since July 12, 2006, several lawsuits have been filed that allege damages resulting from contamination associated with the historic operations of a former manufactured gas plant located in Bay Shore. The
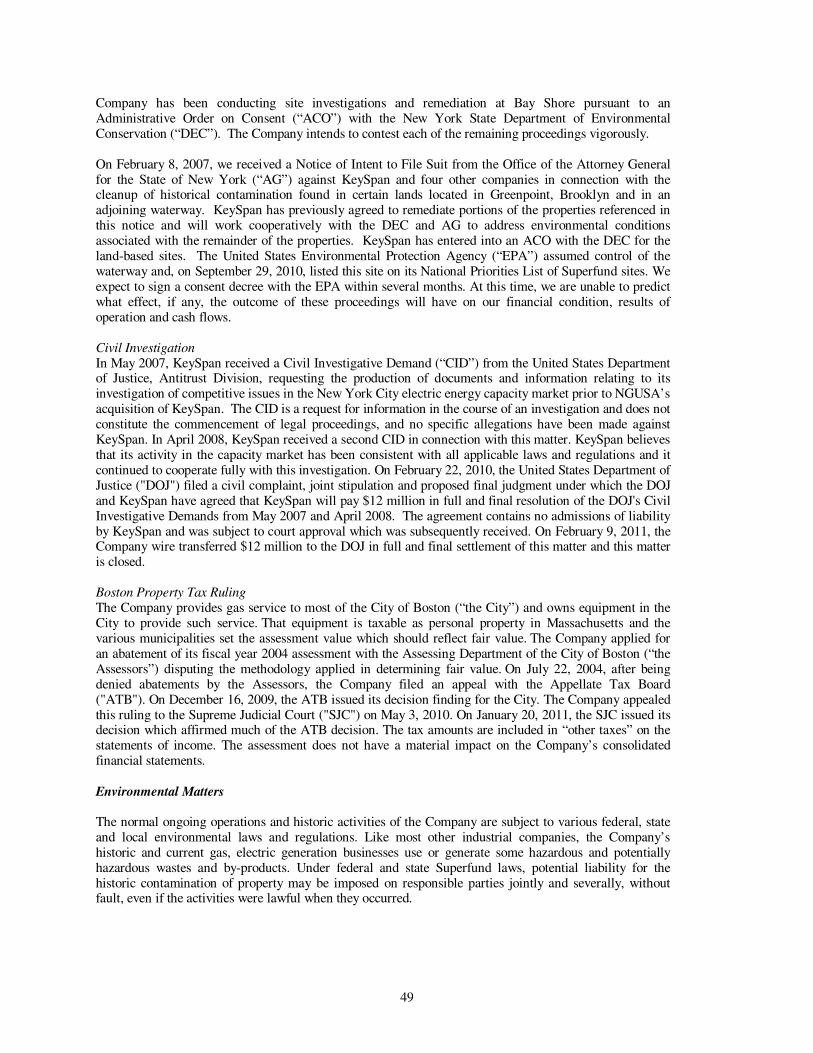
49
Company has been conducting site investigations and remediation at Bay Shore pursuant to an Administrative Order on Consent (“ACO”) with the New York State Department of Environmental Conservation (“DEC”). The Company intends to contest each of the remaining proceedings vigorously. On February 8, 2007, we received a Notice of Intent to File Suit from the Office of the Attorney General for the State of New York (“AG”) against KeySpan and four other companies in connection with the cleanup of historical contamination found in certain lands located in Greenpoint, Brooklyn and in an adjoining waterway. KeySpan has previously agreed to remediate portions of the properties referenced in this notice and will work cooperatively with the DEC and AG to address environmental conditions associated with the remainder of the properties. KeySpan has entered into an ACO with the DEC for the land-based sites. The United States Environmental Protection Agency (“EPA”) assumed control of the waterway and, on September 29, 2010, listed this site on its National Priorities List of Superfund sites. We expect to sign a consent decree with the EPA within several months. At this time, we are unable to predict what effect, if any, the outcome of these proceedings will have on our financial condition, results of operation and cash flows. Civil Investigation In May 2007, KeySpan received a Civil Investigative Demand (“CID”) from the United States Department of Justice, Antitrust Division, requesting the production of documents and information relating to its investigation of competitive issues in the New York City electric energy capacity market prior to NGUSA’s acquisition of KeySpan. The CID is a request for information in the course of an investigation and does not constitute the commencement of legal proceedings, and no specific allegations have been made against KeySpan. In April 2008, KeySpan received a second CID in connection with this matter. KeySpan believes that its activity in the capacity market has been consistent with all applicable laws and regulations and it continued to cooperate fully with this investigation. On February 22, 2010, the United States Department of Justice ("DOJ") filed a civil complaint, joint stipulation and proposed final judgment under which the DOJ and KeySpan have agreed that KeySpan will pay $12 million in full and final resolution of the DOJ's Civil Investigative Demands from May 2007 and April 2008. The agreement contains no admissions of liability by KeySpan and was subject to court approval which was subsequently received. On February 9, 2011, the Company wire transferred $12 million to the DOJ in full and final settlement of this matter and this matter is closed. Boston Property Tax Ruling
The Company provides gas service to most of the City of Boston (“the City”) and owns equipment in the City to provide such service. That equipment is taxable as personal property in Massachusetts and the various municipalities set the assessment value which should reflect fair value. The Company applied for an abatement of its fiscal year 2004 assessment with the Assessing Department of the City of Boston (“the Assessors”) disputing the methodology applied in determining fair value. On July 22, 2004, after being denied abatements by the Assessors, the Company filed an appeal with the Appellate Tax Board ("ATB"). On December 16, 2009, the ATB issued its decision finding for the City. The Company appealed this ruling to the Supreme Judicial Court ("SJC") on May 3, 2010. On January 20, 2011, the SJC issued its decision which affirmed much of the ATB decision. The tax amounts are included in “other taxes” on the statements of income. The assessment does not have a material impact on the Company’s consolidated financial statements. Environmental Matters
The normal ongoing operations and historic activities of the Company are subject to various federal, state and local environmental laws and regulations. Like most other industrial companies, the Company’s historic and current gas, electric generation businesses use or generate some hazardous and potentially hazardous wastes and by-products. Under federal and state Superfund laws, potential liability for the historic contamination of property may be imposed on responsible parties jointly and severally, without fault, even if the activities were lawful when they occurred.
50
Air Our generating facilities are subject to increasingly stringent emissions limitations under current and anticipated future requirements of the United States Environmental Protection Agency (“USEPA”) and the Department of Environmental Conservation (“DEC”). In addition to efforts to improve both ozone and particulate matter air quality, there has been an increased focus on greenhouse gas emissions in recent years. Our previous investments in low NOx boiler combustion modifications, the use of natural gas firing systems at our steam electric generating stations, and the compliance flexibility available under cap and trade programs have enabled the Company to achieve its prior emission reductions in a cost-effective manner. Future investments will include the installation of enhanced NOx controls and efficiency improvement projects at certain of our Long Island based electric generating facilities. The cost of these improvements is estimated to be approximately $100 million; a mechanism for recovery from LIPA of these investments has been established. We are currently developing a compliance strategy to address anticipated future requirements. At this time, we are unable to predict what effect, if any, these future requirements will have on our financial condition, results of operation, and cash flows. Water Additional capital expenditures associated with the renewal of the surface water discharge permits for our power plants will likely be required by the DEC at each of the Long Island power plants pursuant to Section 316 of the Clean Water Act. Draft permits have been issued by the DEC for Glenwood, Port Jefferson, and E.F. Barrett that propose to require the installation of significant capital equipment, including cooling towers at E.F. Barrett, to mitigate the plants' alleged cooling water system impacts to aquatic organisms. The DEC subsequently rescinded the draft permit for E.F. Barrett in order to allow for a review of all potential environmental impacts pursuant to the State Environmental Quality Review Act. Draft permits for Northport and Far Rockaway are expected later in 2011. We are currently conducting additional studies as directed by the DEC to determine the impacts of our discharges on aquatic resources and are engaged in discussions with the DEC regarding the nature of capital upgrades or other mitigation measures necessary to reduce any impacts. In addition, environmental groups have filed comments demanding even more costly retrofits at Glenwood, E.F. Barrett, and Port Jefferson, specifically, the installation of cooling towers. The Company is in discussion with the environmental groups regarding effective alternate mitigation technologies. Discussions with the DEC and the environmental groups have been productive and may lead to mutually agreeable final permits at some or all of the plants. Nevertheless it is possible that the determination of required capital improvements and the issuance of final renewal permits for these plants could involve adjudicatory hearings among the Company, the agency, and the environmental groups. Costs associated with the development of studies and analyses necessary to defend our positions are reimbursable from LIPA under the PSA. Capital costs for expected mitigation requirements at the five plants had been estimated on the order of approximately $100 million and did not anticipate a need for cooling towers at any of the plants. The company believes that two of these plants, the Glenwood and Far Rockaway power generating units, will be selected for decommissioning. Depending on the outcome of the adjudicatory process, which could extend beyond the next fiscal year, ultimate costs could be substantially higher. Costs associated with any finally ordered capital improvements would also be reimbursable from LIPA under the PSA. Land, Manufactured Gas Plants and Related Facilities Federal and state environmental regulators, as well as private parties, have alleged that several of KeySpan’s subsidiaries are potentially responsible parties under Superfund laws for the remediation of numerous contaminated sites in New York and New England. KeySpan’s greatest potential Superfund liabilities relate to manufactured gas plant, or MGP, facilities formerly owned or operated by its subsidiaries or their predecessors. MGP byproducts included fuel oils, hydrocarbons, coal tar, purifier waste and other waste products which may pose a risk to human health and the environment. KeySpan is investigating or remediating these sites, or both, as appropriate. KeySpan uses the “Expected Value” method for measuring its environmental liabilities. The Expected Value method applies a weighting to potential future expenditures based on the probability of these costs being incurred. A liability is recognized for all potential costs based on this probability. Costs considered to be 100% probable of being incurred are recognized in full, with costs below a 100% probability
51
recognized in proportion to their probability. KeySpan discounted its environmental reserves at the time of the KeySpan acquisition by National Grid plc using an appropriate fair value methodology. KeySpan’s total reserve for estimated MGP related environmental activities was approximately $606 million and $567 million at March 31, 2011 and March 31, 2010, respectively, which amounts had been accrued by us as a reasonable estimate of cost for known sites. However, remediation costs for each site may be materially higher than noted, depending upon changing technologies and regulatory standards, selected end use for each site, and actual environmental conditions encountered. Management believes that obligations imposed on KeySpan because of the environmental laws will not have a material adverse effect on its operations, financial condition or cash flows. Through various rate orders issued by the NYPSC, MADPU and NHPUC costs related to MGP environmental cleanup activities are recovered in rates charged to gas distribution customers. Accordingly, KeySpan has reflected a regulatory asset of $1.1 billion and $950 million at March 31, 2011 and March 31, 2010 respectively. KeySpan is pursuing claims against other potentially responsible parties to recover investigation and remediation costs it believes are the obligations of those parties. At this time, we cannot predict the likelihood of success of such claims. Non-Utility Sites The Company is aware of two non-utility sites for which it may have or share environmental remediation or ongoing maintenance responsibility. The Company presently estimates the remaining cost of the environmental cleanup activities for these two non-utility sites will be approximately $23 million and $24 million, which has been accrued at March 31, 2011 and March 31, 2010, respectively, as a reasonable estimate of probable costs for known sites; however, remediation costs for each site may be materially higher than noted, depending upon changing technologies and regulatory standards, selected end use for each site, and actual environmental conditions encountered. The Company believes that in the aggregate, the accrued liability for the sites and related facilities identified above are reasonable estimates of the probable cost for the investigation and remediation of these sites and facilities. As circumstances warrant, we periodically re-evaluate the accrued liabilities associated with MGP sites and related facilities. We may be required to investigate and, if necessary, remediate each site previously noted, or other currently unknown former sites and related facility sites, the cost of which is not presently determinable. Power Supply Agreement
Electric Services and LIPA Agreements
KeySpan and LIPA have three major long-term service agreements to; (i) provide to LIPA all operation, maintenance and construction services and significant administrative services relating to the Long Island electric transmission and distribution system pursuant to the Management Services Agreement (the “MSA”), expiring on December 31, 2013; (ii) supply LIPA with electric generating capacity, energy conversion and ancillary services from our Long Island generating units pursuant to the Power Supply Agreement (the “PSA”), expiring on May 27, 2013, the rates of which are approved by FERC; and (iii) manage all aspects of the fuel supply for our Long Island generating facilities, pursuant to the Energy Management Agreement (the “EMA”), expiring on May 27, 2013. On June 3, 2010, LIPA issued a Request for Proposal (“RFP”) for an operating and maintenance services provider to furnish the services currently provided under the MSA after the MSA expires. The Company and LIPA have recently initiated negotiations for an extension of the PSA that is scheduled to expire on May 27, 2013. The Company believes a new PSA will be executed prior to its expiration that will allow the Company to recover its investment in property, plant, and equipment and other assets used in operations. KeySpan’s compensation for managing the electric transmission and distribution system owned by LIPA under the MSA consists of two components: a minimum fixed compensation component of $224 million per year and a variable component based on electric sales. The fixed component remained unchanged for
52
three years and thereafter increases annually by 1.7%, plus inflation. The variable component is based on electric sales adjusted for inflation. Pursuant to the EMA, KeySpan procures and manages fuel supplies for LIPA to fuel KeySpan’s Long Island based generating facilities. In exchange for these services, KeySpan earns an annual fee of $750 million. Note 12. Related Party Transactions Moneypool
KeySpan and NGUSA operate money pools with National Grid plc to more effectively utilize cash resources and to reduce outside short-term borrowings. Short-term borrowing needs are met first by available funds of the money pool participants. Borrowings from the money pool incur interest at a rate designed to approximate the cost of third-party short-term borrowings, while investments in the money pool earn interest. Funds may be withdrawn from or repaid to the pool at any time without prior notice. The average interest rate for money pool was 1.20% and 0.91% for the years ended March 31, 2011 and 2010, respectively. KeySpan and NGUSA, collectively, have the ability to borrow up to $3 billion from National Grid plc. KeySpan had outstanding borrowings of $450 million at March 31, 2011 and had no outstanding borrowings at March 31, 2010 under this arrangement. Additionally, KeySpan and NGUSA share available funds internally and at March 31, 2011 and March 31, 2010, KeySpan loaned $583 million to NGUSA and borrowed $131 million from NGUSA, respectively. This amount increases or decreases on a daily basis. KeySpan engages in various other transactions with NGUSA subsidiaries. Certain activities and costs, primarily executive and administrative and some human resources, legal, and strategic planning are shared between KeySpan and NGUSA. At March 31, 2011 and 2010, KeySpan had a payable balance of $22 million and a receivable balance of approximately $0.5 million, respectively, to NGUSA for these services. Holding Company Charges
NGUSA received charges from National Grid Commercial Holdings Limited, an affiliated company in the UK, for certain corporate and administrative services provided by the corporate functions of National Grid plc to its US subsidiaries. These charges, which are recorded on the books of NGUSA, have not been reflected on these financial statements. Were these amounts allocated to KeySpan, the estimated effect on net income would be approximately $18.5 and $13 million before taxes and $12 and $9 million after taxes, for the years ended March 31, 2011 and March 31, 2010, respectively. Note 13. Restructuring On January 31, 2011, National Grid plc announced substantial changes to the organization, including new global, US and UK operating models, and changes to the leadership team. The announced structure seeks to create a leaner, more-efficient business backed by streamlined operations that will help meet, more efficiently, the needs of regulators, customers and shareholders. The implementation of the new U.S. business structure commences on April 4, 2011 and targets annualized savings of $200 million by March 2012 primarily through the reduction of up to 1,200 positions. As of March 31, 2011, NGUSA had recorded a $67 million reserve for one-time employment termination benefits related to severance, payroll taxes, healthcare continuation, and outplacement services as well as consulting fees related to the restructuring program. These charges have been recorded by NGUSA and none have been allocated to the Company as at March 31, 2011. Subsequently in June 2011, we offered a voluntary severance plan to certain individuals which is expected to cost up to an additional $20 million.
53
Note 14. Discontinued Operations and Other Dispositions On April 13, 2010, a purchase agreement was signed between KeySpan and Home Service USA Corp.
(“HSUSA”) pertaining to KeySpan's sale of the service contracts portion of its NGES business. Under
terms of the agreement, HSUSA has agreed to acquire the service contract business for $74 million, with
$30 million (net of working capital) paid at closing and an additional $44 million (“NPV”) of estimated
royalties earned and paid over a ten year period. Projected royalties represent 10% of revenues that
HSUSA achieves through the sale of its products, subject to adjustment, in years two through ten following
the closing. This transaction was completed on August 11, 2010. The installation business of NGES has
not been sold. Instead, we are in the process of discontinuing the installation portion of the business after
completing all currently contracted work.
In addition, in September 2010, the Company sold National Grid Development Holding's 52.1% interest in
Honeoye Storage Corporation for $15 million to Consolidated Edison Development Inc. A gain of $11
million is reflected as gain on disposal of assets in the accompanying consolidated statements of income.
On December 8, 2010, NGUSA, on behalf of EnergyNorth and another affiliate, entered into a stock purchase agreement with Liberty Energy Utilities Co., a subsidiary of Algonquin Power & Utilities Corp., whereby NGUSA will sell, and Liberty Energy will purchase, all of the common stock of EnergyNorth and another affiliate for a combined purchase price of $285 million. The parties have filed for the necessary federal and state regulatory approvals that will be required to consummate the transaction. The regulatory approval process is expected to be completed during the year ended March 31, 2012. The assets and liabilities of EnergyNorth are classified as held for sale at March 31, 2011 and 2010.
The information below highlights the major classes of assets, liabilities, revenues and expenses of EnergyNorth:
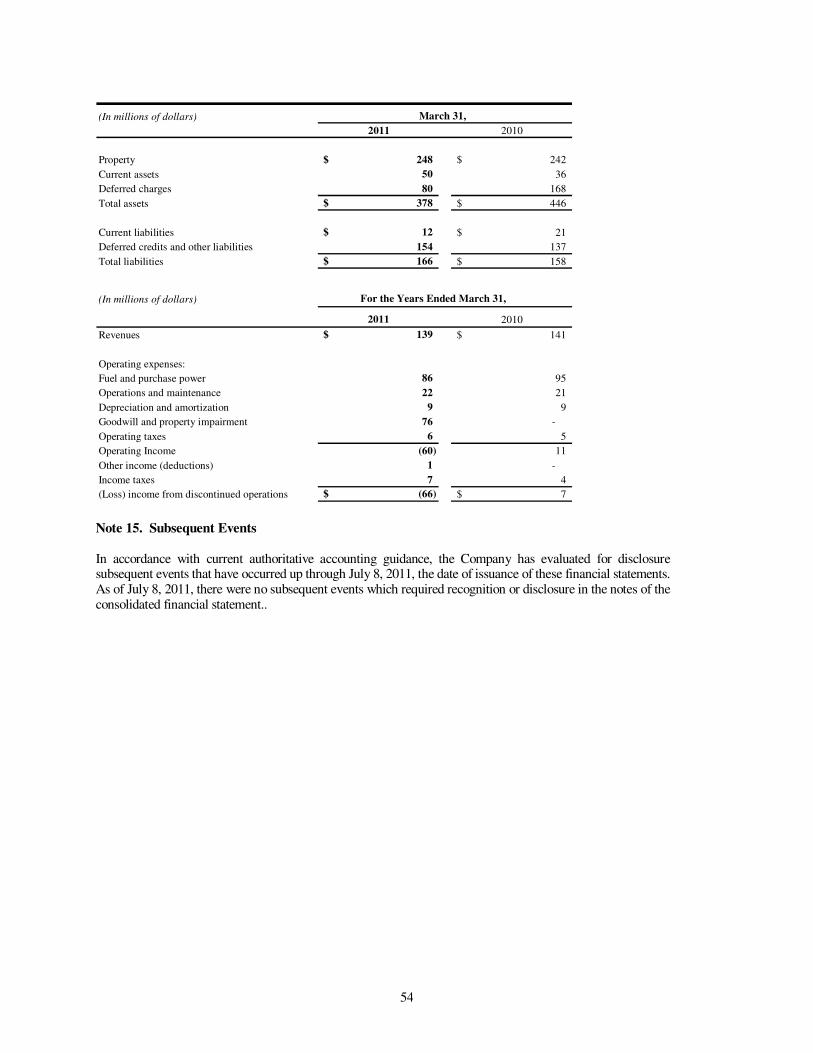
54
(In millions of dollars)
2011 2010
Property 248$ 242$
Current assets 50 36
Deferred charges 80 168
Total assets 378$ 446$
Current liabilities 12$ 21$
Deferred credits and other liabilities 154 137
Total liabilities 166$ 158$
(In millions of dollars)
2011 2010
Revenues 139$ 141$
Operating expenses:
Fuel and purchase power 86 95
Operations and maintenance 22 21
Depreciation and amortization 9 9
Goodwill and property impairment 76 -
Operating taxes 6 5
Operating Income (60) 11
Other income (deductions) 1 -
Income taxes 7 4
(Loss) income from discontinued operations (66)$ 7$
March 31,
For the Years Ended March 31,
Note 15. Subsequent Events In accordance with current authoritative accounting guidance, the Company has evaluated for disclosure subsequent events that have occurred up through July 8, 2011, the date of issuance of these financial statements. As of July 8, 2011, there were no subsequent events which required recognition or disclosure in the notes of the consolidated financial statement..