green bonds: key numbers and trends - moodys.com · sources: climate bonds initiative, moody's...
TRANSCRIPT
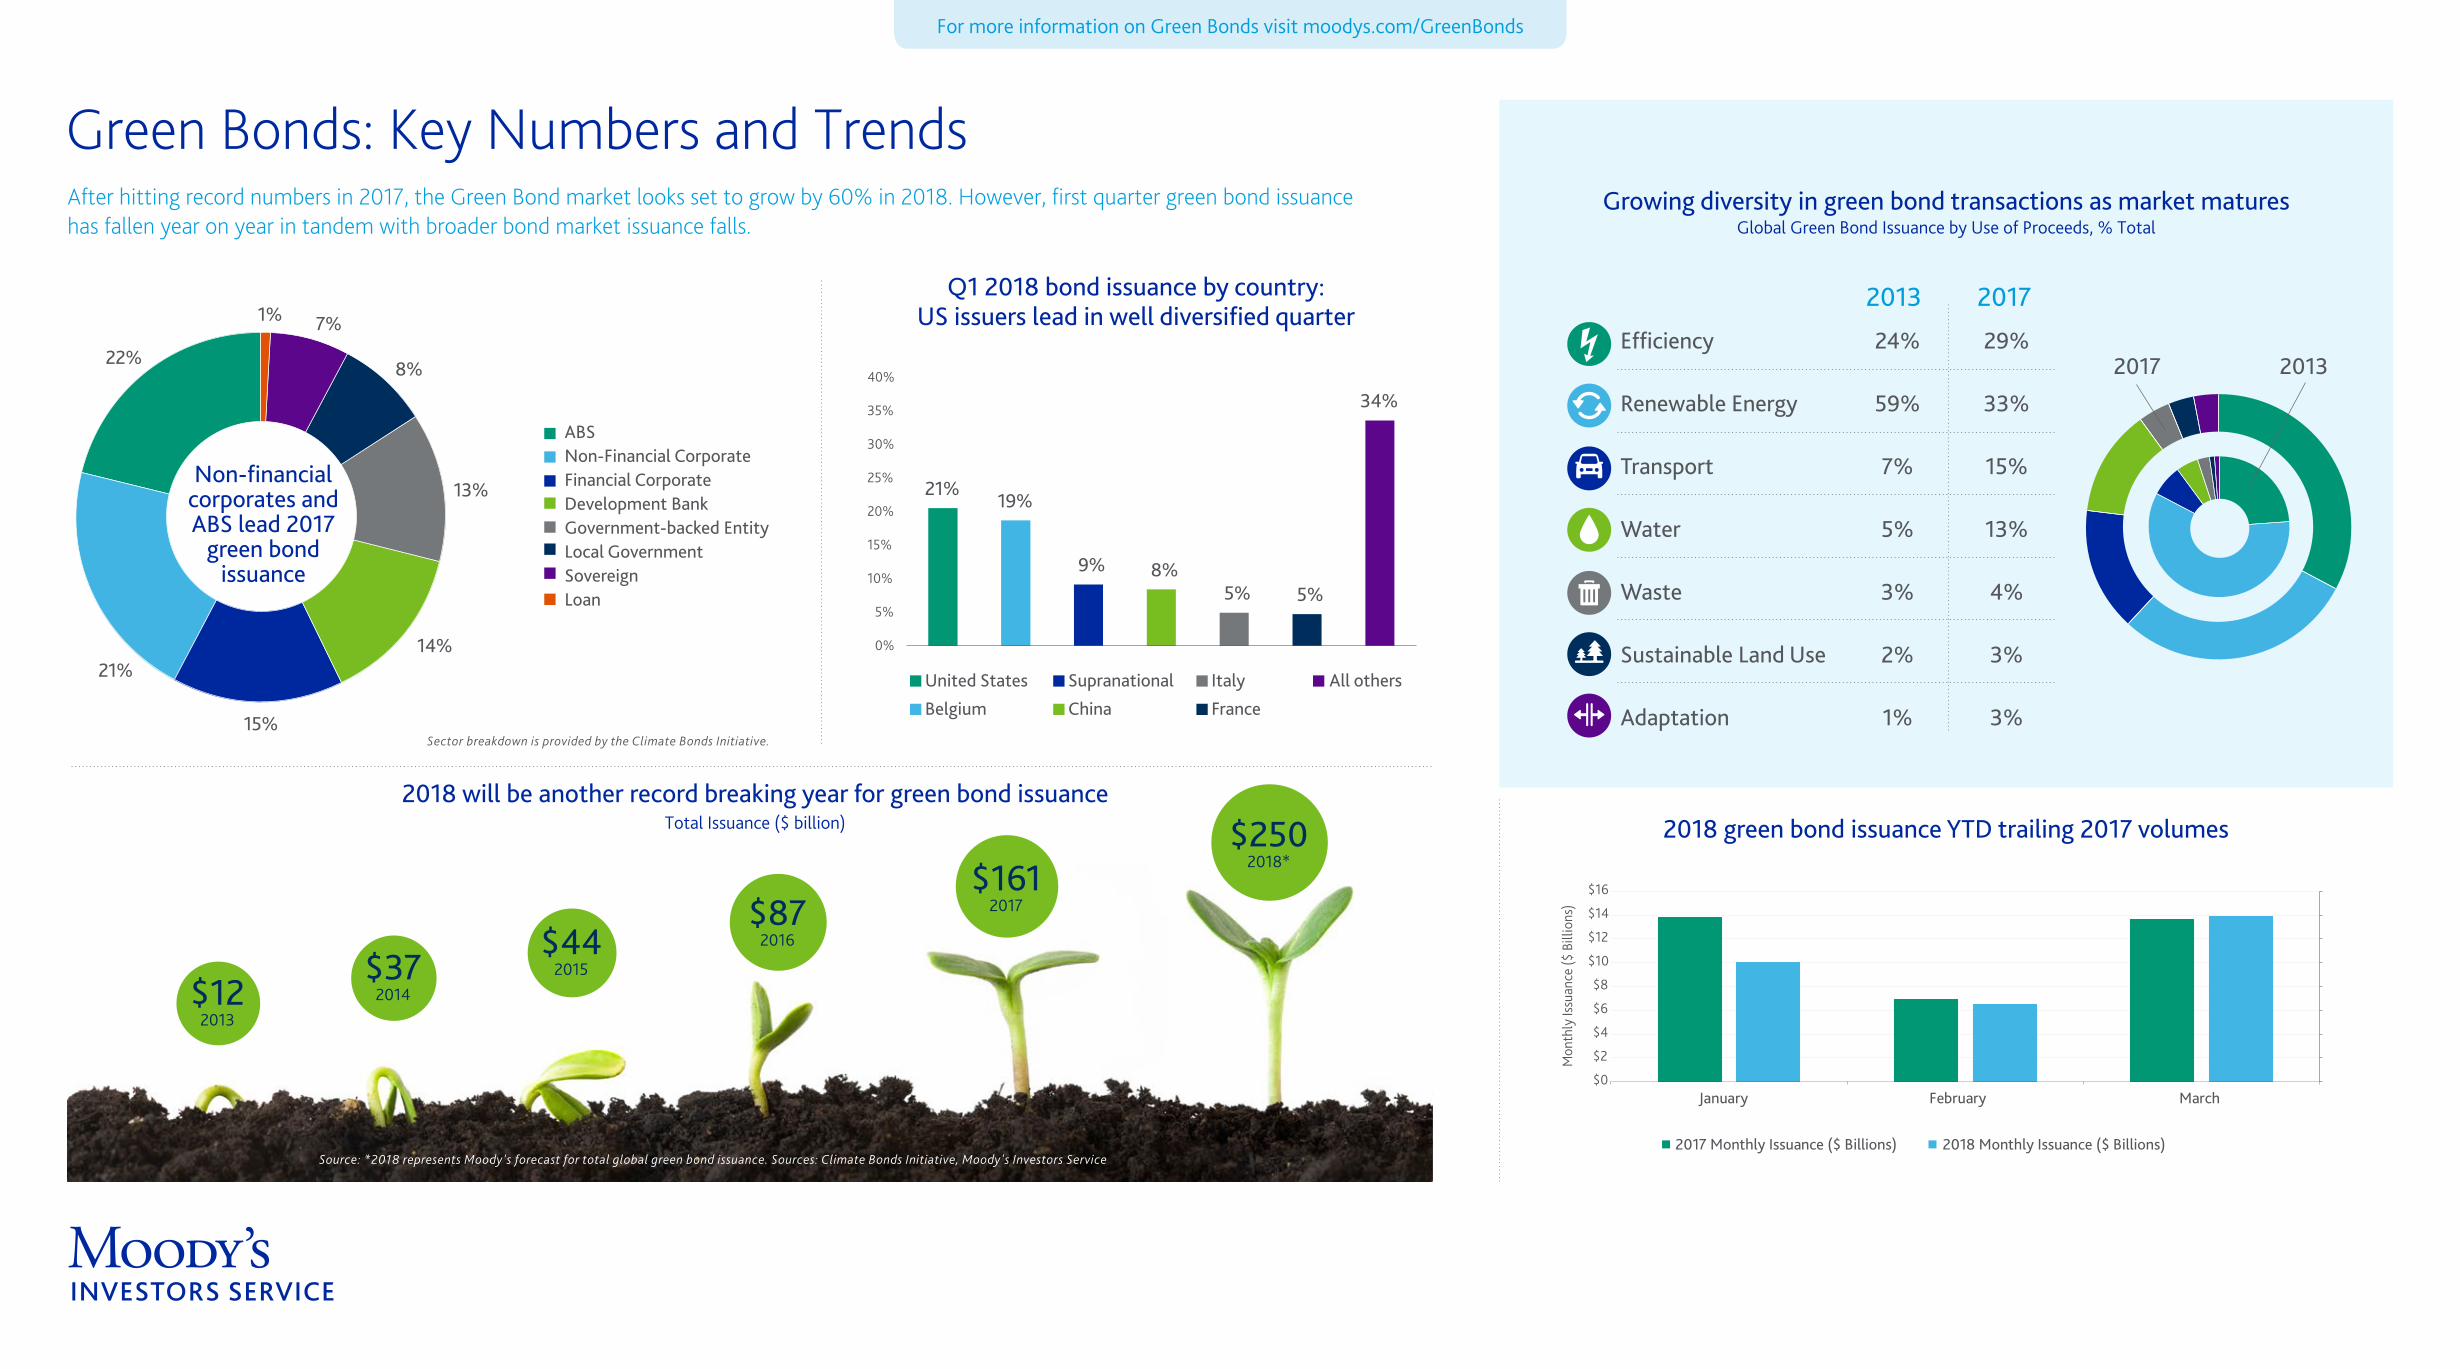
Green Bonds: Key Numbers and Trends
For more information on Green Bonds visit moodys.com/GreenBonds
Growing diversity in green bond transactions as market maturesGlobal Green Bond Issuance by Use of Proceeds, % Total
Source: *2018 represents Moody's forecast for total global green bond issuance. Sources: Climate Bonds Initiative, Moody's Investors Service
After hitting record numbers in 2017, the Green Bond market looks set to grow by 60% in 2018. However, first quarter green bond issuance has fallen year on year in tandem with broader bond market issuance falls.
$122013
$372014
$442015
$872016
$1612017
$2502018*
2018 will be another record breaking year for green bond issuanceTotal Issuance ($ billion)
Q1 2018 bond issuance by country:US issuers lead in well diversified quarter
13%
7%1%
8%
14%
22%
21%
15%
ABSNon-Financial CorporateFinancial CorporateDevelopment BankGovernment-backed EntityLocal GovernmentSovereignLoan
United States
Non-financial corporates and ABS lead 2017
green bond issuance
2018 green bond issuance YTD trailing 2017 volumes
Efficiency
Renewable Energy
Transport
Water
Waste
Sustainable Land Use
Adaptation
29%
33%
15%
13%
4%
3%
3%
24%
59%
7%
5%
3%
2%
1%
2013 2017
2017 2013
Sector breakdown is provided by the Climate Bonds Initiative.
2018 Monthly Issuance ($ Billions)2017 Monthly Issuance ($ Billions)
Belgium
Supranational
China
Italy
France
All others
$0
$2
$4
$6
$8
$10
$12
$14
$16
January February March
Mon
thly
Issu
ance
($ B
illio
ns)
21%19%
9% 8%5% 5%
34%
0%
5%
10%
15%
20%
25%
30%
35%
40%