greater montréal’s flourishing software development sector
TRANSCRIPT

Greater Montréal’sFlourishing Software Development Sector

The world's best economic promotion agency at your service
2

01 02ContentMontréal International’sPersonalized, Free and Confidential Services
AttractiveOperating Costs and Incentives
A Deep and Growing Pool of Highly Qualified Talent
Greater Montréal:A Leading Tech Hub
3
0403

Downtown Montréal © Henry MacDonald
01Greater Montréal:A Leading Tech Hub

5
Top reasons to invest in Montréal’s software development sector
Source: Montréal International’s estimate based on the 2018 TECHNOCompétences’ Labour Diagnostic in ICT in Québec; LinkedIn, Talent Insights, December 2, 2019; Scoring
Tech Talent in North America 2019, CBRE.; Statistics Canada, 2016; QS Best Student Cities in the World, 2019; Research Infosource Inc., 2018; Ministry of Education and Higher
Education, 2020; compilation by Montréal International; Scoring Canadian Tech Talent 2019, CBRE; fDi Benchmark, 2019; fDi Benchmark, 2019.
Incentives: up to 30% of
eligible expenses and
salaries
72,000+ workers
in software development
in Greater Montréal
The lowest operating costs
in Canada and the U.S.
for a software development
company
Voted best student city in
the Americas and Canada’s
university capital
Among the top five cities in
Canada & the U.S. for
highest tech jobs
concentration
The metropolitan area
with the most bilingual
and trilingual population
in Canada
Nearly 17,000 university
students enrolled in IT
related programs and the
highest number of graduates
in tech in Canada
$1 billion+
in yearly funding dedicated
to university research
179,000+ tech workers and
5,000 companies in Greater
Montréal

6
Recent investments by global players
Dec. 2018
Sept. 2017
Nov. 2018
Sept. 2018
Nov. 2016
Oct. 2017
Jan. 2018 Oct. 2018
May 2018
March 2019
June 2018
April 2019June 2019
Feb. 2015
August 2018
Dec. 2016
Feb. 2019July 2018
May 2019
July 2019
Other foreign companies flourishing in Greater Montréal

7
Homegrown Greater Montréal successes
Payment technology solutions company with 850
employees. In Sept. 2020, it soared in its debut as
a public company after raising US$700M in the
largest technology initial public offering ever on the
Toronto Stock Exchange.
One of the first flight-booking applications to use
AI to predict airfare pricing; a global giant, now
worth close to US$1B.
SaaS company that employs more than 500
employees in four offices. It has raised CA$227M
at a valuation of over $1B in Nov. 2019.
A technology company dedicated
to revolutionizing the workplace—putting people
back at the heart of organizations.
Provides point of sale (POS) solutions to retailers
and restaurateurs. As of Oct. 2020, the company’s
market capitalization is $4.9B.
A rapidly-growing company, Breather offers
flexible, short-term office and meeting space
rentals, with 500 plus private locations in 10 major
cities (as of 2020).
Among the largest IT and business consulting
services firms in the world with 77,500 consultants
across more than 400 locations worldwide.
A global leader in training for the civil aviation
and healthcare markets with over 10,000
employees, 160 sites and training locations in
over 35 countries.
8
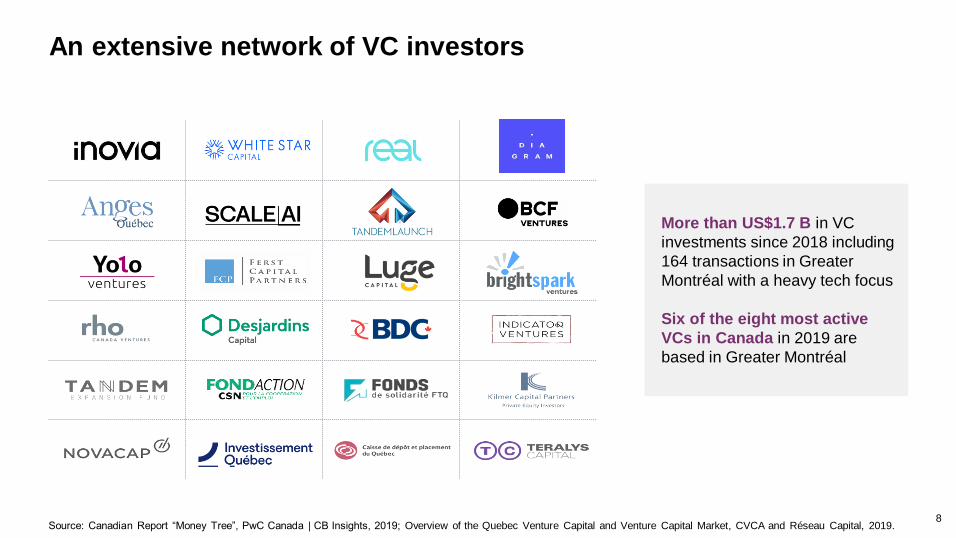
An extensive network of VC investors
Source: Canadian Report “Money Tree”, PwC Canada | CB Insights, 2019; Overview of the Quebec Venture Capital and Venture Capital Market, CVCA and Réseau Capital, 2019.
More than US$1.7 B in VC
investments since 2018 including
164 transactions in Greater
Montréal with a heavy tech focus
Six of the eight most active
VCs in Canada in 2019 are
based in Greater Montréal

9
Fostering tomorrow's breakthroughs: home to leading accelerators and incubators
Techstars Montréal AI selects startups that
advance the development and application of AI
across all industries and markets.
Ranked among the top 20 university business
incubators in the world by UBI Global 2019.
Powered by ETS, Centech provides mentoring,
coaching and financial support to companies.
A partnership with HEC Montréal, CDL-Montréal
runs a specialized program focused on Artificial
Intelligence and data science to capitalize on
Montréal’s expertise in the sector.
An accelerator and founder development program
for early or ideation stage AI-enabled startups.
FounderFuel is an accelerator program
providing structured and unstructured mentoring
and coaching by proven entrepreneurs over a
four-month residency program for two cohorts of
8 to 10 companies per year.
A unique startup foundry and seed fund. Since
2010 they have created over 25 ventures who
have collectively raised over $150M in capital and
are valued at over $500M.
Ranked among the top 20 university business
incubators in the world by UBI Global 2019. The
Centre has helped establish 125 active startups
that employ over 1,200 people and have raised
$110M to date.
As a hub of innovation at Concordia University,
District 3 offers entrepreneurs the resources they
need to move from idea to impact.

Downtown Montréal © Montréal International
A supportive ecosystem
10
Prompt facilitates the creation of
partnerships and the financing
of IT R&D projects
Greater
Montréal
technology
cluster
AI-powered
supply chains
supercluster
IT sector
committee
dedicated to
IT recruitment
professionals
Québec’s
largest ICT
business
network
Cluster organizations
Research Institutes
R&D Financing
Québec’s
AI institute
Institute
for Data
Valorization
An applied
research and
expertise
centre in IT
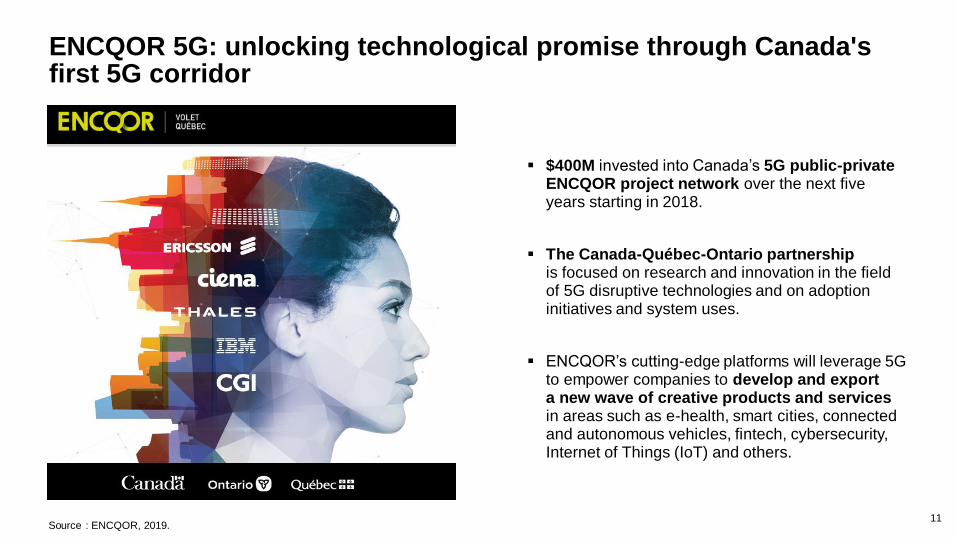
ENCQOR 5G: unlocking technological promise through Canada's first 5G corridor
Source : ENCQOR, 2019.
▪ $400M invested into Canada’s 5G public-private ENCQOR project network over the next five years starting in 2018.
▪ The Canada-Québec-Ontario partnershipis focused on research and innovation in the fieldof 5G disruptive technologies and on adoption initiatives and system uses.
▪ ENCQOR’s cutting-edge platforms will leverage 5G to empower companies to develop and exporta new wave of creative products and servicesin areas such as e-health, smart cities, connected and autonomous vehicles, fintech, cybersecurity, Internet of Things (IoT) and others.
11

Downtown MontréalSource: Mila; Montréal International Analysis.
A world-class hubin artificial intelligence
▪ $3+ billion in AI investments in Greater Montréal since 2016
▪ The Canadian government chose Montréal as headquarters for SCALE AI, Canada's AI supply chain supercluster
▪ A community of more than 600 researchers and graduate students at Mila - the world’s largest academic research lab in deep learning and reinforcement learning
▪ Sample of major players located in Greater Montréal:
12

Square Victoria © Montréal International
02A Deep and GrowingPool of Highly Qualified Talent

Source: Montréal International’s estimate based on 2018 TECHNOCompétences’
Labour Diagnostic in ICT in Québec; Statistics Canada, Labour Force Survey
(LFS), 2018.
179,000+ tech workers in Greater Montréal
14
▪ Greater Montréal boasts an highly qualified
workforce
▪ There is an 18.2% increase in tech jobs in
Greater Montréal (2014-2018)
▪ The turnover rate is as low as 11% for the
tech industry
15
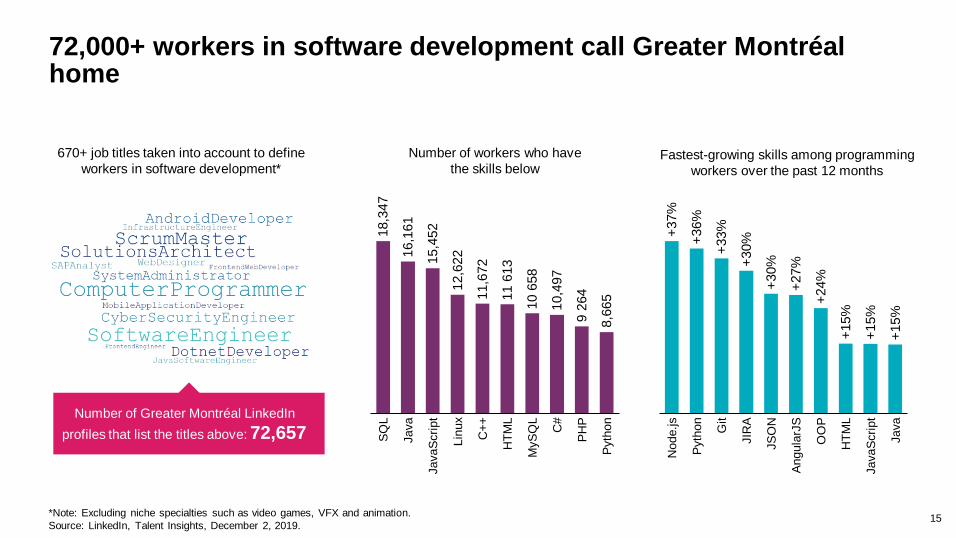
72,000+ workers in software development call Greater Montréal home
*Note: Excluding niche specialties such as video games, VFX and animation.
Source: LinkedIn, Talent Insights, December 2, 2019.
11 6
13
10 6
58
9 2
64
PH
P
MyS
QL
C+
+
JavaS
cri
pt
SQ
L
Java
12,6
22
Lin
ux
HT
ML
C#
Pyth
on
18,3
47
16,1
61
15,4
52
11,6
72
10,4
97
8,6
65
670+ job titles taken into account to define
workers in software development*
Number of workers who have
the skills below
+15%
+15%
+15%
+33%
Pyth
on
Node.js
+30%
Angula
rJS
JIR
A
+36%
Git
JS
ON
OO
P
+37%
+30%
+27%
+24%
HT
ML
JavaS
cri
pt
Java
Fastest-growing skills among programming
workers over the past 12 months
Number of Greater Montréal LinkedIn
profiles that list the titles above: 72,657

16
98% of workers in software development have a university degree, of which 43% hold a Master’s degree or higher
Source: LinkedIn, Talent Insights, December 2, 2019.
51%43%
4%2%
Highest level of education among
software development workers
(100% = 72,657)
Computer Science
Computer and Information Sciences
Computer Software Engineering
Electrical and Electronics Engineering
Information Technology
Computer Engineering
Accounting and Business/Management
Mathematics
Other
12%
10%
6%
6%
53%
4%3%
3%
3%
Main fields of study chosen
by software development workers
9%35%
7%
16%
7%
8%
7%
6%
5%
Universities where
software development
workers earned their degrees
Concordia University
Other
McGill University
Université de Montréal
École de technologie supérieure
Université du Québec à Montréal
Polytechnique Montréal
HEC Montréal
Université de Sherbrooke
Bachelor’s degree
Master’s degree
PhD
Other

17
A large pool of university students enrolled in IT-related programs
Source: Ministry of Education and Higher Education, 2020; compilation by Montréal International.
Nearly 17,000enrolled in
IT-related programs
at universities located
in Greater Montréal
IT-related programs
University students
enrolled in
2018-2019
University
graduates,
2018
Computer Sciences 9,381 1,719
Electrical and Electronic
Engineering3,374 759
Computer Engineering 2,193 460
Mathematics 1,427 286
Applied Mathematics 132 31
Probabilities and Statistics 195 42
Total 16,703 3,297

McTavish Street © Montréal International
Source: QS Best Student Cities in the World, 2019; Ministry of Education,
Leisure, and Sports, Québec, 2018; Research Infosource Inc., 2018.
The best student cityin the Americas and Canada's university capital
▪ Canada’s university capital: 11 universityinstitutions and 60 colleges
▪ 320,000 post-secondary students, includingmore than 200,000 university studentsand 35,500 international university students
▪ $1+ billion in funding yearly dedicatedto university research
▪ Best student city in the Americas:
18
Montréal
Toronto
Boston
Vancouver
New York
1
2
3
4
5
Best student
city in the
Americas2019 QS Best
Student Cities
Rankings
Mary Queen of the World Cathedral / Skyline of downtown © Tourisme Montréal
03Attractive Operating Costs and Incentives

20
Operating a business costs less in Greater Montréal thanin any other major metropolitan area in Canada and the U.S.
Note: The annual operating cost calculations are based on labor and property costs in US$.
Source: fDi Benchmark, 2020.
100 101
118121 125 125 130
133138 138 139 141 141 142 145
159
170
178 180
198
Mia
mi
Phoenix
Mo
ntr
éal
Toro
nto
Tam
pa
Atlanta
Dallas
San D
iego
Detr
oit
Philadelp
hia
Denver
Chic
ago
Min
neapolis
Los A
ngele
s
Housto
n
Seatt
le
Bosto
n
Washin
gto
n D
.C.
New
York
San F
rancis
co
Operating costs index for software development20 largest metropolitan areas in Canada and the U.S., 2020
Index Montréal = 100
29% cost
advantagecompared to the average
20 largest metropolitan
areas in Canada and
the U.S.

21
Advantageous salaries for employers
Note: *Salaries based on five years of experience, Computer systems design services (NAICS 541512).
** E-Business tax credit reinforces a salary cap of CA$83,333, meaning that a maximum of CA$20,000 refundable and CA$5,000 non-refundable credit can be claimed per eligible
employee.
Currency exchange based on the monthly average of June 2020: US$1.00 = CA$1.3550.
Source: Economic Research Institute, Inc., July 2020.
Montréal
Montréal with
E-Business tax
credit applied**
(assuming 100%
eligibility)
Toronto Atlanta Chicago Boston Seattle New YorkSan
Francisco
Database Analyst $60,121 $42,085 $63,647 $85,316 $88,994 $95,696 $98,721 $98,038 $105,610
Programmer $61,432 $43,003 $64,994 $85,773 $89,439 $96,174 $99,213 $98,564 $106,148
Database Architect $65,760 $47,310 $69,427 $94,123 $97,501 $104,872 $108,120 $108,208 $115,984
Computer Engineer $67,320 $48,870 $71,023 $98,905 $102,084 $109,837 $113,172 $113,753 $121,615
Software Developer $67,982 $49,532 $71,699 $99,241 $102,405 $110,184 $113,525 $114,142 $122,010
Software Engineer $69,009 $50,559 $72,748 $101,797 $104,847 $112,832 $116,213 $117,109 $125,016
Main Software
Developer$76,976 $58,526 $80,892 $114,774 $117,227 $126,208 $129,801 $132,173 $140,192
IT Consultant $70,677 $52,227 $74,453 $105,162 $108,058 $116,311 $119,744 $121,018 $128,966
Median annual salaries* (US$) for eight typical occupations in software development
22
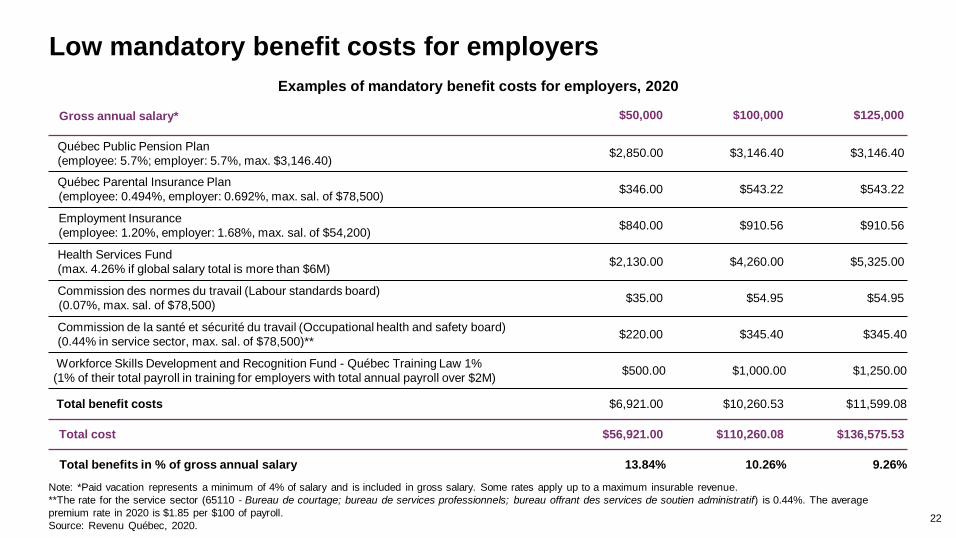
Low mandatory benefit costs for employers
Note: *Paid vacation represents a minimum of 4% of salary and is included in gross salary. Some rates apply up to a maximum insurable revenue.
**The rate for the service sector (65110 - Bureau de courtage; bureau de services professionnels; bureau offrant des services de soutien administratif) is 0.44%. The average
premium rate in 2020 is $1.85 per $100 of payroll.
Source: Revenu Québec, 2020.
Examples of mandatory benefit costs for employers, 2020
Gross annual salary* $50,000 $100,000 $125,000
Québec Public Pension Plan
(employee: 5.7%; employer: 5.7%, max. $3,146.40)$2,850.00 $3,146.40 $3,146.40
Québec Parental Insurance Plan
(employee: 0.494%, employer: 0.692%, max. sal. of $78,500)$346.00 $543.22 $543.22
Employment Insurance
(employee: 1.20%, employer: 1.68%, max. sal. of $54,200)$840.00 $910.56 $910.56
Health Services Fund
(max. 4.26% if global salary total is more than $6M) $2,130.00 $4,260.00 $5,325.00
Commission des normes du travail (Labour standards board)
(0.07%, max. sal. of $78,500)$35.00 $54.95 $54.95
Commission de la santé et sécurité du travail (Occupational health and safety board)
(0.44% in service sector, max. sal. of $78,500)**$220.00 $345.40 $345.40
Workforce Skills Development and Recognition Fund - Québec Training Law 1%
(1% of their total payroll in training for employers with total annual payroll over $2M)$500.00 $1,000.00 $1,250.00
Total benefit costs $6,921.00 $10,260.53 $11,599.08
Total cost $56,921.00 $110,260.08 $136,575.53
Total benefits in % of gross annual salary 13.84% 10.26% 9.26%

Downtown Montréal
* Annual gross rent in Central Business District.
Currency exchange: CA$1 = US$0.76.
Source: Cushman & Wakefield, Q3 2020.
Most affordable office rent
23
$41.84
Mo
ntr
éa
l
Bo
sto
n
Ch
ica
go
$30.30
NY
C
To
ron
to
Sa
n F
ran
cis
co
$45.70
$60.09 $62.07
$80.14
Se
att
le
$45.89
Average asking rent
(All classes – US$/sq.ft/yr)*
Seven of the largest metropolitan areas
in North America, 2020

24
Sector tax creditsEquivalent to eligible salaries and
expenses:
▪ Up to 43% for film and video
production
▪ Up to 37.5% for multimedia
production
▪ Up to 30% for e-business
development
▪ 24% for international financial
centres
Major projects and innovationsGrants, interest-free loans
and other supports, including:
▪ ESSOR program
▪ Tax holiday for large investment
projects
▪ Tax Credit for Investments and
Innovations (C3i)
▪ Incentive Deduction for the
Commercialization of Innovations
▪ Competitive electricity rates of
CA¢3.98/kWh for large power*
Labour developmentExample of incentives:
▪ 25% of costs to implement training
programs
▪ 50% of costs to create an HR
department
Research and development▪ Up to 30% tax credit on R&D
expenses
▪ Tax holiday for foreign researchers
and experts
▪ And many others, such as: Prompt,
Mitacs, National Research Council
Canada
Note:
* Rate LG: large power with minimum billing demand of 5,000 kW, transmission and distribution included, for 120-kV supply with 95% load factor, and including the Economic
Development Rate reduction (if eligible).
Many tax credits
are refundable
—a company could
receive the value of its tax
credit even if it has
no tax payable
Easy access to highly advantageous incentives

25
E-Business tax credit could cover up to 30% of eligible salaries
Note:
1. All values are in $CA.
2. The unused portion of the non-refundable tax credit can be carried back three years or forward 20 years.
Source: Ministry of Finance of Québec, 2019; Montréal International’s analysis, 2019.
Payroll
20 employees
@
$80,000/year
=
$1,600,000
E-Business tax
credit
@ 30%
$1,600,000 * 30%
=
$480,000
Do you
have to pay
taxes in
Québec?
YES
NO
Your tax credit will be a maximum of
24%, as you are not eligible for the
supplemental 6% non-refundable
tax credit
$1,600,000 * 24%
= $384,000
Your tax credit will be a maximum
of 30%
= $480,000
SCENARIO
Québec refundable tax credit for the
development of E-Business:
▪ Covers up to 30% of employee salaries,
including 24% refundable, up to
$25,000 per employee, per year
ASSUMPTIONS1
▪ Foreign-controlled private company
▪ 20 employees eligible @ $80,000/year
▪ 100% of their work is related to eligible
activities under the E-Business

26
R&D tax credits: 15% non-refundable from the government of Canada and 14% refundable from Québec
Note:
1. This model takes into consideration recent changes made to certain tax credits (2012, 2014 and 2015) and is thus valid as of fiscal 2019.
2. Up to 55% of qualifying salaries and wages, federal only: expenditures should be related to R&D activities.
3. Only 80% of the amount paid to a subcontractor is eligible for a federal tax credit and 50% for Québec tax credit.
4. Québec only: For SMEs (less than $50M assets) there is an SR&ED tax credit exclusion on the first $50K of R&D spending. For large companies (more than $75M assets) and
companies under foreign control, the exclusion applies on the first $225K of R&D spending. This amount is deducted of the qualifying salaries and wages.
5. For the purposes of calculating the combined rate of the credit, the tax credit from the government of Québec is applied against the federal tax credit.
Source: Ministry of Finance of Québec, 2019; PWC, 2019; Compilation: Montréal International, 2019.
SCENARIO
Scientific Research and Experimental Development
(SR&ED) tax incentive program
ASSUMPTIONS1
▪ Private, foreign-controlled company, more than
$75M assets
▪ 15 eligible employees @ $100,000/year
▪ 100% of their work is related to eligible activities
▪ Subcontractor: $200,000
Canada (Federal) Québec
Qualifying salaries and wages $1,500,000 (A) $1,500,000 (D)
Other eligible expenses @ 55%2 $825,000 (B) -
Subcontractor3 $160,000 (C) $100,000 (E)
Exclusion on the first $225,000 of R&D
expenditures4 - $(225,000) (F)
Deduction of the Québec R&D credit5 $(192,500) (G) -
Total qualifying expenditures $2,292,500
(A) + (B) + (C) - (G)
$1,375,000
(D) + (E) - (F)
Refundable Québec credit @ 14% - $192,500 (G)
Non-refundable federal credit @ 15% $343,875 (H) -
Total tax credit $536,375 (G) + (H)

27
Combination of E-business and SR&ED tax credits
Note:
1. Company has to choose between the SR&ED or the E-business tax credit for the Québec credit.
2. This model takes into consideration recent changes made to certain tax credits (2012, 2014 and 2015) and is thus valid as of fiscal 2019.
3. Up to 55% of qualifying salaries and wages, federal only: expenditures should be related to R&D activities.
4. If the company has no taxes to be paid, the Québec credit will be 24%.
Source: Ministry of Finance of Québec, 2019 - Compilation: Montréal International, 2019.
Refundable tax credits for Scientific Research and Experimental Development (SR&ED) and E-business (CDAE)1:▪ E-business covers up to 30%, including 24% refundable, of employee salaries up to $25,000 per job per year▪ SR&ED covers 15% from the Government of Canada, and 14%, refundable, from the Government of Québec
SR&ED CDAE
FEDERAL QUÉBEC
Qualifying salaries and wages $1,600,000 (A) $1,600,000 (C)
Other eligible expenses @ 55% of A3 $880,000 (B) -
Total qualifying expenditures $2,480,000 (A)+(B) $1,600,000 (C)
Federal credit @ 15% of total
qualifying expenditures $372,000 -
Québec credit @ 30%4 of total
qualifying expenditures - $480,000
Total credit $852,000
SCENARIO
Combination of the Québec refundable tax credit for
the development of E-business (CDAE) and the
federal Scientific Research and Experimental
Development (SR&ED)
ASSUMPTIONS2
▪ Foreign-controlled private company
▪ 20 eligible employees @ $80,000/year
▪ 100% of their work is related to eligible activities
Other scenarios are possible to maximize the total credit amount depending on the R&D intensity
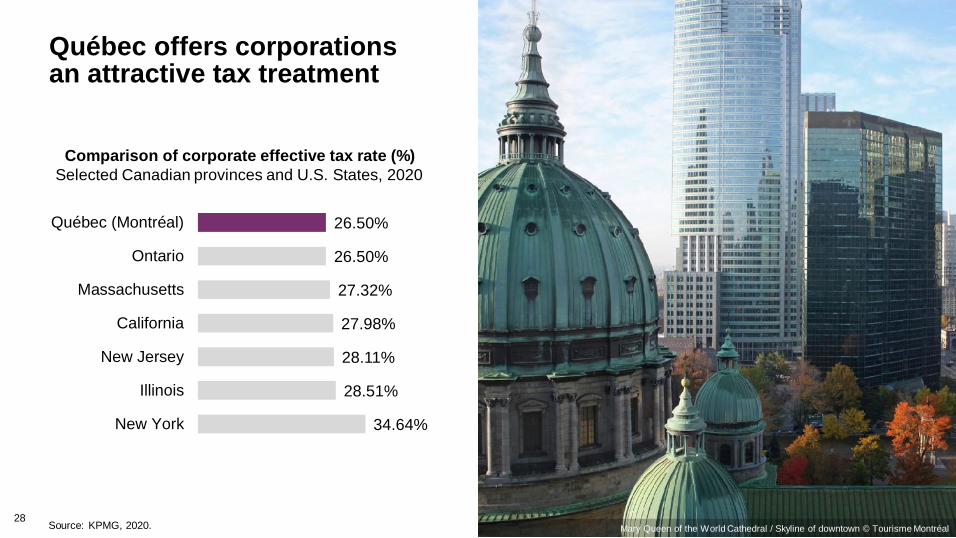
Mary Queen of the World Cathedral / Skyline of downtown © Tourisme MontréalSource: KPMG, 2020.
Québec offers corporations an attractive tax treatment
28
34.64%
28.51%
28.11%
27.98%
27.32%
26.50%
26.50%
New York
Illinois
New Jersey
California
Massachusetts
Ontario
Québec (Montréal)
Comparison of corporate effective tax rate (%)
Selected Canadian provinces and U.S. States, 2020

Downtown Montréal © Montréal International
04Montréal International’sPersonalized, Free and Confidential Services

Montréal International, a single point of access to a seriesof personalized, free and confidential services
Long-term
strategic support
Economic data
and communication
services
Government
relations facilitation
Incentive programs
assistance
International
recruiting solutions
Foreign workers
immigration
assistance
30
This document is the property of Montréal International. You are authorized to reproduce this document, in whole or in part, provided that its content is not modified and that Montréal International is clearly identified as the originator of th is material. You shall not, in any circumstances, use the material in a manner that could create a false or misleading impression with respect to the source of the material, including but without limitation, by means of a mark or mention that does not refer to Montréal International.
Contact us
Montréal International380 Saint-Antoine Street WestSuite 8000Montréal, Québec H2Y 3X7
t +1 514-987-8191www.montrealinternational.com