gravity and magnetics and physical properties
TRANSCRIPT

A new Canadian research initiative funded
by Canada First Research Excellence Fund.
Gravity and Magnetics and physical properties
Richard Smith, Esmaeil Eshaghi, Amir Maleki, Will McNeice, Fabiano Justina

Western Superior Eastern Superior
Magnetic data (compiled, levelled, interpreted)
Eshaghi

Density will be used to constrain inversions
• >43000 density measurements were compiled from various sources (e.g. ME, GSC, OGS, MGS, Footprint).
• >15000 were from Abitibi
• Few in Chibougamau
Petrophysical measurements
DENSITY LOCATIONS
Eshaghi

Mag susceptibility will be used to constrain inversions
• ~36000 mag sus) were compiled from various sources (e.g. ME, GSC, OGS, MGS, Footprint).
• >13500 were from Abitibi
• Two sets of datasets are compiled (Abitibi and Wabigoon subprovinces)
• Petrophysical data are systematically characterised by mapped lithology.
Petrophysical measurements
SUSCEPTIBILITY LOCATIONS
Eshaghi

Density of each major lithological
unit
• Density characterisation allows assigning representative density properties to each major lithological unit for gravity data modelling
Boxplot analysis of density values of major lithological units within Abitibi Greenstone Belt
2.1
2.3
2.5
2.7
2.9
3.1
3.3
3.5
3.7
3.9
Density (g cm-3)
Eshaghi

Susceptibility of each major
lithological unit
• Density characterisation allows assigning representative density properties for gravity data modelling
Boxplot analysis of density values of major lithological units within Abitibi Greenstone Belt
0.01
0.1
1
10
100
1000
Magnetic Susceptibility (× 10-3 SI)
Eshaghi

Ultramafic intrusives
Density
• Breakdown of major rock types into sub-classes
Density measurements of ultramafic intrusive rocks and major lithological units of this
hierarchy in the Abitibi Greenstone Belt. The left column displays histograms of the values
and the right column shows the quartile-quartile (QQ) plots.
No. Samples: 181
No. Samples: 121
No. Samples: 40
All ultramafic intrusives
Peridotite
Pyroxenite
Eshaghi

Ultramafic intrusives
Magnetic susceptibility
• Breakdown of major rock types into sub-classes
Magnetic susceptibility measurements of ultramafic intrusive rocks and major lithological units of
this hierarchy in the Abitibi Greenstone Belt shown on a log10 scale. The left column displays
histograms of the values (× 10-3 SI) and the right column shows the quartile-quartile (QQ) plots.
No. Samples: 275
No. Samples: 41
No. Samples: 129
No. Samples: 26
All ultramafic intrusives
Dunite
Peridotite
Pyroxenite
Eshaghi

Physical properties measurements
Uses
• Geophysicists: Characterizing rock properties for modelling
• Geologists: Identifying anomalous locations
• Why is property different from elsewhere
• Alteration (clays or magnetite destroyed or created)
• Vein density (Byrne et al., 2019)
• Metamorphic grade changes
• Deformation (magnetite fractures into single domains)
• Different magma source

Mag susc from outcrop (OGS) Mag susc from aeromagnetic
How accurate are mag susc for geophysical modelling
Map of the study area located in the western Abitibi region. The
red points indicate where Ontario Geological Survey crews have
taken on-average ten magnetic susceptibility measurements on
one outcrop using a KT-10 magnetic susceptibility meter.
A map of the apparent magnetic
susceptibility of the study area
derived from the RTP map. McNeice

Comparison of mag susc
• Results should agree and points lie along red dashed line
McNeice
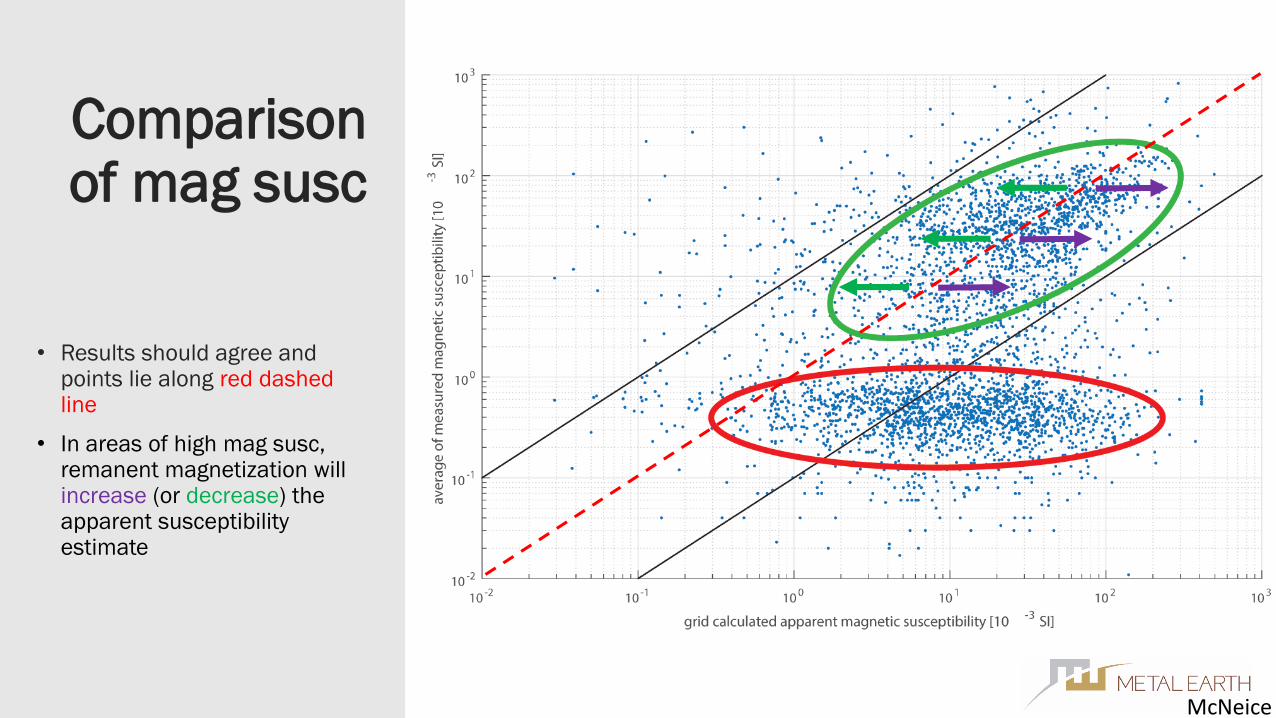
Comparison of mag susc
• Results should agree and points lie along red dashed line
• In areas of high mag susc, remanent magnetization will increase (or decrease) the apparent susceptibility estimate
McNeice

Comparison of mag susc
• Results should agree and points lie along red dashed line
• In areas of low mag susc, nearby anomalies will increase (or decrease) the apparent susceptibility estimate
McNeice

Comparison of mag susc
• Results should agree and points lie along red dashed line
• Other reasons for variability
• Transcription errors
• Operator error
• Weathering
• Geometric effects
• Poor technique
• Conclusion:
• Mag susceptibilities that are required to explain magnetic data can vary by up to a factor of 10 from outcrop measured value
• Outcrop values can be varied by a factor of ten to explain the magnetic data. McNeice

2974 stations (June 2017-August 2018)
Gravity data collection
Amos-Malartic gravity stations. Maleki

• Geosoft oasis montaj used for processing
• Free-air
• Bouguer slab
• Terrain correction
• Yields “complete Bouguer anomaly”
• Existing GSC gravity data compiled, reprocessed, QCQA and combined with ME gravity data.
Gravity data reduction and compilation
Maleki

Chibougamautransect
Previous geological work
A
1
C1
A5C5
A
1
A
5
Geological cross
section
Geological map of the Chibougamau area, showing the distribution of the folds produced
during the D2 regional deformation. The location of two detailed cross -sections (A5 and C5;
see Fig. 2) is shown with thick straight black (modified from Montsion et al. 2017,
Daigneault et al. 1990, Leclerc 2008)Detailed cross-section of the Chibougamau area. See Fig.1 for
abbreviations and the location of the cross sections (after Daigneault
et al. 1990).
Maleki

Geophysical Setting
- Qualitative interpretation of the airborne magnetic data
ME
Seismi
c
Transe
ct
Total magnetic intensity map Combination of 2nd vertical derivative and tilt
angle images
The magnetic interpretation map
Different from geological map
Maleki

Geophysical Setting
The gravity data Qualitative interpretation of the seismic data
Complete Bouguer anomaly map of combined ME and GSC
gravity data
Preliminary interpretation of ME seismic section, dotted pink lines show plutons, Dotted purple
lines are more continuous reflectors, orange lines mark breaks in reflectors (After Snyder and
Mathieu)
Maleki

2.5-D potential-field data modelling (constraints on the 2.5-D model)
Geological Constraints Petrophysical properties
Geological sections from previous geological and geophysical studies (Dion et
al. 1991)
Petrophysical properties from previous studies (Dion et al. 1991)
(Daigneault et al. 1990)
C
C
Maleki

2.5-D potential-field data modelling (constraints on the 2.5-D model)
seismic section Magneto-stratigraphic map
Maleki

2.5-D potential-field data modelling
ME
Transect
Modelling
Profile
The location of the modelled sections on TMI map
Maleki

Preliminary interpretation of South profile
Maleki

Preliminary interpretation of Csouth profile
Maleki

2.5-D potential-field data modelling
ME
Transect
Modelling
Profile
The location of the modelled sections on TMI map Potential-field data modelled along a) Csouth and b) South
profiles
a
b
Maleki
South Profile
Csouth Profile

Conclusions
Tasks
• Magnetic data compilation and processing – done 100%
• Physical properties acquisition – in progress 80%
• Physical properties compilation – in progress 80%
• Gravity data acquisition – in progress 80%
• Gravity and magnetic constrained 2D modelling – in progress 8%
• Gravity and magnetic constrained 3D modelling – to start 0%

MERC Foundation Members
MERC Tier 1 Members
MERC Tier 2 Members

Metal Earth Partners
Metal Earth Software Partners

A new Canadian research initiative funded
by Canada First Research Excellence Fund.
Thank you.
Stay up to date via the MERC Newsletter
Subscribe online by visiting:
Merc.laurentian.ca
Contact us with questions: [email protected]
Connect with us on LinkedIn, Facebook, Twitter