graphical analysis of motion
TRANSCRIPT

1
Graphical Analysis of MotionGraphs, like mathematical equations and charts, can describe themotion of objects. While straight-line movement can be representedgraphically using only a number line, more information about itsmotion can be communicated using a Cartesian co-ordinate system.We will usually use only quadrant I and IV.
y
x
III
III IV
2.1 Uniform Velocity
Position-time graphs
Position means displacement from a reference point (origin).
Slope = velocity
Characteristics of Position-Time Graphs for Uniform Motion (+ usually means up or to the right.)
Sketch of graph Characteristics/Interpretation of graph
(assume + is to the right and – is to the left)d
t0+
-
• Slope = 0
• The object is stationary on the right-hand (positive) side of theorigin.
d
t0
+
-
• Slope = 0
• The object is stationary on the left-hand (negative) side of theorigin.
d
t
• Positive slope equals uniform positive velocity.
• The object (for horizontal motion) is heading to the right and islocated to the right of the reference point.
.
d
t
• Uniform negative velocity.
• The object is heading to the left and is located to the right of thereference point.
AB
Positive slope Negative slopeSlope A > Slope B

2
1. Analyze the following d-t graph of uniform motion by completing the charts that follow.
0
4.0 8.0 12.0 16.0 20.0 24.0
t (s)
-2.0
2.0
4.0
-4.0
a. Complete the chart.
Time (s) Displacement (m) Total distance
travelled (m)4.0 +3.0 3.06.0 +3.0 3.0
12.0 +2.0 4.016.0 0 6.024.0 -3.0 9.0
b. Complete the chart.
Time (s) Velocity (m/s)2.0 +0.756.0 0
10.0 -0.2516.0 -0.5024.0 0
A
BC
D
E
3
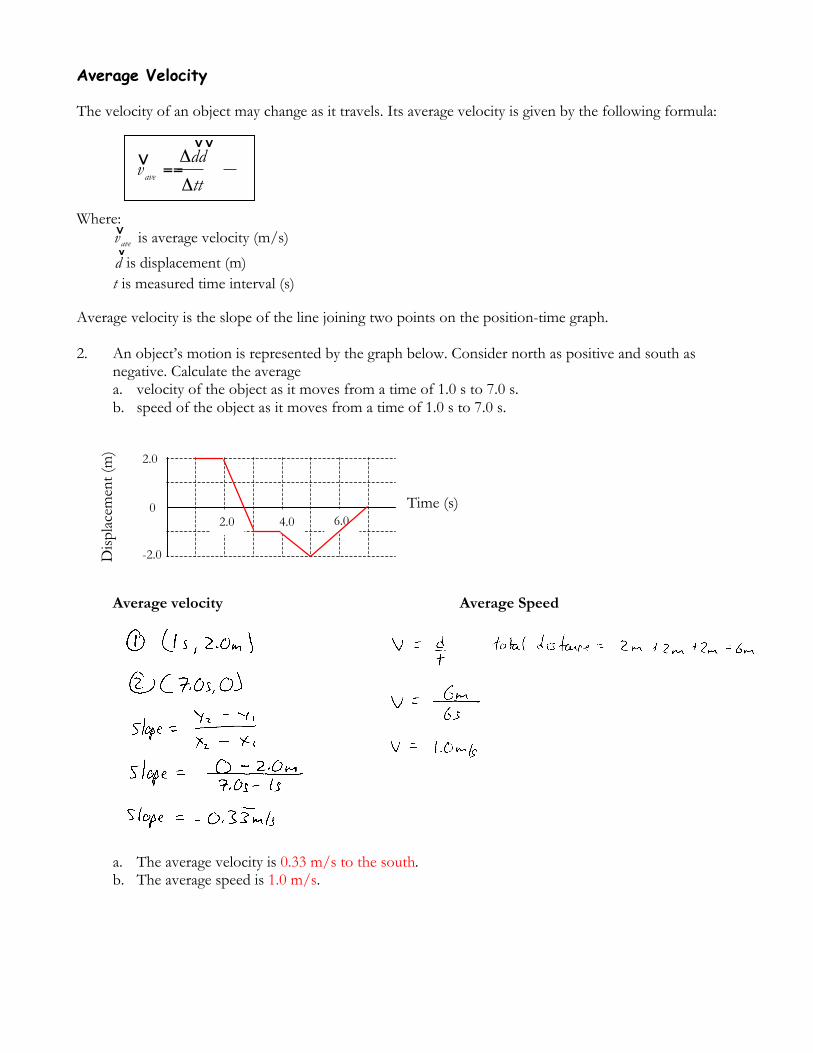
Average Velocity
The velocity of an object may change as it travels. Its average velocity is given by the following formula:
Where:avevv is average velocity (m/s)
dv
is displacement (m)t is measured time interval (s)
Average velocity is the slope of the line joining two points on the position-time graph.
2. An object’s motion is represented by the graph below. Consider north as positive and south asnegative. Calculate the averagea. velocity of the object as it moves from a time of 1.0 s to 7.0 s.b. speed of the object as it moves from a time of 1.0 s to 7.0 s.
Average velocity Average Speed
a. The average velocity is 0.33 m/s to the south.b. The average speed is 1.0 m/s.
ave
ddv
tt
Δ==Δ
vvv
0
2.0
-2.0
2.0 4.0 6.0Time (s)
Dis
plac
emen
t (m
)

4
Velocity-time graphs
• Graphs of uniform velocity will be a straight, horizontal line with a slope of zero.• Slope = acceleration = zero• Area under graph = displacement
Graph Characteristics/Interpretationv
t0
+• Slope is zero, ∴, acceleration = 0, ∴, velocity is uniform.
• The line is in the first quadrant, ∴, the velocity ispositive.
v
t0
+
-
• Slope is zero, ∴, acceleration = 0, ∴, velocity is uniform.
• The line is in the fourth quadrant, ∴, the velocity isnegative.
3. Students perform an experiment involving moving back and forth in front of a motion sensor linkedto a graphing calculator. The displacement-time graph of their motion is produced on the calculatoras shown below.
a. Determine the velocity for eachsection of the graph. Place your valuesin the chart supplied.
Section Velocity (m/s)A 0B -2.0C 1.0
b. Use the velocities calculated in part ato draw a corresponding velocity-timegraph. (Drawing vertical guidelines atthe change points can help.)
t (s)4.0 8.0 12.0
2.0
4.0
6.0
-2.0
-4.0
-6.0
A
B
C
disp
lace
men
t (m
)
4.0 8.0 12.0 t (s)
velo
city
(m/s
)
3.0
-3.0
-1.0
-2.0
1.0
2.0
A
B
C

5
2.2 Uniform Acceleration
Position-Time Graphs
(Recall that steepness, from left to right, is slope.)
Sketch of graph Characteristics/Interpretation
d
t
• The slope is positive and decreasing, ∴, the object isslowing down while moving in a positive direction.
d
t
• The slope is positive and increasing, ∴, the object isspeeding up as it moves in a positive direction.
d
t
• Slope is increasing and negative. ∴, the object is speedingup in the negative direction
d
t
• Slope is decreasing and negative. ∴, the object isslowing in the negative direction.
Use these graphs to analyze motion represented in graphical form.

6
Instantaneous Velocity
Terms
instantaneous velocity: The velocity of an object at a certain point, or instant, in time.
tangent line: A line drawn so that it touches a curve at one point only.
When an object accelerates, its velocity constantly changes. As a result, its d-t graph is curved and its slopeis not constant (note previous examples). Its velocity at any point in time (or instant in time) is called theinstantaneous velocity.
The graphical technique for finding average velocity works for these curved graphs also. To find theinstantaneous velocity, however, on a curved graph requires a different method.
Method for the Determination of Instantaneous Velocity on a Curve
a. Draw a line tangent to the point where you want to find the velocity.A tangent line is a line drawn so that it touches the curve at only one point.
b. The slope of the tangent line is the velocity at that point, i.e., the instantaneous velocity. (Atangent line is a line that makes contact at only one point on the curve.)
1. Determine the velocity at t = 6.0 s.
2.0 4.0 6.0 8.0 10.0 12.00
5
10
15
20
Distance as a function of time
distance (m)
time (s)The shape of a d-t graph for uniform acceleration is parabolic. If it is not a parabola, but some other curveshape, the acceleration is not uniform. (v = 1.33 m/s) a = 0.278 m/s2

7
Velocity-Time Graphs
The slope of a velocity-time graph is equal to acceleration.The area under a velocity-time graph equals displacement.
Characteristics of Velocity-Time Graphs for Uniform Acceleration
Graph Characteristics/Interpretationv
t0
+• Slope is positive ∴, acceleration = positive ∴, velocity is
changing
• The line is in the first quadrant, ∴, the velocity is positive
v
t0
+• The velocity is changing uniformly.
• Negative slope is negative acceleration• The velocity is positive
v
t0
+
-
• The velocity is negative
• The slope is positive, ∴, the acceleration is positive
v
t0
+
-
• Negative velocity
• Negative acceleration

8
4. The graph below represents the motion of a person walking along along an east/west line. Let east bepositive and west be negative. The reference point is the person’s house placed at the origin of thegraph.
Section Velocity(m/s)
Acceleration(m/s2)
Description of motion
A 0 to +5.0 +0.50 The person leaves his house, starting from restand accelerates for 10.0 s at a rate of 0.50 m/s2
to the east until reaching a velocity of 5.0 m/sto the east at a distance of 25 m from hishouse.
B +5.0 0 The person continues to walk at a constantvelocity of 5.0 m/s to the east for 5.0 s.
C +5.0 to –5.0 -2.0 At a time of 15.0 s the person turns around andgoes west; accelerating at a rate of 2.0 m/s2 tothe west until he is 5.0 m to the east of hishouse.
D -5.0 0 The person is 5.0 m to the west of his housewalking at constant velocity of 5.0 m/s to thewest.
At each of the points, A through D, the graph “kinks.” These change points represent a sudden change inmotion where the acceleration is undefined.
Time (s)4.0
Vel
ocity
(m/s
)
8.0 12.0 16.0 20.0
B
C
D
A
-4.0
0
4.0

9
Displacement from Velocity-Time Graphs
Displacement is equal to the area under a velocity-time graph
Use the following graph, which describes the motion of an object, to answer question 5.
5. Determine the displacement froma. 0 to 15 s.b. 0s to 24 s.
5.0
Vel
ocity
(m/s
)
10.0 15.0 20.0
-5.0
0
5.0

10
Acceleration-Time Graphs
Since we only work with uniform acceleration, the graph of acceleration-time should have a slope of zero.
Characteristics of Acceleration-Time Graphs
Graph Characteristics
a
t0
+
-
• Slope is zero, ∴, acceleration is uniform.
• The line is in the first quadrant, ∴, the acceleration ispositive.
a
t0
+
-
• Slope is zero, ∴, acceleration is uniform.
• The line is in the fourth quadrant, ∴, the accelerationis negative (e.g., acceleration due to gravity)
a
t0
+
-
• The acceleration is zero, ∴, the object is travellingwith uniform velocity or is stationary.
Change in Velocity from an Acceleration-Time Graph
The area under an acceleration-time graph is equal to the change in velocity.
6. A car accelerates uniformly from rest as shown in the graph below. Determine itsa. speed at 6.0 s.b. gain in speed between 4.0 s and 8.0 s.
a. After 6.0 s the car was travelling 30 m/s.b. The car gained 20 m/s.
t (s)
a
(m/s )2
5.0
8.04.0

11
Transposition of Graphs
We want to be able to transpose graphs; that is, to change a position-time graph to its correspondingvelocity-time graph, and acceleration-time graph.
7. An object is thrown straight up into the air. Assume up is positive and the release point is referencedas 0 m.
Type of graph Graph CharacteristicsPosition-time
d(m)
t (s)
• Its shape is parabolic.
• Its position is greatest half-waythrough the time.
• The object always has a negativeacceleration.
• Velocity is negative when slope isnegative. The velocity is negative in thesecond section. ∴, it’s going in anegative direction (down).
Velocity-time
v(m/s) t (s)
• Its shape is linear.
• The magnitude of its velocity at thebeginning is equal to the magnitudeat the end, but it’s opposite indirection.
• At maximum displacement, velocityequals zero.
• Direction changes as the graph crossesthe x-axis.
Acceleration-time
a
(m/s )2 t (s)
-9.81 m/s 2
• Acceleration is uniform, ∴, slopeequals zero.
• Acceleration is caused by gravity, ∴, ithas a negative value.

12
Graphing Summary
Slope is defined asvelocity for a d-t graphacceleration for a v-t graph
Area is defined asDisplacement for a v-t graphChange in velocity for an a-t graph
Type of graph Graph CharacteristicsPosition-time graphfor uniform motion
d(m)
t (s)
• slope = velocity
• If graph is linear, acceleration =0 (i.e., uniform velocity)
Velocity-time
v(m/s)
t (s)
• slope = acceleration
• area under graph = displacement
Position-time graphfor uniformacceleration d
(m)
t (s)
• slope = instantaneous velocity• shape of curve is parabolic if
acceleration is uniform
• slope constantly changes
Acceleration-time • horizontal line means acceleration isconstant
• area under graph is the change invelocity
t (s)
a
(m/s )2
Graph type Description
d-t slope changes sign
v-t crosses x-axis
a-tnot always possible to tell
The following summarizes how you can tellif an object changes directions.