psc 151 laboratory activity 4 graphical analysis iib nonlinear graphs 2 and the motion of a simple...
TRANSCRIPT

PSC 151Laboratory Activity 4
Graphical Analysis IIB Nonlinear Graphs 2
andThe Motion of a Simple Pendulum

Using Graphical Analysis to Investigate the Motion of a
Simple Pendulum
QuickTime™ and aAnimation decompressor
are needed to see this picture.
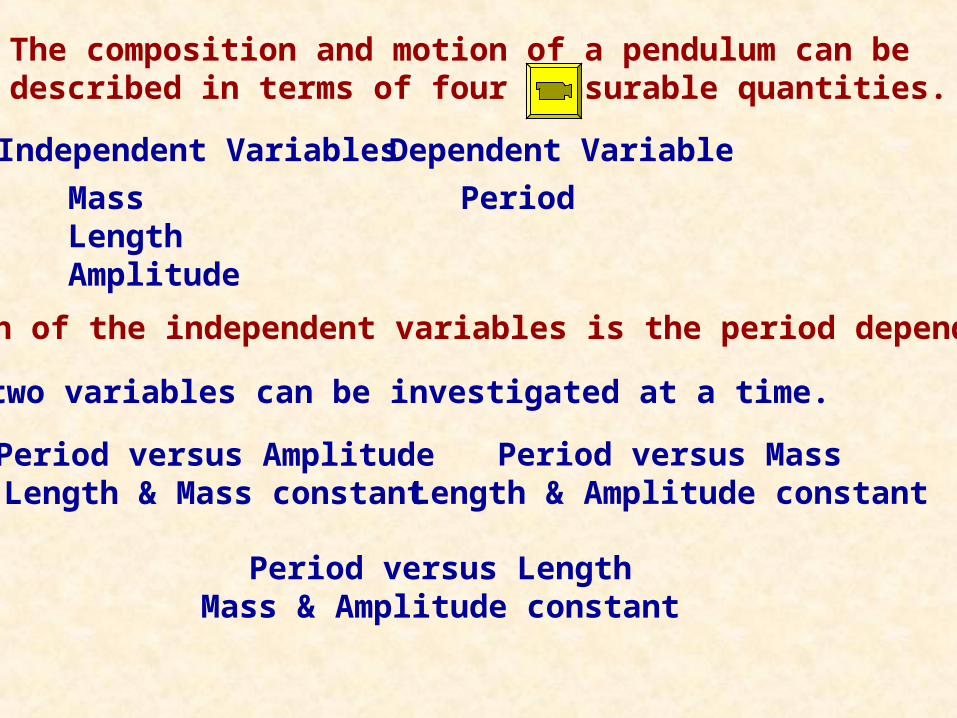
The composition and motion of a pendulum can be described in terms of four measurable quantities.
Independent Variables
MassLengthAmplitude
Dependent Variable
Period
On which of the independent variables is the period dependent?
Only two variables can be investigated at a time.
Period versus MassLength & Amplitude constant
Period versus AmplitudeLength & Mass constant
Period versus LengthMass & Amplitude constant

Investigating the dependence of the Period on the Mass of the pendulum.
Varying the mass while keeping the amplitude and length constant
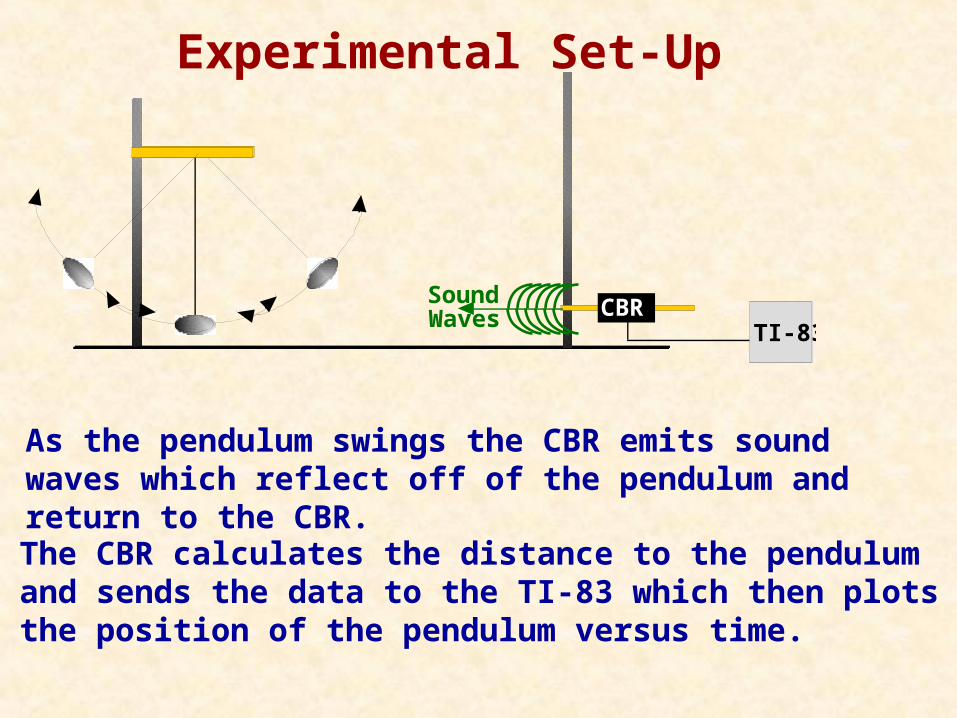
Experimental Set-Up
As the pendulum swings the CBR emits sound waves which reflect off of the pendulum and return to the CBR.
The CBR calculates the distance to the pendulum and sends the data to the TI-83 which then plots the position of the pendulum versus time.
CBRTI-83
Sound Waves

CBR / TI-83 Set-UPConnect the CBR to the TI-83
Press: APPS
Press “4” CBL/CBR
Press “Enter”
Press “2” Data Logger

Data Logger Set-Up
Probe
# SAMPLES
INTRVL (SEC)
UNITS
PLOT
DIRECTNS
GO...
Sonic
Enter: 75
Enter: .02
Select: m
Select: REAL TIME
Select: ON
Press "Enter"
Press: Enter

CBR/CBL Set-Upcontinued
Press “2” CBR
After CBR-CBL link has been tested:Press: “Enter”
After “Status OK”:Press: “Enter”
When you are ready to begin taking data”Press: “Enter”
After data collection is complete the TI-83 will plot a graph of the pendulum’s position versus time.

During Data Acquisition

Taking Data From the Graph:Determining the Period

Time
Position
Cursor starts here
*
Trough X = 0.00 Y = 0.00X = 0.11 Y = 0.34
*
X = 0.18 Y = 0.41
*X = 0.22 Y = 0.63
*X = 0.48 Y = 1.01
*
t1 =0.22st2 =0.48s
T =0.26s
t2 =0.48s
X = 0.76 Y = 1.88*
t3 =0.76s
T =0.28s
Trial 1
Trial 2
Measuring the PeriodUse this key to advance cursor
Dependence of the Period on the Mass of the Pendulum
Each group will use a different mass and determine the pendulum’s period. Then the period related to each mass will be recorded in a composite data table.
From this composite data table each group will determine whether or not the period of a pendulum depends on its mass.
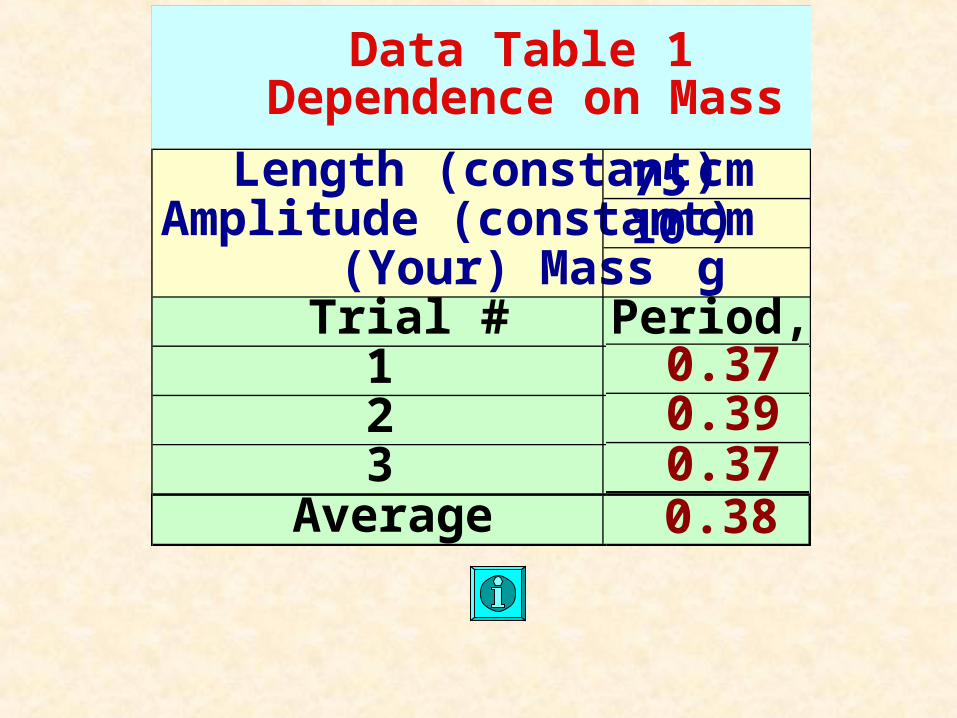
Length (constant) cmAmplitude (constant) cm
(Your) Mass gTrial # Period, s
123
Average
Data Table 1 Dependence on Mass
7510
0.370.390.370.38

Dependence of the Period on the Amplitude and Length of the Pendulum

We will now use Interactive Physics to simulate the motion of a simple pendulum and determine the dependence of the Period on Amplitude and Length.
Mass = 6.0kg Length = 10.0mAmplitude, m Period, s
1.02.03.04.05.06.0
Does the Period of a Pendulum depend on its Amplitude?
6.336.336.336.336.336.33
We will first exam the dependence on the Amplitude by choosing a mass (6kg) and a length (10m) and holding them constant while varying the amplitude.

Does the Period depend on the Length?Choose a mass (6kg) and amplitude (10m) and hold them constant while varying the length.

Mass = 6.0kg Amplitude = 10.0mLength, cm Period, s
520406080100
Does the Period of a Pendulum depend on its Length?
What is the mathematical relationship between Period and Length?
4.508.95
12.6515.5017.9020.05
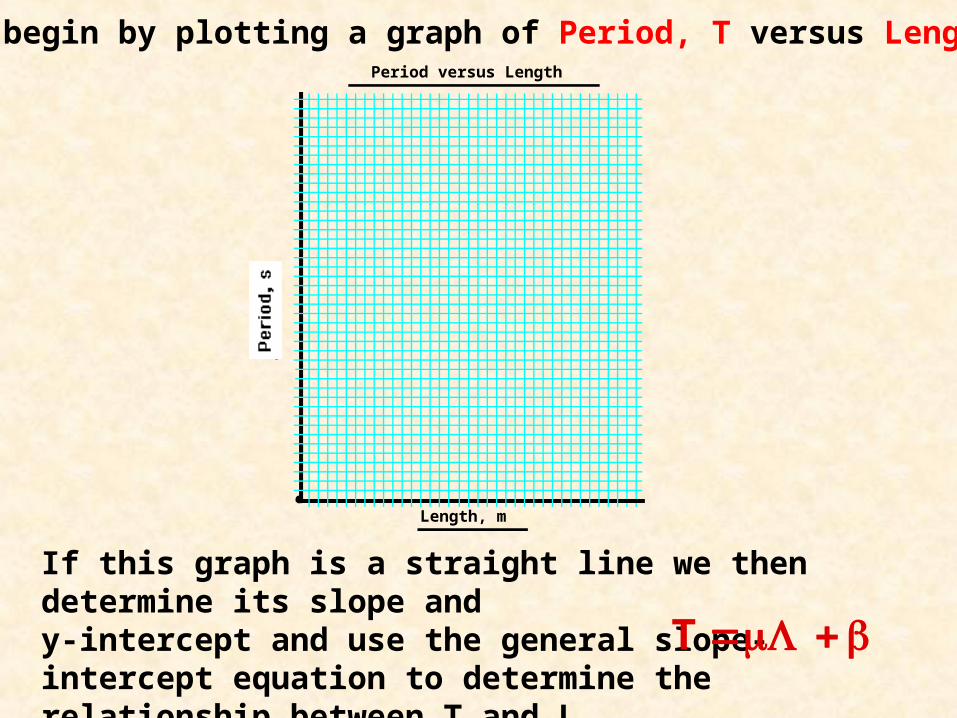
We will begin by plotting a graph of Period, T versus Length, L.
If this graph is a straight line we then determine its slope and y-intercept and use the general slope-intercept equation to determine the relationship between T and L. T =mL+b
Length, m
Period versus Length

If the graph of period versus length is not a straight line we must determine what function of L to graph next.
Study the various graph shapes to determine which one most resembles the graph of Period versus Length.
Once a new function of L has been chosen, create a new column in the data table for that function.
01
2
3
4
5
6
7
Y
1 2 3 4 5 6 7X
y=x
Y=mX+ b
Y∝X
70
10
20
30
40
Y
1 2 3 4 5 6X
=y x2
Y∝X2
Y=mX2 +b
0
0.5
1
1.5
2
2.5
Y
2 4 6 8X
= y x1/2
Y ∝ X
Y =m X +b
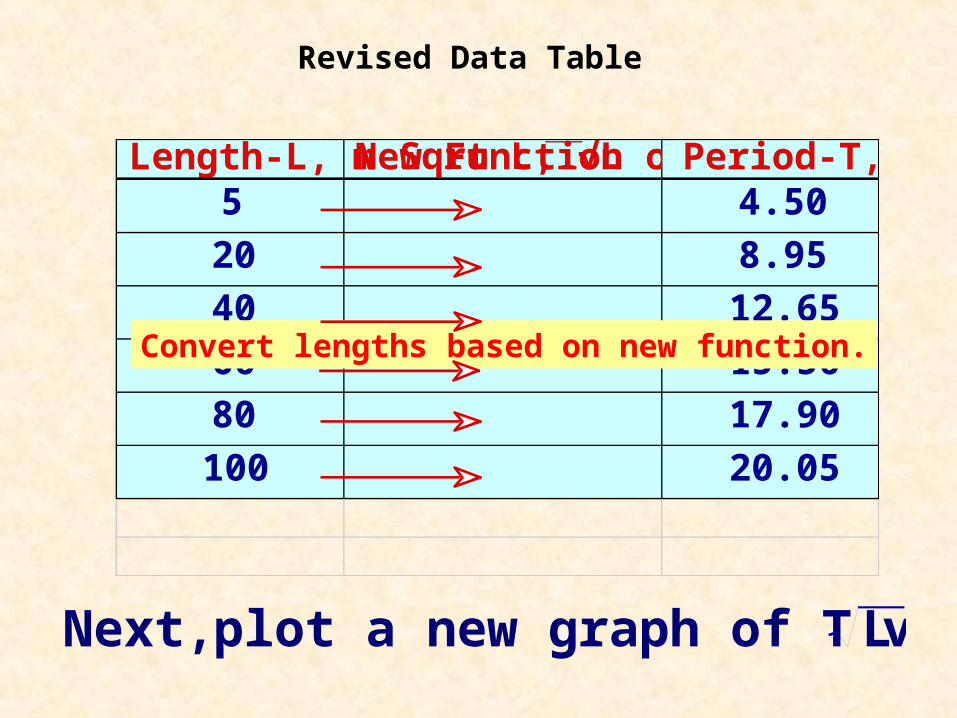
Revised Data Table
Length-L, m Period-T, s5 4.50
20 8.95
40 12.65
60 15.50
80 17.90
100 20.05
Convert lengths based on new function.
Next, plot a new graph of T versus L
New Function of LSqrt L, √L

If this graph is a straight line determine is slope and intercept, and use the general slope-intercept equation to determine the relationship.
If this graph is not a straight line, continue the process with a different function of L until a straight line graph is achieved.
Sqrt L, L
Period versus Sqrt L
T =m⋅ L +b