graphical analyses of clinical trial safety datastat-computing.org/events/2007-jsm/ma.pdfgraphical...
TRANSCRIPT

Graphical Analyses of
Clinical Trial Safety Data
Haijun Ma, Kefei Zhou, Amy Xia,
Matt Austin, George Li,
Michael O’Connell08/10/07, GBE Scientific Forum

2
Overview
• Current situation of clinical trial safety analyses
• Examples of statistical graphs used in safety analyses environment
• Summary

3
Clinical Trial Safety Analysis
• Safety assessment is crucial in drug development
• As part of risk management, safety data should be continuously monitored
• Current practice and available tools are not up to standard
• Recognize the need to develop new tools for reviewing, presenting and analyzing clinical trial safety data

4
Reviewing Safety Data

5
Safety Outputs

6
Building Blocks in Safety Analysis
• Standards for clinical trial data (CDISC)– Clinical Data Interchange Standards Consortium
• Approaches to coding of adverse events and MedDRA search strategies for use in clinical trial event counting and analysis
• Software tools for data access, exploration, analysis
• Modern statistical metrics to characterize event rates, risk and risk factors
• Some visual graphs and displays to facilitate understanding
Robert T. O’Neill, Director , Office of Biostatistics, CDER, FDA,
“Signal Detection in Clinical Trials”, 19th Annual DIA Euromeeting

7
Graphical Analyses
• A graph is worth 10000 words
• Statistical graphics are useful tools for exploring data, aiding inference and communicating results
– Display large data coherently
– Maximize the ability to detect unusual
features
– Facilitate communication with: regulators,
investigators, collaborators, upper
management, DMC, etc.

8
Application
• Examples of statistical graphs used to better visualize different types of clinical trial safety data and facilitate safety signal detection.
• Graphics tool-box in development
• Some questions to answer– Which AEs are elevated in treatment vs. placebo?
– Any special patterns of AE onset?
– What is the trend of treatment effects on safety outcomes over time?
– Which patients have abrupt changes in lab tests? Is there temporal causality of drug intake?

9
Clinical Safety Data
• Data types:
– Adverse Event Data
– Lab Data
– Other Data: demographic, exposure, vital
signs, conMed, etc.
• Level of details:
– Group level information display
– Individual level information display

10
Demographic data
Drug exposure

11
Table 2.1. Baseline Demographics
(Subjects Exposed to Study Drug) Study XXXX
Placebo (N=165)
Drug A (N=164)
Total (N=329)
Sex - n(%)
Female 65 (39.4) 64 (39.0) 129 (39.2)
Male 100 (60.6) 100 (61.0) 200 (60.8)
Race - n(%)
Caucasian 136 (82) 135 (82) 271 (82)
African American 6 (4) 8 (5) 14 (4)
Hispanic 13 (8) 10 (6) 23 (7)
Asian 6 (4) 7 (4) 13 (4)
Japanese 2 (1) 2 (1) 4 (1)
American Indian 0 (0) 1 (1) 1 (0)
Native Hawaiian 0 (0) 0 (0) 0 (0)
Other 2 (1) 1 (1) 3 (1)

12
Baseline Demographics

13
Table 1.1 Summary of Subject-year Follow-up
(Subjects Exposed to Study Drug) (Study XXXX)
6.0, 1179.032.0, 1149.06.0, 1179.0Min, Max
823.5,
1100.0
737.0,
1100.0
1074.0,
1100.0
Q1, Q3
1094.01094.01094.0Median
313.09321.81302.01SD
930.14916.3947.2Mean
406224182n
Duration Exposed to Study Drug (Days)
1033.91561.93471.98Total
406224182N
Subjects Exposed to Study Drug (Subject-years)
Total
(N=406)
Drug A
(N=224)
Placebo
(N=184)
Study XXXX
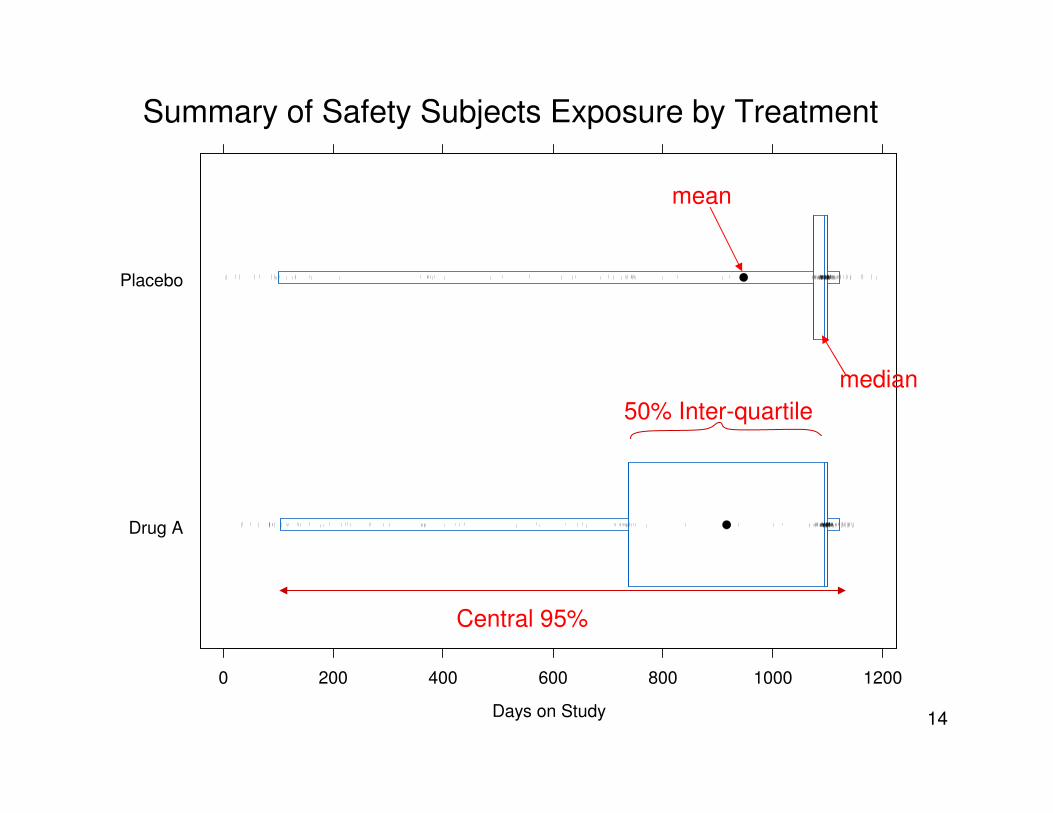
14
Drug A
Placebo
0 200 400 600 800 1000 1200
Days on Study
Summary of Safety Subjects Exposure by Treatment
mean
median
50% Inter-quartile
Central 95%
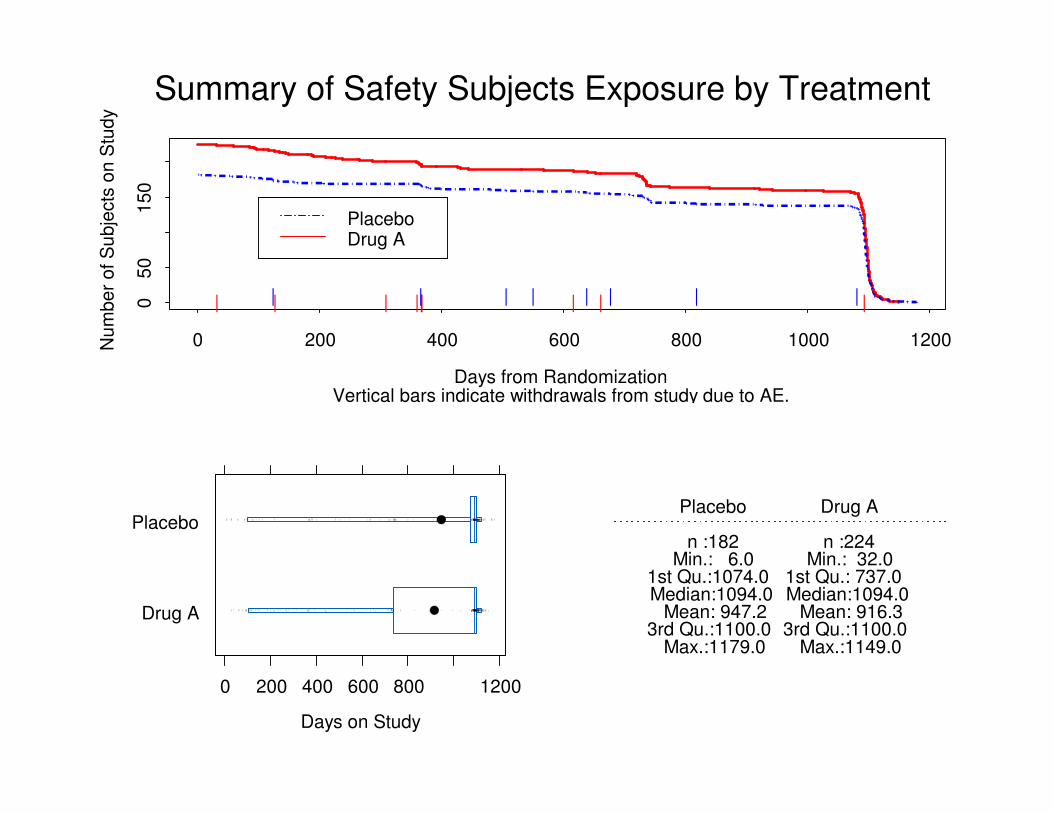
15
Vertical bars indicate withdrawals from study due to AE.Days from Randomization
Nu
mb
er
of S
ub
jects
on
Stu
dy
0 200 400 600 800 1000 1200
05
01
50
| || ||| || || || | | || |
PlaceboDrug A
Summary of Safety Subjects Exposure by Treatment
Placebo
n :182 Min.: 6.0
1st Qu.:1074.0 Median:1094.0 Mean: 947.2 3rd Qu.:1100.0 Max.:1179.0
Drug A
n :224 Min.: 32.0
1st Qu.: 737.0 Median:1094.0 Mean: 916.3 3rd Qu.:1100.0 Max.:1149.0
Drug A
Placebo
0 200 400 600 800 1200
Days on Study
16
Adverse events data

170 (0)5 (2.7)DIZZINESS
10 (4.5)22 (12.0)INSOMNIA
16 (7.1)5 (2.7)HYPOCALCAEMIA
29 (12.9)22 (12.0)FATIGUE
34 (15.1)23 (12.5)BONE PAIN
37 (16.5)27 (14.7)BACK PAIN
39 (17.4)32 (17.4)ASTHENIA
59 (26.3)43 (23.4)CONSTIPATION
195 (87.0)146 (79.3)Number of Subjects Reporting Any Adverse Events
Drug A
(N = 224)
n (%)
Placebo
(N = 184)
n (%)PREFERRED TERM
Table 2. Subject Incidence of All Treatment Emergent Adverse Events by Preferred
Term in Descending Order of Frequency
(Subjects Exposed to Study Drug)

18•AE dot plot by descending order of frequency
•AE dot plot by descending order of risk difference

19•P-risk plot

20
0-6 mon 7-12 mon 13-18 mon 19-24 mon
Drug APlacebo
Seriouse Adverse Events Incidences (%)
Time on Study
02
46
81
0

21
Distribution of Days on Study to AE Onset for Subjects with AEDistribution of Days on Study to AE Onset for Subjects with AE
300 200 100 0 100 200
0200
400
600
800
# Events in Placebo # Events in Drug A
Tim
e t
o A
E O
nset
(Days)
6 mon6 mon
12 mon
18 mon
24 mon

22
Lab test data
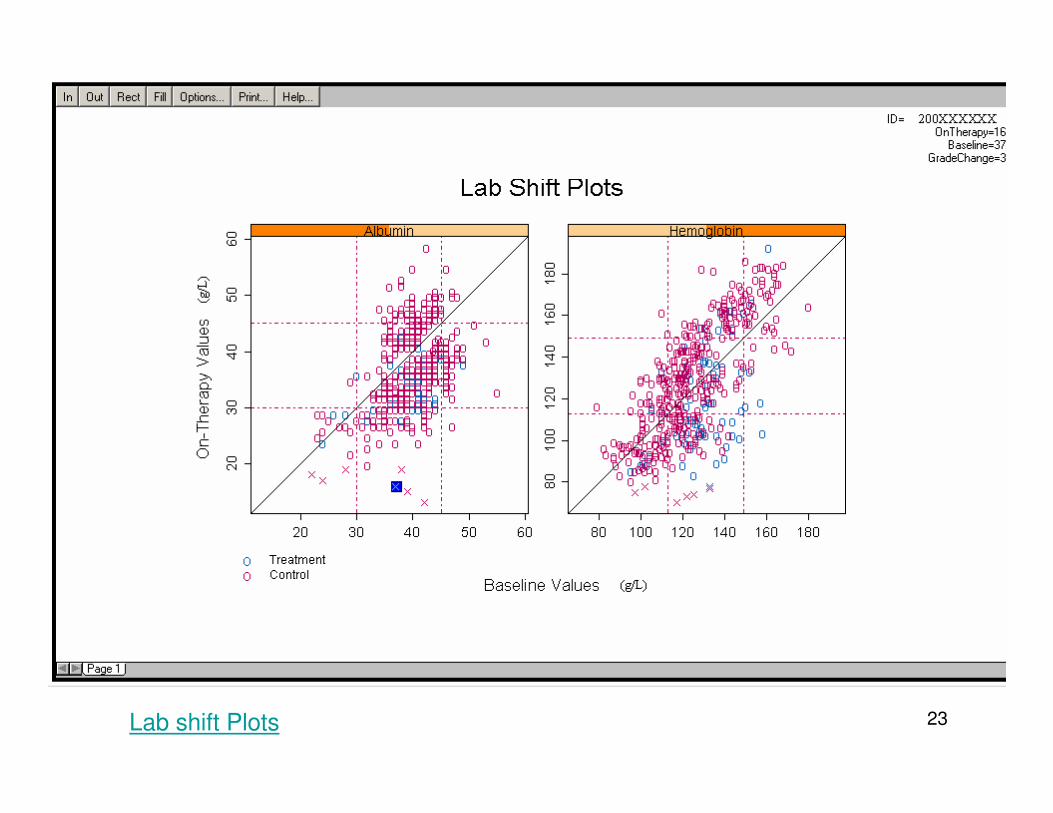
23Lab shift Plots
24

25
0 200 400 600 800 1000
2.0
2.2
2.4
2.6
2.8
3.0
On study days Creatinine increase baseline to worst on study grade shift = 1
Co
rre
cte
d C
alc
ium
(m
mo
l/L
)
OO
O
O O OO
O
OO
OO
OO
OO
O O
OO O O
OO
O
O O
O
O O
O
O
O
O
O
O
O
O
O O
O
O
O
OO OOO
O
O OO
O
O
O
O
OOO O O OO
OO
O
OO O
O O O OO
O O O
O
O
O
O O
O
OO
OO
O O
O
OO
O
O
O
O
OO
O
O
O
O
O
O O
O
O
O
O
OO
O O
O
OO
O
OO
O
O OO O
OO O
OO
O O OO
O
O
OO
O
O O
OO
O
O
OO
OO
OO
O
O
O
OOX
XX
X
X
X
X
X XX
X X X
X
XX
X
XX
XX
X
X
X
X X X
X
X X
X
XX
XX X X
XX
XX X X X X
X
X XX
X
XX
X
XX X X
XX
X
X
XX
XXX
X
X
X
XX
X
X
XX
X X XX
XXX X
XX X
X X
X XX
X
X
XX
X X
XX
XX
X
X
XX
X
X
XX
X
X
X
X
X
X
XX
X X
X
XX
XX
X X
XX
X X
X
X
X
X XX
XX X
X
X XX
X
XX
XXX
XX
XX X
X X
XX X
X
XX
X
X X
X
XX
X
X
XX
XX
X
X
X X
X
XX
X
X
X
X
XX X X
X X
X
X X XX X
X XXX
X XX
X
X X XX
X
XX X
X
X
X
XX X
XX
XX X
X X
X X X
X
O Drug AX Placebo
0 200 400 600 800 1000
2.0
2.2
2.4
2.6
2.8
3.0
On study days Creatinine increase baseline to worst on study grade shift = 2
Co
rre
cte
d C
alc
ium
(m
mo
l/L
)
OO
O
OO
OO
OO
OO
OO
O O OOO
OOO O
O O
OO O O O O
O
O O O
OO
O
O
O
O
O
OO O
OO
O O
OO O
O
O
O
O
O
O OO
OO
O
O OO
O
O
OO
O
OXX
X X
X
X
X
X X X
X
O Drug AX Placebo
Change of Albumin Corrected Calcium over Time by Creatinine Abnormality Grade

26
20
30
40
50
60
0 2 4 6
Month
Alb
um
in [g
/L]
ControlTreatment
BOX PLOT

27
443N=
443N=
173N=
173N=
105N=
105N=
83N=
83N=
251N=
251N=
100N=
100N=
157N=
157N=
29N=
29N=
24N=
24N=
31N=
31N=
117N=
117N=
14N=
14N=
23N=
23N=
15N=
15N=
70N=
70N=
6N=
6N=
65N=
65N=
6N=
6N=
Figure 7.1. Mean (SD) Blood Pressure Subgrouped by Therapy Over Visit Weeks
Safety Analysis Set
Mean (
SD
) B
lood P
ress
ure
(m
mH
g)
0102030405060708090
100110120130140150160170180190200
Study Week
0 6 12 18 24 30 36 42

28
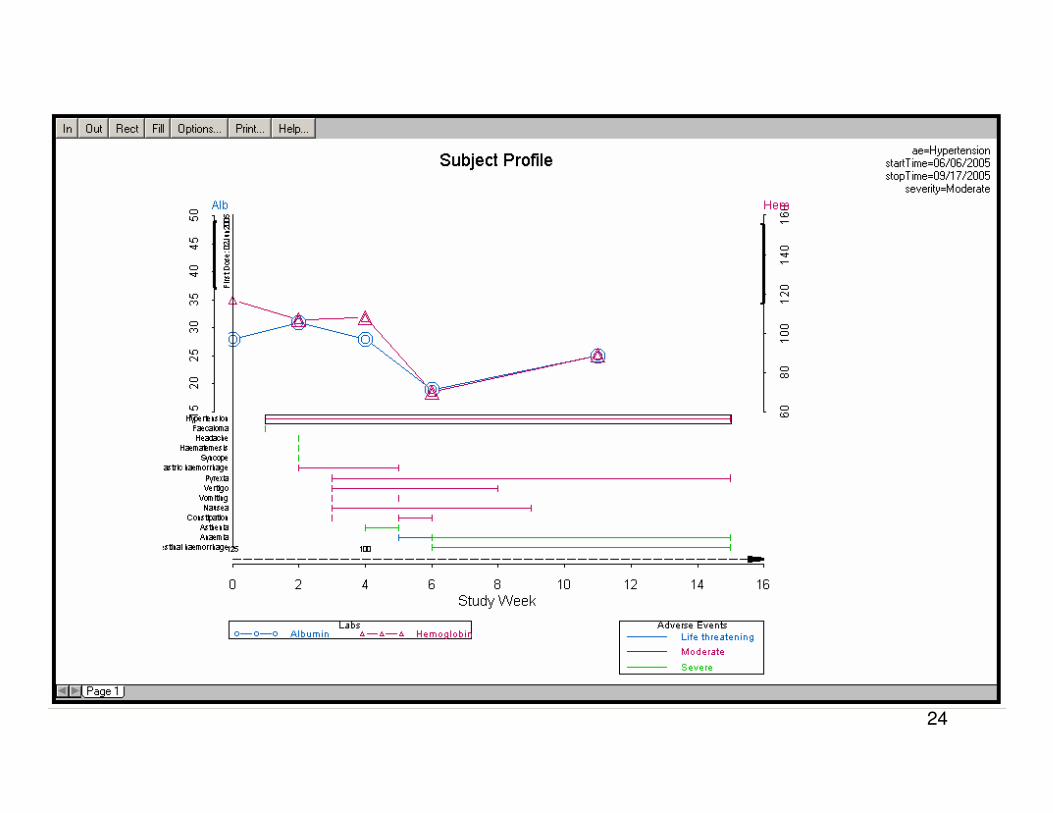
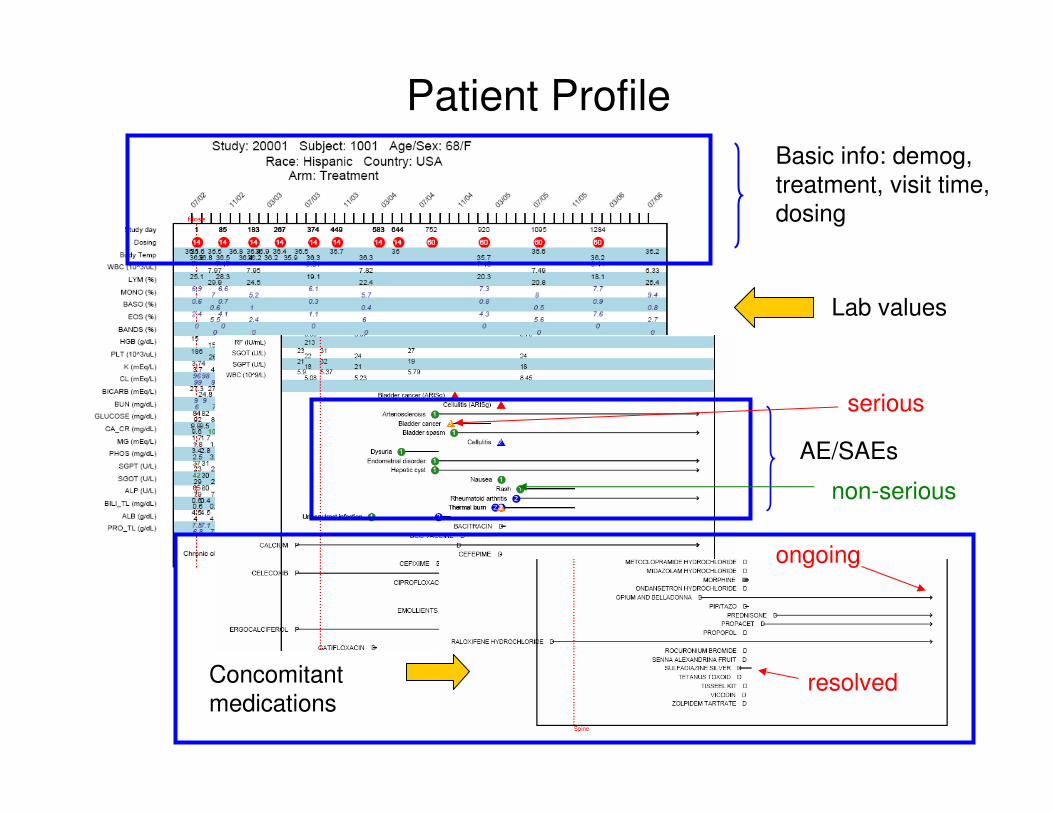
Patient Profile
• Simultaneous display of large amount of relevant information of a subject
• Efficiently establish safety profile of a subject
• Easier to see drug effect, drug/drug interaction, connections between lab test and adverse events, etc.
29
Basic info: demog,
treatment, visit time,
dosing
Lab values
AE/SAEs
Concomitant
medications
Patient Profile
serious
non-serious
resolved
ongoing

30
Patient Profile Legend
• Different symbols/colors to distinguish severity,
seriousness
• Arrow to indicate whether AE/conMed resolved

31
Summary
• Graphics are powerful in concisely and efficiently conveying multiple pieces of safety information
• Graphics are useful for efficacy analysis as well
• Graphs are not cure-all, should be used in combination with other statistical analyses methods and display formats
• There is a need for standardized statistical graphical language across industry and regulatory– SOPs on validation of graphic outputs are needed
• New tools and processes will facilitate signal detection and clinical trial safety management
• Still much to be done in this area
32
Reference
• Ohad Amit, Understanding Patients Safety Through Use of Statistical Graphics.
• William Blackwell, Tools for Data Mining and Signal Detection, DIA 19th Annual EuroMeeting
• Simon Day, Signal Detection from Clinical Trial Databases
• Trevor Gibbs, Pharmacovigilance and Risk Management. DIA 19th Euro meeting talk
• Michael O’Connell, Graphic analysis and reporting of safety data, 42th DIA annual meeting talk
• Robert T. O’Neill, Signal Detection in Clinical TrialsSome perspectives on New tools and Processes - A Critical Path Update, 19th Annual DIA Euromeeting

33
Acknowledgement
• Rachel Flodin
• Springer Li
• Ying Tian
• Bob Treder
• Jenny Yuan


35
Back-up Slides

36
Clinical Trial Safety Analysis
• Safety data are often collected concomitantly in clinical trials - lack of proactive planning
• Safety analyses are usually descriptive in nature - lack of power
• Safety data and analysis results often reported in form of tables and listings – not easy to review and interpret
37
How to Lie With Statistics
• Huff’s timeless 1954 classic, How to Lie With Statistics. A beginning playbook might read as follows.
• Omit sample size, confidence, and any greeks (”The blindfolded leading the blind.”)
• Sample high, but use a flawed methodology to drive action from biased conclusions (”Measure with a micrometer, mark with a crayon, cut with an axe.”)
• Sample low, or at least sub-sample until the means tell an insightful story (”Throw it against the wall and see what sticks. Okay, throw it again.”)

38
Drug A
Placebo
0 200 400 600 800 1000 1200
Days on Study
Summary of Safety Subjects Exposure by Treatment
mean
median
Central 95%
50% Inter-quartile

39
Vertical bars indicate withdrawals from study due to AE.Days from Randomization
Nu
mb
er
of
Su
bje
cts
on
Stu
dy
0 200 400 600 800 1000 1200
05
01
50
| || ||| || || || | | || |
Drug APlacebo
Summary of Safety Subjects Exposure by Treatment0
40
08
00
12
00
Drug A Placebo
Da
ys o
n S
tud
y Drug A
n :224 Min.: 32.0
1st Qu.: 737.0 Median:1094.0 Mean: 916.3 3rd Qu.:1100.0 Max.:1149.0
Placebo
n :182 Min.: 6.0
1st Qu.:1074.0 Median:1094.0 Mean: 947.2 3rd Qu.:1100.0 Max.:1179.0

40
0
100
200
300
SG
OT
Lab Scatter Plot
TreatmentControl
0
1000
2000
3000
AL
P
0
200
400
600
800
1000
1200
BIL
I.T
L
0 100 200 300 400
SGPT
20
30
40
50
60
AL
B
0 100 200 300
SGOT
0 1000 2000 3000
ALP
0 200 400 600 800 1200
BILI.TL

41
Drug A
40 60 80 100
100 120 140 160
100
120
140
160
40
60
80
100ALP
9.0 9.5 10.0
10.0 10.5 11.0
10.0
10.5
11.0
9.0
9.5
10.0
CA.CR
0.6 0.8 1.0
1.0 1.2 1.4
1.0
1.2
1.4
0.6
0.8
1.0
CREAT
2.5 3.0 3.5
4.0 4.5 5.0
4.0
4.5
5.0
2.5
3.0
3.5PHOS
20 30 40
40 50 60
40
50
60
20
30
40SGOT
20 40
60 80
60
80
20
40SGPT
Placebo
40 60 80 100
100 120 140 160
100
120
140
160
40
60
80
100ALP
9.0 9.5 10.0
10.0 10.5 11.0
10.0
10.5
11.0
9.0
9.5
10.0
CA.CR
0.6 0.8 1.0
1.0 1.2 1.4
1.0
1.2
1.4
0.6
0.8
1.0
CREAT
2.5 3.0 3.5
4.0 4.5 5.0
4.0
4.5
5.0
2.5
3.0
3.5PHOS
20 30 40
40 50 60
40
50
60
20
30
40SGOT
20 40
60 80
60
80
20
40SGPT
Baseline Lab Values

42
Glucose by Time