graphic recognition on highway diagrammatic guide …design-cu.jp/iasdr2013/papers/2085-1b.pdf ·...
TRANSCRIPT

1
Graphic Recognition on Highway Diagrammatic Guide Sign
Chia-Hua Lin *, Kai-Chieh Lin ** Cherng-Yee Leung, Cheng-Hung Huang, Tzu-Wen Hsu, Chih-Fu Wu, Kai-Kuo Chang, Ming-Cheng Huang
* [email protected] ** [email protected]
Abstract: To improve the performance of traffic engineering facilities, the research result obtains
the revises about the design standards of highway diagrammatic guide sign by the theories of vision
human factors and Gestalt psychology. First, we collected the relative methods and results of vision
cognition researches and generalized a study of the difference in diagrammatic guide sign between
Taiwan, USA, Japan, UK, South Korea and Germany. Second, by the experiment, we got the
important design factors to influence the driver’s cognition for highway diagrammatic guide sign.
Final, to avoid choosing the wrong roads, we generalized the design standards of highway
diagrammatic guide sign with better driver’s cognition. Hope the research result could help
government organizations to set up the diagrammatic guide sign.
Key words: Graphic Recognition, Visual Perception, cognition, Gestalt psychology, diagrammatic guide signs
1. Introduction In recent years, due to the complexity of some road networks that are difficult to provide sufficient driving
guidance for road users, diagrammatic guide signs are therefore used to show drivers directions on interchange
exits with indirect guide sign in Taiwan. However, according to the incidents of petition on the poor design of
diagrammatic guide sign filed to the Ministry of Transportation and Communication (MOTC) in Taiwan in 2000,
the main issues lied on the gap between the graphical arrows and the actual road types, particularly the ambiguous
configuration location of the place name and the arrows of two highways, which could generate wrong
information link and cause road users to confuse at the interexchange or take the wrong road (Figure 1 & Figure
2). The abovementioned issues indicated that the diagrammatic graphic design of diagrammatic guide sign fails to
take into comprehensive consideration of the human factor requirements and the degree of mental workload in
road users. Hence, the study analyzed the relationship between the graphic and information location configuration
of freeway diagrammatic guide signs for road users, in order to understand the road user awareness and
comprehension to the different graphics on the diagrammatic guide signs.
Figure 1. A case of mismatched graphic diagrammatic design and actual road types
Figure 2. Inability to understand whether to go straight or turn left to Wanli
The information drivers received by the graphics and the meaningful comprehension of symbols are a

2
comprehensive perceived result, which is not a single and independent individual interpretation. Such basis
of comprehensive visual recognition was proposed by Easterby, R.S. (1978) while psychologist Kurt Koffka
proposed the three factors that affect information readability, legibility, visibility. Moreover, scholar Lehto M.
R. (1992) suggested that the evaluation items for graphic interpretation can be divided into perception and
comprehension layers. The first layer is the perception, including information visibility and degree of recognition.
The second layer is comprehension, which refers to the evaluation on the solubility evaluation of the overall visual
elements, consisting mainly of graphic design and configuration location as the items of evaluation. Scholar
Canpbell, J.L. (2004) et al. also proposed the order of comprehension recognition of guides, whereas the
graphic and information comprehension must first reach legibility before generating visibility, followed by
the interpretation.
A number of scholars have conducted relevant studies of guide signs with emphasize on the relationship
between the text arrangement and the font size of text-based guide signs, such as the discussion on the
numerical interpretation of Japanese road signs conducted by Wake Tenji and Shimizu Yutaka (1973)
while Nishikawa Kiyoshi and Mogi Kazushi (1982) further analyzed the arrangement relationship between
Japanese place names, numbers and arrows on the sign for text-based guide signs, in addition to proposing
solutions for graphic configuration with better visibility. Scholar T.J.B. Kline (1990) et al. focused on the
performance of graphic information on the young, mid-aged and senior generations under the visible
distance on highway. Annie W.Y. & Alen H. S. (2007) on the other hand conducted the study on graphics
cognitive characteristics of road users towards the design of road guide signs, including the testing on
graphic familiarity, information accuracy, representative meaning, and simplicity, as well as proposing a
more user-friendly design direction for road signs based on the cognitive characteristics of road users.
Taiwanese scholar, Hong, L.S. (1991) also discussed the Chinese legibility from the statics guide signs on
Taiwanese freeways by drawing a conclusion for recommendation in selecting the font size, arrangement
location, number of strokes, and thickness of the strokes. On the other hand, Hong, J. J. (2010) emphasized
on the freeway guide sign system planning in Changhua County by probing into how to help road users
acquire correct instructions and guide, thereby to bring the efficiency of the entire network and the
function of guide signs into full play.
Lisa Graham (2008) discussed the graphic and text-based arrangement location displayed from the
screens of interactive media design through Gestalt psychology. However, there are not relevant studies that
discuss issues on road user perceived performance for graphic vision, sign design, and the arrangement
location for various visual elements from the foundation of diagrammatic guide signs. Moreover, despite of
the graphic design sample for diagrammatic guide signs provided by the Ministry of Transportation and
Communication in Taiwan, there are no precise experiment data that support the effective drivers’
recognition of various design elements.
For this reason, the study started with the collection of research between recognition and guide sign under visual
human factory and Gestalt psychology. Second, it organized the design standards of diagrammatic guide signs in
different languages. Hence, the study proposed the graphic presentation and better arrangement locations for the visual
elements of freeway diagrammatic guide signs.

3
2. Design standards of diagrammatic guide sign in different languages The different national diagrammatic guide signs are divided into bilingual system and monolingual system
through the language distinction. The study applied the United States, UK, and Germany as the representative of
monolingual country while Japan, South Korea and Taiwan were the representative of bilingual-system countries,
to undergo the discussion on the graphic design and arrangement specification for diagrammatic guide signs. In
terms of basic text language, most countries use the national lingua franca as while Taiwan, Japan and South
Korea add English as a supplementary language. The presentation of lingua franca on the signs is usually arranged
from top down or left to right, in which the height of lingua franca text is higher than the supplementary language
while the X0height of supplementary language will not exceed 1/2 the height of lingua franca. Moreover, in terms
of font choice, most countries use simple, square and linear black fronts. For word-level specification, with the
exception of the fixed Korean word-level, most countries adjust the size according to the driving speed. Currently,
the word-level specified for Taiwan freeway (speed limit over 70KM or higher) is 60 x 60 cm for Chinese
incorporated with 30 x 30 English words, and is one of the countries using the largest word-level.
The aforementioned six countries also show different styles in labeling place names, road graphics and arrows,
as shown in Table 1. The graphic arrows of Taiwan and Japan are similar, whereas the text of place names is
placed on top of the arrow. However, Japan also has the cases of drawing the angles according to the actual road
types by reducing the width of the graphic arrow and placing the text of the place names on the tip of the arrow.
Korea diagrammatic guide signs reduce the graphic arrow to the center of the plate while the place name is placed
in front of the arrow. Taiwan, Japan and Korea all use the arc or curved arrows to present the road types of the
interchange exits. The United States place the dotted line in the graphic arrow inside as the sign for traffic
separation, whereas the text of place names is placed in front of the arrow. The UK adopts a columnar design for
the graphic arrow, using 45 degree line to extend the arrow, whereas the text of the place names is placed in front
of the arrow. German adopts narrow-arrow design for the graphic arrow to place the text of place names on top of
the arrow.
After integrating the design specification of the diagrammatic guide signs from the six countries, Taiwan was
discovered with using the largest specification for word level, font and spacing in text. Therefore, the study
assigns the word level, font and spacing in text as the control variables to mainly emphasize on the configuration
forms of visual elements in the diagrammatic guide signs. Based on the comparison of the graphic design and
arrangement for the diagrammatic guide signs form the six countries, the study integrated the key reference for
developing experiment samples design, summarized in the follows: 1. Text and arrow alignment methods. 2.
Arrangement location for the text and the arrow. 3. Graphic road type structures. 4. Configuration for graphic
arrow and freeway route number.

4
Table 1. Graphic Design and Arrangement Examples of Diagrammatic Guide Signs
Taiwan Japan Korea United States UK Germany Languag
e Lingua Franca + Supplementary Language Lingua Franca
Font 1. Simple and square lines for the text, non-serif fonts 2. Inclined to use fronts with larger X-height (using X-height as the calculation
benchmark) 3. Avoid front structures with higher rate of misreading; i.e.: 03689, sgij…etc.
Text Size
Varies according to different speed
Fixed size according to
plate
Defining text size according to plate
types
Adjusting text size according to speed
limit Graphic Arrow
Patterns
Drawn
according to the
angles of actual road
types
Dotted line added to the arrrows
Columnar arrows
Thinner arrows
3. Methods
3.1 Sample design
The study takes the design keys from other countries into consideration to conclude the improvement items and
design variables of diagrammatic guide signs based on the poor design of graphic road type structures from the
poor arrangement location for visual elements from the existing diagrammatic guide signs commonly seen in
Taiwan, into the following: 1. Degree of road type simplification. 2. Distance between text and main arrow. 3.
Location of text information.4. Formation of freeway interchanges (as shown in Table 2).
Table 2. Variables in Sample Design Degree of road
type simplification (2 levels )
Secondary route simplification Secondary route semi-simplification
Distance between text and main
arrow (2 levels)
Aligning arrow tip 80 cm (distance between the place names on the right and the primary route from the
existing plates)
Location of text information (3 levels)
Text information place on top of the arrow Text information placed below the arrow
Text information placed on tip of the arrow Formation of
highway (freeway)
interchanges (2 types)
Interchange Exit 1 Interchange Exit 2
A total of 24 sample plates (will eliminate 4 plates) A total of 24 plate samples were generated from the interaction between the various design variables, including
four designs of arrangement, namely the arrangement for “Aligning arrow tip” and the “Text information place on
top of the arrow”, and the arrangement between the “80cm” and the “Text information placed on tip of the

5
arrow.” of interchange exit 1 and interchange exit 2. Due to the conflict between the two variables, no plates
could be generated and are therefore eliminated. Finally, 20 plates were validated for use as the experiment
samples for the diagrammatic guide sign experiment. The complete plate is arranged with interchange exit 1
and interchange exit 2 as shown in Figure 3 and Figure 4. With the exception for plate number 6 and plate
number 16 equipped with the same arrangement of existing plates, all remaining plates from the 20 plate samples
include different information arrangement methods. Moreover, to avoid participant having familiarity or
expectation for the information, the actual place names and route numbers were replaced by virtual place names
and route numbers.
Figure 3. Samples Design (One exit from Interchange)
Figure 4. Sample Design (2nd Exit from Interchange)
3.2 Experiment preparation The study divides the experiment tasks into two categories, namely the route recognition for “place name
search” and route recognition of “freeway route number search” representing indirect guide. After assigning the

6
tasks and objectives to the participant, display the sample plate of diagrammatic guide sign randomly via a 22”
LCD monitor, supplemented by calculating the time taken by the participant upon completion of tasks in
comprehending the sample plates with the application. After interpreting the sample, the participants are required
to fill out the paper questionnaire to confirm whether if the participant clearly know how to comprehend the task
and objectives. The analytical results show the comprehension correct rate for “place name search” and “freeway
route number searches” for each plate and the validation of interpretation performance for each plate. The
overall planning of the experiment is divided into 40 tasks and the participants are tested using Latin squares to
sort the order. Each participant is expected to complete all tasks in 30 minutes. The experiment objects,
questionnaire design, evaluation methods, experiment flow, experiment facilities, and site planning are described
in details as follows:
1. Experiment Facilities
For hardware, an ASUS VH228D LCD wide monitor and ASUS N56V series of 15” notebook were used to
present the experiment tasks and diagrammatic guide sign plates. The testing interface used by the
experiment was a program written by Visual Basic.net. Due to the lack of uniform sign plate size, the
different sizes will affect the visual recognition of drivers. To avoid the problem, by removing 4cm white
frame from sample plates, the experiment places the different sizes of sample plates to the green
background screen whose color is similar to the one in background of plates, as shown in Figure 5.
Figure 5. Experiment Screen Illustration
2. Experiment Participant
To make an extensive distribution of participant population, a site for experiment was set up in the Guangxi
Rest Area in Hsinchu County where a large crowd of drivers gather. A total of 40 road users with driver
license were publicly recruited for the experiment. Based on the proportion of driver license holding among
Taiwanese men and women of 7:3, the number of male participant was set to 28 and 12 for female
participant.
3. Questionnaire Design. The questionnaire content includes questions for “place names search” and “freeway
route numbers search with indirect guide.” Each participant was wasted with the comprehension to place
name information and graphic arrangement as well as the comprehension to the meaning represented by
freeway route numbers from each plate. The questions include the following four items of interpretation:
l Task 1- to test the decision judgment for place name search task.
l Task 2- to test the comprehension of place name in place name search task and link with
freeway route number.
l Task 3- to test the decision judgment of proceeding to the freeway route numbers with indirect
guide.

7
l Task 4- to test the comprehension for the freeway route number connection and to proceed to the
freeway route number with indirect guide.
4. Evaluation Methods. To analyze the effectiveness of the constituting element configuration of diagrammatic
guide signs on driver judgment. The studied applied relevant studies conducted by Easterby, R.S. (1978)
and Lehto, M.R. (1992) to integrate the variables and criterion for the judgment of graphic recognition in
order to understand the following points: 1) Correct rate of comprehension degree. 2) Judgment efficiency
and 3) judgment performance of sample plates. The study recorded the plate recognition time of each of the
40 participant, the road and place name search correct rate in order to analyze the variance clusters and
analyze the influence factors by ANOVA. In addition, implement LSD on factors with significance
influence, discussing the difference of each plate design combination.
3.3 Procedure A participant will be provided explanation on the purpose of experiment before and education practice before
implementation. After notifying the participant of the task objective, the tasks will notify the participant
destination name or representing indirect guide. Then a sample plate will show up. After monitor changes the
screen, the participant will fill out the questionnaire for comprehension evaluation. The experiment is using
circulating approach to carry out each task. At the end of the experiment, an interview will be conducted
immediately to understand whether if the participant understands the sample information and the
advantage/disadvantage as well as comments for the plate design.
4. Results and Discussion
4.1 Basic Participant Data The forty participant were publicly recruited from the Guangxi Rest Area for this study, who were randomly
samples however recruited in accordance with the male-to-female driving proportion. The content of basic
questionnaire information includes the gender, age, education, driving frequency, and the types of automobile
driver license of the participant, as shown in Table 3:
Table 3. Basic Data of Experiment Participant
Age 20-67 years old Male 28 (people)
Female 12 (people) Education Elementary
School 2% Junior High School 7%
Senior High
School 48%
Junior College 20%
Universities 18%
Graduate School or higher 5%
Driving Frequency
5-7days (/Week) 42%
3-4 days (/Week) 17%
1-2 days (/week) 7%
Once in every two weeks 5%
Occasionally 18%
Types of Driver’s License
ordinary small cars
79%
ordinary large trucks
9%
ordinary large bus
5%
occupational large trucks
2%
occupational large bus
2%
large, heavy motorcycles
2%
4.2 Correct Rate Analysis
After completing the experiment, the 40 participants were required to take complete the place name search and
freeway route number search tasks on freeway interchange exit 1 and exit 2 (two questions each respectively) for

8
correct rate analysis.
In general, the LSD of correct rate for cognitive evaluation validation questionnaire shows the results (as
shown in Table 4) that the degree of route simplification and interchange exit types significantly affected the
correct rate of participant towards the comprehension of diagrammatic guide signs. The participant received the
highest correct rate at the comprehension of the diagrammatic guide sign plates formed by Exit 2 and the
simplified route type. The recognition performance from combination of Exit 1 and semi-simplification road type
did not reach the standards, therefore the plates for interchange Exit 1 and scope of semi-simplification road type
must undergo re-review.
Table 4. ANOVA for Factors Affecting Correct Rate
Factors Affecting Correct Rate Type ⅢSquared
Sum
Degree of Freedom
Mean Square
F Test Significance
Task Types 5.413 3 1.804 12.576 0.000 Interchange Exit Types 3.033 1 3.033 21.136 0.000
Degree of Road Simplification 5.877 1 5.877 40.961 0.000 Task Type * Interchange Exit Types 1.295 3 0.432 3.007 0.029
Task Types * Degree of Road Simplification 3.180 3 1.060 7.387 0.000 Interchange Exit Types * Degree of Road
Simplification * Text Information Location * Distance between Text and Arrow
1.314 1 1.314 9.159 0.002
The correct rate analysis corresponds with plate performance, whereas the plates for interchange exit 1 and exit
2 types reached higher significant correct rate on the freeway route number search task undergoing meaning of
indirect guide than that of place name search task. Therefore, the freeway route number with indirect guide of the
20 plates offered clear comprehension of configuration for road users; however the place name information
required correction in terms of the overall plate design and configuration. Particularly, the correct rate of “Task
Place Name 2” showed the worst correct rate; hence the arrangement of place name and freeway route number
will require a re-review. For search tasks in freeway route number with indirect guide, the correct rate for “Task
Number 2” (the comprehension of freeway route number connection) was significantly higher than that of “Task
Number 1” (decision judgment to proceed to the freeway route number). Therefore, the sample plate needs to
correct the arrangement and distance relationship between the freeway route number with indirect guide and the
main arrow, in order to facilitate drivers driving on the freeway with making correct driving decision through the
diagrammatic guide signs.
4.3 Recognition time Analysis
The recognition evaluation experiment for diagrammatic guide sign design underwent recognition time analysis
to yield the same variance and correct rate due to the variable was the recognition time for participant. To answer
the task objectives of the plates, the recognition time, α = 0.05, of the participant for the 20 sample plates under
different tasks were summarized and analyzed through the Six-Way ANOVA and Factor Analysis with the results
shown in Table 5. The main influence factors for time recognition includes the interchange exit types and degree
of route simplification. The interaction between “interchange exit type” and “degree of route simplification” and
between “interchange exit type” and “text information location” have significant impact on the needed for
recognition. In general, the constitutes of interchange exit types and arrow graphs significantly affect the
participant comprehension time to the diagrammatic guide sign plates while interchange exit 2 receives shorter
9
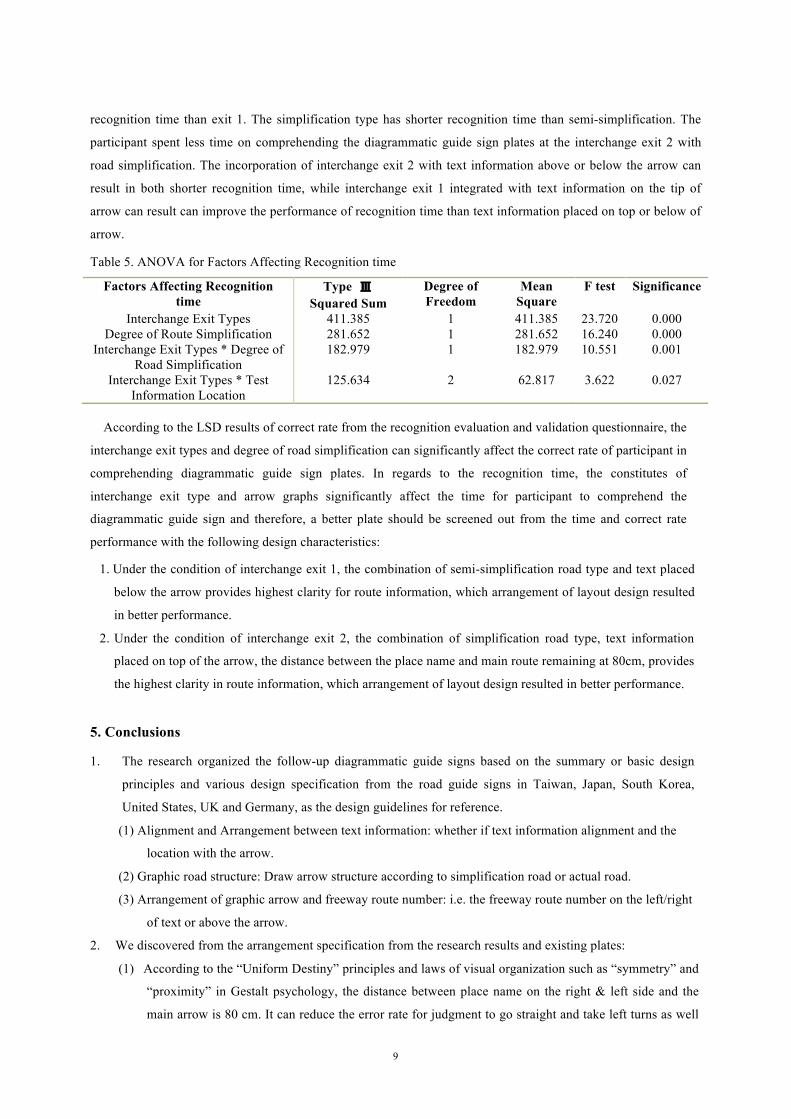
recognition time than exit 1. The simplification type has shorter recognition time than semi-simplification. The
participant spent less time on comprehending the diagrammatic guide sign plates at the interchange exit 2 with
road simplification. The incorporation of interchange exit 2 with text information above or below the arrow can
result in both shorter recognition time, while interchange exit 1 integrated with text information on the tip of
arrow can result can improve the performance of recognition time than text information placed on top or below of
arrow.
Table 5. ANOVA for Factors Affecting Recognition time
Factors Affecting Recognition time
Type Ⅲ Squared Sum
Degree of Freedom
Mean Square
F test Significance
Interchange Exit Types 411.385 1 411.385 23.720 0.000 Degree of Route Simplification 281.652 1 281.652 16.240 0.000
Interchange Exit Types * Degree of Road Simplification
182.979 1 182.979 10.551 0.001
Interchange Exit Types * Test Information Location
125.634 2 62.817 3.622 0.027
According to the LSD results of correct rate from the recognition evaluation and validation questionnaire, the
interchange exit types and degree of road simplification can significantly affect the correct rate of participant in
comprehending diagrammatic guide sign plates. In regards to the recognition time, the constitutes of
interchange exit type and arrow graphs significantly affect the time for participant to comprehend the
diagrammatic guide sign and therefore, a better plate should be screened out from the time and correct rate
performance with the following design characteristics:
1. Under the condition of interchange exit 1, the combination of semi-simplification road type and text placed
below the arrow provides highest clarity for route information, which arrangement of layout design resulted
in better performance.
2. Under the condition of interchange exit 2, the combination of simplification road type, text information
placed on top of the arrow, the distance between the place name and main route remaining at 80cm, provides
the highest clarity in route information, which arrangement of layout design resulted in better performance.
5. Conclusions
1. The research organized the follow-up diagrammatic guide signs based on the summary or basic design
principles and various design specification from the road guide signs in Taiwan, Japan, South Korea,
United States, UK and Germany, as the design guidelines for reference.
(1) Alignment and Arrangement between text information: whether if text information alignment and the
location with the arrow.
(2) Graphic road structure: Draw arrow structure according to simplification road or actual road.
(3) Arrangement of graphic arrow and freeway route number: i.e. the freeway route number on the left/right
of text or above the arrow.
2. We discovered from the arrangement specification from the research results and existing plates:
(1) According to the “Uniform Destiny” principles and laws of visual organization such as “symmetry” and
“proximity” in Gestalt psychology, the distance between place name on the right & left side and the
main arrow is 80 cm. It can reduce the error rate for judgment to go straight and take left turns as well

10
as taking the left turns and the cognitive errors in freeway route number as the optimal arrangement
location.
(2) Based on the “Uniform Destiny and “Proximity” principles in Gestalt psychology, the place name is
placed below the arrow for road users to distinguish between the left/right and top/down information as
well as categorization in order to avoid the confusion between place names and the directions.
(3) The experiment results show that the arrow structure receiving the best evaluation on plate design was the
design consistent to the actual road, while the arrows should be narrowed to increase the space for arc
curve, clarifying the connection space between the linear and turns, in addition to reducing ambiguous
judgment between linear and turning directions.
(4) The simplification road type of arrow structure was more applicable to the plate for exit 2 while the
simplified design used at exit 1. Because drivers intend to implement secondary decision judgment
within a short period of time, they led to the occurrence probability in judgment errors for plate
information.
3. Due to the different design of the better plates used for interchange exit 1 and exit 2, the related units could
not uniform the pattern to improve the plates of diagrammatic guide sign. The experiments results show that
the drivers perceive worse performance for the presentation of exit 1 while the performance for exit 2,
regardless of simplification or semi-simplification, was generally well (with the exception for the distance
and relative location between the text information and the arrow). For this reason, in sum of the above, if the
design for the same type of plate is needed for exit 1 and exit 2, follow the design principles for exit 1 with
better plates to design and infer the interchange exit 2 plates with better performance. Therefore, the common
design standard for interchange exit 1 and exit 2 plates are the follows:
(1) Based on semi-simplification (due to the similarity with the actual road, the drivers are able foresee the
traffic).
(2) Narrowed arrow (reduced to 2/3 of the original arrow width).
(3) Place name below the arrow (to avoid linear misjudgment)
(4) Longer distance between the head and tail of the arrow, as shown in Figure 9 and Figure 10.
Figure 9. Recommended Configuration for Interchange Exit 1
Figure 10. Recommended Configuration for Interchange Exit 2
For the proposal on diagrammatic guide sign design, the study expects to further analyze the plates for
interchange exit 1 and exit 2 and to find out whether if the narrowing arrow design can affect the driving route
judgment of drivers. In addition, the study extend this research results to the visual recognition research for the
diagrammatic guide signs of general roads, which can be taken into important reference for the relevant units in
planning the guidelines for diagrammatic guide sign design.

11
Acknowledgement
The Study acknowledges the funding of sponsorship by the MOTC Institute of Transportation Project (MOTC-
IOT-101-SDB003).
6. References and Citations [1] Taiwan Ministry of Transportation and Communication, (2010), Traffic Engineering Manual
[2] Bruner II, G. C. and Kumar, A. (2007) Attitude toward Location-Based Advertising [Online PDF]. Available at <http://www.jiad.org/vol7/no2/bruner/Attitude%20toward%20locationbased%20advertising.pdf> [Accessed 18 July 2007]
[3] Klemmer, R.S., Thomsen, M., Phelps-Goodman, E., Lee, R. and Landay, J.A. (2002) Where do web sites come from? Capturing and interacting with design history, In Proceedings of CHI 2002, ACM Press, pp 1-8
[4] Schlosser, A. E. (2003) Experiencing Products in the Virtual World: The Role of Goal and Imager in
Influencing Attitudes versus Purchase Intentions, Journal of Consumer Research, vol. 30, no. 2, pp 184-198.
[5] Taiwan Ministry of Transportation and Communication, (2010), Traffic Engineering Manual
[6] Bruner II, G. C. and Kumar, A. (2007) Attitude toward Location-Based Advertising [Online PDF]. Available at <http://www.jiad.org/vol7/no2/bruner/Attitude%20toward%20locationbased%20advertising.pdf> [Accessed 18 July 2007]
[7] Klemmer, R.S., Thomsen, M., Phelps-Goodman, E., Lee, R. and Landay, J.A. (2002) Where do web sites come from? Capturing and interacting with design history, In Proceedings of CHI 2002, ACM Press, pp 1-8
[8] Schlosser, A. E. (2003) Experiencing Products in the Virtual World: The Role of Goal and Imager in
Influencing Attitudes versus Purchase Intentions, Journal of Consumer Research, vol. 30, no. 2, pp 184-198.
[9] Taiwan Ministry of Transportation and Communication, (2010), Traffic Engineering Manual
[10] Bruner II, G. C. and Kumar, A. (2007) Attitude toward Location-Based Advertising [Online PDF]. Available at <http://www.jiad.org/vol7/no2/bruner/Attitude%20toward%20locationbased%20advertising.pdf> [Accessed 18 July 2007]
[11] Klemmer, R.S., Thomsen, M., Phelps-Goodman, E., Lee, R. and Landay, J.A. (2002) Where do web sites come from? Capturing and interacting with design history, In Proceedings of CHI 2002, ACM Press, pp 1-8
[12] Schlosser, A. E. (2003) Experiencing Products in the Virtual World: The Role of Goal and Imager in
Influencing Attitudes versus Purchase Intentions, Journal of Consumer Research, vol. 30, no. 2, pp 184-198.
[13] Taiwan Ministry of Transportation and Communication, (2010), Traffic Engineering Manual
[14] Bruner II, G. C. and Kumar, A. (2007) Attitude toward Location-Based Advertising [Online PDF]. Available at <http://www.jiad.org/vol7/no2/bruner/Attitude%20toward%20locationbased%20advertising.pdf> [Accessed 18 July 2007]
[15] Klemmer, R.S., Thomsen, M., Phelps-Goodman, E., Lee, R. and Landay, J.A. (2002) Where do web sites come from? Capturing and interacting with design history, In Proceedings of CHI 2002, ACM Press, pp 1-8
[16] Schlosser, A. E. (2003) Experiencing Products in the Virtual World: The Role of Goal and Imager in
Influencing Attitudes versus Purchase Intentions, Journal of Consumer Research, vol. 30, no. 2, pp 184-198.
[17] Taiwan Ministry of Transportation and Communication, (2010), Traffic Engineering Manual
12
[18] Bruner II, G. C. and Kumar, A. (2007) Attitude toward Location-Based Advertising [Online PDF]. Available at <http://www.jiad.org/vol7/no2/bruner/Attitude%20toward%20locationbased%20advertising.pdf> [Accessed 18 July 2007]
[19] Klemmer, R.S., Thomsen, M., Phelps-Goodman, E., Lee, R. and Landay, J.A. (2002) Where do web sites come from? Capturing and interacting with design history, In Proceedings of CHI 2002, ACM Press, pp 1-8
[20] Schlosser, A. E. (2003) Experiencing Products in the Virtual World: The Role of Goal and Imager in
Influencing Attitudes versus Purchase Intentions, Journal of Consumer Research, vol. 30, no. 2, pp 184-198.
[21] Taiwan Ministry of Transportation and Communication, (2010), Traffic Engineering Manual
[22] Bruner II, G. C. and Kumar, A. (2007) Attitude toward Location-Based Advertising [Online PDF]. Available at <http://www.jiad.org/vol7/no2/bruner/Attitude%20toward%20locationbased%20advertising.pdf> [Accessed 18 July 2007]
[23] Klemmer, R.S., Thomsen, M., Phelps-Goodman, E., Lee, R. and Landay, J.A. (2002) Where do web sites come from? Capturing and interacting with design history, In Proceedings of CHI 2002, ACM Press, pp 1-8
[24] Schlosser, A. E. (2003) Experiencing Products in the Virtual World: The Role of Goal and Imager in
Influencing Attitudes versus Purchase Intentions, Journal of Consumer Research, vol. 30, no. 2, pp 184-198.
[25] Taiwan Ministry of Transportation and Communication, (2010), Traffic Engineering Manual
[26] Bruner II, G. C. and Kumar, A. (2007) Attitude toward Location-Based Advertising [Online PDF]. Available at <http://www.jiad.org/vol7/no2/bruner/Attitude%20toward%20locationbased%20advertising.pdf> [Accessed 18 July 2007]
[27] Klemmer, R.S., Thomsen, M., Phelps-Goodman, E., Lee, R. and Landay, J.A. (2002) Where do web sites come from? Capturing and interacting with design history, In Proceedings of CHI 2002, ACM Press, pp 1-8
[28] Schlosser, A. E. (2003) Experiencing Products in the Virtual World: The Role of Goal and Imager in
Influencing Attitudes versus Purchase Intentions, Journal of Consumer Research, vol. 30, no. 2, pp 184-198.
[29] Taiwan Ministry of Transportation and Communication, (2010), Traffic Engineering Manual
[30] Bruner II, G. C. and Kumar, A. (2007) Attitude toward Location-Based Advertising [Online PDF]. Available at <http://www.jiad.org/vol7/no2/bruner/Attitude%20toward%20locationbased%20advertising.pdf> [Accessed 18 July 2007]