ux (sense-recognition-reaction) based ... -...
TRANSCRIPT
UX (Sense-Recognition-Reaction) Based Service Prototype Design Method
In chan Park*, Sung hee Do**, Young sam Min, Young choong Park, Song yi Kim, Nam choon Park, Eun hey Kang, Jong gyu Park
*YICT/the dna, [email protected] ** the dna, [email protected]
Abstract: In service design, prototype can be regarded as a type of simulation that performs final
service inspection through a series of tests before releasing a service. Our service prototype is
characterized by a realistic service that reflects user experience (sense-recognition-reaction) as
much as possible. The purpose of this research was to review methods for extracting experience
data useful for making realistic prototype. As a useful method of data extraction, we tested and
evaluated degree of satisfaction (Pleasant-Unpleasant) and performance time (Time Recording) as
indices on how satisfactorily the service was performed by participants. Furthermore with
consideration on strong influence of unconscious experience on degree of satisfaction and
performance time, opinions on conscious service were collected through interviews after
completion of the experiment. For comparison of the 3 evaluation indices, satisfaction evaluation
was subjectively carried out on qualitative evaluation (interview) and time. Then, the result was
reviewed to determine whether it accords with biometric measurement result. As a result, Task 4
and Task 5 respectively showed 69.2% and 73.3% agreement. Based on such results, degree of
satisfaction (Pleasant-Unpleasant) and performance time can be reviewed as useful evaluation
indices in service prototyping evaluation.
Key words: UX, User Experience, Service Design, Service Prototyping, Healthcare Service
1. Introduction
1.1 Background Prototype in service design can be considered as a type of simulation that performs final service inspection
through a series of tests before releasing a service. Many service prototype methods were carried out in analog
way, either by manufacturing on 1:1 scale or using a Lego model to embody service situation identical to reality.
[1]
The two analog methods described above have advantages and disadvantages. Manufacturing prototype with
actual size offers sense of reality, but it is restricted by time, expense and space. While Lego type provides short
time required for manufacture, users have difficulty in empathizing with service experience due to small scale and
reduced sense of reality.
1
This research proposes a UX based service prototype design method that includes sense, recognition and
reaction of users while maintaining advantages of analog methods. This method intends to create a realistic
prototype by reflecting user experience as much as possible.
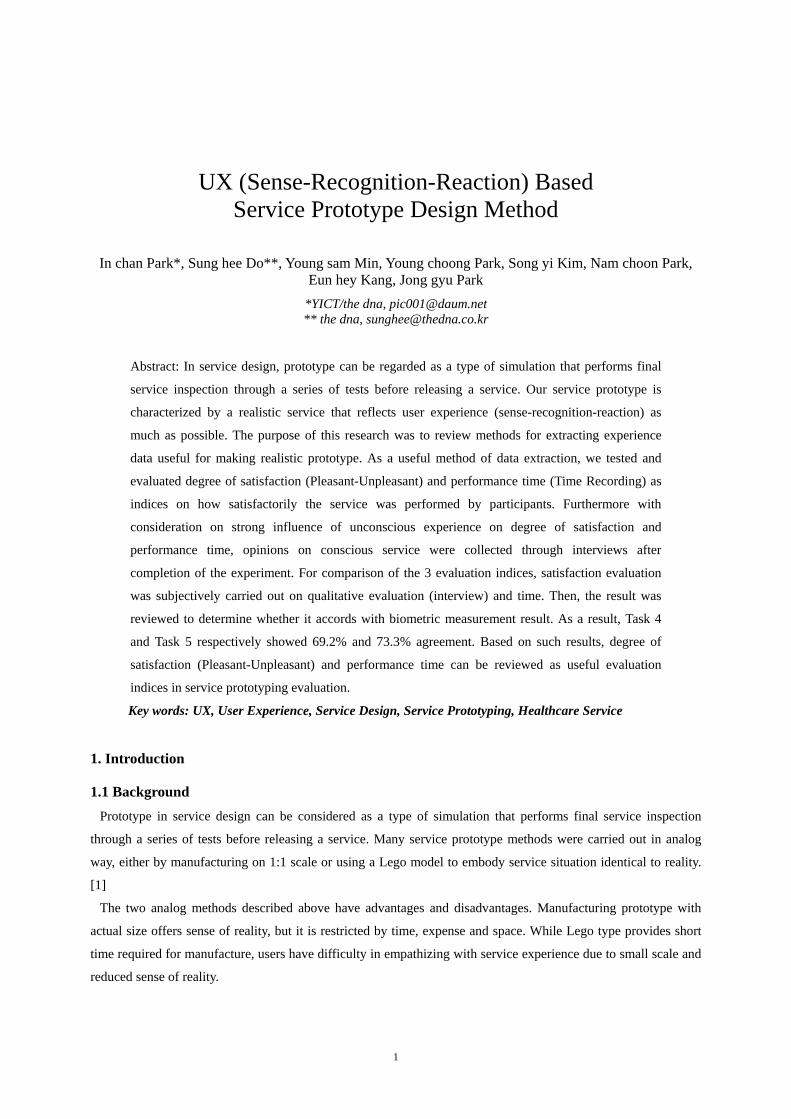
Figure1 is a diagram for interaction between service object and user at the service touch point. The diagram
describes that user experience is generated from interaction of sense, recognition and reaction at the touch point
where service environment with stakeholders (service providers / users).
Service object model
Service interaction model
ServiceObjectModel
UX(Sense-
Recognition-Reaction)Model
User experience model
Touch Point
Touch Point
Figure1. Service Interaction Model
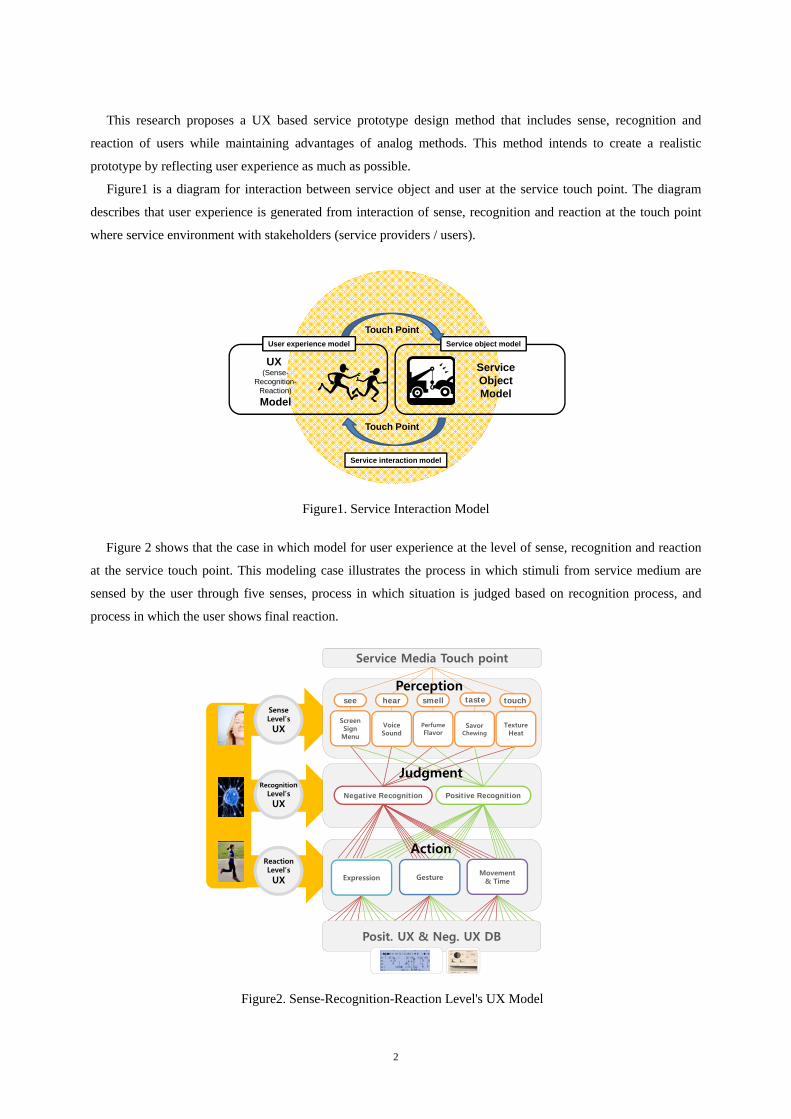
Figure 2 shows that the case in which model for user experience at the level of sense, recognition and reaction
at the service touch point. This modeling case illustrates the process in which stimuli from service medium are
sensed by the user through five senses, process in which situation is judged based on recognition process, and
process in which the user shows final reaction.
SenseLevel’sUX
see tastehear smell touch
RecognitionLevel’sUX
Negative Recognition
ReactionLevel’sUX
ScreenSignMenu
VoiceSound
PerfumeFlavor
SavorChewing
TextureHeat
Service Media Touch point
ExpressionMovement
& Time Gesture
Positive Recognition
Posit. UX & Neg. UX DB
Judgment
Action
Perception
Figure2. Sense-Recognition-Reaction Level's UX Model
2
In specific, this model represents a natural sense-recognition-reaction of human beings who show appropriate
reaction to specific service stimuli based on positive or negative recognition. This means that positive or negative
reaction is stored in the database with linked sense-recognition route and remembered in the brain or by an action
as positive or negative human experience.
As a result, UX based service prototype design method allows designing and testing of user-oriented service
scenario by specifying user experience in 3 perspectives sense, recognition and reaction.
1.2 Objective The objective of service prototype is to extract user demands through realistic and sympathetic service
prototype. This research suggests a UX based service prototype design method focused on user experience.
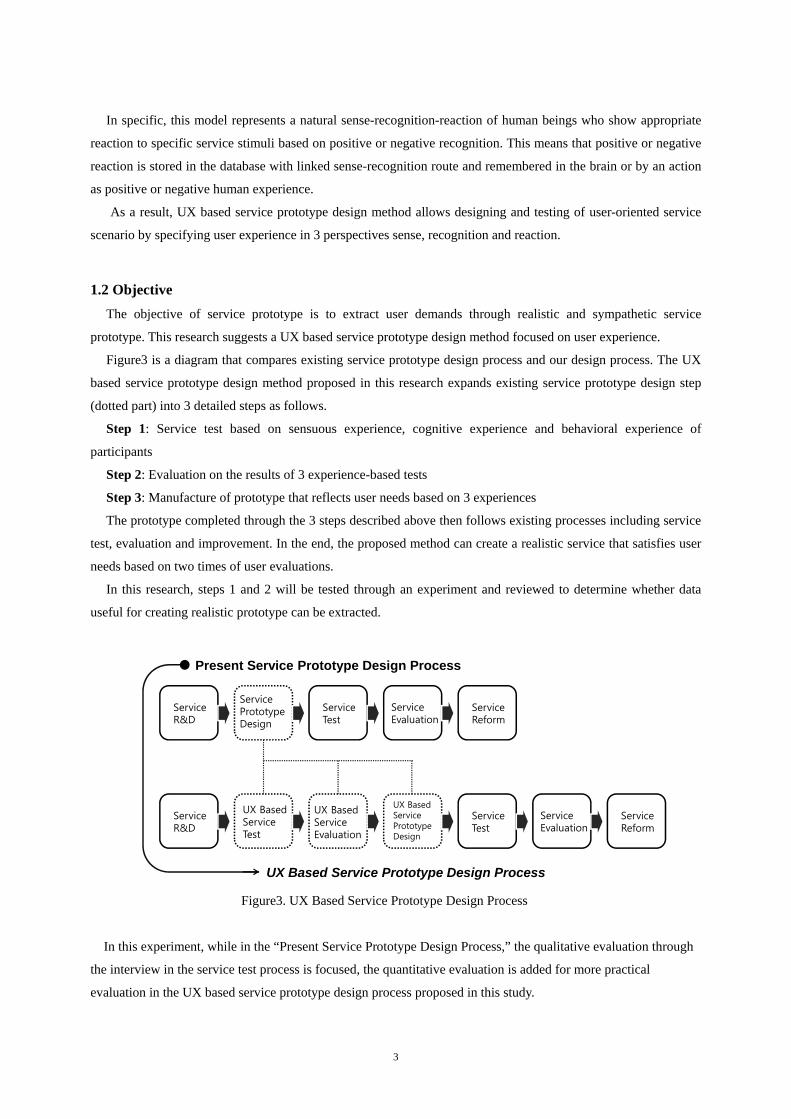
Figure3 is a diagram that compares existing service prototype design process and our design process. The UX
based service prototype design method proposed in this research expands existing service prototype design step
(dotted part) into 3 detailed steps as follows.
Step 1: Service test based on sensuous experience, cognitive experience and behavioral experience of
participants
Step 2: Evaluation on the results of 3 experience-based tests
Step 3: Manufacture of prototype that reflects user needs based on 3 experiences
The prototype completed through the 3 steps described above then follows existing processes including service
test, evaluation and improvement. In the end, the proposed method can create a realistic service that satisfies user
needs based on two times of user evaluations.
In this research, steps 1 and 2 will be tested through an experiment and reviewed to determine whether data
useful for creating realistic prototype can be extracted.
Figure3. UX Based Service Prototype Design Process
ServiceR&D
ServicePrototypeDesign
UX BasedServicePrototypeDesign
ServiceTest
UX BasedServiceTest
UX BasedServiceEvaluation
ServiceEvaluation
ServiceReform
ServiceTest
ServiceEvaluation
ServiceReform
ServiceR&D
UX Based Service Prototype Design Process
Present Service Prototype Design Process
In this experiment, while in the “Present Service Prototype Design Process,” the qualitative evaluation through
the interview in the service test process is focused, the quantitative evaluation is added for more practical
evaluation in the UX based service prototype design process proposed in this study.
3

Based on the Circumflex Model by Russell (1978,1980) [2] [3], the Emotion Inference Algorism developed in
the SMU/Emotion Lab (2013) infers the emotion by mapping PPG, GSR and SKT Signals into two axes ( Pl
vs. Unpleasant and Relax vs. Arouser) through the signal measuring equipment (Biopac). Figure 4 shows the
emotion index based on the Russell’s Circumflex Model.
easant”
Figure. 4 Emotion Index Based on the Russell’s Circumflex Model
In the first quantitative evaluation, the emotion inference system based on the emotion inference algorism is
used. Through this system, experience on the service task can be evaluated under the “Pleasant vs. Unpleasant” in
real time; this evaluation means that the stronger the “Pleasant” is, the greater the satisfaction about the service is.
Second, the quantitative evaluation is the time evaluation. This is one of the most remarkable methods that can
measure the service efficiency when the tasks are performed iteratively. The task performance time is measured by
minutes or seconds; this evaluation means that the smaller the average value is, the greater the experience of the
effective service is. Although the ‘stopwatch’ can be used as a manual measuring method, it is more effective
when using automatic tools including the Ergo Browser, Data Logger, and Baily’s Usability Testing Environment
(UTE). [4] Table 1 shows the Index / Method / Value about two types of quantitative evaluation.
Table.1 Quantitative Evaluation Index / Method / Value
Quantitative Evaluation
Evaluation Index
Methods
Evaluation Value
Emotion Evaluation
Pleasant/Unpleasant
Emotion evaluation of PPG, GST and SKT Signal through the Emotion Inference Algorism
Users’ emotion can be verified at the moment of the task
Time Evaluation Minute /Second
Comparison analysis of the average performance time on each task
Time efficiency on the task can be evaluated
As described above, through the Emotion Evaluation method, the emotional condition of the test takers can be
verified, and the time evaluation has an advantage that can evaluate time efficiency. Therefore, this study tries to
confirm the application value of the emotion (pleasant/unpleasant) and the time on the service task.
4
2. Method
2.1 Stimuli For step 1 experiment (service test based on sensuous experience, cognitive experience and behavioral
experience of participants) and step 2 experiment (evaluation on the results of 3 experience-based tests) described
above, ‘Self-Healthcare Service’ model that “improve usability of local parks and markets” was developed. The
service model is as follows.
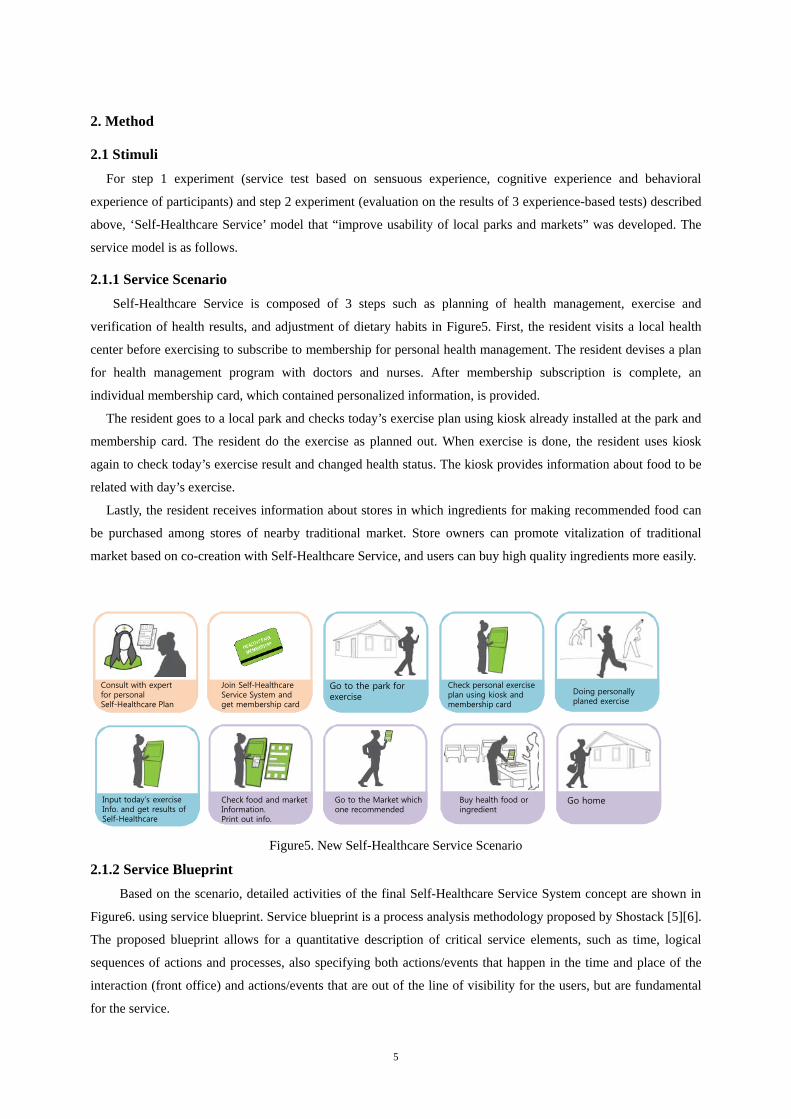
2.1.1 Service Scenario Self-Healthcare Service is composed of 3 steps such as planning of health management, exercise and
verification of health results, and adjustment of dietary habits in Figure5. First, the resident visits a local health
center before exercising to subscribe to membership for personal health management. The resident devises a plan
for health management program with doctors and nurses. After membership subscription is complete, an
individual membership card, which contained personalized information, is provided.
The resident goes to a local park and checks today’s exercise plan using kiosk already installed at the park and
membership card. The resident do the exercise as planned out. When exercise is done, the resident uses kiosk
again to check today’s exercise result and changed health status. The kiosk provides information about food to be
related with day’s exercise.
Lastly, the resident receives information about stores in which ingredients for making recommended food can
be purchased among stores of nearby traditional market. Store owners can promote vitalization of traditional
market based on co-creation with Self-Healthcare Service, and users can buy high quality ingredients more easily.
Consult with expertfor personal Self-Healthcare Plan
Join Self-HealthcareService System andget membership card
Go to the park for exercise
Check personal exerciseplan using kiosk and membership card
Doing personally planed exercise
Input today’s exerciseInfo. and get results ofSelf-Healthcare
Check food and marketInformation.Print out info.
Go to the Market whichone recommended
Buy health food or ingredient
Go home
Figure5. New Self-Healthcare Service Scenario
2.1.2 Service Blueprint Based on the scenario, detailed activities of the final Self-Healthcare Service System concept are shown in
Figure6. using service blueprint. Service blueprint is a process analysis methodology proposed by Shostack [5][6].
The proposed blueprint allows for a quantitative description of critical service elements, such as time, logical
sequences of actions and processes, also specifying both actions/events that happen in the time and place of the
interaction (front office) and actions/events that are out of the line of visibility for the users, but are fundamental
for the service.
5

Figure6. Self-Healthcare Service Blueprint
2.2 Experiment As mentioned in the research, the objective of this case study was to test steps 1 and 2 through experiment and
review methods of extracting useful data for realistic prototype. As a useful method of data extraction, we tested
and evaluated degree of satisfaction (Pleasant-Unpleasant) and performance time as indices for determining
whether participants satisfactorily performed the service. Moreover, the experiment was conducted with
consideration on strong influence of unconscious experience on degree of satisfaction and performance time.
Opinions were collected through interviews.
As a result, degree of satisfaction, performance time and interview results were comprehensively compared to
determine whether data extracted were useful in designing a realistic service prototype.
2.2.1 Kiosk UI Task Kiosk installed in the park provides exercise information and diet menu service for more professional health
management of residents. That is, a resident who receives health diagnosis at a local health center can obtain
personal exercise program through kiosk. After exercise, the resident obtains diet menu for health management
and acquires short-distance market information for purchase of ingredients. Figure7. is a suggested sample of UI.
Figure7. Sample of UI Test r ‘Self-Healthcare Service’
nt. Task1 and 2 are required behavior of using kiosk
before exercise and task 3, 4 and 5 are using after exercise.
fo
Such kiosk services and UI are the stimuli of this experiment that compose the ultimate experimental task. Table
2. Illustrated 5 tasks to be checked through this experime
6
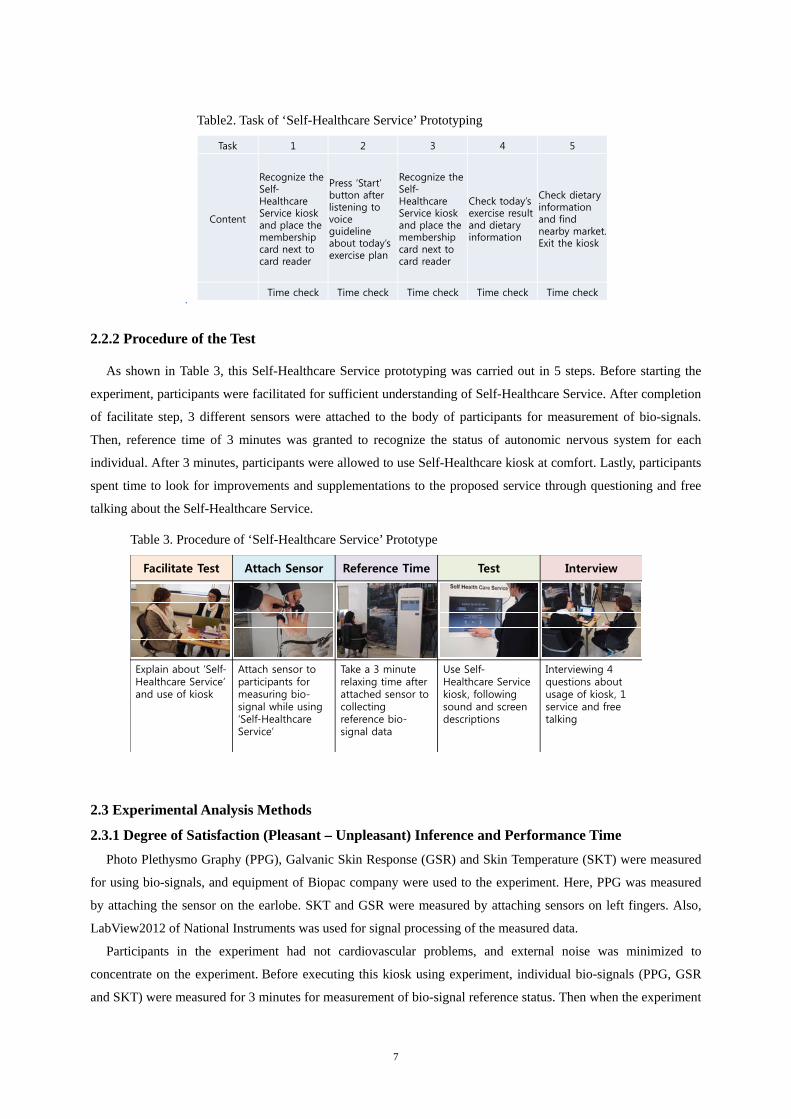
Table2. Task of ‘Self-Healthcare Service’ Prototyping
.
Task 1 2 3 4 5
Content
Recognize the Self-Healthcare Service kiosk and place the membership card next to card reader
Press ‘Start’ button after listening to voice guideline about today’s exercise plan
Recognize the Self-Healthcare Service kiosk and place the membership card next to card reader
Check today’s exercise result and dietary information
Check dietary information and find nearby market. Exit the kiosk
Time check Time check Time check Time check Time check
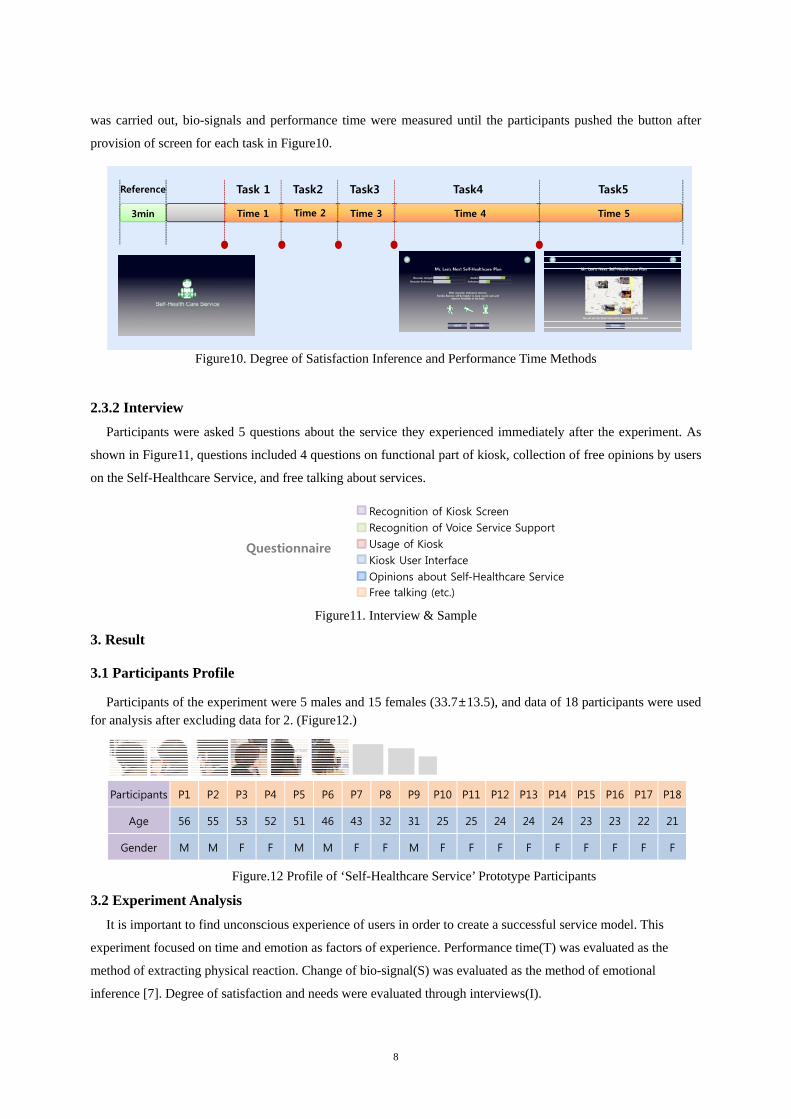
2.2.2 Procedure of the Test
As shown in Table 3, this Self-Healthcare Service prototyping was carried out in 5 steps. Before starting the
experiment, participants were facilitated for sufficient understanding of Self-Healthcare Service. After completion
of facilitate step, 3 different sensors were attached to the body of participants for measurement of bio-signals.
Then, reference time of 3 minutes was granted to recognize the status of autonomic nervous system for each
individual. After 3 minutes, participants were allowed to use Self-Healthcare kiosk at comfort. Lastly, participants
spent time to look for improvements and supplementations to the proposed service through questioning and free
talking about the Self-Healthcare Service.
Table 3. Procedure of ‘Self-Healthcare Service’ Prototype
Facilitate Test Attach Sensor Reference Time Test Interview
Explain about ‘Self-Healthcare Service’ and use of kiosk
Attach sensor to participants for measuring bio-signal while using ‘Self-Healthcare Service’
Take a 3 minute relaxing time after attached sensor to collecting reference bio-signal data
Use Self-Healthcare Service kiosk, followingsound and screen descriptions
Interviewing 4 questions about usage of kiosk, 1 service and free talking
2.3 Experimental Analysis Methods
2.3.1 Degree of Satisfaction (Pleasant – Unpleasant) Inference and Performance Time Photo Plethysmo Graphy (PPG), Galvanic Skin Response (GSR) and Skin Temperature (SKT) were measured
for using bio-signals, and equipment of Biopac company were used to the experiment. Here, PPG was measured
by attaching the sensor on the earlobe. SKT and GSR were measured by attaching sensors on left fingers. Also,
LabView2012 of National Instruments was used for signal processing of the measured data.
Participants in the experiment had not cardiovascular problems, and external noise was minimized to
concentrate on the experiment. Before executing this kiosk using experiment, individual bio-signals (PPG, GSR
and SKT) were measured for 3 minutes for measurement of bio-signal reference status. Then when the experiment
7
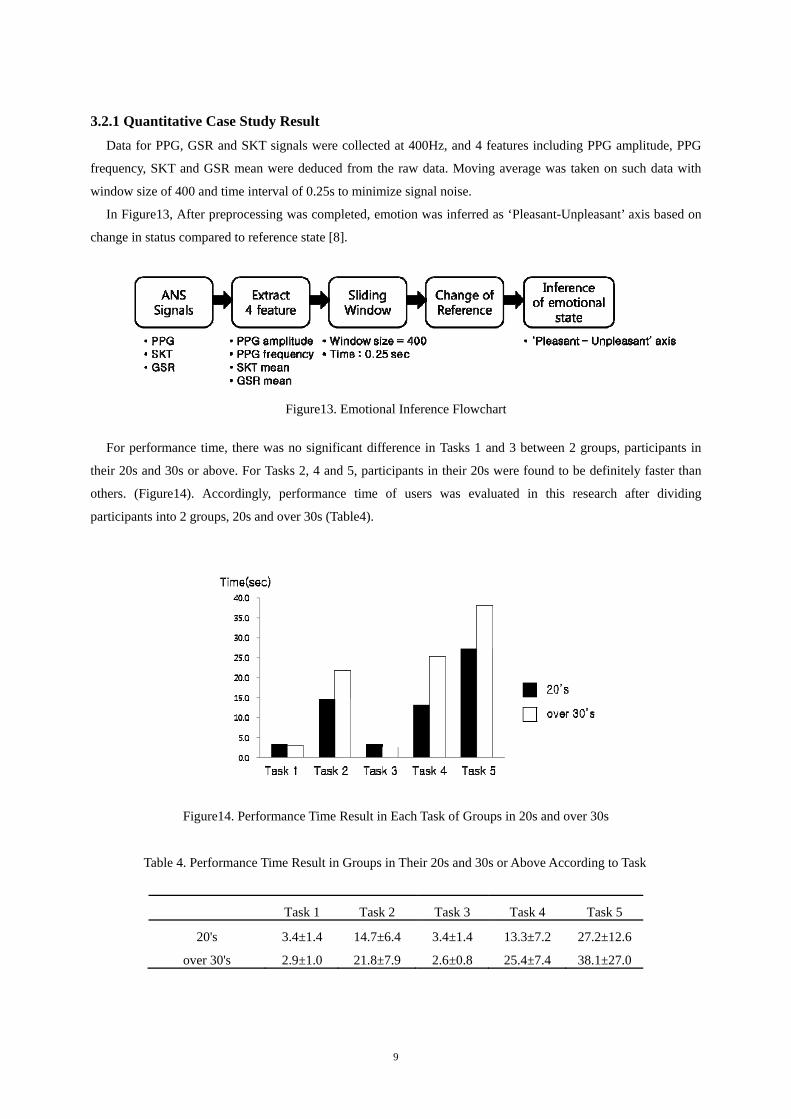
was carried out, bio-signals and performance time were measured until the participants pushed the button after
provision of screen for each task in Figure10.
Figure10. Degree of Satisfaction Inference and Performance Time Methods
3min
Task 1
Time 3 Time 4
Task2
Time 1 Time 2
Task3 Task4 Task5
Time 5
Reference
2.3.2 Interview Participants were asked 5 questions about the service they experienced immediately after the experiment. As
shown in Figure11, questions included 4 questions on functional part of kiosk, collection of free opinions by users
on the Self-Healthcare Service, and free talking about services.
Recognition of Kiosk Screen
Recognition of Voice Service Support
Usage of Kiosk
Kiosk User Interface
Opinions about Self-Healthcare ServiceFree talking (etc.)
Questionnaire
Figure11. Interview & Sample
3. Result
3.1 Participants Profile
Participants of the experiment were 5 males and 15 females (33.7±13.5), and data of 18 participants were used for analysis after excluding data for 2. (Figure12.)
Participants P1 P2 P3 P4 P5 P6 P7 P8 P9 P10 P11 P12 P13 P14 P15 P16 P17 P18
Age 56 55 53 52 51 46 43 32 31 25 25 24 24 24 23 23 22 21
Gender M M F F M M F F M F F F F F F F F F
Figure.12 Profile of ‘Self-Healthcare Service’ Prototype Participants
3.2 Experiment Analysis It is important to find unconscious experience of users in order to create a successful service model. This
experiment focused on time and emotion as factors of experience. Performance time(T) was evaluated as the
method of extracting physical reaction. Change of bio-signal(S) was evaluated as the method of emotional
inference [7]. Degree of satisfaction and needs were evaluated through interviews(I).
8
3.2.1 Quantitative Case Study Result Data for PPG, GSR and SKT signals were collected at 400Hz, and 4 features including PPG amplitude, PPG
frequency, SKT and GSR mean were deduced from the raw data. Moving average was taken on such data with
window size of 400 and time interval of 0.25s to minimize signal noise.
In Figure13, After preprocessing was completed, emotion was inferred as ‘Pleasant-Unpleasant’ axis based on
change in status compared to reference state [8].
Figure13. Emotional Inference Flowchart
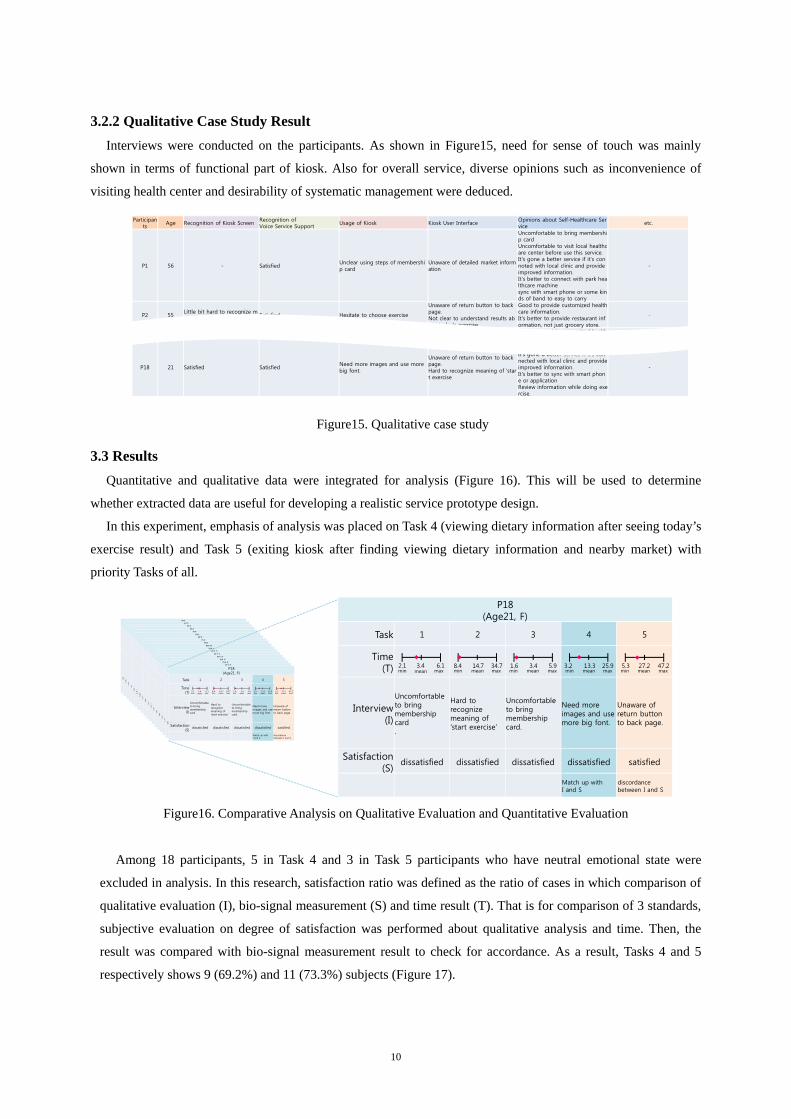
For performance time, there was no significant difference in Tasks 1 and 3 between 2 groups, participants in
their 20s and 30s or above. For Tasks 2, 4 and 5, participants in their 20s were found to be definitely faster than
others. (Figure14). Accordingly, performance time of users was evaluated in this research after dividing
participants into 2 groups, 20s and over 30s (Table4).
Figure14. Performance Time Result in Each Task of Groups in 20s and over 30s
Table 4. Performance Time Result in Groups in Their 20s and 30s or Above According to Task
Task 1 Task 2 Task 3 Task 4 Task 5
20's 3.4±1.4 14.7±6.4 3.4±1.4 13.3±7.2 27.2±12.6
over 30's 2.9±1.0 21.8±7.9 2.6±0.8 25.4±7.4 38.1±27.0
9
3.2.2 Qualitative Case Study Result Interviews were conducted on the participants. As shown in Figure15, need for sense of touch was mainly
shown in terms of functional part of kiosk. Also for overall service, diverse opinions such as inconvenience of
visiting health center and desirability of systematic management were deduced.
Participants
Age Recognition of Kiosk ScreenRecognition of Voice Service Support
Usage of Kiosk Kiosk User InterfaceOpinions about Self-Healthcare Service
etc.
P1 56 - SatisfiedUnclear using steps of membership card
Unaware of detailed market information
Uncomfortable to bring membership cardUncomfortable to visit local healthcare center before use this service.It's gone a better service if it's connoted with local clinic and provide improved information.It's better to connect with park healthcare machinesync with smart phone or some kinds of band to easy to carry
-
P2 55Little bit hard to recognize market images
Satisfied Hesitate to choose exercise
Unaware of return button to back page.Not clear to understand results about today’s exercise
Good to provide customized healthcare information.It's better to provide restaurant information, not just grocery store.
-
P3 53 Satisfied Satisfied Not fully satisfiedConfusing to use.Operate incorrectly
Good to provide customized healthcareinformation.
Hold membership card on reader panel, while using kiosk
P18 21 Satisfied SatisfiedNeed more images and use more big font.
Unaware of return button to back page.Hard to recognize meaning of ‘start exercise
Uncomfortable to bring membership cardIt's gone a better service if it's connected with local clinic and provide improved information.It's better to sync with smart phone or applicationReview information while doing exercise.
-
Figure15. Qualitative case study
3.3 Results Quantitative and qualitative data were integrated for analysis (Figure 16). This will be used to determine
whether extracted data are useful for developing a realistic service prototype design.
In this experiment, emphasis of analysis was placed on Task 4 (viewing dietary information after seeing today’s
exercise result) and Task 5 (exiting kiosk after finding viewing dietary information and nearby market) with
priority Tasks of all.
P1(Age56, M)
Task 1 2 3 4 5
Time(T)
Interview(I)
Unclear using steps of membership card
Unclear using steps of membership card
Unaware of detailed market information
Satisfaction(S)
neutrality dissatisfied neutrality dissatisfied satisfied
discordance between T and S
discordance between I and S
min maxmean1.7 4.82.9 12.2 35.721.8 1.6 3.82.6 13.9 35.125.4 15.1 92.038.1
min maxmean min maxmean min maxmean min maxmean
P2(Age55, M)
Task 1 2 3 4 5
Time(T)
Interview(I)
Hesitate to choose exercise
Not clear to understandresults about today’s exercise
Unaware of return button to back page.Market image is too small to recognize.
Satisfaction(S)
dissatisfied satisfied dissatisfied dissatisfied dissatisfied
Match up with T, I and S
Match up with T, I and S
min maxmean1.7 4.82.9 12.2 35.721.8 1.6 3.82.6 13.9 35.125.4 15.1 92.038.1
min maxmean min maxmean min maxmean min maxmean
P3(Age53, F)
Task 1 2 3 4 5
Time(T)
Interview(I)
Hold membership card on reader panel, while using kiosk
Not easy to recognize usageof kiosk
Hold membership card on reader panel, while using kiosk
Confusing touse.Operate incorrectly
Operate incorrectly
Satisfaction(S)
Dissatisfied neutrality dissatisfied neutrality neutrality
min maxmean1.7 4.82.9 12.2 35.721.8 1.6 3.82.6 13.9 35.125.4 15.1 92.038.1
min maxmean min maxmean min maxmean min maxmean
P4(Age52, F)
Task 1 2 3 4 5
Time(T)
Interview(I)
Hold membership card on reader panel, while using kiosk
Hard to recognize meaning of ‘start exercise’ and confused to use.
Hold membership card on reader panel, while using kiosk
Touch panel’s operating was not good as smartphone
Touch panel’s operating was not good as smartphone.Little confuse to use.
Satisfaction(S)
dissatisfied satisfied dissatisfied satisfied satisfied
Match up with T, I and S
discordance between T and S
min maxmean1.7 4.82.9 12.2 35.721.8 1.6 3.82.6 13.9 35.125.4 15.1 92.038.1
min maxmean min maxmean min maxmean min maxmean
P5(Age51, M)
Task 1 2 3 4 5
Time(T)
Interview(I)
Little confuse to holding membership card.
Little confusedbut mostly use.
Little confuse to holding membership card.
Not clear to understandresults about today’s exercise
Unaware of return button to back page.Little confuse to use.
Satisfaction(S)
satisfied satisfied dissatisfied dissatisfied dissatisfied
Match up with T, I and S
Match up with I and S
min maxmean1.7 4.82.9 12.2 35.721.8 1.6 3.82.6 13.9 35.125.4 15.1 92.038.1
min maxmean min maxmean min maxmean min maxmean
P6(Age46, M)
Task 1 2 3 4 5
Time(T)
Interview(I)
Hesitate to choose exercise
Not clear to understandresults about graph.
Unaware of return button to back page.
Satisfaction(S)
dissatisfied satisfied dissatisfied dissatisfied dissatisfied
Match up with T, I and S
Match up with T, I and S
min maxmean1.7 4.82.9 12.2 35.721.8 1.6 3.82.6 13.9 35.125.4 15.1 92.038.1
min maxmean min maxmean min maxmean min maxmean
P7(Age43, F)
Task 1 2 3 4 5
Time(T)
Interview(I)
Hard to recognize finishto use kiosk
Touch panel’s operating was not good as smartphone.
Touch panel’s operating was not good as smartphone.
Satisfaction(S)
dissatisfied satisfied dissatisfied satisfied satisfied
Match up with T and S
Match up with T and S
min maxmean1.7 4.82.9 12.2 35.721.8 1.6 3.82.6 13.9 35.125.4 15.1 92.038.1
min maxmean min maxmean min maxmean min maxmean
P8(Age32, F)
Task 1 2 3 4 5
Time(T)
Interview(I)
Recommended food image was not good.
Satisfaction(S)
dissatisfied neutrality dissatisfied satisfied dissatisfied
discordance between T and S
Match up with I and S
min maxmean1.7 4.82.9 12.2 35.721.8 1.6 3.82.6 13.9 35.125.4 15.1 92.038.1
min maxmean min maxmean min maxmean min maxmean
P9(Age31, M)
Task 1 2 3 4 5
Time(T)
Interview(I)
Little confusedto choose exercise.
Not hard to use,But confused
Need more information about food
Satisfaction(S)
dissatisfied dissatisfied dissatisfied Neutrality dissatisfied
discordance between T and S
min maxmean1.7 4.82.9 12.2 35.721.8 1.6 3.82.6 13.9 35.125.4 15.1 92.038.1
min maxmean min maxmean min maxmean min maxmean
P10(Age25, F)
Task 1 2 3 4 5
Time(T)
Interview(I)
Little confusedto choose exercise.
Not clear to understandresults about graph.Concerned about exposure personal information.
Need print out function after watching market location information.
Satisfaction(S)
dissatisfied satisfied dissatisfied satisfied satisfied
discordance between T and S
Match up with T and S
min maxmean2.1 6.13.4 8.4 34.714.7 1.6 5.93.4 3.2 25.913.3 5.3 47.227.2
min maxmean min maxmean min maxmean min maxmean
P11(Age25, F)
Task 1 2 3 4 5
Time(T)
Interview(I)
Touch panel’s operating was not good
Confused between voice information and screen.
Need current location information
Satisfaction(S)
neutrality neutrality neutrality dissatisfied satisfied
Match up with T, I and S
discordance between T and S
min maxmean2.1 6.13.4 8.4 34.714.7 1.6 5.93.4 3.2 25.913.3 5.3 47.227.2
min maxmean min maxmean min maxmean min maxmean
P12(Age24, F)
Task 1 2 3 4 5
Time(T)
Interview(I)
Button locationis low to use. Uncomfortable to touch button
Confused between voice information and screen.
Back button location is not comfortable to recognize and use
Satisfaction(S)
dissatisfied dissatisfied neutrality neutrality dissatisfied
Match up with T, I and S
min maxmean2.1 6.13.4 8.4 34.714.7 1.6 5.93.4 3.2 25.913.3 5.3 47.227.2
min maxmean min maxmean min maxmean min maxmean
P13(Age24, F)
Task 1 2 3 4 5
Time(T)
Interview(I)
Press the finish button because can’t recognize what’s next
Satisfaction(S)
satisfied satisfied neutrality dissatisfied satisfied
Match up with I and S
Match up with I and S
min maxmean2.1 6.13.4 8.4 34.714.7 1.6 5.93.4 3.2 25.913.3 5.3 47.227.2
min maxmean min maxmean min maxmean min maxmean
P14(Age24, F)
Task 1 2 3 4 5
Time(T)
Interview(I)
Confused touse.Provide more exercise information such as time, tools etc…
Press the finish button because can’t recognize what’s next
Need zoom-in, zoom-out function.Unnecessary to show market location and information.
Satisfaction(S)
dissatisfied dissatisfied dissatisfied dissatisfied dissatisfied
Match up with I and S
Match up with I and S
min maxmean2.1 6.13.4 8.4 34.714.7 1.6 5.93.4 3.2 25.913.3 5.3 47.227.2
min maxmean min maxmean min maxmean min maxmean
P15(Age23, F)
Task 1 2 3 4 5
Time(T)
Interview(I)
Touch panel’s operating was not good
Touch panel’s operating was not good
Unaware of return button to back page.
Satisfaction(S)
dissatisfied dissatisfied neutrality dissatisfied dissatisfied
Match up with T, I and S
Match up with T, I and S
min maxmean2.1 6.13.4 8.4 34.714.7 1.6 5.93.4 3.2 25.913.3 5.3 47.227.2
min maxmean min maxmean min maxmean min maxmean
P16(Age23, F)
Task 1 2 3 4 5
Time(T)
Interview(I)
Uncomfortable to bring membership card
Hard to recognize meaning of ‘start exercise’ and confused to use.
Uncomfortable to bring membership card
Hard to recognize meaning of ‘Next’
Need current location information
Satisfaction(S)
dissatisfied dissatisfied neutrality dissatisfied neutrality
Match up with T, I and S
min maxmean2.1 6.13.4 8.4 34.714.7 1.6 5.93.4 3.2 25.913.3 5.3 47.227.2
min maxmean min maxmean min maxmean min maxmean
P17(Age22, F)
Task 1 2 3 4 5
Time(T)
Interview(I)
confused to use
Unaware of return button to back page.Hard to recognize change of exercise change.
Unaware of return button to back page.
Satisfaction(S)
dissatisfied dissatisfied dissatisfied neutrality dissatisfied
Match up with T, I and S
Match up with T, I and S
min maxmean2.1 6.13.4 8.4 34.714.7 1.6 5.93.4 3.2 25.913.3 5.3 47.227.2
min maxmean min maxmean min maxmean min maxmean
P18(Age21, F)
Task 1 2 3 4 5
Time(T)
Interview(I)
Uncomfortable to bring membership card.
Hard to recognize meaning of ‘start exercise’
Uncomfortable to bring membership card.
Need more images and use more big font.
Unaware of return button to back page.
Satisfaction(S)
dissatisfied dissatisfied dissatisfied dissatisfied satisfied
Match up with I and S
discordance between I and S
min maxmean2.1 6.13.4 8.4 34.714.7 1.6 5.93.4 3.2 25.913.3 5.3 47.227.2
min maxmean min maxmean min maxmean min maxmean
Figure16. Comparative Analysis on Qualitative Evaluation and Quantitative Evaluation
Among 18 participants, 5 in Task 4 and 3 in Task 5 participants who have neutral emotional state were
excluded in analysis. In this research, satisfaction ratio was defined as the ratio of cases in which comparison of
qualitative evaluation (I), bio-signal measurement (S) and time result (T). That is for comparison of 3 standards,
subjective evaluation on degree of satisfaction was performed about qualitative analysis and time. Then, the
result was compared with bio-signal measurement result to check for accordance. As a result, Tasks 4 and 5
respectively shows 9 (69.2%) and 11 (73.3%) subjects (Figure 17).
10
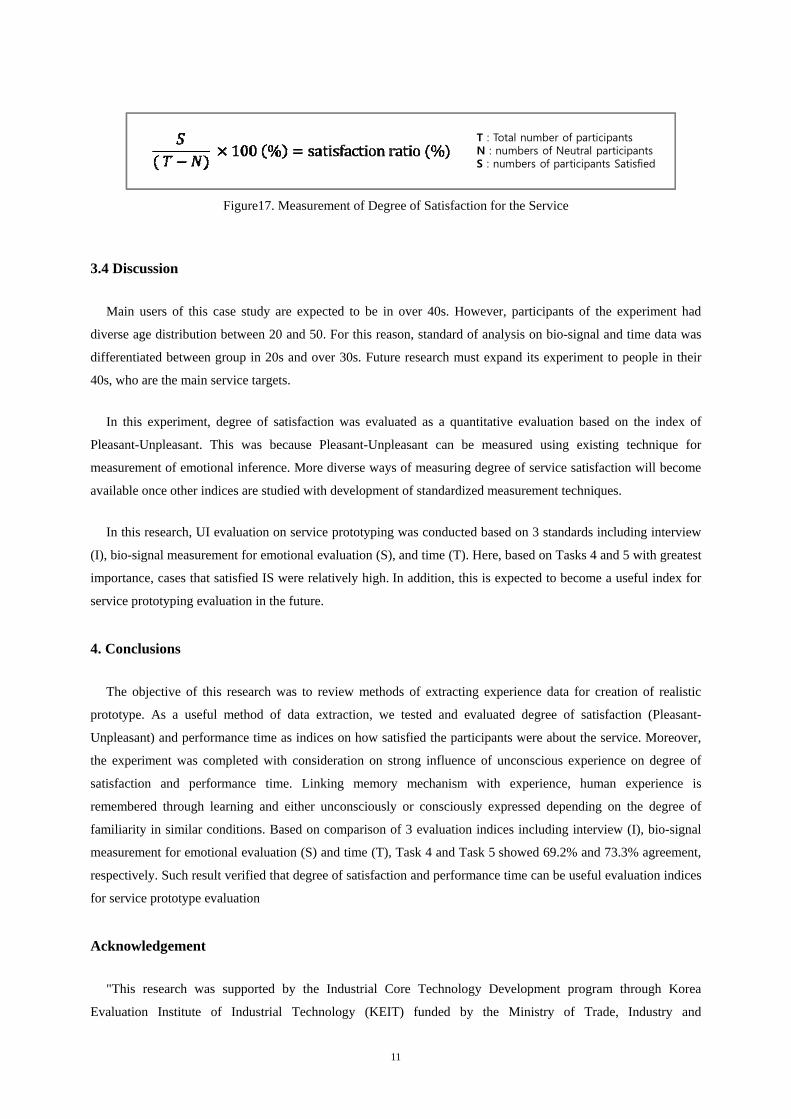
Figure17. Measurement of Degree of Satisfaction for the Service
T : Total number of participantsN : numbers of Neutral participantsS : numbers of participants Satisfied
3.4 Discussion
Main users of this case study are expected to be in over 40s. However, participants of the experiment had
diverse age distribution between 20 and 50. For this reason, standard of analysis on bio-signal and time data was
differentiated between group in 20s and over 30s. Future research must expand its experiment to people in their
40s, who are the main service targets.
In this experiment, degree of satisfaction was evaluated as a quantitative evaluation based on the index of
Pleasant-Unpleasant. This was because Pleasant-Unpleasant can be measured using existing technique for
measurement of emotional inference. More diverse ways of measuring degree of service satisfaction will become
available once other indices are studied with development of standardized measurement techniques.
In this research, UI evaluation on service prototyping was conducted based on 3 standards including interview
(I), bio-signal measurement for emotional evaluation (S), and time (T). Here, based on Tasks 4 and 5 with greatest
importance, cases that satisfied IS were relatively high. In addition, this is expected to become a useful index for
service prototyping evaluation in the future.
4. Conclusions
The objective of this research was to review methods of extracting experience data for creation of realistic
prototype. As a useful method of data extraction, we tested and evaluated degree of satisfaction (Pleasant-
Unpleasant) and performance time as indices on how satisfied the participants were about the service. Moreover,
the experiment was completed with consideration on strong influence of unconscious experience on degree of
satisfaction and performance time. Linking memory mechanism with experience, human experience is
remembered through learning and either unconsciously or consciously expressed depending on the degree of
familiarity in similar conditions. Based on comparison of 3 evaluation indices including interview (I), bio-signal
measurement for emotional evaluation (S) and time (T), Task 4 and Task 5 showed 69.2% and 73.3% agreement,
respectively. Such result verified that degree of satisfaction and performance time can be useful evaluation indices
for service prototype evaluation
Acknowledgement
"This research was supported by the Industrial Core Technology Development program through Korea
Evaluation Institute of Industrial Technology (KEIT) funded by the Ministry of Trade, Industry and
11
12
Energy(No.10043930, "Development of the Service Prototyping Technology based on User Experiences)." and
also "This research was supported by the MSIP(Ministry of Science, ICT and Future Planning), Korea, under the
“IT Consilience Creative Program”(NIPA-2013-H0203-13-1002) supervised by the NIPA(National IT Industry
Promotion Agency)
.
References [1] Joung, G.H. (2004), Imbedded System Prototyping Technique, Korea Information Processing Society,
vol.11no.6 , pp86
[2] Russell, J. A.(1978), "Evidence of convergent validity on the dimensions of affect", Journal of Personality and
Social Psychology, 36, 1152-1168.
[3] Russell, J. A.( 1980), "A description of the affective quality attributed to environments", Journal of Personality
and Social Psychology, 38, 2, 311-322.
[4] Tom Tullis /Bill Albert (2009), Measuring User Experience, Elsevier Korea L.L.C, 97-106
[5] Shostack, L. G. (1982). How to Design a Service, European Journal of Marketing, 16(1), 49-63.
[6] Shostack, L. G. (1984). Design Services that Deliver, Harvard Business Review, (84115), 133-139.
[7] Min Cheol Whang et al.(2001). Effect on Physiological Responses According to Different Arousals, Korea
Society for Emotion and Sensibility, 4(2), 89-93.
[8] Min Cheol Whang et al.(2004). Research on Emotion Evaluation using Autonomic Response, Korea Society
for Emotion and Sensibility , 7(3), 51-56.