grantham briefing paper_cost of capital and investment_feb 2016
TRANSCRIPT

The cost of capital and how it affects climate change mitigation investment
Contents
Grantham Institute Briefing paper No 15January 2016
Grantham Briefing Papers analyse climate change and environmental research linked to work at Imperial, setting it in the context of national and international policy and the future research agenda. This paper and other Grantham publications are available from www.imperial.ac.uk/grantham/publications
DR CHARLES DONOVAN AND CHRISTOPHER CORBISHLEY
Headlines
• The cost of capital, also known as the minimum required rate of return, is a crucial factor in investment decision-making in the private sector.
• Assumptions made by government policymakers about cost of capital in the private sector often turn out to be wrong. These errors arise because the cost of capital amongst firms is highly disparate and nearly impossible to estimate precisely.
• Cost of capital estimation errors have resulted in substantial economic welfare losses. Recent examples suggest that when governments take proper account of the cost of capital as an investment decision variable, outcomes for both the public and private sector are vastly improved.
• As the cost of capital for private sector investors is driven by risk perceptions, reducing investment risk is of paramount importance for governments seeking to minimize taxpayer support for new low-carbon infrastructure.
Introduction
Combatting climate change will require a transformation of investment patterns in the energy sector. Governmental efforts are being made amidst a difficult transition in energy markets during which private companies have progressively replaced state-owned enterprises as principal investors.
In the United Kingdom, for example, 25 years ago electricity was generated, distributed and sold exclusively by government entities. Today, government bodies no longer invest in the electricity supply chain, having been replaced by a host of shareholder-driven investors, including corporations, investment banks and private equity firms. With some notable exceptions, there has been a global shift in the role of government from investor to market regulator1. Nowhere is this change more evident than in clean and renewable energy, which is comprised, with few exceptions, of firms generating profits for shareholders.
Last year was a watershed moment in the renewable energy industry’s short history. Total global investment in renewables came within striking distance of the amount invested in fossil-fuel power and the uptake of renewables in developing countries reached an all-time high. It was a particularly remarkable year for solar photovoltaic (PV) technology, as the cost of solar electricity generation became cheaper than the retail price of electricity in many regions around the world. It is hard to imagine how these accomplishments could have been made without the competitive forces and ingenuity of the private sector.
Introduction . . . . . . . . . . . . . . . . . . . . . . . . . . . . 1
Estimating the cost of capital . . . . . . . . . . 3
How the cost of capital varies and why it matters. . . . . . . . . . . . . . . . . . . . . . 7
Challenges and opportunities for policymakers . . . . . . . . . . . . . . . . . . . . . .10
Conclusions . . . . . . . . . . . . . . . . . . . . . . . . . . .12
References . . . . . . . . . . . . . . . . . . . . . . . . . . . . . 13
About the authors . . . . . . . . . . . . . . . . . . . . . 16
Imperial College London Grantham Institute
2 The cost of capital and how it affects climate change mitigation investmentBriefing paper No 15 January 2016
Yet, the current system is far from perfect. In a myriad of ways, governments act to influence the price of energy to consumers and enhance welfare benefits to society at large. These interventions include not only subsidies, but also tax policies, accounting standards, and grant programs. As regulators, the recurring question for governments is how much support is needed. Framed in purely economic terms the question is one of efficiency; that is, ‘what is the minimum level of incentive required to trigger investment by the private sector?’ Unfortunately, recent history indicates that regulators are not equipped with sufficiently accurate models to answer this question.
Over the coming decades, governments will seek to influence trillions of dollars of annual investment decisions in order to mitigate the effects of climate change. In aggregate, the incremental investment required to limit warming to 2°C above pre-industrial levels has been estimated to be just shy of US$1 trillion per year2. That is a trillion dollars of investment that may or may not be made, based on decisions taken by a diverse investment community spread across financial capitals all over the world.
While many parameters of these investment decisions, are known to both firms and governments policymakers are often ill-informed about the most important decision input: the cost
of capital. Despite its importance, the cost of capital is generally poorly understood by non-finance specialists. The objective of this paper is to shed light on this important issue by exploring how businesses estimate their cost of capital, a crucial determinant in investment choices.
This briefing note is divided into three sections. The first section presents an overview of cost of capital and the estimation methods used within shareholder-driven companies, highlighting important differences between theory and practice. Section two investigates how the cost of capital varies by technology and by country. Finally in section three, we describe how investment policies can be improved in light of these complexities.
Risk and return as measured by governments: The discount rateMitigation efforts on the scale required for climate stabilization will, by and large, depend upon investments made by the private sector, which makes investment decisions based on market-oriented rates of return. Yet public economic appraisals must also assess actions taken now against their possible consequences in future.
Box 1: Two climate change mitigation technologies explainedSolar PV
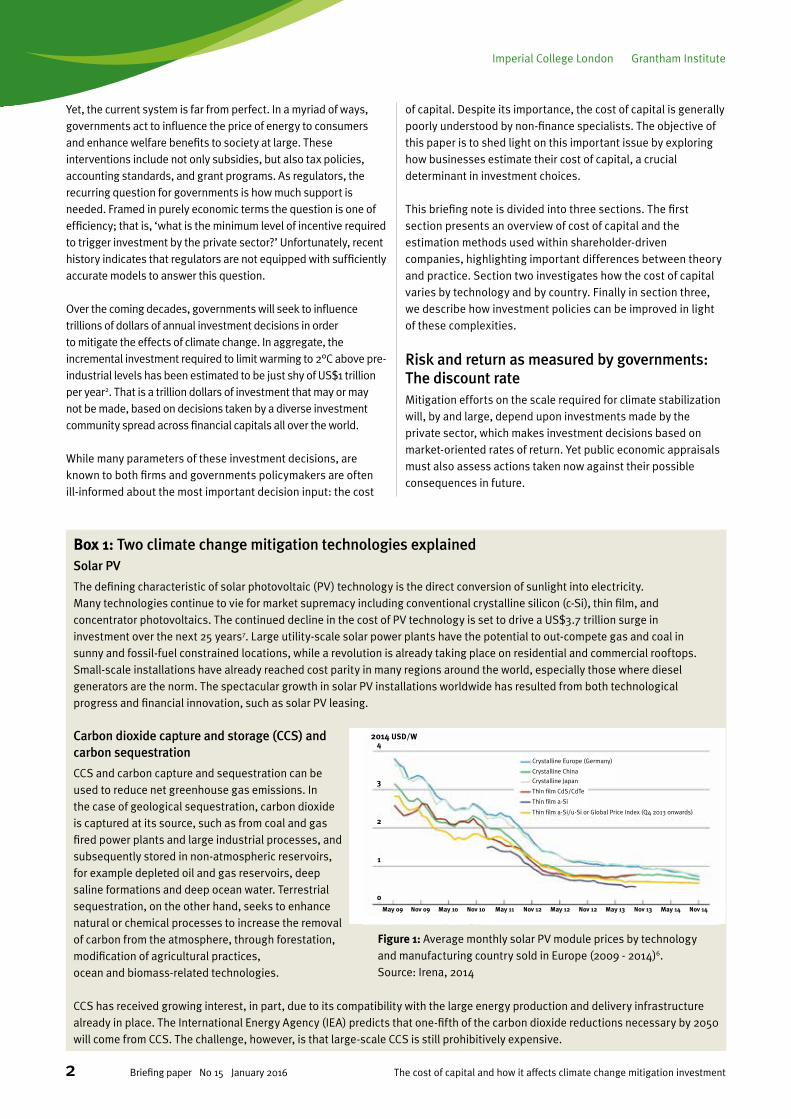
The defining characteristic of solar photovoltaic (PV) technology is the direct conversion of sunlight into electricity. Many technologies continue to vie for market supremacy including conventional crystalline silicon (c-Si), thin film, and concentrator photovoltaics. The continued decline in the cost of PV technology is set to drive a US$3.7 trillion surge in investment over the next 25 years7. Large utility-scale solar power plants have the potential to out-compete gas and coal in sunny and fossil-fuel constrained locations, while a revolution is already taking place on residential and commercial rooftops. Small-scale installations have already reached cost parity in many regions around the world, especially those where diesel generators are the norm. The spectacular growth in solar PV installations worldwide has resulted from both technological progress and financial innovation, such as solar PV leasing.
Carbon dioxide capture and storage (CCS) and carbon sequestration
CCS and carbon capture and sequestration can be used to reduce net greenhouse gas emissions. In the case of geological sequestration, carbon dioxide is captured at its source, such as from coal and gas fired power plants and large industrial processes, and subsequently stored in non-atmospheric reservoirs, for example depleted oil and gas reservoirs, deep saline formations and deep ocean water. Terrestrial sequestration, on the other hand, seeks to enhance natural or chemical processes to increase the removal of carbon from the atmosphere, through forestation, modification of agricultural practices, ocean and biomass-related technologies.
CCS has received growing interest, in part, due to its compatibility with the large energy production and delivery infrastructure already in place. The International Energy Agency (IEA) predicts that one-fifth of the carbon dioxide reductions necessary by 2050 will come from CCS. The challenge, however, is that large-scale CCS is still prohibitively expensive.
Figure 1: Average monthly solar PV module prices by technology and manufacturing country sold in Europe (2009 to 2014)!
Source: Irena, 2014!
Crystalline Europe (Germany)
2014 USD/W
Carbon dioxide capture and storage (CCS) and carbon sequestration
4
3
2
1
0May 09 Nov 09 May 10 Nov 10 May 11 Nov 12 May 12 Nov 12 May 13 Nov 13 May 14 Nov 14
Crystalline China
Crystalline Japan
Thin film CdS/CdTe
Thin film a-Si
Thin film a-Si/u-Si or Global Price Index (Q4 2013 onwards)
Figure 1: Average monthly solar PV module prices by technology and manufacturing country sold in Europe (2009 - 2014)6. Source: Irena, 2014

Grantham Institute Imperial College London
3The cost of capital and how it affects climate change mitigation investment Briefing paper No 15 January 2016
In the field of public policy, the discount rate is a crucial input to sound decision-making. Governments acting as investors in important public goods such as health and education must consider the cost and benefits of potential investments by conducting inter-temporal valuations. That is, as future costs and benefits to society typically span many decades, they must be made equivalent to costs and benefits today. Alongside cost-benefit analysis, the single parameter that captures the range of motives underlying inter-temporal choice is the discount rate3.
Given the scale of costs and benefits and the time horizon involved, the perceived wisdom of climate change mitigation is highly dependent upon the discount rate employed. The Stern Review on Climate Change kicked-off an important debate about the discount rate for climate change mitigation investments, bringing a traditionally obscure topic under public scrutiny. The fundamental tension in this debate is whether the discount rate should be derived from a social rate of time preference4 or observed from market rates5.
Private sector investment decision-makingFirms look at a range of possible returns across multiple projects before deciding whether to proceed with an investment. These decisions are based on an assessment of the relative risk and return and how the new investment fits within their existing portfolio. Valuation methods differ according to the asset class being analysed as well as investor sophistication.
The most widely-used criteria for investment decision-making are the net present value (NPV) and internal rate of return (IRR) decision rules. They are often referred to separately but they are in fact variations on an identical premise: an investment project should be undertaken only when the project generates a total financial return greater than the cost of funding it.
In the NPV rule, total financial return is represented by the sum of all project cash flows, discounted by the cost of capital. Using the IRR rule, the cost of capital is compared directly to the annualised percentage gain on capital invested. The common denominator in both methods is the opportunity cost of capital ascribed to the project.
Many companies adopt a third valuation method known as the payback period (PBP), which divides the cost of the project by the annual cash flows to determine the number of years it takes to offset the initial capital outlay. The drawback of this technique is its failure to account for the opportunity cost of capital (the return rate achievable from a similar project or asset class).
Net present value (NPV)
Internal rate of return (IRR)
Payback period (PBP)
Estimating the cost of capital
The basic and uncontroversial starting point for understanding the cost of capital is to recognize a positive relationship between risk and required financial return. Higher levels of risk lead to increases in the cost of capital. The stylized relationship between risk and the cost of capital and an indicative positioning of generic types of investments along this continuum is shown in Figure 2.
Financial return is expressed numerically as a percentage and there is little need for additional interpretation of its meaning. Risk, on the other hand, is not so easy. In fact, defining risk has been the lifelong obsession of numerous mathematicians, philosophers and economists and is a task that has consumed the attention of some of the world’s greatest thinkers for more than a century8.
Here, we take a practical approach to risk. A good way to understand the risk of investing in real assets, for example wind farms, is to consider the capital structure of a typical investment project. The capital structure describes the proportions of debt and equity that will be used as sources of funding for the project. Within a single investment project, equity financing will always be more expensive than debt financing. The reason for this difference is that providers of debt capital (lenders) have a primary claim on the assets of the company, while the providers of equity capital (shareholders) have a residual claim. The ranking of legal rights between shareholders and lenders is founded on the premise that the firm’s shareholders possess greater knowledge and control over the business and should therefore bear greater risk. But to fully appreciate the higher level of risk faced by shareholders, one must consider what happens when things go wrong.

Imperial College London Grantham Institute
4 The cost of capital and how it affects climate change mitigation investmentBriefing paper No 15 January 2016
UK Gilt 10 year 1.86%
UG Gilt 30 year 2.59%
FTSE100 10 year average
(9.04%)
Energy production
(contracted) (4-7%)
UK PFI average return (4-5%)
Toll highways (Greenfield)
after leverage (12-20%)
Airports/ seaports after
leverage (15-18%)
* Expected risk is defined by the risk scores assigned to assets by banks and rating agencies. ** Expected return is defined as the average annual return. Source: Bloomberg, UKT&I, Hargreaves Lansdowne & JP Morgan
Expected return**
Expe
cted
risk
*
Average UK corporate
bonds (3.39%)
UK Solar Funds (6%)
UK off-shore wind projects
(10-15%)
Expe
cted
ris
k*
Expected return**
Figure 2: Illustration of risk-return profiles among private investors in renewable energy.
* Expected risk is defined by the risk scores assigned to assets by banks and rating agencies. ** Expected return is defined as average annual return. Source: Bloomberg, UKT&I, Hargreaves Lansdowne, JP Morgan.
Box 2: What’s in a name?Although the term ‘cost of equity’ is used frequently by both finance academics and practitioners, it is more accurately called the ‘expected return on equity’. While it’s a slight change of wording, the quibble is more than semantics. The rate of return on equity is fundamentally uncertain, due to the nature of financial gains to shareholders. Unlike a loan, the timing and amount of future payments to be received are uncertain and cannot be known in advance.
Ultimately, the rate of return anticipated by equity investors is a subjective set of expectations regarding the future; most importantly expectations about the future value of the venture. Furthermore, payments to shareholders are not tax-deductible, as are interest payments. It is, therefore, inaccurate and potentially misleading to describe the expected return on equity as a cost9. Nonetheless, it is now an accepted convention to use the ‘cost of equity’ interchangeably with ‘expected return on equity’.
WACC =
CAPM =
DebtDebt + Equity
EquityDebt + Equity [rdebt(1–T )] + requity
requity = rfree + ß (rmarket – rfree)
Grantham Institute Imperial College London
5The cost of capital and how it affects climate change mitigation investment Briefing paper No 15 January 2016
In the normal course of operating a company, debt is repaid in fixed instalments via interest and principal payments. Equity may be compensated through dividends, but in most cases the bulk of the financial reward will be earned through capital appreciation (an increase in the market value of the project company). When a project company becomes distressed, dividends come to a halt. Debt repayments, on the other hand, must continue. In the worst case, bankruptcy, a lender (debt) sits alongside employees, suppliers and other creditors to recover payments in a liquidation process. Shareholders (equity) are at the back of the queue and typically lose everything.
The threat of bankruptcy fundamentally shapes the risk faced by providers of debt and equity capital, and hence their required rate of return to invest. We now turn to a more technical description of the cost of capital for a new investment project.
Translating risk and return into the cost of capital As mentioned previously, the cost of capital is determined by the project’s capital structure. In corporate finance, the cost of capital is more precisely defined as the weighted average cost of capital (WACC), as in the equation below:
The cost of debt is simply the all-in rate of interest on company loans. The cost of equity, on the other hand, is a challenging, controversial, and frequently frustrating aspect of the WACC calculation.
Two of the most well-known methods for calculating the expected return on equity are the capital asset pricing model (CAPM)10 and arbitrage pricing theory (APT)11.
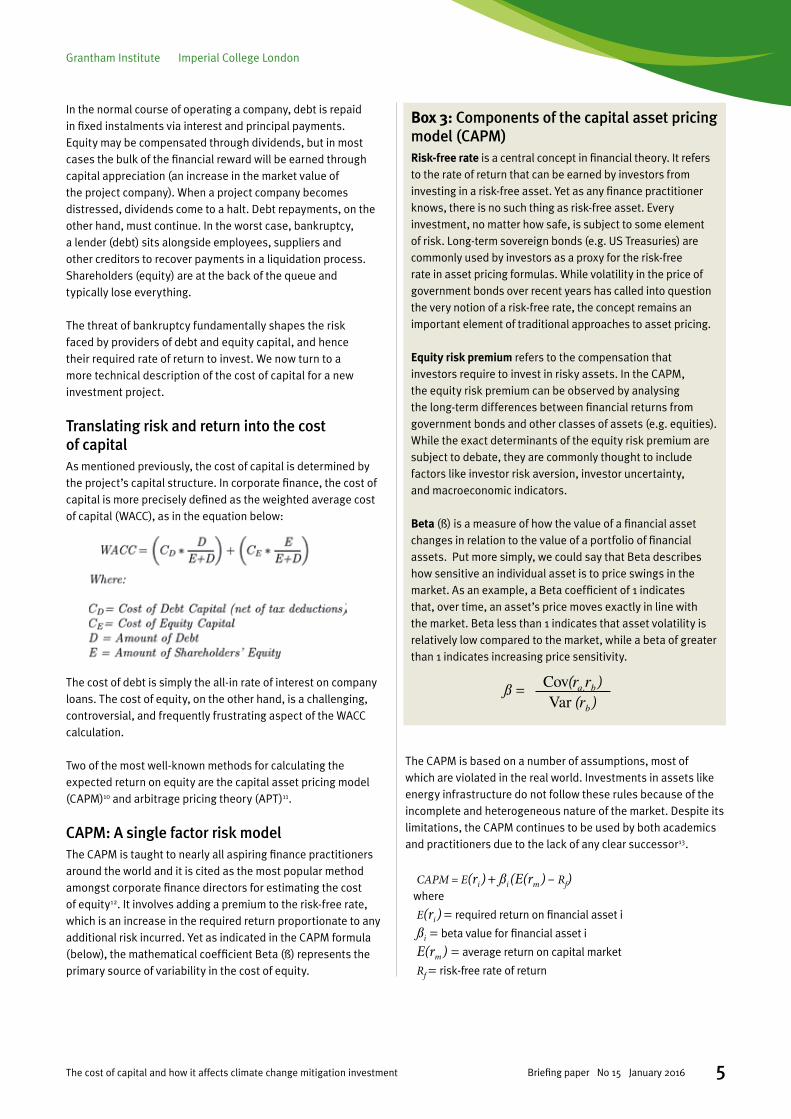
CAPM: A single factor risk modelThe CAPM is taught to nearly all aspiring finance practitioners around the world and it is cited as the most popular method amongst corporate finance directors for estimating the cost of equity12. It involves adding a premium to the risk-free rate, which is an increase in the required return proportionate to any additional risk incurred. Yet as indicated in the CAPM formula (below), the mathematical coefficient Beta (ß) represents the primary source of variability in the cost of equity.
The CAPM is based on a number of assumptions, most of which are violated in the real world. Investments in assets like energy infrastructure do not follow these rules because of the incomplete and heterogeneous nature of the market. Despite its limitations, the CAPM continues to be used by both academics and practitioners due to the lack of any clear successor13.
CAPM = E(ri) + ßi (E(rm) – Rf) where E(ri) = required return on financial asset i
ßi = beta value for financial asset i
E(rm) = average return on capital market
Rf = risk-free rate of return
Box 3: Components of the capital asset pricing model (CAPM)Risk-free rate is a central concept in financial theory. It refers to the rate of return that can be earned by investors from investing in a risk-free asset. Yet as any finance practitioner knows, there is no such thing as risk-free asset. Every investment, no matter how safe, is subject to some element of risk. Long-term sovereign bonds (e.g. US Treasuries) are commonly used by investors as a proxy for the risk-free rate in asset pricing formulas. While volatility in the price of government bonds over recent years has called into question the very notion of a risk-free rate, the concept remains an important element of traditional approaches to asset pricing.
Equity risk premium refers to the compensation that investors require to invest in risky assets. In the CAPM, the equity risk premium can be observed by analysing the long-term differences between financial returns from government bonds and other classes of assets (e.g. equities). While the exact determinants of the equity risk premium are subject to debate, they are commonly thought to include factors like investor risk aversion, investor uncertainty, and macroeconomic indicators.
Beta (ß) is a measure of how the value of a financial asset changes in relation to the value of a portfolio of financial assets. Put more simply, we could say that Beta describes how sensitive an individual asset is to price swings in the market. As an example, a Beta coefficient of 1 indicates that, over time, an asset’s price moves exactly in line with the market. Beta less than 1 indicates that asset volatility is relatively low compared to the market, while a beta of greater than 1 indicates increasing price sensitivity.
ß = Cov(ra,rb)Var (rb)

Imperial College London Grantham Institute
6 The cost of capital and how it affects climate change mitigation investmentBriefing paper No 15 January 2016
APT: A multi-factor risk modelIn contrast to the CAPM, APT holds that discount rates are a function of multiple risk factors. Using CAPM, investment risk varies according to just a single ß term, whereas arbitrage pricing theory places no restrictions on the number of risk factors to be used.
APT = Ri = ai + yi1 F1 + yi2 F2 + ... + yin + εi where Ri = return on stock i
ai = expected return on stock i (if all factors have a value of zero)
F1 = value of jth factor (which influences the return on stock i)
yin = sensitivity of stock i’s return to the jth factor
εi = random error term
The factors of an APT asset pricing model may include generic macro-economic indicators such as government bond rates, oil prices and various forms of inflation, as well as asset-specific risk indicators, such as liquidity. APT allows greater analyst discretion in representing the complexity of the real world of investing. This analytical discretion does, however, come with a cost – namely the loss of simplicity, replicability and standardisation.
There are a mindboggling number of models that seek to improve upon the CAPM and APT, not to mention emerging competitors to it14. But no matter what approach one takes to calculating the cost of equity, the basic analytical challenge remains the same. The task is first to measure risk, and secondly, to decide whether the expected financial return compensates sufficiently.
The gap between theory and practiceEmpirical surveys of US and European companies indicate that corporate WACCs are generally in the range of 7-8%. Analysis of companies in the energy and natural resources sector shows the industry WACC over the past 10 years to be mostly the same15. These figures appear to confirm the results of theory-driven asset pricing models.
A substantial divergence between theory and practice opens up, however, with regards to the cost of capital for specific project investments. Empirical analyses have demonstrated that large, stock-market-listed companies apply investment hurdle rates that exceed their WACC by as much as 750 basis points (7.5%)16. Over the past 20 years, the average hurdle rate employed by large US corporations has been stable at roughly 15%17, nearly double the average corporate WACC.
Alongside the evidence that firms overstate hurdle rates during internal project valuations, it appears that firms frequently understate them as well. In one well known study, more than half of chief financial officers (CFOs) in a sample were routinely adjusting the financial value ascribed to ‘strategic projects’ by using a lower hurdle rate or increasing the project NPV.18 Recent research on the German power-generation industry found firms were doing the same. The investigators found that firms were using lower hurdle rates for sensible reasons such as securing competitive resources and leveraging existing complementary assets19. Another study, this time covering more than 3,000 businesses in North America found that hurdle rates were both frequently below and also frequently above their WACC20.
With all this evidence for and against, we pause to ask: Too much, too little, or just right? Which of these stories about investment hurdle rates should we believe?
Investment hurdle ratesStudies demonstrating upward and downward biases in hurdle rates can be drawn into a single conclusion: an investment hurdle rate (the minimum IRR required for project sanction) often bears little resemblance to the WACC.
When projects present differing levels of risk, as most real-life investment prospects do, the project discount rate should be adjusted accordingly21. The riskier a project’s cash flows become, the higher the rate of return should be. As shown in Figure 322, by assigning a project-specific cost of capital to each investment, firms seek to overcome the potential errors of capital misallocation.
Error region 1:Reject low risk project
Safe Project A(e.g. solar PV with
feed-in tariff )
Project risk
Rate
of r
etur
n (%
)
Error region 2:Accept high risk project
Project-specificcost of capital
Uniform company-widecost of capital
Risky Project B(e.g. combined cycle
gas turbines)
Figure 3: The relationship between company-wide and project specific cost of capital. Source: Helms et al, 2015

Grantham Institute Imperial College London
7The cost of capital and how it affects climate change mitigation investment Briefing paper No 15 January 2016
In theory, firms can avoid the errors of over- and under-investment by adopting a risk-adjusted discount rate for each new investment opportunity.
In practice, many firms make adjustments to the evaluation of specific projects in order to take account of risk. But they often do so haphazardly. We see four reasons for this behaviour:
1. The crystal ball factor
A firm that faithfully follows the edicts of financial theory will quickly run into information roadblocks. The standard advice in setting risk-adjusted discount rates, to re-calibrate ß, is often useless in emerging economic sectors. It is nearly impossible to make an objective assessment of risk when there is limited historical transaction data and few comparable companies. In instances where track records are limited and the rate of technological change is highly discontinuous, historical data will offer no guidance in the task of adjusting discount rates.
2. The diverse company factor
A second source of divergence is that many firms use cost of capital estimates that are tailored to specific business divisions and/or geographical units23. Even a good WACC estimate for the company as a whole may be of little use to understanding the hurdle rates demanded on investments outside the company’s home country or in new technological areas.
3. The diverse industries factor
Investors from specific industries approach the task of capital budgeting in a way that conforms to the norms of their industry24. Consider Google (a US technology company), Iberdrola (a European electric utility) and Temasek (an Asian financial institution), who are all investors in clean energy in the United States. The capital budgeting procedures each firm uses may be similar to those of competitors in their typical industry, but end up being very different from each other.
4. The sophistication factor
Finally, many firms don’t use the asset pricing advocated by financial theorists at all. A recent review of past cost of capital surveys found that between 25% and 75% of companies don’t use the CAPM for their cost of equity calculation; as many as half don’t even calculate a WACC25. Generally, larger companies with stock market listings tend to follow the textbook advice. Smaller, privately-held companies do not.
How the cost of capital varies and why it matters
In global capital markets, the differences in firms’ capital budgeting policies, on aggregate, don’t affect the price of traded securities. But in real asset markets, these differences matter enormously – not least to policymakers seeking to set price-based incentives, such as feed-in tariffs. The anomalies of asset pricing tend to garner little attention outside academic circles but for investments in climate change mitigation it is of considerable importance to governments, investors and taxpayers. This is due to the potential for discrepancies in cost of capital estimations to negatively impact both producer surplus (electricity producer profit) and consumer surplus (the difference between the price paid for electricity and the price a consumer would have been willing to pay). These impacts on producer and consumer surplus have the potential to translate into significant social and economic welfare losses.
Building upon our previous discussion, we consider in this section how the standard model of investment decision-making is complicated by technology and by geography.
Median
LCO
E (U
SD/M
Wh)
160
140
120
100
80
60
40
20
0
3%
CCGT Coal Nuclear CCGT Coal Nuclear CCGT Coal Nuclear
7% 10%
Figure 4: LCOE ranges for baseload technologies at 3%, 7% and 10% discount rates. Source: IEA 2015
Imperial College London Grantham Institute
8 The cost of capital and how it affects climate change mitigation investmentBriefing paper No 15 January 2016
Variations by technology: The impact of cost of capital on the levelised cost of electricityThe levelised cost of electricity (LCOE) is a calculation used frequently by policymakers to make an ‘apples for apples’ comparison of the economic performance of different energy technologies. LCOE depends heavily on the discount rate employed.
A recent report by the International Energy Agency (IEA) illustrates how discount rates affect LCOE estimates for three base-load technologies: natural gas-fired closed-cycle-gas-turbines, coal and nuclear26. The results are reproduced in Figure 4.
Solar PV
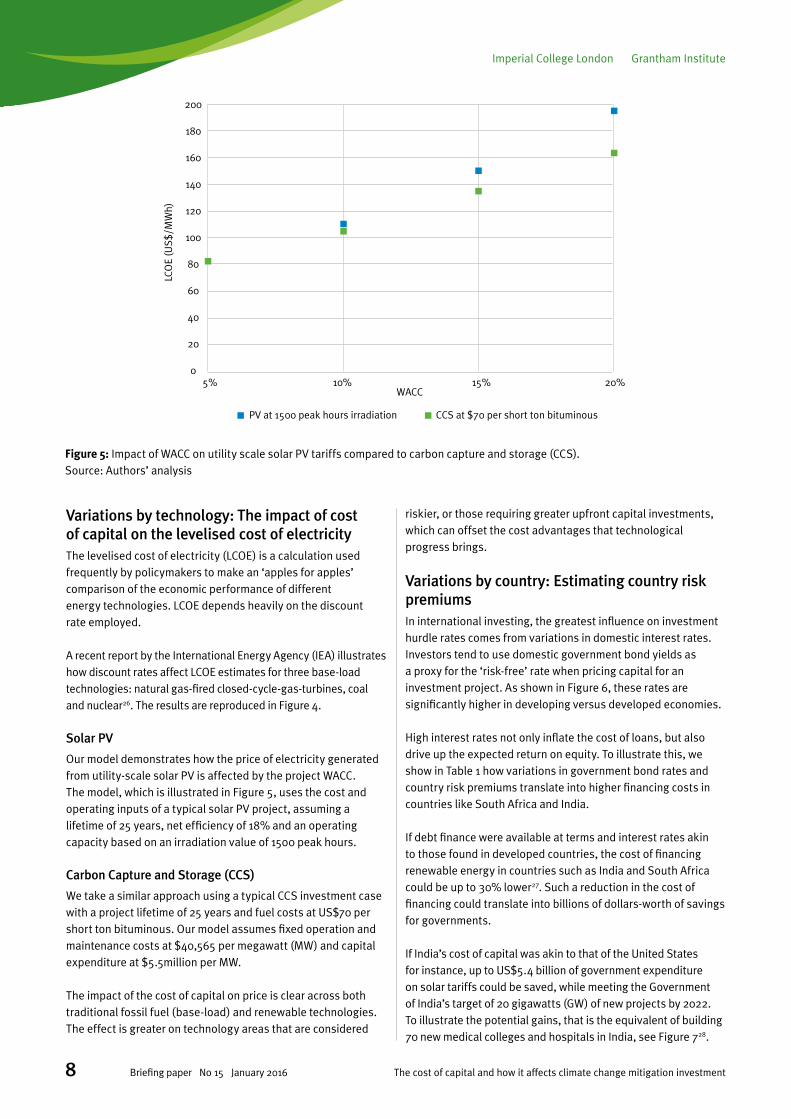
Our model demonstrates how the price of electricity generated from utility-scale solar PV is affected by the project WACC. The model, which is illustrated in Figure 5, uses the cost and operating inputs of a typical solar PV project, assuming a lifetime of 25 years, net efficiency of 18% and an operating capacity based on an irradiation value of 1500 peak hours.
Carbon Capture and Storage (CCS)
We take a similar approach using a typical CCS investment case with a project lifetime of 25 years and fuel costs at US$70 per short ton bituminous. Our model assumes fixed operation and maintenance costs at $40,565 per megawatt (MW) and capital expenditure at $5.5million per MW.
The impact of the cost of capital on price is clear across both traditional fossil fuel (base-load) and renewable technologies. The effect is greater on technology areas that are considered
riskier, or those requiring greater upfront capital investments, which can offset the cost advantages that technological progress brings.
Variations by country: Estimating country risk premiumsIn international investing, the greatest influence on investment hurdle rates comes from variations in domestic interest rates. Investors tend to use domestic government bond yields as a proxy for the ‘risk-free’ rate when pricing capital for an investment project. As shown in Figure 6, these rates are significantly higher in developing versus developed economies.
High interest rates not only inflate the cost of loans, but also drive up the expected return on equity. To illustrate this, we show in Table 1 how variations in government bond rates and country risk premiums translate into higher financing costs in countries like South Africa and India.
If debt finance were available at terms and interest rates akin to those found in developed countries, the cost of financing renewable energy in countries such as India and South Africa could be up to 30% lower27. Such a reduction in the cost of financing could translate into billions of dollars-worth of savings for governments.
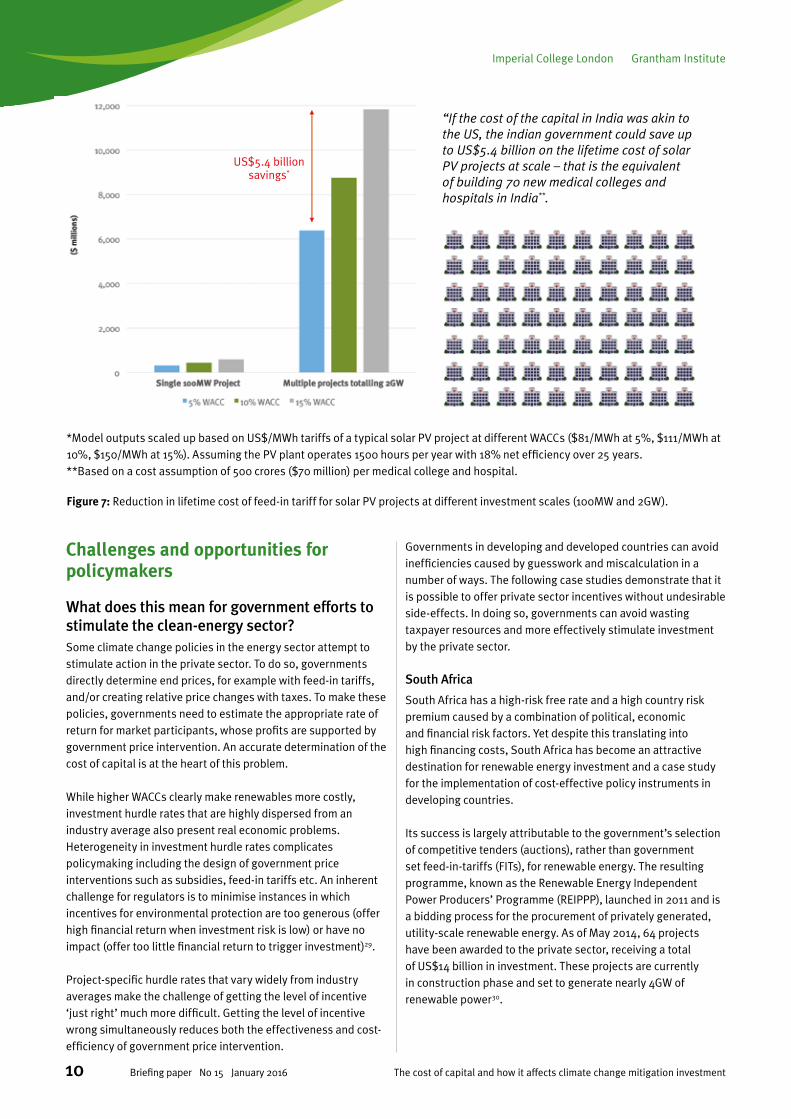
If India’s cost of capital was akin to that of the United States for instance, up to US$5.4 billion of government expenditure on solar tariffs could be saved, while meeting the Government of India’s target of 20 gigawatts (GW) of new projects by 2022. To illustrate the potential gains, that is the equivalent of building 70 new medical colleges and hospitals in India, see Figure 728.
LCO
E (U
S$/M
Wh)
200
180
160
140
120
100
80
60
40
20
0
PV at 1500 peak hours irradiation CCS at $70 per short ton bituminous
5% 10% 15% 20%WACC
Figure 5: Impact of WACC on utility scale solar PV tariffs compared to carbon capture and storage (CCS). Source: Authors’ analysis

Grantham Institute Imperial College London
9The cost of capital and how it affects climate change mitigation investment Briefing paper No 15 January 2016
Figure 6: Historical yields on 10 year government bonds 2007-2015 (%). Source: DataStream
2007 2008 2009 2010 2011 2012 2013 2014 2015
South AfricaBrazilIndiaUKUSGermany
Yiel
d on
10Y
R G
ovt B
ond
(%)
20
15
10
5
0
20
15
10
5
0
Table 1: Impact of country risk premium on WACC in four countries
Country UK US India South Africa
Risk-free rate (based on 10Y government bond yield 01.09.15)
1.91% 2.41% 8.56% 8.52%
Assumed spread on loans 2.50% 2.50% 2.50% 2.50%
Cost of debt 4.41% 4.91% 11.06% 11.02%
Total equity risk premium (including default spread and country beta)*
6.20% 5.75% 9.13% 8.75%
Cost of Equity 8.11% 8.16% 17.69% 17.27%
Assumed debt-to-equity ratio 70% 70% 70% 70%
Marginal tax rate** 20% 40% 35% 28%
WACC 8% 6% 14% 15%
*Country risk premium based on data inputs provided by Damodaran, 201427. **Corporate tax rate according to KPMG, 2015.
Imperial College London Grantham Institute
10 The cost of capital and how it affects climate change mitigation investmentBriefing paper No 15 January 2016
Challenges and opportunities for policymakers
What does this mean for government efforts to stimulate the clean-energy sector?Some climate change policies in the energy sector attempt to stimulate action in the private sector. To do so, governments directly determine end prices, for example with feed-in tariffs, and/or creating relative price changes with taxes. To make these policies, governments need to estimate the appropriate rate of return for market participants, whose profits are supported by government price intervention. An accurate determination of the cost of capital is at the heart of this problem.
While higher WACCs clearly make renewables more costly, investment hurdle rates that are highly dispersed from an industry average also present real economic problems. Heterogeneity in investment hurdle rates complicates policymaking including the design of government price interventions such as subsidies, feed-in tariffs etc. An inherent challenge for regulators is to minimise instances in which incentives for environmental protection are too generous (offer high financial return when investment risk is low) or have no impact (offer too little financial return to trigger investment)29.
Project-specific hurdle rates that vary widely from industry averages make the challenge of getting the level of incentive ‘just right’ much more difficult. Getting the level of incentive wrong simultaneously reduces both the effectiveness and cost-efficiency of government price intervention.
Governments in developing and developed countries can avoid inefficiencies caused by guesswork and miscalculation in a number of ways. The following case studies demonstrate that it is possible to offer private sector incentives without undesirable side-effects. In doing so, governments can avoid wasting taxpayer resources and more effectively stimulate investment by the private sector.
South Africa
South Africa has a high-risk free rate and a high country risk premium caused by a combination of political, economic and financial risk factors. Yet despite this translating into high financing costs, South Africa has become an attractive destination for renewable energy investment and a case study for the implementation of cost-effective policy instruments in developing countries.
Its success is largely attributable to the government’s selection of competitive tenders (auctions), rather than government set feed-in-tariffs (FITs), for renewable energy. The resulting programme, known as the Renewable Energy Independent Power Producers’ Programme (REIPPP), launched in 2011 and is a bidding process for the procurement of privately generated, utility-scale renewable energy. As of May 2014, 64 projects have been awarded to the private sector, receiving a total of US$14 billion in investment. These projects are currently in construction phase and set to generate nearly 4GW of renewable power30.
Figure 7: Reduction in lifetime cost of feed-in tariff for solar PV projects at different investment scales (100MW and 2GW).
*Model outputs scaled up based on US$/MWh tariffs of a typical solar PV project at different WACCs ($81/MWh at 5%, $111/MWh at 10%, $150/MWh at 15%). Assuming the PV plant operates 1500 hours per year with 18% net efficiency over 25 years. **Based on a cost assumption of 500 crores ($70 million) per medical college and hospital.
“If the cost of the capital in India was akin to the US, the indian government could save up to US$5.4 billion on the lifetime cost of solar PV projects at scale – that is the equivalent of building 70 new medical colleges and hospitals in India**.
US$5.4 billion savings*

Grantham Institute Imperial College London
11The cost of capital and how it affects climate change mitigation investment Briefing paper No 15 January 2016
The first three rounds attracted a range of domestic and international project developers, sponsors and shareholders, comprising over 100 different shareholder entities. Private sector investors have included banks, insurers, Development Finance Institutions (DFI) and even international utilities. Most remarkably 86% of debt has been raised from within South Africa. This suggests high financing costs can be mitigated through clever policy-interventions targeting debt cost-reductions, mitigating the country risk premiums factored in by international investors.
United Kingdom
The UK’s experience as a laboratory for energy policy over the past decade demonstrates the importance of a clear and effective pricing structure. The Renewables Obligation (RO) scheme launched in 2002 was a variable-price instrument. After setting annual targets for the total amount of renewable power to be generated, the value of price incentives (Renewables Obligation Certificates, or ROCs) could move up or down depending upon the supply of new renewables. Build too little (relative to the target), and the price would go up; build too much and the price would go down.
While seemingly perfect to economists, from a financial perspective the RO was highly problematic. In short, the quasi-market created by government generated too much uncertainty for investors. Due to their inability to accurately forecast ROC prices or hedge their exposure to ROC price volatility, investment hurdle rates naturally increased to reflect the risk. In the end, it was mostly large companies able to finance from their balance sheet (and being obliged to buy ROCs anyway) that could bring forward funding.
Comparing the results of the RO in the UK to the experience with fixed-price feed-in tariffs in Germany has revealed how variable price mechanisms introduce more risk to investors, thereby driving up the cost of capital for new investment projects31. Learning from the RO, the UK introduced in its Energy Act 2013 a new system of Contracts for Difference (CfDs). CfDs are long-term contracts intended to provide more stable and predictable incentives for companies to invest in low-carbon generation. Despite criticism regarding the introduction of the new system, there have been clear positive effects on reducing the risk profile, and subsequently the investment hurdle rates, for low carbon technologies32.
*UK Non-Fossil Fuel Obligation Renewable Energy Auction**Jawaharlal Nehru National Solar Mission***Using the Gujarat feed in tariff as the baseline, the tariff reduction achieved is 3.3%Using CFRC’s benchmark tariff as the baseline, the tariff reduction is 32.3%Source: World Bank, GERC, MNRE, Panchabuta, Economic Times, KREDL, Re-Solve.EfficientCarbon, IFC, IRENA, ANEEL, GWFC
UK NFFO RE* Auction 1998
S Africa Wind Auction 2012
Brazil Wind Auction 2010
Brazil Wind Auction 2009
S Africa Wind Auction 2011
UK NFFO RE Auction 1997
UK NFFO RE Auction 1994
WINDSOMEWHATSUCCESSFUL
HIGHLYSUCCESSFUL
SUCCESSFUL
SOLARS Africa Solar PV 2012
Karnataka Solar PV 2011
India JNNSM Solar PV 2011
S Africa Solar PV 2011
Madhya Pradesh Solar PV 2011
Karnataka Solar PV 2013
Tamil Nadu Solar PV 2012
Andhra Pradesh Solar PV 2013
Uttar Pradesh Solar PV 2013
India JNNSM** Solar PV 2010***
0 10 20 30 40 50 60%tariff
reduction from
FiT
Figure 8: Cost effectiveness of auctions (as % tariff reduction from feed-in tariffs). Source: Shrimali, Konda, Farooquee and Nelson, 2015
Imperial College London Grantham Institute
12 The cost of capital and how it affects climate change mitigation investmentBriefing paper No 15 January 2016
India
As part of its ambitious renewable energy goals, India is aiming for 20GW of solar by 2022 and 31GW of wind by 2017. Once considered audacious, those targets are now looking very achievable given that India has recorded some of the lowest prices in the world for solar energy in 201533. Indeed, India now ranks amongst the most important producers of renewable technologies worldwide and its experience has demonstrated that policy can play a major role in developing renewable energy markets.
As in South Africa, auctions are at the heart of India’s success. As a policy mechanism, auctions offer regulators an opportunity to sidestep the guesswork involved in integrating the cost of capital into feed-in tariffs. Instead, by inviting the private sector into the bidding process, they are implicitly asking investors at what price they are willing to build. Regardless of technology and despite some initial resistance from developers, auctions are consistently delivering a more cost-effective solution to subsidy allocation.
Potential problems with auctions such as underbidding and completion risk can be mitigated by setting the volume of capacity auctioned within the market’s ability to supply, and by imposing penalties for delays in commissioning projects34. Provided auctions are well-designed, they can be immensely successful in both harnessing private sector investment and eliminating the costly errors associated with guessing at the cost of capital used by investors.
Conclusions
The cost of capital directly influences the scope and scale of climate-friendly investments. We have sought to shed light on the reasons behind the following issues:
• The cost of capital is important to investment decisions taken by most firms
• It is impossible to know, a priori, the cost of capital ascribed to a specific investment
• The cost of capital for a specific investment opportunity will vary according to the investor, technology type, and geography
• Taxpayer resources can be wasted when investment policies rely upon regulators to estimate the cost of capital.
As has been explained in this paper, estimating the cost of capital is inherently difficult due to information asymmetries and the heterogeneity of investment methodologies used by businesses. Such guesswork can be avoided by adopting policy mechanisms that encourage investors to reveal their own cost of capital. When executed properly, these policies have huge potential to stimulate greater levels of renewable investment in both the developed and developing world.
The challenge ahead is not just to stimulate increased participation by existing investors in clean energy, but to also bring new investors into the fold. Making climate change mitigation investments available to investors as financial assets has the potential to unlock access to a US$600 trillion pool of global finance capital, nearly three times greater than the stock of real assets that underpin all economic activity in the global economy35. Having stable cash flows and no fuel price risk, the returns from renewable energy financial assets should be weakly correlated to the returns from the major asset classes. To financial investors, this generates a diversification benefit that will eventually translate into extraordinarily low discount rates for renewable energy projects36. By recognizing the potential for ‘zero beta’ (ß=0) in renewable power project investments (i.e. returns that are unaffected by swings in the market), policymakers may find additional incentive to reduce the barriers faced by investors at the project level. The opportunity to seriously entice large institutional investors into clean energy is an opportunity that, for the sake of the planet, cannot be wasted.
Policies that reduce investment risk serve the public interest because they lead to a reduction in renewable energy tariffs, thereby minimising – to the greatest extent possible – taxpayer support for new low-carbon power capacity. Recognizing the importance of cost of capital in investment decisions, policymakers will be better prepared to promote the benefits of portfolio diversification and transfer the most costly risks away from the private sector.

Grantham Institute Imperial College London
13The cost of capital and how it affects climate change mitigation investment Briefing paper No 15 January 2016
References
1. Yergin, D., and J. Stanislaw. “Commanding Heights: The Battle between Government and the Marketplace that is Remaking the Modern World.” (1998).
2. World Energy Outlook Special Report, OECD/IEA, 2015. Available at: https://www.iea.org/publications/
3. Frederick, S., Loewenstein, G., & O’donoghue, T. (2002). Time discounting and time preference: A critical review. Journal of economic literature, 351-401.
4. More specifically, a social rate of time preference in which the pure time preference is set to zero.
5. Yale Symposium on the Stern Review (2007). Yale Symposium for the Study of Globalization, February 2007.
6. IRENA (2015), Renewable Power Generation Costs in 2014. Available at: http://www.irena.org/documentdownloads/publications/irena_re_power_costs_2014_report.pdf
7. New Energy Outlook 2015, Powering a Changing World. BNEF, 2015. Available at: http://www.bloomberg.com/company/new-energy-outlook/
8. The start of which is often credited to the French Mathematician Louis Bachelier for his doctoral thesis The Theory of Speculation in the year 1900.
9. Fernandez, Pablo. “Betas used by Professors: a survey with 2,500 answers.” IESE Business School, SSRN (2009): 1-12.
10. Sharpe, W.F. Capital Asset Prices: A Theory of Market Equilibrium under Conditions of risk, The Journal of Finance. Vol. 19, No. 3 (Sep, 1964) pp. 452-442; Lintner, J. The Valuation of Risk Assets and the Selection of Risky Investments in Stock Portfolios and Capital Budgets. The Review of Economics and Statistics, Vol. 47, No. 1 (Feb., 1965) pp. 13-37.
11. Ross, R.A., The Arbitrage Theory of Capital Asset Pricing. Journal of Economic Theory 13, 341-360 (1976).
12. Bruner, R.F., Eades, K.M., Harris, R.S., Higgins, R.C., Best Practices in Estimating the Cost of Capital: Survey and Synthesis. Financial Practice and Education Spring/Summer, 1998.
13. Fox, Justin. “The Myth of the Rational Market: A History of Risk, Reward, and Delusion on Wall Street.” (2009).
14. Of particular note is the Market-Based Capital Pricing Model which uses options pricing to arrive at the cost of capital embedded in the market price of a given security. It is a highly sophisticated and promising tool for use in capital markets, but of very limited use in real asset markets, such as energy infrastructure.
15. KPMG, (2014). Cost of Capital Study 2011/2012. Developments in Volatile Markets. Available at: http://www.kpmg.com/DE/de/Documents/Cost_of_Capital_Study_2011-2012-KPMG.pdf
16. Porterba and Summers, (1995). A CEO Survey of US Companies’ Time Horizons and Hurdle Rates. MIT Sloan Management Review, October 15. Meier, Iwan and Tarhan, Vefa, Corporate Investment Decision Practices and the Hurdle Rate Premium Puzzle (January 28, 2007). Available at SSRN: http://ssrn.com/abstract=960161
17. Federal Reserve, 2013. 100th Annual Report. Board of Governors of the Federal Reserve System. Available at: http://www.federalreserve.gov/publications/annual-report/files/2013-annual-report.pdf
18. Meier, Iwan and Tarhan, Vefa, Corporate Investment Decision Practices and the Hurdle Rate Premium Puzzle (January 28, 2007). Available at http://dx.doi.org/10.2139/ssrn.960161
19. Mullins, D. W. (1982). Does the capital asset pricing model work. Harvard Business Review, 60(1), 105-114.
20. Driver, C., Imai, K., Temple, P., and Urga, G. (2004). The effect of uncertainty on UK investment authorisation: Homogenous vs. heterogeneous estimators. Empirical Economics, 29(1), 115-128.
21. Copeland, T.E., Koller. T. and Murrin. J., (1990) Valuation: Measuring and Managing the Value of Companies, John Wiley and Sons, NY.
22. Helms T., Salm., S., Wustenhagen., (2015). Investor Specific Cost of Capital and Renewable Energy Investment Decisions in Donovan C.W. (ed.) Renewable Energy Finance: Powering the Future, Imperial College Press.
23. Bennouna, K., Meredith, G. G., & Marchant, T. (2010). Improved capital budgeting decision making: evidence from Canada. Management decision, 48(2), 225-247.
24. Block, S. (2003), “Divisional cost of capital: a study of its use by major U.S. firms”, The Engineering Economist, Vol. 48, No. 4, pp. 345-362.
25. Schlegel, D. (2015). Cost-of-Capital in Managerial Finance. Springer.
26. International Energy Agency. 2015. Projected Costs of Generating Electricity. Based on a study that analyzes 180 plants across 22 countries, including a carbon cost of USD $30/ton and regional variations in assumed fuel costs. Available at: https://www.iea.org/Textbase/npsum/ElecCost2015SUM.pdf
27. Nelson & Shrimali, (2014) ‘Finance mechanisms for lowering cost of renewable energy in rapidly developing countries’ (Climate Policy Initiative).
28. Damodaran, Aswath. (2012). “Equity risk premiums (ERP): Determinants, estimation and implications–The 2012 Edition.” March (New York City: New York University: Stern School of Business). Original data available at: www.stern.nyu.edu/~adamodar/pc/datasets/ctrypremJune13.xls
29. Lewis, T.R., 1996. Protecting the environment when costs and benefits are privately known. The Rand Journal of Economics; Winter 1996; 27, 4. P.819.

Imperial College London Grantham Institute
14 The cost of capital and how it affects climate change mitigation investmentBriefing paper No 15 January 2016
30. PPIAF Report: South Africa’s Renewable Energy IPP Procurement Program: Success Factors and Lessons http://www.ppiaf.org/sites/ppiaf.org/files/publication
31. C Mitchell, D Bauknecht, PM Connor Effectiveness through risk reduction: a comparison of the renewable obligation in England and Wales and the feed-in system in Germany. Energy Policy 34 (3), 297-305.
32. NERA Economic Consulting. Changes in Hurdle Rates for Low Carbon Generation Technologies due to the Shift from the UK Renewables Obligation to a Contracts for Difference Regime. DECC. 9 December 2013 Available at: https://www.gov.uk/government/publications/nera-economic-consulting-report-changes-in-hurdle-rates-for-low-carbon-generation-technologies
33. EY, RECAI: Renewable energy country attractiveness index. Issue 44. June 2015. Available at: http://www.ey.com/Publication/vwLUAssets/RECAI_44/$FILE/RECAI%2044_June%202015.pdf
34. Gireesh Shrimali, Charith Konda, Arsalan Farooquee and David Nelson. May, 2015 Reaching India’s Renewable Energy Targets: Effective Project Allocation Mechanisms. Available at: http://climatepolicyinitiative.org/publication/
35. Bain & Company, (2012). A world awash in money, November 14, 2012. Available at: http://www.bain.com/publications/articles/a-world-awash-in-money.aspx
36. Awerbuch, Shimon & Yang, Spencer, 2007. “Efficient electricity generating portfolios for Europe: maximising energy security and climate change mitigation,” EIB Papers 7/2007, European Investment Bank, Economics Department.

Grantham Institute Imperial College London
15The cost of capital and how it affects climate change mitigation investment Briefing paper No 15 January 2016

Imperial College London Grantham Institute
About the authors
Dr Charles Donovan Charles Donovan is Principal Teaching Fellow at Imperial College Business School in London. He was most recently head of Structuring and Valuation for Alternative Energy at BP plc, where he was responsible for investment evaluation and project financings in North America, Europe, and Asia. He began his career as an energy policy analyst with the US Environmental Protection Agency during the Clinton Administration and subsequently worked for the Enron Corporation. His experience includes several years in private sector consulting, advising national governments and multinational energy companies on the impacts of governmental policy on investment. Dr Donovan holds a BA in Psychology from the University of Washington, an MBA from Vanderbilt University, and a DBA in Management from IE Business School. He is editor and co-author of Renewable Energy Finance: Powering the Future, published September 2015.
Christopher Corbishley Christopher Corbishley is a PhD Candidate at Imperial College Business School funded by the Economics and Social Research Council (ESRC). His doctoral thesis focuses on the governance and coordination of energy services in developing countries, which has included a research project on building socially and economically sustainable business models for rural electrification in Africa. He is part of a multi-institutional research programme, led by Imperial College Business School and the University of Southampton Sustainable Energy Research Group (SERG), funded by the Engineering and Physical Sciences Research Council (EPSRC).
About the Grantham Institute
The Grantham Institute is committed to driving research on climate change and the environment, and translating it into real world impact. Established in February 2007 with a £12.8 million donation over ten years from the Grantham Foundation for the Protection of the Environment, the Institute’s researchers are developing both the fundamental scientific understanding of climate and environmental change, and the mitigation and adaptation responses to it. The research, policy and outreach work that the Institute carries out is based on, and backed up by, the worldleading research by academic staff at Imperial.
www.imperial.ac.uk/grantham
About Imperial College London
Consistently rated amongst the world’s best universities, Imperial College London is a science-based institution with a reputation for excellence in teaching and research that attracts 13,000 students and 6,000 staff of the highest international quality.
Innovative research at the College explores the interface between science, medicine, engineering and business, delivering practical solutions that improve quality of life and the environment—underpinned by a dynamic enterprise culture. Since its foundation in 1907, Imperial’s contributions to society have included the discovery of penicillin, the development of holography and the foundations of fibre optics.
This commitment to the application of research for the benefit of all continues today, with current focuses including interdisciplinary collaborations to improve health in the UK and globally, tackle climate change and develop clean and sustainable sources of energy.
www.imperial.ac.uk