grain quality evaluation of world rices - irri - booksbooks.irri.org/9712200396_content.pdf ·...
TRANSCRIPT


1993
IRRI INTERNATIONAL RICE RESEARCH INSTITUTE
P.O. Box 933, Manila 1099, Philippines
Grain Quality Evaluation
of World Rices
B.O. Julio and C.P. Villareal

The International Rice Research Institute (IRRI) was established in 1960 by the Ford and Rockefeller Foundations with the help and approval of the Government of the Philippines. Today IRRI is one of the 18 nonprofit international research centers supported by the Consultative Group on International Agricultural Research (CGIAR). The CGIAR is sponsored by the Food and Agriculture Organization of the United Nations, the lnternatlonal Bank for Reconstruction and Development (World Bank), and the United Nations Development Programme (UNDP). Its membership is comprised of 50 donor countries, international and regional organizations, and private foundations.
IRRI receives support, through the CGIAR. from a number of donors, including the Asian Development Bank, the European Economic Commu- nity, the Ford Foundation, the International Development Research Centre, the International Fund for Agricultural Development, the OPEC Special Fund, the Rockefeller Foundation, UNDP, the World Bank, and the Interna- tional development assistance agencies of the following governments: Australia, Belgium, Brazil, Canada, China, Denmark, Finland, France. Germany, India, Iran, Italy, Japan, Republic of Korea, Mexico, The Netherlands, New Zealand, Norway, the Philippines, Saudi Arabia, Spain, Sweden, Switzerland, United Kingdom, and United States.
Rice Research Institute. The responsiblity for this publication rests with the lnternatlonal
Copyright © International Rice Research Institute 1993. All rights reserved. Except for quotations of short passages for the
purpose of criticism and review, no part of this publication may be repro- duced, stored in retrieval systems, or transmitted in any form or by any means, electronic, mechanical, photocopying, recording, or otherwise, with- out prior permission of IRRI. This permission will not be unreasonably withheld for use for noncommercial purposes. IRRI does not require pay- ment for the noncommercial use of its published works, and hopes that this copyright declaration will not diminish the bona fide use of its research findings in agricultural research and development.
this publication do not imply the expression of any opinion whatsoever on the part of IRRI concerning the legal status of any country, territory, city, or area, or of its authorities, or the delimitation of its frontiers or boundaries.
The designations employed in the presentation of the material in
ISBN 971-22-0039-6
Contents
Foreword vii Abstract viii List of tables ix Introduction 1 Materials and methods 5
Protein content 5 Apparent amylose content 6 Alkali spreading value 7 Gel consistency 8 Amylograph viscosity 8 Cooked rice hardness and stickiness 9 Linear correlation coefficients 10
Results and discussion 11 Asia 12
Bangladesh 12 Bhutan 14 Brunei Darussalam 15 Cambodia 16 China 16 India 17 Indonesia 19 Iran 20 Japan 20 Korea, Republic of 21 Laos 22 Malaysia (East) 23 Malaysia, West 24 Myanmar 25 Nepal 26 Pakistan 27 Philippines 28

Sri Lanka 29 Taiwan, China 29 Thailand 30 Turkey 31 Vietnam 32
Summary 34 Oceania 35
Australia 35 New Zealand 36
North, Central, and South America 37 North and Central America 37
Costa Rica 37 Cuba 39 Dominican Republic 39 El Salvador 40 Guatemala 41 Haiti 41 Mexico 42 Panama 43 USA 43
South America 44 Argentina 44 Bolivia 45 Brazil 46 Chile 47 Colombia 47 Ecuador 48 Guyana 49 Paraguay 49 Peru 50 Surinam 51 Venezuela 52
Summary 53
Europe 55 Bulgaria 55 France 57 Greece 58 Hungary 58 Italy 59 Portugal 60
iv

Russia 61 Spain 62
Summary 63
Benin 65 Cameroon 65
Ghana 58 Ivory Coast 68 Liberia 69 Madagascar 70 Mali 71 Nigeria 72 Senegal 73 Sierra Leone 74 Tanzania 74 Togo 75 Zambia 75
Summary 76
Africa 65
Egypt 67
Oryza glaberima and other wild rices 77 General discussion and conclusions 79 References cited 82 Acknowledgments 86 Institutions and organizations supplying rice samples 87 Sources of 1990 grain quality information in national programs 90 Cross reference index of variety names 92 Acronyms of rice varieties/lines 94 Appendix: Quality characteristics of milled rice, by country, and
wild rice 99
V


Foreword
G rain quality has probably been used as a criterion to select rice since humans first cultivated it. For the International Rice Re- search Institute, grain quality has had a key role in research
from the institute’s beginning. In the future, grain quality will be even more important once the very poor—many of whom depend largely on rice for their staple food—become better off and begin to demand higher quality rice.
Cereal chemist B. O. Juliano, the first author of Grain quality evaluation of world rices, led IRRI’s grain quality research for three decades. It is primarily due to his dedicated work in this important research area that IRRI scientists can routinely measure grain quality in prebreeding efforts serving national agricultural research systems. Grain quality evaluation of world rices is a much-needed data base of selected grain quality characteristics of milled rice from all countries producing more than 0.1% of the world’s rice. Quality characteristics and preferences are discussed by country based on information ob- tained from national programs. The appendix of analysis provides a ready reference and comparison among 2679 milled rices (Oryza sativa L.) and 244 wild rices analyzed in the same laboratory under compa- rable conditions since 1963. This book updates and expands the 1980 IRRI publication Quality characteristics of milled rice grown in different countries by Juliano and C. G. Pascual.
Grain quality evaluation of world rices will be useful for rice breeders and chemists involved in grain quality breeding programs and for food scientists and nutritionists interested in rice grain quality, composi- tion, processing, and use. C. Villareal prepared the data base and its statistical analyses. C. Dedolph edited the book with the assistance of T. V. Rola, and E. E. Putungan designed the layout.
Klaus Lampe Director General
vii

Abstract
P hysicochemical data on protein content, apparent amylose content (AC), alkali spreading value (an index of starch gelatini- zation temperature [GT]), gel consistency (GC), Amylograph
viscosity (peak, setback, and consistency), cooked rice Instron hard- ness and stickiness, and grain length and width were collected for 2679 milled rices ( Oryza sativa L.) grown in 64 countries at 67 locations. We compared these data with the country’s quality preferences when possible.
Mean protein is 7.3%. High AC predominates everywhere but in Europe. Intermediate AC, however, seems to be preferred for slightly sticky, soft-cooked rice. Low GT is preferred on all continents over intermediate GT, and soft GC over medium and hard GC, except in Africa, where hard GC is preferred.
Extra long grains predominate only in Surinam; long, slender grains in the Americas, Thailand, and other exporting countries. Medium-sized and -shaped grains predominate in most of Asia, except in Bangladesh; Bhutan; China; Japan; Republic of Korea; Tai- wan, China; and Vietnam (traditional varieties), where people prefer short-grained rices. Medium-grained rice is also popular in Europe. Bulgaria, Spain, and Russia are the exceptions, where short, bold grains predominate. Consumers prefer long-grained, medium-shaped rices in Hungary.
Milled rice of 244 wild Oryza species, of which 195 were O. glaberrima, were characterized for AC, GT, and GC. Properties are similar to those of cultivated rice: 12% mean protein, high AC, low GT, and hard GC.
viii

List of tables
Table 1.
Table 2.
Table 3. Table 4.
Table 5.
Table 6.
Table 7.
Table 8.
Table 9.
Table 10.
Table 11.
Table 12.
Priority given to grain quality, yield potential, and other plant properties in some national rice breeding programs. IRRI, 1990. 2 Classification of properties of milled rice starch in the IRRI rice breeding program (Juliano 1985). 3 Typical Amylograph values for various amylose types. 8 Typical Instron cooked rice hardness and stickiness values for various amylose types. 10 Protein content and classification of milled rice in Asia, Australia, and New Zealand based on apparent AC, final GT, and GC. IRRI, 1963-91. 13 Protein content and classification of milled rice in the Americas based on apparent AC, final GT, and GC. IRRI,
Protein content and classification of milled rice in Europe based on apparent AC, final GT, and GC. IRRI, 1965-91. 55 Protein content and classification of milled rice in Africa based on apparent AC, final GT, and GC. IRRI, 1965-91. 66 Classification of O. glaberrima accessions obtained from IRRI and IITA based on apparent AC, final GT, and GC. IRRI, 1965,1967,1982,1991. 78 Distribution of milled rice of wild Oryza species other than O. glaberrima in terms of apparent AC, final GT, and GC. IRRI, 1965, 1967, 1989, 1991. 78 Summary of protein content and classification of milled rice based on apparent AC, final GT, and GC, by continent and by wild rice species. IRRI, 1963-91. 80 Preferred rice grain type (based on apparent AC) in various rice-producing countries. IRRI, 1991. 81
1963-91. 38
ix


Introduction
D ata bases are available for grain characteristics of market samples in some rice-consuming countries (RCMD 1987, 1989; Rivenburgh 1961, Simpson et al 1965) and of germplasm
collections (IITA 1985, IRRI 1990). Juliano and Pascual (1980) have the only data base for rice quality in some countries. In this book, all countries producing 0.1% or more of the world's rice are included along with quality information (when available), rice production data, and per capita milled rice supply from FAO.
Grain quality is second only to yield potential as the major breeding objective (Table 1) for the 11 countries responding to a 1990 survey of national rice programs (Juliano and Duff 1991). Apparent amylose content is the major factor influencing cooking and eating quality of milled rice. Alkali spreading value and GC can distinguish rices with similar AC, particularly waxy and high-amylose rices (Table 2).
Amylograph pasting viscosity indicates changes in texture during cooking. Many factors affect peak viscosity, but Amylograph setback and consistency relate to cooked rice hardening during cooling. Cooked rice hardness and stickiness are also important grain quality indicators. Milled rice length and width help to completely character- ize grain size and shape.
Data for each sample are alphabetically listed and ordered chrono- logically for each variety. Variety names are cross-referenced when listed under an equivalent name in the same or a different country. Water regime data (upland, irrigated, deepwater, rainfed lowland, tidal wetlands, and hydromorphic) are included when available.
Only 4% of total rice production enters the world market. Some national programs have considered exporting their excess production. They often do not fully understand, however, the competitiveness of the world market and stringent quality requirements, particularly on contaminants (Efferson 1985). In Hongkong, for example, consumers

Table 1. Priority given to grain quality, yield potential, and other plant properties in some national rice breeding programs. IRRI, 1990.
Priority a given to
Country Grain Yield Resistance to Tolerance for Direct quality potential seeding
Diseases Insects Diseases Lodging Drought Cold Adverse and insects soils
Bangladesh China Japan Super-rice Program Republic of Korea (Suweon) Republic of Korea (Milyang) Madagascar Malaysia
Overall breeding Grain quality breeding
Myanmar Philippines
Irrigated Upland
Taiwan, China Thailand b
USA Total
1 4 0 0 3 0 2 0 0 0 2 2 0 0 2 0 0 0 0
0
1.5 1.5 0 0 0 0 0 0 0
0
5 3 0 0 4 0 0 2 0 1 6 3.5 3.5 1 0 5 0 0 0 2 1 0 3 2 0 0 0 4.5 4.5
0
1 3 0 0 2 0 0 0 0
0
3 1.5 0 0 1.5 0 0 0 0 0 2.5 2.5 0 0 0 0 1 0 0
0
2 5 4 2 0 1 0 0 0
0
1 5 4 3 0 0 2 0 0
0
2 2 2 0 0 0 0 0 0
0
2.5 2.5 0 0 2.5 0 0 0 0 2.5 3 3 3 3 0 0 0 3 0
0
33.5 38.5 19.5 11 15 6 5 9.5 4.5 5.5
a The highest number has the highest priority. b lmprovement of cultural practices was listed as the first priority item.
0
0

Table 2. Classification of properties of milled rice starch in the IRRI rice breeding program (Juliano 1985).
Starch property Class Values
Apparent AC by iodine Waxy colorimetry (% milled Very low rice. dry basis) Low
Intermediate High
Final GT (ºC) by Low (5.5-7.0) alkali spreading value intermediate (3.5-5.4)
Intermediate-high (2.6-3.4) High (1.0-2.5)
GC (mm) soft Medium Hard
0 - 5.0 5.1 - 12.0
12.1 - 20.0 20.1 - 25.0
>25.0
55 - 69.5 70 - 74
74.5 - 80
61 - 100 41 - 60 25 - 40
prize very translucent, high head rice-yielding, long-grained Thai aromatics that have low GT and low to intermediate AC and Austra- lian long- and medium-grained rices with low GT and low to interme- diate AC over short, medium-shaped Chinese rices with low GT and high AC (Juliano et al 1990, Kaosa-ard and Juliano 1991, Luo et al 1987).
Introduction 3


Materials and methods
S amples were obtained through national rice breeding programs. Wild rice samples were grown at IRRI and at the International Institute of Tropical Agriculture (IITA). Rough rice samples
were dehulled in a Satake dehuller or McGill sheller, with the resulting brown rices milled either in a McGill miller (no. 2 or 3), a Satake TM- 05 grain testing mill, a laboratory test tube rice miller, or a Kett Pearlest micromill.
Milled rice for protein and amylose assays and amylography was ground in a Wiley or Udy cyclone mill with a 40-mesh sieve. Samples for GC were ground in 10-grain lots for 40 s in a Wig-L-Bug amalgama- tor (Crescent Dental Mfg. Co.) or in a Udy cyclone mill with 60-mesh sieve.
We measured the length and width of 10 whole grains to the nearest mm using a photoenlarger calibrated to enlarge exactly 10 times the original size (Khush et al 1979). IRRI classifies brown rice grain length into extra long, >7.50 mm; long, 6.61-7.50 mm; medium, 5.51-6.60 mm; and short, 15.50 mm. IRRI classifies brown rice grain shape based on length-width (L-W) ratio as slender, >3.0; medium, 2.1-3.0; bold, 1.1- 2.0; and round, 11.0. We used these classifications for milled rice samples without correction.
Protein content The microKjeldahl method was used to measure protein in 50 mg rice flour manually digested with HgO or Se catalyst. We used the auto- mated colorimetric procedure (indophenol blue after reaction with hypochlorite and alkaline phenol, using AutoAnalyzer modules [Juli- ano and Pascual 1980]) to determine the ammonia content in the digest. Kjeldahl N was multiplied by 5.95 to convert it to crude protein. This factor, expressed as wet weight, is based on the 16.8% N in rice protein.
Since 1967, rice powder (50 mg) was digested in 10-ml Kjeldahl flasks with 2 ml concentrated H 2 SO 4 and 1 g K 2 SO 4 -catalyst mixture

(100:2 w/w) using a Labconco or King digestor. Samples were digested for 20 min or until they were completely clear and then cooled. Water was added up to the 20-ml calibration mark (at room temperature) to dissolve the digest. We transferred a portion of thoroughly mixed solution to the 8-ml sample cup of the AutoAnalvzer for the colori- metric analysis. Blanks and standards were run with the samples.
The following reagents were used for the colorimetric ammonia assay:
Citrate/tartrate. Na tartrate (600 g) and Na citrate (200 g) were dissolved in about 2500 ml distilled H 2 O. NaOH (80 g) was dissolved in 500 ml distilled H 2 O. We combined the two solutions, added distilled H 2 O to make 4 liters, and shook it well.
Alkaline phenate. NaOH (553 g) was dissolved in about 2000 ml of distilled H 2 O. Eighty-nine percent pure phenol (1060 ml) was slowly stirred into the solution while it cooled in an ice bath. Distilled water was added to make 4 liters. It was mixed well, and then stored in a refrigerator.
Hypochlorite. Commercial "chlorox" bleach (about 5% by weight NaOCl) was used.
10% sulfuric acid. Instead of H 2 O, 10% sulfuric acid was used for blank wash. Concentrated H 2 SO 4 (100 ml) was added to about 700 ml distilled H 2 O in a 1000-ml volumetric flask. It was cooled, made up to volume, and then shaken.
Apparent amylose content The modified simplified assay of Juliano et al (1981) was used. Milled rice flour (100 mg) was weighed in duplicate in 100-ml volumetric flasks. We then added 1 ml of 95% ethanol, washing down any sample adhering to the flask, followed by 9 ml of 1 N NaOH. The suspension was heated in a boiling water bath for 10 min to gelatinize the starch and then cooled for 1 h at room temperature. Samples were diluted to volume with distilled H 2 O and mixed well.
Portions of the starch solution were transferred into AutoAnalyzer cups. The amylose-iodine blue color was determined at 608 nm at 78 samples/h (Juliano and Pascual l980). A calibration curve was made with each set of unknown samples by plotting the absorbance of check milled samples against their known amylose content. Iodine solution prepared daily consisted of 3 ml 0.2% I 2 in 2% KI and 1 ml 1 N acetic acid diluted to 100 ml.
The amylose contents of check milled samples were obtained from 95% ethanol-defatted milled rice flour (reflux 18-24 h) using standard
6 Grain quality evaluation of world rices

mixtures of 70 mg waxy rice flour (amylopectin), 10 mg amylose + 60 mg waxy rice, 20 mg amylose + 50 mg waxy rice, 25 mg amylose + 45 mg waxy rice, and 30 mg amylose + 40 mg waxy rice in 100 ml 0.09 N NaOH. Undefatted check samples could be used for the calibration curve of undefatted milled rice. Results were expressed on a dry weight basis.
Reagents: NaOH, 1 N. Forty grams anhydrous NaOH were dissolved in
1 liter of distilled H 2 O. NaOH, 0.09 N. Nine milliliters 1 N NaOH were diluted into
100 ml with distilled H 2 O. Acetic acid, 1 N. Glacial acetic acid (57.75 ml) was dissolved in
distilled H 2 O in a 1-liter volumetric flask and made up to volume. Iodine solution 0.2% I 2 in 2% KI. Two grams iodine and 20 g KI
were dissolved in distilled water in a 1-liter volumetric flask and made up to volume.
In the study, AC was classified as waxy 0-5.0%, very low 5.1-12.0%, low 12.1-20.0%, intermediate 20.1-25.0%, and high >25.0% to allow for nonwaxy contamination of waxy rice.
Alkali spreading value The method of Little et al (1958) was used. Six whole-grain, milled rice samples were placed in duplicate square plastic boxes (R.P. Cargille Laboratories, Inc., 4.6 × 4.6 × 1.9 cm) containing 10 ml of 1.7% KOH, arranged so that the grains did not touch each other. The boxes were covered and incubated for 23 h at 30 °C. Grain appearance and disinte- gration were visually rated after incubation, based on the following numerical scale:
Description Score Grain not affected 1 Grain swollen 2 Grain swollen, collar incomplete or narrow 3 Grain swollen, collar complete and wide 4 Grain split or segmented, collar complete and wide 5 Grain dispersed, merging with collar 6 Grain completely dispersed and intermingled 7
Check samples with scores of 2-7 were run with each analysis. A rating of 5.5-7.0 was classified in this study as low final gelatinization tem- perature (55-69 °C); 3.5-5.4, intermediate (70-74 °C); 2.6-3.4, intermedi- ate-high; and 1.0-2.5, high (74.5-80 °C).
Materials and methods 7

Gel consistency Rice flour prepared with a Wig-L-Bug amalgamator (100 mg) was placed in 13- × 100-mm culture tubes and wetted with 0.2 ml 95% ethanol containing 0.03% thymol blue, according to the method of Cagampang et al (1973). We added 2 ml 0.2 N KOH mixed sufficiently (2-3 s) with a Vortex Genie mixer set at speed six. Tubes were covered with glass marbles and heated in a vigorously boiling water bath for 8 min, making certain that the contents reached two-thirds the height of the tube. The tubes were removed from the water bath for 5 min, cooled in an ice-water bath for 20 min, and laid flat on a laboratory table over ruled graphing paper for 1 h. The total length of the blue-colored gel was measured in millimeters to index cold paste viscosity. Gel height from the bottom of the tube was 25 ± 1 mm.
The method separated high-amylose rices into soft gel consistency (61-100 mm), medium gel consistency (41-60 mm), and hard gel consis- tency (25-40 mm). Check samples representing these three gel consis- tency types were run with each analysis.
Amylograph viscosity We used the method of Halick and Kelly (1959), but with a total sample weight of 400 g instead of 500 g (Juliano et al 1985). Milled rice flour (40 g) was blended with 240 ml water for 1.5 min at high speed in a Waring blender. The slurry was transferred into the Amylograph bowl using an additional 120 ml water to wash adhering flour from the blender.
The sensing element was attached and the slurry heated, beginning at 30 °C, at the rate of 1.5 °C/min (with the Amylograph pen zeroed) up to 95 °C at a bowl speed of 75 rpm. The paste was heated 20 min at 95 °C before cooling to 50 °C at 1.5 °C/min.
We studied peak viscosity during heating, final viscosity at 94 °C (actual cooking temperature with thermostat set at 95 °C), and viscosity when cooled to 50 °C. All were expressed in Brabender units (BU).
Table 3. Typical Amylograph values for various amylose types.
Amylograph viscosity (BU) Amylose type
Peak Setback Consistency
Waxy 100 - 900 -300 - 100 0 - 200 Low 550 - 1150 -350 - 0 50 - 400 Intermediate 450 - 1150 -350 - 200 100 - 400 High 400 - 1000 0 - 850 200 - 850
8 Grain quality evaluation of world rices

Setback viscosity was viscosity cooled to 50 °C minus peak viscosity. Amylograph consistency was viscosity cooled to 50 °C minus final viscosity at 94 °C or the increase in paste viscosity during cooling. A model VA 1 Viscoamylograph was used from 1962 to 1988, when a Viscograph type VS6E with electronic thermoregulator was acquired.
Table 3 shows the typical Amylograph values for the various amylose types.
Cooked rice hardness and stickiness We measured cooked rice with an Instron model 1140 food tester as per the method of Perez and Juliano (1979). Twenty grams of milled rice was cooked in a predetermined optimum amount of water (26 ml for waxy rice, 34 ml for low-amylose, 38 ml for intermediate-amylose, and 42 ml for high-amylose) in 150-ml beakers for 20 min in Toshiba RC4B automatic electric cookers. There was an excess of 200 ml of water in the outer pot, with four samples per cooker. Cookers were not disturbed for at least 10 min after cooking. The cooked rice was then drained and cooled in plastic bags. All samples since 1989 were cooked with 42 ml water to obtain more consistent results among samples with borderline amylose contents.
Duplicate 17 g of cooked rice were placed in the Ottawa Texture Measuring System (OTMS) 50-cm 2 cell. It was modified with four side liners to reduce the cell cross-section to 15% of the original (7 cm 2 ). A 2.2- × 2.5-cm plunger was used. Each sample was pressed with 145 g weight for 1 min before extrusion. Hardness was the maximum force (in kg) needed to extrude the rice through the cell’s 7-cm 2 perforated base with 5.2 -mm diam holes at the crosshead speed of 10 cm/min and the same chart speed. The 0-50 kg load cell was used. Hardness values were 15% of the value obtained with the standard cell. An OTMS 10-cm 2 cell was used from late 1982 onward and hardness values were multiplied by 0.7 to express them into kg/7 cm 2 .
For the stickiness test, cooked rice (17 g) was pressed onto the platform with the OTMS plunger (6.9 × 6.9 cm) for 10s with a clearance of 0.4 mm. This allowed the rice to squeeze out around the edges. Stickiness, expressed in gram-centimeters, was the product of the force in grams required to lift the plunger and the distance in centimeters that the plunger traversed. It was measured directly by planimetry from the Instron chart paper. The 0-5 kg load cell was used. Chart speed was 100 cm/min and the crosshead speed was 5 cm/min.
Because of the very high correlation between amylose content and Instron stickiness, few samples were measured after 1977-79. Due to
Materials and methods 9

excessive pressure on the load cell since 1980, cooked rice has been pressed onto the platform with the 3.6-cm diam plunger with up to 4 kg maximum pressure. After the pressure stabilized (~20s), the plunger was lifted as described above. Area was reduced from 47.6 to 10.2 cm 2, or a factor of 4.67.
See Table 4 for typical Instron cooked rice hardness and stickiness values for the various amylose types.
Amylograms and cooked rice texture tests were only used for large samples of 100 g milled rice.
Linear correlation coefficients Simple linear correlation coefficients were calculated among grain properties for each country having at least four samples. Only signifi- cant correlation coefficients (usually 0.60 or above) are discussed. Correlation coefficients without sample number (n) have the same n as the previous coefficients.
Table 4. Typical lnstron cooked rice hardness and stickiness values for various amylose types.
Water- lnstron cooked rice Amylose type rice
ratio Hardness (kq/7 cm 2 ) Stickiness (g-cm)
Waxy 1.3 4 - 8 50 - 450 2.1 3 - 4 200 - 600
Low 1.7 5 - 9 50 - 200 2.1 4 - 5
Intermediate 1.9 5 - 10 25 - 200 2.1 4 - 9
High 2.1 6 - 12 0 - 100
10 Grain quality evaluation of world rices

Results and discussion
Results and discussion are presented by continent, with countries in alphabetical order. Data on wild species are then presented.

Asia
I n 1989, Asia produced 449.3 of the world’s 492.1 million t of rough rice (FAO 1990b). Corresponding world rough rice con- sumption in 1986-88 was 418.7 million t, of which Asia consumed
380.2 million t. Asia produces and consumes more than 90% of all rice. Asia’s per capita milled rice supply in 1986-88 was 85 kg/yr (FAO 1990a).
Bangladesh
A nnual rough rice production was 25.5 million t in 1989 (FAO 1990b). Annual milled rice per capita consumption was 141 kg in 1979-81 (FAO 1984), 137 kg in 1986-88 (FAO 1990a, IRRI
1991), and 154 kg in 1988 (Duff 1991). Important varieties by district based on grain quality according to N.H. Choudhury (Bangladesh Rice Research Institute, 1990, pers. commun.) are Rajshahi—Jhingasail, Ra- jasail, and Indrasail (excellent); Bogra—White Biroi (very good), Pur- bachi (good); Dinajpur—Kataribhog (excellent); Khulna—Patnai (very good), Bhaital (good); Faridpur—Aman (good); Chittagong—Pajam (very good); Sylhet—Tepi boro (very good); Mymensingh—Red Biroi and Bashful (excellent); Dhaka—Kataribhog, Nizersail, and Red Biroi (excellent), Pajam (Mahsuri) and Jamir (very good), and Irrisail (IR20)
A consumer demand study found that the retail market price for parboiled rice in four districts correlated positively with length-width ratio and volume expansion, and negatively with 1000-grain weight and moisture content (Choudhury et al 1991). Market parboiled samples of Kalaribhog had 27-28% AC and Pajam had 27-29% AC (RCMD 1987, 1989). Retail market price for raw rice correlated positively with gel consistency values and negatively with percent brokens and cooking time.
(good).

Table 5. Protein content and classification of milled rice in Asia and Oceania based on apparent AC, final GT, and GC. IRRI, 1963-91.
Sample Protein (%) AC a GT b GC c
Source (no.) Range Mean Wx VL L I H L I HI H S M H
Asia Bangladesh 58 5-12 7.7 0 0 2 7 49 40 15 3 0 23 14 15 Bhutan 40 5-9 6.9 0 0 2 22 16 37 3 0 0 6 11 23 Brunei Darussalam 11 6-13 7.9 0 1 0 4 6 9 1 1 0 1 4 6 Cambodia 34 4-12 6.4 0 0 4 5 25 23 8 3 0 7 10 9 China 75 6-13 8.3 4 0 18 12 41 46 28 1 0 24 23 22 India 52 6-11 8.5 0 0 2 8 42 34 17 1 0 24 6 15 India, Maharashtra 14 5- 8 6.3 0 0 0 2 12 6 8 0 0 4 5 5 Indonesia 133 5-11 7.9 5 2 5 50 71 52 70 7 2 34 46 39 Iran 33 5-12 9.2 0 0 11 15 7 13 20 0 0 3 12 5 Japan 67 5-12 7.2 5 0 57 5 0 61 4 2 0 21 6 0 Korea, Rep. of 147 6-10 8.2 4 2 121 19 1 140 7 0 0 99 33 0 Laos 20 6- 9 7.4 11 2 1 5 1 16 3 0 1 7 2 3 Malaysia, Sabah 10 6- 8 6.8 0 0 0 3 7 5 3 2 0 0 6 4 Malaysia, Sarawak 27 5-14 7.1 0 3 4 6 14 9 14 1 3 12 6 3 Malaysia, West 46 6-11 7.4 3 0 0 5 38 18 20 6 2 20 12 5 Myanmar 61 5-11 6.9 1 11 12 19 18 39 21 1 0 24 11 16 Nepal 46 5- 9 7.0 0 0 10 8 28 36 8 2 0 19 8 19 Pakistan 66 6-10 8.1 0 0 3 33 30 44 18 4 0 10 15 30 Philippines 331 5-14 8.2 39 3 23 100 166 136 145 42 8 83 60 104 Sri Lanka 67 6-13 8.8 0 0 0 6 61 13 52 2 0 26 10 17 Taiwan, China 58 4-11 7.6 10 0 34 6 8 50 8 0 0 36 2 4 Thailand 83 4-14 8.0 22 2 6 13 40 53 22 1 1 33 12 23 Turkey 14 6-10 7.4 0 0 13 1 0 13 0 1 0 9 3 2 Vietnam 133 5-11 7.7 1 0 6 24 102 83 47 3 0 49 16 58
Total 1626 4-14 7.8 105 26 334 378 783 976 542 83 17 574 333 426 Oceania Australla 24 5-10 6.7 2 0 13 7 2 17 6 1 0 19 2 1 New Zealand 4 8-13 10.8 0 0 0 4 0 4 0 0 0 2 1 0
a Wx = waxy (0-5.0%). VL = very low (5.1-12.0%). L = low (12.1-20.0%). I = Intermediate (20.1-25.0%), and H = high (>25%). b Indexed by alkali
gel consistency values: S = soft (61-100 mm), M = medium (41-60 mm), and H = hard (25-40 mm). spreading value: L = low (6-7), I = intermediate (4-5). HI = high-intermediate (3), and H =high (2). c Only samples analyzed from mid-I971 have

Most Bangladeshi rice varieties are high-amylose (Appendix, Table 5), parboiled, and have low to intermediate GT. Parboiled rice is preferred, but raw rice is consumed in some districts such as Chittag- ong and Khulna (Choudhury et al 1991). Rices with red pericarp are not popular (Choudhury 1979). Long-grained varieties are preferred, al- though Jamir, with medium grain, and Bashful, with short, coarse grain that elongates when cooked, are popular. IR8, BR3, and Rajasail are coarse varieties with poor cooking and eating qualities. The rices with intermediate GT tended to have softer GC.
Samples with soft GC also had lower Amylograph setback and consistency and cooked rice Instron hardness values (Appendix). The grains varied widely in size (3.5-7.5 mm), and shape, from short- grained BR5 to long-grained DA 29 and Patnai 23. Cooked rice hard- ness correlated significantly with Amylograph setback ( r = 0.80**, n = 20), as did Amylograph setback with alkali spreading value ( r = 0.60**) and AC ( r = 0.58**). Cooked rice hardness and GC were negatively correlated ( r = 0.48**, n = 38).
Bhutan
A nnual rough rice production in Bhutan was 83,000 t in 1989 (FAO 1990b). Annual milled rice availability in 1988 was about 50 kg/capita. G.B. Chettri (Department of Agriculture,
1990, pers. commun.) classifies the important Bhutanese rice varieties as follows:
Red-pericarped, special eating quality, high altitude region, northern Bhutan (Paro Dumja, Paro Maap, Punakha Maap, Thimphu Maap, Thimphu Dumja, and Wangdi Maap). White slender-grained rices, used for beaten and puffed rice, medium altitude, western region (Punakha Sakha, Sem Kaap, Wangdi Kaap, Zakha, Dumja Kaap, and IR64). Aromatic rices, medium altitude, dry eastern zone (Sungsung and Sungpa). Good cooking and eating quality, medium altitude, humid southern zone (Attey, Sukhimay, and Baghay).
Our analysis showed that intermediate to high AC, low GT (except for Djambaran), and hard GC predominated in these traditional rice varieties (Table 5). The five red-pericarped maap rices had intermediate AC, low GT, and hard GC (Appendix). The white rices used for beaten and puffed rice had low to high AC, low GT, and medium GC. Attey,
14 Grain quality evaluation of world rices

Sukhimay, and Chirang Baghey had intermediate AC, low GT, and hard GC.
The samples also differed widely in Amylograph viscosity, cooked rice Instron hardness, and grain dimensions. Red rices were Djamba- ran red, Paro Dumja, Paro Maap, Punakha Maap, Thimphu Maap, Thimphu Dumja, and Wangdi Maap. Grains were mainly short to medium in length, and bold to medium in shape.
Milled rice length and width were negatively correlated ( r = –0.77**, n = 37). Amylose content correlated significantly with cooked rice hardness ( r = 0.69**, n = 23), GC ( r = 0.47**, n = 40), and Amylograph setback ( r = 0.81**, n = 14) and consistency ( r = 0.64*). Gel consistency and alkali spreading value were negatively correlated ( r = –0.52**, n = 40).
Brunei Darussalam
B runei Darussalam produced about 750 t rough rice in 1989 (FAO 1990b). Milled rice consumption in 1979-81 was esti- mated at 95 kg/capita per year (FAO 1984) and 82 kg in 1986-
88 (FAO 1990a). The principal variety was the slender grained aromatic variety Disobok (O.-J. Hong, Kilanas Agricultural Research Centre, 1990, pers. commun.). IRRI analysis showed Disobok to have interme- diate AC, low GT, and medium GC (Appendix).
High-intermediate AC, low GT, and hard-medium GC predomi- nated (Table 5). Most samples were Malaysian (MR73-MR101) and had intermediate AC, except for Lumut with 9.7% AC (Appendix). Lumut had high-intermediate GT and medium GC.
Disobok had 25% amylose and softer cooked rice than the MR rices. 00.55/1 had a very high protein content of 13.5%. The MR varieties had L-W ratios of more than three and were longer than Disobok. Lumut had the shortest grain and the softest cooked rice. Long- and medium- length slender grained rices predominated.
Cooked rice hardness (n = 11) correlated significantly with AC ( r = 0.85**), alkali spreading value ( r = 0.82**), and Amylograph setback ( r = 0.92**) and consistency ( r = 0.71*), but not with GC ( r = –0.16). Amylose content and alkali spreading value were correlated ( r = 0.79**). Amylose content also correlated with Amylograph setback ( r = 0.70*) and consistency ( r = 0.61*). Alkali spreading value correlated with Amylograph setback ( r = 0.64*) and peak viscosity ( r = –0.71*) Milled rice length correlated with alkali spreading value ( r = 0.82**), cooked rice hardness ( r = 0.70*, and AC ( r = 0.63*).
Asia 15

Cambodia
A nnual rough rice production in Cambodia in 1989 was 2.1 million t (FAO 1990b). Annual consumption of milled rice per capita in 1975-77 was 139 kg (IRRI 1991); per capita supply
in 1986-88 was 163 kg (FAO 1990a, IRRI 1991). Most 1989 varieties had high AC, low GT, and variable GC
(Table 5). Low-AC rices, such as Chhuthana and DID, were repre- sented in earlier samples (Appendix). Chhuthana had intermediate AC in 1988 samples, but Neang Mon still had low AC. Some of the earlier samples had high-intermediate GT. Most were less than 7 mm long, except Banla Phadu and Neang Mon. Grain size and shape were predominantly medium. Neang Mon had the softest cooked rice, followed by San Leaw and Phkar Sla.
Cooked rice hardness correlated significantly with Amylograph setback ( r = 0.92**, n = 20) and consistency ( r = 0.89**), and AC ( r = 0.76**). Amylose content correlated with Amylograph setback ( r = 0.81**, n = 25) and consistency ( r = 0.89**). Alkali spreading value also correlated with Amylograph setback ( r = 0.65**, n = 25) and consistency ( r = 0.64**).
China
C hina produced the most rough rice in the world in 1989— 180.1 million t (FAO 1990b). Annual milled rice consumption in 1979-81 was 86 kg/capita (FAO 1984) and 111 kg/capita (Duff
1991) or 113.4 kg/capita (RCMD 1989) in 1988. Available rice supply in 1986-88 was 104 kg/capita based on the FAO (1990a) food balance sheet. Hybrids account for 45% of production and 25-30% of the rice area (RCMD 1989).
The Chinese Ministry of Agriculture considers rice to be of high grain quality if it has good total and head rice yield, translucency, and at least 7% protein for japonica and 8% for indica (Y.K. Luo, Cereal Chemistry Department, China National Rice Research Institute, Hangzhou, China, 1990, pers. commun.)
Japonica rices are grown in the north, indica rices in the south, and both in the central regions. Good quality indicas have alkali spreading value >4. They are classified as grade 1 when grain length is 6.6-7.0 mm, L-W ratio >3.0, AC 17-22%, and GC >60 mm, and as grade 2 when grain length is 5.6-6.5 mm, L-W ratio 2.5-3.0, AC 23-25% or <17%, and
16 Grain quality evaluation of world rices

GC 41-60 mm. Japonicas of high quality have alkali spreading value >6. They are divided into grade 1 (AC 14-18% and GC >70 mm) and grade 2 (AC 19-20% or <14% and GC 61-70 mm).
Japonica grain properties are closest to ministry standards, fol- lowed by medium-maturing indicas, late-maturing indicas, and early- maturing indicas. People in northern regions, including those in Huanghe River Valley, prefer japonica rices with a sticky, soft texture. People in the southern areas prefer indica rices: hard-texture, high-AC rices in Guangdong and Guangxi Provinces, and long-grained, low- amylose, soft-cooked rices in Hongkong (Juliano et al 1990, Luo et al 1987).
Both japonica and indica rices are grown and consumed in central China (Yangtze River Valley). Market samples have 17-26% AC (RCMD 1987, 1989). A small amount of waxy rices are also cultivated and consumed as special rice products, such as cakes, balls, and wine.
High-AC rices predominated in Chinese samples analyzed at IRRI (Appendix, Table 5). Most were soft-cooked rice with intermediate GT, and medium to soft GC (Appendix). The indica rices had varied AC, whereas japonica rices had low to intermediate AC. Short, bold japon- ica grains predominated, but some medium-long and medium-shaped indicas were included.
Amylose content correlated significantly with Amylograph set- back ( r = 0.86**, n = 11) and consistency ( r = 0.93**), GC ( r = –0.69**, n = 69), and cooked rice hardness ( r = 0.64**, n = 32). Cooked rice hardness also correlated with GC ( r = –0.71**, n = 32). Grain width correlated significantly with grain length ( r = –0.72**, n = 32), protein content ( r = –0.47**, n = 69), and Amylograph setback ( r = –0.85*, n = 6).
A India
nnual rough rice production in India was 106.2 million t in 1989, second only to China (FAO 1990b). Annual per capita consumption of milled rice in 1979-81 was 69 kg (FAO 1984)
and 82 kg in 1988 (Duff 1991). Apparent per capita availability of rice was estimated at 71 kg in 1986 (RCMD 1987) and 64 kg in 1986-88 (FAO 1990a, IRRI 1991).
Quality preferences were difficult to obtain for India because of its size. Bhattacharya et al (1980), however, classified Indian rices into six of eight possible types based on total and water-insoluble AC and equilibrium water content.
Asia 17

Type III, high-AC rice, has low water-insoluble amylose as the predominant AC type (soft GC). Samples from northern and western India belong to type III. People in these areas prefer nonsticky soft- cooked rice. A similar trend occurs in samples from Kerala in southern India. Type II (high AC, medium insoluble amylose, medium GC) is a close second in preference in the northern states (Assam and West Bengal).
Varieties from the hilly border areas of northeastern and north- western India belong predominantly to semisticky (intermediate AC), sticky (low AC), and waxy rices. Scented intermediate-AC rices are fairly common among the samples from the northern region, especially Uttar Pradesh. Market samples of Basmati had 21-26% AC; Permal (PR-106), 24-25%; Poni, 25%; Mahsuri, 25-26%; and IR8,28% (RCMD 1987, 1989).
Most of the samples analyzed at IRRI were obtained from the All India Coordinated Rice Improvement Program, Hyderabad (now the Directorate of Rice Research), except for 14 varieties obtained in 1973 from Maharashtra. They were mainly high-AC rices with low GT and variable, but mostly soft, GC (Appendix, Table 5). Aromatic rice Basmati 370 had low-intermediate AC, lower Amylograph viscosity (setback and consistency), and cooked rice Instron hardness than the other high AC Indian rices. The Maharashtra samples were all high AC but intermediate to low GT, and variable GC. Grain size and shape were short to long and slender to bold.
Cooked rice hardness of non-Maharashtra samples correlated significantly with grain length ( r = 0.80**, n = 10) and consistency ( r = 0.79**), cooked rice stickiness ( r = –0.77**), AC ( r = 0.74**, n = 18), and alkali spreading value ( r = 0.59**). Cooked rice stickiness also cor- related significantly with Amylograph setback ( r = –0.92**, n = 10) and consistency ( r = –0.81**) and with protein content ( r = –0.84**). Gel consistency correlated with Amylograph consistency ( r = –0.66**, n = 18) and cooked rice hardness ( r = –0.50*, n = 10). The only significant correlation with the Maharashtra samples was between AC and GC ( r = –0.79**, n = 14) among four properties: protein, AC, GC, and alkali spreading value.
18 Grain quality evaluation of world rices

Indonesia
I ndonesia produced 44.8 million t of rough rice in 1989 (FAO 1990b). Annual consumption of milled rice per capita in 1979-81 was 126 kg (FAO 1984) and 158 kg in 1988 (Duff 1991). Per capita
rice availability in 1985 was 155 kg (RCMD 1987), 140 kg in 1988 (RCMD 1989), and 140 kg in 1986-88 (FAO 1990a, IRRI 1991).
A previous study of rice quality characteristics reveals that Java- nese consumers prefer a smooth-textured rice ( pulen ) with intermedi- ate AC. West and North Sumatran consumers prefer a more easily separating, high-AC rice with hard texture ( pera ) (Damardjati and Oka 1991). Traditional bulu varieties are priced more than twice that of modern varieties with similar cooking properties, except that they are aromatic and coarse-grained. A study of urban consumer preferences confirms that sticky cooked rice are premium-priced in Jakarta (Java) and Medan (Sumatra), but less sticky cooked rice is preferred in Ujung Pandang (Sulawesi) (Damardjati and Oka 1991). A market red rice sample had 20% AC; Cianjur had 19% AC (RCMD 1987,1989).
Medium-sized and -shaped grains predominated over long, slen- der grains. Bulu or javanica upland varieties had mainly intermediate AC, low GT, medium-sized and -shaped chalky grains, and aroma. Exceptions to this were low-AC Mandolin and high-AC Jidah and Kencara Muara (Appendix).
Many indica rices have the property of intermediate AC, but tend to have intermediate GT, medium-soft GC, and longer, slender grain. Cisadane, C4-63G, and IR64 are modern intermediate AC varieties that incorporate desirable taste characteristics (Damardjati and Oka 1991). Unnevehr et a1 (1985) found that retail price in Jakarta correlated negatively with L-W ratio. High-AC rices tended to have intermediate GT; black ketan waxy rices were available in Jakarta retail markets.
Tidal swamp rices (n = 44) had mainly high AC, intermediate GT, and hard-medium GC. But four were waxy, one had low AC, and five had intermediate AC (Appendix). Excellent quality rices were Kapuas, Karang-Duku 1, and Tampokong Kuning (G.A. Watson, 1983, unpubl. data). Deepwater (BJM) rices, except for two waxy rices, had high AC, intermediate GT, and hard GC.
Cooked rice hardness correlated significantly with grain width ( r = –0.60**, n = 50) and GC ( r = –0.73**, n = 54), whereas AC correlated with GC ( r = –0.66**, n = 119), Amylograph setback ( r = 0.56**, n = 65) and consistency (r = 0.65**), and cooked rice stickiness ( r = –0.62**, n = 27).
Asia 19

Iran
T he rough rice production in the Islamic Republic of Iran was 1.2 million t in 1989 (FAO 1990b). Apparent annual per capita consumption of milled rice in 1978-82 was 35 kg (ITC 1984)
and milled rice food supply per capita in 1986-88 was 34 kg (FAO 1990a, IRRI 1991). About 60,000 ha of Mazandaran Province, which is about one-third of the total riceland in Iran, were planted to Amol 2 and Amol 3 (Sona) in 1984 (Dalrymple 1986).
Sadri varieties, which look like Basmati rices and have a similar ability to elongate when cooked, predominated. They had low-inter- mediate AC and medium GC (Appendix, Table 5), but were not as aromatic as Basmati rices. The 1985 samples had more high-AC entries than earlier samples. Many had negative Amylograph setback due to high peak viscosity but 7-10 kg/7 cm 2 cooked rice Instron hardness.
Cooked rice hardness correlated significantly with Amylograph setback ( r = 0.74**, n = 10) and consistency ( r = –0.65**), GC ( r = –0.70**, n = 11), alkali spreading value ( r = 0.73**), AC ( r = 0.69*), and grain width ( r = 0.60*). Gel consistency also correlated with Amylograph setback ( r = –0.79**, n = 11), AC ( r = –0.75**, n = 20), alkali spreading value ( r = –0.62**), and protein content ( r = 0.62**). Amylograph setback correlated with AC ( r = 0.76**, n = 22) and alkali spreading value ( r = 0.66**).
Japan
R ough rice production in Japan was 12.9 million t in 1989 (FAO 1990b). Annual consumption of milled rice per capita in 1979- 81 was 80 kg (FAO 1984), 77 kg in 1987 (Hirao 1990), 72 kg in
1986-88 (FAO 1990a, IRRI 1991), and 78 kg in 1988 (Duff 1991, RCMD 1989). Preferred varieties are Koshihikari in Niigata Prefecture and Sasanishiki in Miyagi Prefecture (Tohoku district only). Both have low AC and low-protein grains (S. Chikubu, Tokyo University of Agricul- ture, 1990, pers. commun.). In 1989, the major varieties by area planted were Koshihikari, Sasanishiki, and Nipponbare.
Starch-iodine blue value of cooked rice cooking water is <0.120 absorbance at 600 nm for very good quality rices, 0.121-0.179 for good- quality rices, and >0.180 for poor-quality rices. Starch-iodine blue value was used to index AC in low-AC Japanese rices with similar grain size and shape. Six market samples had 17-20% AC while a Hokkaido-grown rice had 22% (RCMD 1987,1989).
20 Grain quality evaluation of world rices

All Japanese rices analyzed at IRRI had low AC except five rices with intermediate AC and five waxy samples (Appendix, Table 5). All had low GT except Akenohoshi and the aromatic Hieri. Gel consistency values were either soft or medium. Koshihikari had lower AC and gave the softest cooked rice among the 1986 samples even when compared with other Japanese rices, including Sasanishiki.
Instron and Texturometer cooked rice hardness values were cor- related for 29 Japanese rices (Ohtsubo et al 1990). Cooked rice hard- ness-adhesiveness ratio by the Texturometer and hardness- stickiness ratio by the Instron Food Tester revealed good correlations in 29 Japanese rices for AC and other important cooking qualities of rice (Ohtsubo et al 1990). The rices had mainly short, bold grains.
Cooked rice stickiness correlated with AC ( r = –0.97**, n = 37) and GC ( r = 0.91**, n = 9), and GC correlated with Amylograph peak viscosity ( r = –0.82**, n = 9) and consistency ( r = –0.82**). Amylose content also correlated with Amylograph peak viscosity ( r = 0.60**, n = 17) and consistency ( r = 0.65**), as did protein content with Amy- lograph setback ( r = 0.649**). Amylograph consistency correlated with grain length ( r = 0.83*, n = 6) and width ( r = –0.83*).
T Korea, Republic of
he Republic of Korea's rough rice production in 1989 was 8.2 million t (FAO 1990b). Annual consumption of milled rice in 1979 was 135 kg per capita (IRRI 1991) and 133 kg in 1988 (Duff
1991). It is projected to decline to 100 kg by the year 2000 (RCMD 1987). Rice availability per capita in 1986-88 was 128 kg (FAO 1990a, IRRI 1991). Ricelands are mainly irrigated with 84% of production from ja- ponica rice and 16% from Tongil (indica-japonica) rice (RDA 1990). The improvements in Korean rice varieties were recently reviewed. Varie- ties released through 1989 were described (RDA 1990). In 1989, 20.8% of rice area was planted to Dongjinbyeo, 12.7% to Seomjinbyeo, and 8.9% to Samgangbyeo (RDA 1990).
Principal japonica varieties are Hwaseongbyeo in the middle and southern plains (soft texture), Yeongdeogbyeo (Yongjubyeo) in the southeast coastal region of the southern plains (good grain shape), and Chucheongbyeo (Akibare ex Japan) in the middle plain (good grain shape and soft texture) (G.S. Chung, Yeongnam Crop Experiment Station, Milyang, 1990, pers. commun.). All varieties had good trans- lucency. Market samples had 17-21% AC and low GT (RCMD 1987).
Asia 21

The Korean varieties had low-intermediate AC and low GT, except Suweon Jo, which had high AC (Appendix, Table 5). Of the three most important varieties, Hwaseongbyeo (20%) had intermediate AC, and Yongjubyeo (15%) and Chucheongbyeo (17%) had low AC. The earlier indica × japonica rices (such as Tongil) had harder GC than japonica rices at 120 mg/2 m10.2 N KOH (Perez and Juliano 1979). The newer varieties had soft GC, like japonica rices. The hardness of Milyang 23, for example, cannot be differentiated from that of freshly cooked Aki- bare (del Mundo et al 1989). All had low GT, soft GC, and similar grain size and shape. Tongil, Yushin, and the earlier indica × japonica rices had longer grain (>5.5 mm) than japonica rices (<5.5 mm). The Korean rices had short or medium length and bold or medium-shaped grains.
Grain length and width were correlated ( r = –0.64**, n = 18). Grain width correlated with Amylograph peak viscosity ( r = –0.78**, n = 17) and setback ( r = 0.74**) and cooked rice stickiness ( r = –0.30**, n = 106). Gel consistency and cooked rice stickiness were correlated ( r = 0.65**, n = 35), as were AC and Amylograph consistency ( r = 0.60**, n = 35).
Laos nnual rough rice production in the Popular Democratic Re- public of Laos was 1.2 million t in 1989 (FAO 1990b). Annual consumption of milled rice per capita was 160 kg in 1975-77
(IRRI 1991). Milled rice availability in 1986-88 per capita was 187 kg (FAO 1990a, IRRI 1991). Glutinous or waxy rice is the staple food in Laos, just as in north and northeast Thailand.
Waxy rices predominated over nonwaxy rices (Appendix, Table 5). The 1988 crop did not include any of the 1965 samples. All waxy samples had low GT, wider (2.6-2.9 mm) grains, medium short length, and medium or bold shape. The nonwaxy rices had mainly interme- diate AC. The waxy rices had the lowest Amylograph consistency and cooked rice Instron hardness (2-3 kg/7 cm 2 ) followed by Meto (12% AC), intermediate-AC rices, and high-AC Sulakham 2-18-3-1-1.
Cooked rice hardness correlated with Amylograph setback ( r = 0.92**, n = 12) and consistency ( r = 0.98**), GC ( r = –0.94**), AC ( r = 0.98**), and grain width ( r = –0.73**). Gel consistency also corre- lated with Amylograph setback ( r = –0.88**, n = 12) and consistency ( r = –0.89**), AC ( r = –0.95**), protein ( r = –0.64*), and grain width ( r = 0.72**). Amylose content correlated with Amylograph setback ( r = 0.70**, n = 15) and consistency ( r = 0.84**) and with grain width ( r = –0.80**, n = 12).
22 Grain quality evaluation of world rices
A

Grain width correlated with Amylograph setback ( r = –0.63*, n = 12) and consistency (r = –0.73**), protein content (r = –0.64*), and alkali spreading value ( r = 0.58*), whereas grain length correlated with protein content (r = 0.61*, n = 12), cooked rice hardness (r = 0.60*), and AC ( r = 0.63*).
Malaysia, East nnual rough rice production in Sabah was 112,000 t and 131,000 t in Sarawak in 1989 (MARDI data). The production in 1985 corresponded to 43% self-sufficiency in East Malaysia
(Sabah and Sarawak). Per capita consumption in 1985 was 141 kg. Sabah. Varieties preferred in Sabah and their special qualities are
MR7, soft, sticky texture; C4-63, soft; Madcandu, good grain shape, flavor; TR2, soft, good flavor; and TR7, good grain shape (J. Idris, Agricultural Research Centre, 1990, pers. commun.).
Sabah samples had high-intermediate AC, low-intermediate GT, and medium-hard GC (Table 5). MR7 and C4-63 had intermediate AC and high-intermediate GT (Appendix). Madcandu, TR2, and TR7 had high AC, but TR2 had medium GC and the others had hard GC. TR2 and Madcandu had high-intermediate GT; TR7 had low GT. Taichung- Sen-Yu-195 had the softest cooked rice; Madcandu and MR1 had the hardest.
Cooked rice hardness correlated significantly (n = 10) with GC (r = –0.72*) and AC (r = 0.72*). Gel consistency also correlated with alkali spreading value (r = –0.64*) and AC (r = –0.72*).
Sarawak. Important rice varieties by decreasing preference are Adan, strongly aromatic, hard texture, chalky; Biris, strongly aromatic, medium texture, translucent; Wai, strongly aromatic, medium texture, chalky; Wangi, strongly aromatic, hard texture, translucent; Sri Sara- wak, aromatic, medium texture, translucent; Acheh, aromatic, hard texture, translucent; Baru 3, aromatic, medium texture, slightly trans- lucent; Sampangan, aromatic, soft texture, translucent; and Serendah Kuning, aromatic, soft texture, slightly translucent (P. Sim, Agricul- tural Research Centre, 1990, pers. commun.)
Samples had mainly high AC, intermediate GT, and soft GC (Table 3). Adan had very low to low AC among the aromatic rice varieties (Appendix). Adan, Dari, and Adan Buda had 11-12% AC, high GT, and were chalky (tombstone white). They are probably used as a substitute for waxy rice. Sri Sarawak (14% protein) and Sampan- gan had intermediate AC, Baru 3 had low AC, and Acheh 62 and
Asia 23
A

Serendah Kuning had high AC, with either low or intermediate GT. Low-AC rices had the softest cooked rice, followed by intermediate- high AC rices. Adan Buda, with 11 % AC, had harder cooked rice (6 kg/ 7 cm2) than two other low (17%)-AC rices (4-5 kg/7 cm2 ).
The significant correlations were alkali spreading value with AC (r = 0.63**, n = 27) and GC with protein content (r = –0.45*, n = 21).
Malaysia, West
A nnual rough rice production in Malaysia was 1.7 million t in 1989 (FAO 1990b), of which 1.6 million was in West Malaysia. Self-sufficiency in rough rice production was 84% in West
Malaysia in 1985. Per capita rice consumption was 100 kg in 1985 (Wong et al 1991). Per capita supply of milled rice in 1986-88 was 83 kg (FAO 1990a, IRRI 1991), but this may be underestimated because official statistics do not reflect rice transactions in the illegal border trade with Thailand. Principal varieties in the Muda Development (95,000 ha) 1984 main season were IR42 (27%) and MRI (20%) and in the off-season, IR42 (41.5%), MR71 (26.3%), and MR1 (17.8%) (Dalrymple 1986). IR42 had low head rice yield in the Muda, particularly when harvested late or overdried (Ibabao et al 1987). Head rice is defined as milled grain retaining at least 75-80% the length of whole-grain milled rice.
Mahsuri, with good cooking quality, taste, medium grain, and stable yields, and Matcandu, with high AC, intermediate GT, soft GC, long, and slender grains, were popular from 1960 to 1970 (A.N. Husain, Malaysian Agricultural Research and Development Institute (MARDI), 1990, pers. commun.). Graded mixtures of long-grained rices Al, A2, B1, and B2 presently have high AC, low GT, and medium GC.
Imported Thai rices have long, slender grain, soft-cooked rice, high volume expansion, intermediate AC, low GT, and soft GC. Thai fragrant rice and Calrose with low AC are also imported. The Malay- sian Rice National Board (LPN) now imports aged Thai fragrant (Jasmine, low AC) rice. Low-intermediate AC is generally preferred over high AC (Husain 1984). Intermediate GT is preferred over low GT among high-AC rices. A market sample of A-1 rice had 24% AC and a mixture of low and intermediate GT grains (RCMD 1987).
The samples from West Malaysia were mostly high AC because of the recommended MARDI (MR) varieties (Table 5, Appendix). All Mahsuri samples had high AC, intermediate GT, and variable GC.
24 Grain quality evaluation of world rices

MR7 had intermediate AC. Three waxy rice samples (two Pulut Suding [or MR47] and Pulut Malaysia Satu) were represented, reflecting the popularity of waxy rice in Southeast Asia. Amylograph consistency and cooked rice hardness were lowest for waxy rices and highest for high AC rices such as Mahsuri, MR88, Muda, MR81, and MR84. The grains were mainly medium long and slender or medium-shaped.
Cooked rice hardness correlated with AC (r = 0.72**, n = 19) and GC (r = –0.54*, n = 20), whereas GC correlated with AC (r = –0.44**, n = 36) and Amylograph peak viscosity (r = –0.68**, n = 14) and consistency (r = –0.66**). Amylograph consistency also correlated with AC (r = 0.60**, n = 19) and grain length (r = –0.58*, n = 13).
Myanmar
M yanmar produced 13.6 million t of rough rice in 1989 (FAO 1990b). Annual consumption per capita in 1979-81 was 194 kg (FAO 1984) and 187 kg in 1988 (RCMD 1989). Milled
rice supply per capita in 1986-88 was 186 kg (FAO 1990a, IRRI 1991). Principal modern varieties in the 1983-84 season were Shwe-wa-tun (IR5 mutant) 38.7%, Shwe-ta-soke 22.77% and Manawhari (Mahsuri) 21.1% (Dalrymple 1986).
Important Myanmar varieties based on grain characteristics are classified as follows: high volume expansion, fair eating quality — Manawhari, Manawthukha, Shwe-wa-tun, and Sin-thein-gi (BR4); stickiness — Sein talay, Hmawbi-2 (long-grain), Shwe-man(l), Khau- pher-phu, Khaupher-phone, and Lone-thwe-hmwe (aroma); soft tex- ture—Inn-ma-ye-baw, Sin-Ekari(2), and Sin-Ekari(3); soft texture, long grain — Rakhinithuma, Padinthuma, and Ekarine; elongation on cook- ing, soft texture, high volume expansion — Nga Kywe and Paw-san- hmwe (aroma) (Sein Tun, Agricultural Research Institute, 1990, pers. commun.)
Export premium rices are classified as long-grained (Hmawbi-2, 15-25% extra long [>7 mm] 35-40% long [6.6-6.9 mm], 30-40% medium [6.2-6.5 mm], and 5-10% short [<6.2 mm]), Emata (Inn-ma-ye-baw and Yebaw lat, 15-25% long, 60% medium, and 15-25% short), Zeera (Hnangar, medium/short slender, up to 6.6 mm), and Pearl (short, bold L:W ~2, Nga Kywe and Pawsan) (MAPT 1990). Market samples of Emata rice had 18-26% AC; Ngasein, 26% AC; Nga Kywe 17,22% AC; and Zeera, 25.4% AC (RCMD 1987,1989).
The high-volume expansion varieties with fair eating quality had mainly high AC, low GT, and hard GC (Appendix). The sticky varieties
Asia 25

all had low AC (except for Khaupher-phone with 4.6% AC), low GT (except for Sein talay), and soft or medium GC. Soft textured varieties had low AC, low GT, and soft GC for Inn-ma-ye-baw and Sin-Ekari(3), and high AC, intermediate-low GT, and hard-medium GC for Sin- Ekari(2), Padinthuma, and Ekarine. Nga Kywe and Paw-san-hmwe had intermediate AC, soft GT, and medium GC. Nga Kywe elongated more than Basmati rices when raw rice was precooked. The cooked rice length was shorter because it was a medium grain variety. Grain type ranged from long to short and slender to bold.
Cooked rice hardness correlated significantly with GC ( r = 0.93**, n = 13), AC ( r = 0.66*, n = 13), and Amylograph setback ( r = 0.99**, n = 6) and consistency ( r = 0.99**). Gel consistency correlated signifi- cantly with Amylograph setback ( r = –0.93**, n = 7) and consistency ( r = –0.97**), and AC (r = –0.68**, n = 51). Amylose content also correlated significantly with Amylograph setback ( r = 0.80**, n = 16) and consistency ( r = 0.58*). Milled rice length correlated negatively with Amylograph consistency ( r = –0.96**, n = 15) and setback ( r= –0.94**).
Nepal
A nnual rough rice production in Nepal was 3.4 million t in 1989 (FAO 1990b). Annual consumption of milled rice per capita was 98 kg in 1979-81 (IRRI 1991) and 89 kg in 1988 (Duff 1991).
Milled rice supply per capita in 1986-88 was 96 kg (FAO 1990a, IRRI 1991). Important varieties in 1983 were CH 45, Taichung 176, Chianung 242, Masuli (Mahsuri), Durga, Laxmi (IR2061-628-1), Sabitri (IR2071- 124-6-4), Janaki, and Bindeswari (Dalrymple 1986).
The majority of these varieties had high AC, except Taiwanese varieties Taichung 176 and Chianung 242, which had low-intermediate AC and low GT (Appendix, Table 5). Varieties analyzed at IRRI mainly had high AC, but many low- and intermediate-AC samples were included.
Popping varieties from Nepal had high and intermediate AC. Medium, short, and medium- to slender-shaped grains were repre- sented but length and width were not related to AC. Low-AC IET2938 had the lowest cooked rice Instron hardness and Amylograph setback and consistency, and IR2071-124-6-4 (Sabitri) had the highest values.
Cooked rice hardness correlated with Amylograph setback ( r = 0.91**, n = 9) and consistency ( r = 0.92**), AC ( r = 0.85**), and stickiness ( r = –0.90**). Cooked rice stickiness correlated with Amylo-
26 Grain quality evaluation of world rices

graph set-back ( r = –0.89**, n = 9) and consistency ( r = –0.92**), and AC ( r = –0.98**). Amylose content also correlated with Amylograph set- back ( r = 0.82**, n = 14) and consistency ( r = 0.86**).
Pakistan
A nnual rough rice production in Pakistan was 4.8 million t in 1989 (FAO 1990b). Annual consumption of milled rice per capita in 1979-81 was 23 kg (FAO 1984) and 21 kg (Duff 1991)
or 19.2 kg (RCMD 1989) in 1988. Milled rice supply per capita in 1986- 88 was 16 kg (FAO 1990a, IRRI 1991). About 95% of Pakistan’s rice production is concentrated in Punjab and Sind (Dalrymple 1986).
In Punjab, 1.1 million ha are grown to Basmati rice and 0.1 million ha to IR6-type rices (A. Majid, Rice Research Institute, 1990, pers. commun.). More than 80% of the 1989 Basmati crop is Basmati 385 (PK487), which has yielded 50% more than Basmati 370. Mehran 69 (IR6-156-2) is the principal variety in the Dokri region. Market samples of Basmati had intermediate AC; IRRI-6 had high AC (RCMD 1987, 1989).
Rices from Pakistan had mainly intermediate-high AC, low GT, and hard GC (Table 5). Both fine aromatic, elongating Basmati-type rices and coarse IR6(Mehran)-type rices from Pakistan were repre- sented (Appendix).
Grain was medium or long, and slender or medium-shaped. Good Basmati rices had uniformly chalky grain, intermediate AC, low GT, and medium GC (represented by the Punjab crop). The Dokri crop had intermediate GT and less elongation. Basmati 385 had properties similar to those of Basmati 370, including elongation, but it yielded more. Mehran 69 had better eating quality than IR8, but similar properties (high AC, low GT, hard GC), probably because of its more slender grain. Both Mehran 69 and Basmati rices were exported. Basmati-type rices gave lower Amylograph setback and consistency and cooked rice Instron hardness than IR6-type rices.
Cooked rice hardness correlated significantly with AC ( r = 0.65**, n = 28), Amylograph setback ( r = 0.69**, n = 19) and consistency ( r = 0.62**), and alkali spreading value ( r = 0.54**, n = 28). Amylose content also correlated with Amylograph setback ( r = 0.74**, n = 33) and consistency ( r = 0.66**). Gel consistency and alkali spreading values were correlated ( r = –0.47**, n = 55).
Asia 27

Philippines
T he Philippines produced 9.5 million t of rough rice in 1989 (FAO 1990b). Annual consumption of milled rice per capita in 1979-81 was 91 kg (IRRI 1991) and 105 kg in 1988 (Duff 1991).
Milled rice supply per capita in 1986-88 was 90 kg (FAO 1990a, IRRI 1991). Rices with intermediate AC and soft GC are preferred (Merca et al 1979; P.B. Escuro, Rice Varietal Improvement, Philippine Rice Re- search Institute, College, Laguna, 1990, pers. commun.). Three market samples of local rices had 22-25% AC (RCMD 1989).
Grain size was mostly medium, followed by short and long. Shape was predominantly medium, then slender or bold. All IR varieties were included under the Philippines (Appendix). Most had high AC, low-intermediate GT, and variable GC (Table 5) as reported by Khush and Juliano (1985). The softer textured rices such as IR5, IR32, IR62, IR66, and IR72 had soft GC and intermediate GT characteristic of traditional varieties. Among the two intermediate-AC rices, IR64 had softer cooked rice than IR48 (low GT), but cooked IR64 tended to harden quickly when stored. IR24 and IR43, the low-AC rices, had sticky cooked rices. Waxy IR29 and IR65 had replaced Malagkit Sung- song, a japonica variety, in waxy rice preparations, but they lacked the tackiness and aroma of Malagkit Sungsong. Waxy rices included low- and high-GT samples and black Tapol and Perurutong rices.
The traditional upland varieties Kinandang Patong, Milagrosa, Dinorado, Intan, and Palawan had 18-22% AC and low-intermediate GT, suggesting preference for this AC range. C4-63 had intermediate AC. Wagwag was a medium slender variety popular in Luzon with high AC and intermediate GT. IR42, with similar grain size and shape, substituted for it (Juliano et al 1989). The new upland variety Makiling had intermediate AC.
Amylograph viscosity and cooked rice Instron hardness varied widely: it was lowest for waxy rices and highest for high-amylose rices (Appendix). Waxy rices varied widely in Amylograph peak viscosity, most of them with <500 BU.
Cooked rice hardness correlated with stickiness ( r = –0.84**, n = 15), Amylograph setback ( r = 0.66**, n = 125) and consistency ( r = 0.65**), AC ( r = 0.50*, n = 163), and GC ( r = –0.59**, n = 165). Stickiness of cooked rice correlated with Amylograph peak viscosity ( r = –0.94**, n = 10) and consistency ( r = –0.68*), and grain width ( r = 0.61*). Amylose content also correlated with Amylograph setback ( r = 0.55**, n = 209) and consistency ( r = 0.70**), grain width ( r = –0.56**, n = 142), and GC
28 Grain quality evaluation of world rices

(r = –0.55**, n = 239). Amylograph setback correlated with alkali spreading value ( r = 0.45**, n = 212) and GC ( r = –0.46**, n = 144).
Sri Lanka
A nnual rough rice production in Sri Lanka was 2.1 million t in 1989 (FAO 1990b). Annual consumption of milled rice per capita in 1979-81 was 95 kg (FAO 1984). Milled rice supply per
capita in 1986-88 was 101 kg (FAO 1990a, IRRI 1991). Parboiled rice is preferred in most of the country, except in the south (RCMD 1987). Bg34-8, Bg94-1, and Bg276-5 (3-3.5-mo rices) comprised 52% of the total rice area in 1982-83 (Dalrymple 1986). Bg11-11, Bg90-2, Bg379-2, and Bg400-1 are 4-4.5-mo varieties; Bg3-5 is 5-6 mo. Consumers in Kandy district prefer undermilled red parboiled rice with medium grain size (Breckenridge 1979). A local red and a white milled rice from the market had high AC and intermediate GT (RCMD 1987).
Grains had short or medium length and medium or bold shape. Roundish milled (short bold) grains about 4 mm long and 2.3-3.1 mm wide characterized Podiwi A-8 and Bgl1-11 (Appendix). These samba varieties were probably priced over the medium-sized and -shaped grain varieties because of intermediate GT, medium-soft GC, and roundish shape. All had high AC. Many of the varieties had red pericarp (such as H-4). Varieties differed in Amylograph viscosity and cooked rice hardness, despite the narrow AC range (Table 5). Some did not show distinct Amylograph peak viscosity but instead reached a plateau even less than 500 BU.
Cooked rice hardness correlated with stickiness (r = –0.71**, n = 31). Protein content correlated with grain length (r = –0.53**, n = 30), Amylograph peakviscosity (r = –0.44**, n = 46) and setback (r = 0.52**), and cooked rice stickiness (r = –0.48**, n = 31). Grain length correlated with Amylograph peak viscosity (r = 0.54**, n = 22).
Taiwan, China
T aiwan, China, produced 2.4 million t of rice in 1989 (FAO 1990b). About 89% was short-grained japonica with relative- ly low AC. Only 3.6% was waxy rice, and the rest, indica rice
(Huang 1987). Per capita consumption of milled rice was 133 kg in 1964-66,105 kg in 1980, and 85 kg in 1986 (Huang 1987) and in 1988 (Duff 1991). The population prefers short-grained japonica rice with
Asia 29

relatively low AC (Y.C. Teng, Council of Agriculture, Food and Agri- culture Division, Taipei, Taiwan, 1990, pers. commun.).
Varieties with high milling yield, good appearance, and low AC include Tainan 9, Taiken 1, Taiken 2, Taichung 189, Tainung Sen 20, Taichung Sen 10, and Taisen 1 (Song 1990). Indica rices (Tainung Sen 20, Taichung Sen 10, Taisen 1) usually have 2% more protein than japonica rices (Tainan 9, Taiken 1, Taiken 2, Taichung 189). These rices all have low AC, low GT, and soft GC, unlike the earlier native indica varieties, such as Taichung Native 1, that have high AC, hard GC, and low GT. Market samples of japonica and indica rices (two of each) had low AC and low GT (RCMD 1987).
Low AC, low GT, and soft GC predominated in rice samples (Table 5). Analyses confirmed the low AC of the new native indica varieties (Appendix) although they still had longer grains (medium length and size) than japonicas (short, bold grain) (TCA 1987). Grains of indica waxy rices were still longer than those of waxy japonicas. Even among waxy rices, indicas Taichung Sen Glutinous 1 and Tainung Sen Gluti- nous 2 had harder cooked rice and higher protein than japonica rices Taichung Glutinous 70 and Tainan Glutinous Yu 7 (Appendix). Indicas in China also had higher protein content than japonicas.
Grain length and width were negatively correlated ( r = –0.85**, n = 42). Cooked rice hardness correlated significantly with stickiness ( r = –0.86**, n = 14), and GC ( r = –0.70**, n = 30). Amylose content correlated significantly with Amylograph setback ( r = 0.57**, n = 40) and consistency ( r = 0.78**, n = 40), and GC ( r = –0.65**, n = 58).
Thailand
A nnual rough rice production in Thailand was 21.3 million t in 1989 (FAO 1990b). Annual per capita consumption of milled rice in 1979-81 was 145 kg (FAO 1984) and 153 kg in 1988 (Duff
1991). Milled rice supply per capita in 1986-88 was 135 kg (FAO 1990a, IRRI 1991) .
Long (>7 mm), slender grains are preferred (Kongseree 1979). Prin- cipal varieties are Khao Dawk Mali 105 (low AC, aromatic), RD7 (inter- mediate AC), and Leuang Pra Tew 123 (high AC) in the central region; Khao Dawk Mali 105, RD6 (waxy, aromatic), and RD15 (low amylose, aromatic) in the north; and Khao Dawk Mali 105 and RD15 in the northeast (N. Kongseree, Pathum Thani Rice Research Center, 1990, pers. commun.). RD15 is similar to Khao Dawk Mali 105 in quality. Thai export rices vary in AC as raw rice but have mainly intermediate and
30 Grain quality evaluation of world rices

high amylose in parboiled rice (Juliano et al 1990). The processing quality is more variable than that of US long-grained rices. Market samples of Thai rices had low-intermediate AC (RCMD 1987, 1989).
Grains were mainly long and slender, followed by medium-sized and -shaped types (Appendix). Our analysis verified Thai data that principal rice varieties exhibited different AC types (Table 5). Most samples (particularly Khao Dawk Mali 105) had clear, translucent grains, unlike IR841-67-1 (IR262-43-8-11 /Khao Dawk Mali 105) grown at IRRI. Deepwater rices had mostly high AC, except for waxy Nahng Chalong. All the waxy rices had low GT except for the harder textured RD4. RD6, a selection from irradiated Khao DawkMali 105 (RRI 1982), had a texture close to that of traditional variety Niaw San Pahtawng. Aromatic rices Khao Dawk Mali 105 and RD15 were exported as Jasmine rice. Both had low AC, low GT, and soft GC. RD15 was produced by the ionizing radiation on Khao Dawk Mali 105. It matured 1 wk earlier than the parent.
RD7 is the most popular short-statured variety to date. It has the intermediate AC and high-intermediate GT of its parent C4-63G (RRI 1982). Nahng Mon S-4 is a popular aromatic Thai variety with interme- diate AC.
Cooked rice hardness correlated with stickiness (r = –0.86**, n = 14), Amylograph peak viscosity ( r = 0.77**, n = 13), setback ( r = 0.64*) and consistency ( r = 0.92*), AC ( r = 0.86**, n = 31), GC (r = –0.72**, n = 38), protein content ( r = –0.57**, n = 38), and grain length ( r = 0.44**, n = 37). Amylose content correlated with Amylograph peak viscosity ( r = 0.47**, n = 48), setback ( r = 0.70**) and consistency ( r = 0.84**), GC ( r = –0.63**, n = 60), and grain length (r = 0.43**, n = 43). Gel consistency also correlated with Amylograph setback ( r = –0.68**, n = 31) and grain length ( r = –0.45**, n = 50). Grain length also correlated with Amylo- graph peak viscosity (r = 0.69**, n = 15), setback (r = 0.59*), and consistency ( r = 0.60*).
Turkey
T urkey produced 330,000 t of rough rice in 1989 (FAO 1990b). Annual consumption per capita of milled rice in 1979-81 was 4 kg (FAO 1984). An apparent value for 1981 was 4.9 kg/capita
(ITC 1984) and 4.7 kg in 1988 (RCMD 1989). Milled rice food supply per capita was 5.3 kg in 1986-88 (FAO 1990a). Market samples of locally grown rices had L-W >2, low AC, and low GT (RCMD 1989). Eight
Asia 31

other market samples had low AC, except for Maratelli with 23% AC (RCMD 1987,1989).
All Turkish rice varieties had low AC (except for IZ68 with 20.7% AC) and low GT (except for BAL/SK [5Y03]) (Appendix, Table 5). Many Italian varieties were grown with Russian variety Krasnodarsky and Spanish variety Sequial. IZ68 had the highest L-W of 2.7; Krasnodar- sky had the lowest at 1.6. Grains were mostly medium-sized but varied from long to short. Most were medium-shaped. Rocca had the softest cooked rice and Baldo the hardest, probably because of the latter's high protein content (10%).
Cooked rice hardness correlated with protein content ( r = 0.77**, n = 14), GC ( r = –0.90**), and AC ( r = 0.62*). Amylose content correlated with Amylograph peak viscosity ( r = –0.74**), setback ( r = 0.84**) and consistency ( r = 0.57*), and GC ( r = –0.74**). Grain length correlated with protein content ( r = 0.61**), GC ( r = –0.60*), and grain width ( r = 0.59*). Gel consistency correlated also with Amylograph peak vis- cosity ( r = 0.59**) and setback ( r = –0.74**), and protein content ( r = –0.82**). Alkali spreading value correlated with AC ( r = 0.53*) and Amylograph peak viscosity ( r = –0.58*) and setback ( r = 0.53*).
Vietnam
A nnual rough rice production in Vietnam was 18.1 million t in 1989 (FAO 1990b). Annual per capita consumption of milled rice was 122 kg in 1979-81 (IRRI 1991). Milled rice food supply
per capita in 1986-88 was 146 kg (FAO 1990a, IRRI 1991). The important Vietnamese rice varieties in the various regions and their special properties are (L.T. Thuy, University of Cantho, Mekong Delta Farm- ing Systems Research and Development Centre, 1990, pers. commun.):
Variety Province Property
Nang Thom Long An Aromatic, soft texture Tau Huong Hau Giang Aromatic, soft texture Lua Thom Cuu Long Aromatic Huyet Rong Long An, Hau Giang Very aromatic, high volume
Mong Chim Roi Kien Giang Long grain, high volume
Mot Bui Lun Kien Giang, Minh Long grain, high volume
expansion
expansion
Hai expansion
32 Grain quality evaluation of world rices

Chin Henh Kien Giang Long grain, high volume
Tau Bun Cuu Long, Hau Long grain, high volume expansion
Giang expansion
IR36 was planted in 60% of the southern ricelands in 1981 but only in pockets in the north (Dalrymple 1986).
Short grains and medium shape predominated because many traditional varieties were included (Appendix). Vietnamese rice samples mostly had high AC (Appendix, Table 5), but Nang Thom and Tau Huong had intermediate AC and GT, and were aromatic and soft- textured. Lua Thom, Huyet Rong, Mong Chim Roi, Mot Bui Lun, Chin Henh, and Tau Bun had high AC and high volume expansion. A black waxy rice Nep Cam had low GT, very low Amylograph viscosity, and gave the softest cooked rice. Nonwaxy rice samples in 1990 included two with intermediate AC and one with high AC. Low- and interme- diate- AC rices had lower Amylograph setback and consistency and cooked rice Instron hardness than high-AC, hard-GC rices. Intermedi- ate-GT, high-AC rices had softer cooked rice than low-GT, high-AC rices with hard GC.
Cooked rice hardness correlated with Amylograph setback ( r = 0.62**, n = 33) and consistency ( r = 0.66**), GC ( r = –0.58**, n = 67), and AC ( r = 0.59*, n = 67). Gel consistency correlated with Amylograph setback ( r = –0.58**, n = 33) and consistency ( r = –0.55**), and alkali spreading value ( r = –0.63**, n = 122). Amylose content also cor- related with Amylograph setback ( r = 0.44**, n = 43) and consistency ( r = 0.57**), and with protein content ( r = –0.42**, n = 133). Alkali spreading value also correlated with Amylograph peak viscosity ( r = –0.55**, n = 43), setback ( r = 0.69**), and consistency ( r = 0.50**). Grain length correlated with grain width ( r = –0.35**, n = 97) and with protein content ( r = –0.40**).
Asia 33

Summary Medium grains predominate in Cambodia, India, Indonesia, Laos, West Malaysia, Nepal, Pakistan, Philippines, and Turkey, while short grains predominate in Bangladesh; Bhutan; China; Japan; Republic of Korea; Taiwan, China; and Vietnam (traditional varieties). These short- grained rices are mainly bold-shaped in Bhutan; China; Japan; Repub- lic of Korea; and Taiwan, China, but medium-shaped in the others. Medium and short grains are important in Sri Lanka. Indica/japonica Korean rices tend to have medium grains. Long, slender grains pre- dominate in exporting countries such as Thailand and Myanmar, and in Iran and Brunei. High-AC rices predominate in Asia, except in Bhutan; Iran; Japan; South Korea; Laos; Myanmar; Pakistan; Taiwan, China; and Turkey (Table 5). Waxy rices predominate over intermedi- ate-AC rice in Laos. Low-AC rices predominate in Taiwan, China; Japan; South Korea; and Turkey, and intermediate-AC rices in Bhutan, Iran, Myanmar, and Pakistan.
Waxy rices are preferred in Laos and North Thailand as a staple; low-AC rices in Taiwan, China; Japan; South Korea; Nepal; Turkey; and Northeast Thailand; low-intermediate AC in northern China (ja- ponica) and Iran; intermediate-AC rices in Cambodia, Basmati-con- suming regions of India and Pakistan, Indonesia, Malaysia, Myanmar, Philippines, Central Thailand, and Vietnam; and high-AC rices in Bangladesh, South China (indica), India, Pakistan, Philippines, Sri Lanka, and Thailand. Soft GC is preferred over hard GC among high-AC rices, except for making noodles.
Out of 24 countries/regions, cooked rice hardness correlates with AC in 19, with GC in 15, with alkali spreading value in 7, with Amylograph setback in 17, and with Amylograph consistency in 13. Amylose content correlates with GC in 15 regions, with Amylograph setback in 21, and with Amylograph consistency in 20. Gel consistency correlates significantly with Amylograph setback in 11 countries and with Amylograph consistency in 13 countries, Alkali spreading value correlates significantly with Amylograph setback in six countries and with Amylograph consistency in five locations. Amylograph setback correlates with consistency in 21 locations. Amylose content seems a better grain quality index in Asia than GC and alkali spreading value.
34 Grain quality evaluation of world rices

Oceania
Australia
A ustralia produced 0.8 million t of rough rice in 1989 (FAO 1990b). Annual milled rice consumption in 1979-81 was 6 kg/ capita (FAO 1984) and 5.84 kg in 1988 (RCMD 1989). Milled
rice supply per capita was 6.0 kg in 1986-88 (FAO 1990a). Both medium- (70%) and long-grained (30%) varieties are grown
(RCMD 1989). Medium-grained varieties are Calrose type (A.B. Blakeney, Yanco Agricultural Institute, 1990, pers. commun.).
Amaroo was the major variety; Echuca (YRM6) was planted late. Bogan yielded poorly but had better translucency than Echuca. YRB1 had white belly similar to that of Amaroo and the Spanish variety Bahia. All had low AC, low GT, and soft GC (Appendix).
Australian rices had mainly low AC, low GT, and soft GC (Table 5). Grain size varied from long to short; shape was slender to bold (Appendix). The major long-grained variety was Pelde, which had soft-textured cooked rice. Pelde replaced Inga, which had a problem with chalkiness during some seasons (Blakeney 1979). YRF6 (Goola- rah) had high aroma, soft, long grain, very good translucency, and intermediate cooked grain expansion. YRF6 is similar to Thai jasmine rice. Both had low AC, low GT, and soft GC (Appendix).
YRL25 (Doonqara) is a firm-cooking, long-grained variety with high AC, low GT, and soft GC. Queensland produced long-grained rices from the southern USA, such as Finn and Lamont, Queensland Bluebonnet had 23% AC; Inga from New South Wales, 17-18% AC; and Calrose, 18% AC (RCMD 1987). Doonqara had the hardest cooked rice Instron value. Yau Jim rice, obtained from Hongkong as an Australian import, was probably not Australian because of its high AC (29%).

Grain length and width were negatively correlated ( r = –0.75**, n = 15). Linear correlation coefficients were highly significant between cooked rice stickiness of five nonwaxy and one waxy rice and GC ( r = –0.93**) and Amylograph consistency ( r = –0.95**), between alkali spreading value and Amylograph peak viscosity ( r = –0.76**, n = 14), and between Amylograph peak viscosity and consistency ( r = –0.72**, n = 14). Gel consistency and AC were negatively correlated ( r = –0.44*, n = 20), whereas AC correlated positively with Amylograph consis- tency ( r = 0.62*, n = 13) and cooked rice hardness ( r = 0.61*, n = 14); alkali spreading value correlated with Amylograph setback ( r = 0.59*, n = 14).
New Zealand
N ew Zealand grew rice in 1970 but cancelled the project. The four 1970 crop samples all had intermediate AC, low GT, and soft GC (Table 5, Appendix).
36 Grain quality evaluation of world rices

North, Central, and South America
North and Central America
T
C
otal rough rice production in 1988 was 9.5 million t (1.9% of world total) (FAO 1990b). Rough rice food supply in 1986-88 was 5.2 million t (FAO 1990a) and per capita food supply was
9 kg milled rice/yr (FAO 1990a).
Costa Rica osta Rica produced 234,000 t of rough rice in 1989 (FAO 1990b). Annual consumption of milled rice in 1979-81 was 37 kg/capita (FAO 1984). Mean annual supply of milled rice
per capita in 1986-88 was 40 kg (FAO 1990a). Seed sales in 1983 were 90.6% CR1113,7.0% CR5272, and 2.4% CR201 (Dalrymple 1986). Cen- tro Internacional de Agricultura Tropical (CIAT) estimated that 72,300 ha were planted to modern varieties in 1981-82, virtually all of it (97%) as upland rice.
CR1113 had high AC, low GT, and hard GC, whereas CR5272 had intermediate AC (Table 6, Appendix). CR1821 had high AC and the highest Amylograph setback and consistency. Samples showed high Instron cooked rice hardness. The high Amylograph setback and consistency, cooked rice Instron hardness, hard GC, and high protein suggest that all are probably high-AC rices. The decrease in AC may be partially because of high protein content. CR1113 and CR1707 were long-grained; CR1821 and CR5272, medium-grained. Shape was mainly slender (CR1821 was medium).
Amylograph peak viscosity correlated with protein content (r = 0.99**, n = 3) and grain width (r = –0.99**).
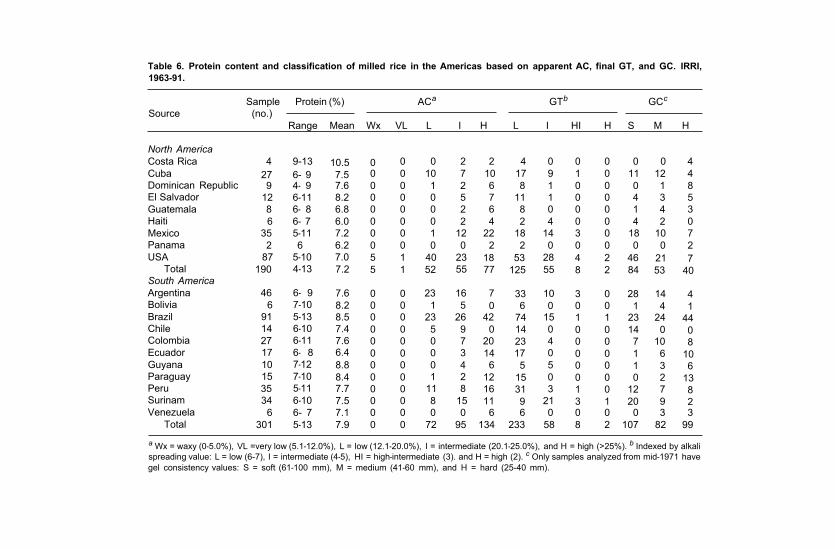
Table 6. Protein content and classification of milled rice in the Americas based on apparent AC, final GT, and GC. IRRI, 1963-91.
Sample Protein (%) AC a GT b GC c
Source (no.) Range Mean Wx VL L I H L I HI H S M H
North America Costa Rica Cuba Dominican Republic El Salvador Guatemala Haiti Mexico Panama USA
Total South America Argentina Bolivia Brazil Chile Colombia Ecuador Guyana Paraguay Peru Surinam Venezuela
Total
4 9-13 10.5 0 0 0 2 2 4 0 0 0 0 0 4 27 6- 9 7.5 0 0 10 7 10 17 9 1 0 11 12 4 9 4- 9 7.6 0 0 1 2 6 8 1 0 0 0 1 8
12 6-11 8.2 0 0 0 5 7 11 1 0 0 4 3 5 8 6- 8 6.8 0 0 0 2 6 8 0 0 0 1 4 3 6 6- 7 6.0 0 0 0 2 4 4 2 0 0 4 2 0
35 5-11 7.2 0 0 1 12 22 18 14 3 0 18 10 7 2 6 6.2 0 0 0 0 2 2 0 0 0 0 0 2
87 5-10 7.0 5 1 40 23 18 53 28 4 2 46 21 7 190 4-13 7.2 5 1 52 55 77 125 55 8 2 84 53 40
46 6- 9 7.6 0 0 23 16 7 33 10 3 0 28 14 4 6 7-10 8.2 0 0 1 5 0 6 0 0 0 1 4 1
91 5-13 8.5 0 0 23 26 42 74 15 1 1 23 24 44 14 6-10 7.4 0 0 5 9 0 14 0 0 0 14 0 0 27 6-11 7.6 0 0 0 7 20 23 4 0 0 7 10 8 17 6- 8 6.4 0 0 0 3 14 17 0 0 0 1 6 10 10 7-12 8.8 0 0 0 4 6 5 5 0 0 1 3 6 15 7-10 8.4 0 0 1 2 12 15 0 0 0 0 2 13 35 5-11 7.7 0 0 11 8 16 31 3 1 0 12 7 8 34 6-10 7.5 0 0 8 15 11 9 21 3 1 20 9 2
6 6- 7 7.1 0 0 0 0 6 6 0 0 0 0 3 3 301 5-13 7.9 0 0 72 95 134 233 58 8 2 107 82 99
a Wx = waxy (0-5.0%), VL =very low (5.1-12.0%), L = low (12.1-20.0%), I = intermediate (20.1-25.0%), and H = high (>25%). b Indexed by alkali spreading value: L = low (6-7), I = intermediate (4-5), HI = high-intermediate (3). and H = high (2). c Only samples analyzed from mid-1971 have gel consistency values: S = soft (61-100 mm), M = medium (41-60 mm), and H = hard (25-40 mm).

Cuba
C uba produced 532,000 t of rough rice in 1989 (FAO 1990b). Annual consumption per capita in 1979-81 was 48 kg milled rice (FAO 1984). Mean food supply of milled rice per capita in
1986-88 was 52 kg/yr (FAO 1990a). About 70% of ricelands in 1984 were planted to Jucarito 104, 15% to IR880-C9,10% to Naylamp, and 5% to Caribe I (Dalrymple 1986). Three market samples had high AC and low GT (RCMD 1987).
Grain quality breeding goals are low-intermediate AC, soft GC, L-W ratio >3, >5% head rice (from rough rice) >90% translucency (D. Castillo, Instituto de Investigaciones del Arroz, 1991, pers. commun.). IR1529, IAC13, and IAC15 have good head rice yield (>55%) and >90% translucency, low AC, and low GT. Intermediate GT is compatible only with intermediate AC. Grain fissuring is reported to be a problem contributing to low head rice yield not only in Cuba but in all Latin American rice-producing countries.
Rices from Cuba were all nonwaxy AC types, with low-intermedi- ate GT, and medium-soft GC (Table 6). Jucarito 104 had intermediate AC and GT, and medium GC (Appendix), but was susceptible to grain breakage and had a chalkiness problem (50% translucency). IR880-C9, Naylamp, and Caribe I had high AC, low GT, and medium-hard GC. Naylamp and IR880-C9 samples in 1985 had harder cooked rices than Caribe I and Jucarito 104. Three new varieties (IAC13, IAC14, and IAC15) all had low AC and soft GC (Appendix).
Cooked rice stickiness correlated significantly with cooked rice hardness ( r = –0.93**, n = 10), Amylograph setback ( r = –0.94**) and consistency ( r = –0.90**), GC ( r = 0.88**), and AC ( r = –0.98**). Amylose content correlated with GC ( r = –0.87**, n = 24) and Amylograph setback ( r = 0.82**) and consistency ( r = 0.75**). Gel consistency also correlated with Amylograph setback ( r = –0.72**, n = 24) and consis- tency ( r = –.72**). Cooked rice hardness also correlated with protein content ( r = 0.61**, n = 24).
Dominican Republic
T he Dominican Republic produced about 467,000 t rough rice in 1989 (FAO 1990b). Annual consumption per capita of milled rice was 44 kg in 1979-81 (FAO 1984) and 50 kg in 1986-
88 (FAO 1990a). Varieties grown in 1981-82 were Juma 58 (28%), Juma 57 (23%), Tanichi (25%), 44/40 (12%), IR8 (2%), and other locals (20%)
North, Central, and South America 39

(Dalrymple 1986). A market sample of selection Tono Brea had high AC (RCMD 1987).
The rice samples had mainly high AC, low GT, and variable GC (Table 6, Appendix). Of seven varieties analyzed in 1989-90, Juma 63 had low AC, intermediate GT, and medium GC (Appendix). Juma 57 and Tanioka had intermediate AC. The rest had high AC, low GT, and hard GC. Grains were fissured, dimensions could not be measured. Juma 58 had long, slender- to medium-shaped grain. Juma 63 had the softest cooked rice and Juma 61 had the hardest; Amylograph setback and consistency values confirmed this.
Cooked rice hardness correlated with Amylograph setback ( r = 0.98**, n = 7) and consistency ( r = 0.96**), AC ( r = 0.96**), alkali spreading value ( r = 0.89**), and GC ( r = –0.97**). Amylose content correlated with GC ( r = –0.94**, n = 9), alkali spreading value ( r = 0.93**), and Amylograph setback ( r = 0.90**, n = 7) and consistency ( r = 0.86*). Gel consistency also correlated with alkali spreading value ( r = –0.94**, n = 9) and Amylograph setback ( r = –0.93**, n = 7) and consistency (r = –0.89**). Alkali spreading value also correlated with Amylograph setback ( r = 0.80*, n = 7).
El Salvador
R ough rice production in El Salvador was 63,000 t in 1989 (FAO 1990b). Annual consumption of milled rice per capita in 1986- 88 was 10 kg (FAO 1990a). Modern varieties grown in El
Salvador in the early 1980s included CR1113, Nilo 9, Nilo 11, X-10, CICA 4, CICA 6, CENTA A2, and CENTA A3 (Dalrymple 1986).
The rices had high-intermediate AC, low GT, and variable GC (Table 6). Rices received for the 1979 crop had predominantly interme- diate AC (Appendix). All the 1990 crop samples had high AC and low GT. Grain was mainly long and slender or medium-shaped. CENTA A5 had extra long, slender grain and gave the softest cooked rice among the samples. The high-AC samples in 1979, Nilo 1 and CICA-9, also had soft cooked rice.
Cooked rice hardness correlated with GC ( r = –0.83**, n = 12), Amylograph setback ( r = 0.88**, n = 12) and consistency ( r = 0.87**), and grainlength ( r = –0.92*, n = 5) and width ( r = 0.90*). Gel consistency also correlated with Amylograph setback ( r = –0.78**, n = 12) and consis- tency ( r= –081**), and alkali spreading value ( r = –0.82**). Amylograph viscosity correlated with protein content ( r = –0.76**).
40 Gram quality evaluation of world rices

Guatemala
G uatemala produced 51,000 t of rough rice in 1989 (FAO 1990b). Annual per capita consumption of milled rice in 1979-81 was 4 kg (FAO 1984). Milled rice supply per capita in 1986-88 was
4.4 kg/yr (FAO 1990a). About 60% of total rice area in 1980 was planted to Tikal 2, a sister line of CICA 9 (Dalrymple 1986).
Guatemalan rices had predominantly high AC, low GT, and vari- able GC (Table 6, Appendix). ICTA Motagua Lisa and Pico Negro were the two intermediate AC rices. Pico Negro had the softest gel consis- tency and Instron cooked rice and also the lowest Amylograph setback and consistency. Grains were long and slender.
Grain length and width were correlated ( r = 0.86*, n = 8). Gel consistency correlated significantly with Amylograph setback ( r = –0.91**, n = 7) and consistency ( r = –0.86**), cooked rice hardness ( r = –0.81*) and grain width ( r = 0.73*). Cooked rice hardness correlated with Amylograph setback ( r = 0.88**, n = 7) and grain length ( r = 0.85*). Grain length and Amylograph setback were also correlated ( r = 0.87*, n = 7).
Haiti
H aiti produced 108,000 t rough rice in 1989 (FAO 1990b). Rice availability per capita in 1986-88 was 14 kg/yr (FAO 1990a). During 1983-84, the rice area was fairly evenly divided among
ODVA 1, MCE 3, and Quisqueya (Dalrymple 1986). The six samples had 6-7% protein and had either high AC, low GT,
soft GC, or intermediate AC and GT and medium GC (Table 6). The high-AC rices were medium- or long-grained with medium shape; the intermediate-AC rices were medium or long and slender (Appendix). Setback was positive for the high-AC rices but negative for the interme- diate-AC rices. Crête a Pierrot had the highest Amylograph peak viscosity. Amylograph consistency overlapped between the two AC types.
Cooked rice Instron hardness correlated with Amylograph setback viscosity ( r = 0.90*, n = 6), AC ( r = 0.88*), alkali spreading value ( r = 0.89*), GC ( r = 0.84*), and grain width ( r = 0.94**). Amylose content also correlated strongly with GC ( r = 0.93**) and Amylograph setback viscosity ( r = 0.94**), as well as with alkali spreading value ( r = 0.82*), grain width ( r = 0.91*), and Amylograph peak viscosity ( r = –0.88*). Alkali spreading value correlated significantly with Amylograph set
North, Central, and South America 41

back ( r = 0.89*) and peak viscosity ( r = –0.83*), and grain width ( r = 0.91*). Gel consistency and grain width exhibited very strong cor- relation ( r = 0.96**).
Mexico
M exico produced 506,000 t of rough rice in 1989 (FAO 1990b). Annual consumption of milled rice per capita was 5.3 kg in 1979-81 (FAo 1984),5.3 kg in 1985 (RCMD 1989),
and 4.9 kg in 1986-88 (FAO 1990a). The principal varieties (based on area planted) in 1983 were 46% Navolato A71, 17.3% Campeche A80, 8.2% IR8 (Milagro Filipino), and 5.8% CICA4 (Dalrymple 1986).
Culiacan A82, Navolato A71, CICA4, and Milagro Filipino (IR8) are planted in the northwest and have long and medium grain, translu- cence, and hard texture (L.L. Delgado, Instituto Nacional de Investiga- ciones Forestales y Agropecuarias, 1990, pers. commun.). Those in the Pacific Coast have high volume expansion on cooking: Milagro Fili- pino, CICA8, Navolato A71, Campeche A80, Morelos A70, and More- los A83. Morelos A70, Morelos A83, and Morelos A88, varieties in the Central Region, have medium to long grain, and high volume expan- sion. Rices on the Gulf of Mexico coast have translucent grain and high volume expansion (Milagro Filipino, Chetumal A86, Palizada A86, CICA4, Campeche A80, and Cardenas A80). Those in the Southeast have translucent grain, hard texture, and high volume expansion: Palizada A86, Milagro Filipino, CICA4, CICA6, CICA8, Chetumal A86, Campeche A80, Cardenas A80, and Sureste A90. Nine market samples have 24-28% AC and low-intermediate GT (RCMD 1987,1989).
High-AC and then intermediate-AC rices predominated among Mexican varieties (Appendix, Table 6). All of the varieties listed above that were analyzed had high AC (except Cardenas A80 and Morelos A70). Joachin A74 was the only low-AC rice. Among the five high-AC rices, the upland variety Sureste A90 had the softest cooked rice. Long- grained rices predominated over medium-grained and so did slender- shaped over medium-shaped types.
Cooked rice stickiness correlated significantly with cooked rice hardness ( r = –0.77**, n = 18), AC ( r = –0.85**), and Amylograph setback ( r = –0.79**) and consistency ( r = –0.83**). Cooked rice hardness also correlated with Amylograph setback ( r = 0.76**, n = 23) and consistency ( r = 0.77**), alkali spreading value ( r = 0.61**), and protein content ( r = 0.72**). Amylose content correlated with Amylograph setback ( r = 0.68**, n = 23) and consistency ( r = 0.68**) and so did alkali
42 Grain quality evaluation of world rices

spreading value with Amylograph peak viscosity ( r = –0.68**, n = 231, setback ( r = 0.71**) and consistency ( r = 0.60**). Protein content also correlated with alkali spreading value ( r = 0.55**, n = 34) and Amylo- graph peak viscosity ( r = –0.53**, n = 23).
Panama anama produced 180,000 t of rough rice in 1989 (FAO 1990b). Annual consumption of milled rice per capita was 48 kg in 1979- 81 (FAO 1984) and 54 kg in 1986-88 (FAO 1990a). CICA7 was
planted in 34% of the rice area in 1982-83. CICA8, CR5272, L4444, T-5430, and CR1113 were also planted (Dalrymple 1986).
Only Anayansi ex CIAT was analyzed and had high AC, low GT, and hard GC (Appendix). Its grain had medium length and shape. The other varieties listed above had mostly high AC, except CR5272 from Costa Rica, which had intermediate-high AC.
USA
R ough rice production in the USA was 7.0 million t in 1989 (FAO 1990b). Annual consumption of milled rice per capita was 4.5 kg in 1979-81 (FAO 1984) and >4 kg in 1981 (Webb et a1
1985). Milled rice supply per capita in 1986-88 was 6.1 kg/yr (FAO 1990a). Production was 70-75% long grain and 25-30% medium and short grain.
The preferred quality characteristics of US long-grained rices are intermediate AC, intermediate to intermediate-high GT, and soft GC (B.D. Webb, Rice Research Southern Region, ARS, USDA, 1990, pers. commun.). Production is limited of special long-grained rices Rexmont (high AC), Toro II (low AC), Della (Texmati) and A301 (intermediate AC, aromatic), and Jasmine 85 (IR841-67-1, low AC, aromatic).
The preferred qualities among medium- and short-grained rices are low AC, low GT, and soft GC. There is limited production of Kokuhorose and M401, which have large, medium-grained rices with translucent flavorful grains. Mochigome has waxy, short grains. Im- ported long-grained rices are Thai jasmine (100,000 t/yr), Basmati (India), Thai waxy, Thai purple and red rices, and Italian bold, me- dium-grained Arborio rice with white core (Webb 1990).
North, Central, and South America 43
P

IRRI analyses confirmed Webb's physicochemical data (Appen- dix). US rices had variable AC, low-intermediate GT, and soft-medium GC (Table 6). Long-grained rice had the most variable quality. It had predominantly intermediate AC, except for Century Patna 231, Toro, L-202, Jojutla, Newrex, and Rexmont. Century Patna 231 and Toro had low AC and the rest had high AC. These high-AC rices had harder cooked rice than typical long-grained rice, but not as hard (8-10 kg/ 7 cm2) as IRGA-409- and IR8-type rices (12 kg/7 cm2). California long- grained rice L-202 had high AC and was grown in Spain as Thaibonnet. Lemont is still the principal long-grained variety despite some process- ing problems due partially to thick grains.
Grain length and width were correlated ( r = –0.75**, n = 56). Cooked rice hardness correlated with cooked rice stickiness ( r = –0.64**, n = 17), Amylograph setback ( r = 0.71**, n = 39) and consistency ( r = 0.74**), AC ( r = 0.64**, n = 55), GC ( r = –0.40**), and grain length ( r = 0.63**, n = 48) and width ( r = –0.54**). Amylose content correlated with Amylograph peak viscosity ( r = 0.57**, n = 47), setback ( r = 0.42**) and consistency ( r = 0.81**), grain width ( r = –0.71**, n = 56) and length ( r = 0.71*), GC ( r = –0.45**, n = 74), and alkali spreading value ( r = –0.42**, n = 87). Gel consistency correlated with Amylograph consistency ( r = –0.63**, n = 43) and setback ( r = –0.34*). Grain width also correlated with Amy- lograph peak viscosity ( r = –0.44**, n = 33) and consistency ( r = –0.58**) and alkali spreading value ( r = 0.63**, n = 56), whereas grain length correlated with Amylograph setback ( r = 0.50**, n = 33) and consistency ( r = 0.70**) and alkali spreading value ( r = –0.42**, n = 87).
South America
R
A
ough rice production in South America was 17.1 million t (3.5% of world total) of which 13.5 million t were available for consumption in 1986-88 (FAO 1990a,b). Per capita milled rice
supply was 32 kg/yr in 1986-88 (FAO 1990a).
Argentina rgentina’s annual rough rice production was 469,000 t in 1989 (FAO 1990b). Annual consumption per capita was estimated as 3 kg in 1979-81 (FAO 1984) and about 4 kg in 1988 (RCMD
1989). Mean annual milled rice supply per capita in 1986-88 was 5.5 kg (FAO 1990a).
44 Grain quality evaluation of world rices

Preferred rices Fortuna Inta, Yerua P.A., and Bluebelle have long (>7 mm), slender (L-W ratio >3) grains with low AC, low GT, and soft GC (A.A. Vidal, Estacion Experimental “Ing. Agric. Julio Hirschhorn,” Universidad Nacional de la Plata, 1990, pers. commun.). Long slender varieties (primarily Bluebonnet and Bluebelle [long-medium type]) were planted on 50-55% of the rice area, Fortuna on 35-40%, and a medium-grained type, such as Itape, on <10% (RCMD 1987). The Rice Council for Market Development (1987) obtained amylose values from market samples of Itape (17% AC), Fortuna (20.3% AC), and Bluebon- net (26.2% AC). Market samples in 1988 had 18-25% AC (RCMD 1989).
Argentinean rices were all nonwaxy AC types with low-intermedi- ate GT, and soft-medium GC (Table 6). The AC of Fortuna Inta, Yerua P.A., and Bluebelle ranged from 18 to 22% (Appendix). They had low GT and medium-soft GC. Their cooked rice Instron hardness ranged from 6 to 9 kg/7 cm 2 , lowest for Villaguay PA and highest for Guayaqui- raro. Grains were mainly medium or long in size and slender in shape. Some of the 1983 selections had grain lengths >7 mm.
Gel consistency correlated significantly with cooked rice hardness ( r = –0.66**, n = 26) and AC ( r = –0.64*, n = 46). Grain length also correlated with cooked rice hardness ( r = –0.41*, n = 26) and GC ( r = 0.39*).
B Bolivia
was 1
olivia produced 194,000 t of rough rice in 1989 (FAO 1990b). Annual consumption of milled rice per capita was 11 kg in 1979- 81 (FAO 1984). Mean milled rice supply per capita in 1986-88
7 kg/yr (FAO 1990a). Modern rice varieties grown in 1980 included Saavedra V4 (IR1529-430-3), Saavedra V5 (CICA6), CICA8, and CICA9 (Dalrymple 1986).
Bolivian samples all had intermediate AC and low GT, except for Saavedra V4 (low AC) (Appendix, Table 6). Grains were mainly long and slender or medium-shaped. Cooked rice hardness was lowest for Saavedra V4 and highest for CICA8. Dorado and Saavedra V4 had shorter, coarser grains than the other four.
Grain length and width correlated ( r = –0.84*, n = 6), while cooked rice hardness correlated with GC ( r = –0.85*).
I
North, Central, and South America 45
BraziI
A nnual rough rice production in Brazil in 1989 was 11.0 million t (FAO 1990b). Annual consumption of milled rice per capita was 42 kg in 1979-81 (IRRI 1991). Mean milled rice
supply per capita in 1986-88 was 43 kg/ yr (FAO 1990a). There is increasing preference, particularly in urban centers, for fine long- grained type instead of coarse (upland) type. These are translucent, nonaromatic, and soft-cooking rices that stay soft even after cooling. The long-grained varieties have high or intermediate AC and low GT (P.S. Carmona, Instituto Rio Grandense do Arroz, and E. da Maia de Castro, Centro Nacional de Pesquisa de Arroz e Feijao, EMBRAPA, 1990, pers. commun).
Major varieties (80%) are IRGA409 and IRGA410 in the 40% irri- gated rice area in the South and Southeast. Bluebelle, CICA8, Metica 1, and MG1 are also planted. In the 60% upland areas, varieties IAC25, IAC47, IAC164, Cuiabana, and Araguaia are important in the central, western, and northern/northeastern zones. The major (70%) upland areas in the central part are planted to Araguaia, Rio Paranaiba, Guar- ani, IAC25, Douradao, IAC47, IAC165, and IAPAR9.
Peole in the central and southern areas prefer long-grained rices but those in the northern and northeastern areas have no grain shape preference. IA25, IAC47, and IAC165 are the varieties found in northern and northeastern Brazil. Big city consumers are starting to prefer long-grained, nonaromatic, soft rice with high translucency. Imported japonica IAC65 is an important variety in Sao Paolo. Market samples had high AC (RCMD 1987).
Brazilian rices were all nonwaxy AC types, with mainly low GT and variable GC (Table 6). All of the irrigated rices mentioned above had high AC, low GT, and hard GC except Bluebelle, which had intermediate AC and GT and medium-soft AC (Appendix). Many low- and intermediate-AC rices were also evaluated. Low GT and hard GC predominated (Table 6). All of the IRGA varieties had high AC, except IRGA407 and IRGA411 with low AC, and IRGA408 with intermediate AC. Upland rices IAC25, IAC47, IAC164, Araguaia, and Cuiabana had intermediate AC; Douradao, Cabacu, and Rio Paranaiba had low AC, and Guarani, high AC. Softest cooked rices were Douradao, Cabacu, and Bico Torto (low AC). The hardest cooked rice samples were IRGA412 and IRGA414. Grain length was mainly long; shape was mainly medium or slender. Coarse grain samples included Pacha Murcha, Guapore, Caloro, and Batatais; only Caloro was bold.
46 Grain quality evaluation of world rices

Cooked rice hardness correlated with Amylograph setback ( r = 0.87**, n = 25) and consistency ( r = 0.69**), alkali spreading value ( r = 0.54**, n = 72), GC ( r = –0.74**), AC ( r = 0.56*) and grain width ( r = -0.55**). Amylose content correlated with Amylograph setback ( r = 0.69**, n = 31) and consistency ( r = 0.68**) and GC ( r = 0.51**, n = 91). Grain width correlated with Amylograph peak viscosity ( r = –0.69**, n = 25) and setback ( r = –0.62*) and GC correlated with Amylograph consistency ( r = –0.66**, n = 31).
Chile
C hile produced 185,000 t of rough rice in 1989 (FAO 1990b). Annual per capita consumption was 7.7 kg milled rice in 1979-81 (FAO 1984). Mean annual milled rice supply per
capita was 9.4 kg in 1986-88 (FAO 1990a). About 90% of the production consisted of medium-bold grain variety Oro (60%) and long-medium grain variety Diamante (40%).
Rices from Chile (including Oro and Diamante) had intermediate- low AC, low GT, and soft GC (Appendix, Table 6). Rices received in 1990 had low-intermediate AC (19-21% AC), low GT, and soft GC with cooked rice hardness of 4-6 kg/7 cm2. Amylograph peak viscosity was 445-570 BU; setback and consistency were also relatively low. Cinia 196 had the softest cooked rice; Quella and Niquen, the hardest. All, except Oro and Quella-INIA with medium bold grains, had extra-long or long, and medium- or slender-shaped grains. Cinia 196 had the longest grain.
Grain length and width were correlated ( r = –0.88**, n = 10). Amylograph consistency and protein content were correlated ( r = –0.84**, n = 14) and so were Amylograph peak viscosity and setback ( r = –0.88**). Amylograph setback correlated with GC ( r = –0.62**, n = 14), and Amylograph consistency with grain length ( r = –0.65*, n = 10) and width ( r = 0.66*). Cooked rice hardness correlated with AC ( r = 0.57*, n = 14) and protein content ( r = 0.62*).
Colombia
R ough rice production in Colombia was 1.9 million t in 1989 (FAO 1990b). Annual consumption of milled rice per capita in 1979-81 was 37 kg (FAO 1984). Mean supply of milled rice
per capita in 1986-88 was 37 kg (FAO 1990a). Consumers prefer
North, Central, and South America 47

long, slender grain and translucency (D.M. Leal, Instituto Colombiano Agropecuario Regional no. 8, 1990, pers. commun.).
Cooked rice should be nonsticky but soft, which corresponds to high-intermediate AC, low-intermediate GT, and hard-medium GC. Principal varieties are IR22, CICA4, CICA8, Metica 1, Oryzica 1, Oryzica 2, Oryzica 3, Oryzica Llanos 4, and Oryzica Llanos 5. In 1984, riceland was planted to an estimated 26% Oryzica 1, 20% CICA8,16% IR22,15% CICA4,12% Metica 1,8% CICA9, and 3% CICA7 (Dalrymple 1986). Market samples of IR22, CICA9, Linia 8, and Metica 1 all had high AC. CICA8, grown in Llanos, had intermediate AC (RCMD 1987).
Samples, including CICA rices, were mostly high-AC varieties (Appendix, Table 6). Bluebonnet 50 and ICA-10 had mostly intermedi- ate AC. Many of the high-AC samples had medium-soft GC despite low GT, probably due to ambient temperature effects. Intermediate- GT IR rices tended to have low GT when grown at CIAT, Colombia. Bluebonnet 50 had low GT, although it is an intermediate GT variety in the US. The samples were long or medium in length, and slender or medium-shaped.
The seven varieties from the 1990 crop had high AC, except Oryzica 2 and Oryzica 3, which had intermediate AC (Appendix).
Cooked rice stickiness correlated with Amylograph setback ( r = –0.99**, n = 6) and consistency ( r = –0.99**) and cooked rice hardness ( r = –0.84*, n = 7). Cooked rice hardness correlated with Amylograph setback ( r = 0.83*, n = 6) and consistency ( r = 0.83*), and GC ( r = –0.76*, n = 7). Amylose content correlated with Amylograph setback ( r = 0.81*, n = 6) and GC correlated with alkali spreading value ( r = –0.71**, n = 18) and grain length ( r = –0.66*, n = 11).
Ecuador
E cuador produced 806,000 t of rough rice in 1989 (FAO 1990b). Annual per capita consumption of milled rice was 25 kg in 1979-81 (FAO 1984) and 40 kg in 1986-88 (FAO 1990a). The two
main improved varieties in 1984 were INIAP415 (60,000 ha) and CICA6 (40,000 ha) (Dalrymple 1986).
Most rice samples had high AC and low GT, except Bluebonnet 50, Colorado, and INIAP10, which had intermediate AC (Appendix, Table 6). These three varieties had soft cooked rice as did some high- AC rices of medium GC, such as Donato, INIAP6, and INIAP11. Both INIAP415 and CICA6 (Colombia) had high AC, low GT, and hard GC. INIAP7 and INIAP415 had the hardest cooked rice, but INIAP6, Colorado,
48 Grain quality evaluation of world rices

INIAP11, and Bluebonnet 50 had the softest cooked rice. Varieties had more long than medium grains and more medium- than slender- shaped grains. Brasileiro and Chato Serrano had shorter grains than the other varieties.
Length and width of grain were correlated ( r = –0.59*, n = 17). Cooked rice hardness correlated with Amylograph setback ( r = 0.66**) and consistency ( r = 0.77**), protein content ( r = –0.63**), and AC ( r = 0.55*). Amylose content correlated with Amylograph peak viscosity ( r = 0.72**), setback ( r = 0.59*) and consistency ( r = 0.78**), GC ( r = –0.73**), and protein content ( r = -0.80**). Gel consistency corre- lated with Amylograph peak viscosity ( r = -0.67**), setback ( r = –0.60*) and consistency ( r = –0.71*). Protein content correlated with Amylo- graph peak viscosity ( r = –0.53*), setback ( r = –0.56*) and consistency ( r = –0.69**).
Guyana
G uyana produced 203,000 t of rough rice in 1989 (FAO 1990b). Annual consumption was 87 kg of milled rice per capita in 1979-81 (FAO 1984) and 85 kg in 1986-88 (FAO 1990a). Varie-
ties N and S (introduced in the early 1970s), Rustic, and Champion occupied 57% of the rice area in 1981 (Dalrymple 1986). A market sample of long-grained rice had 24% AC and low GT (RCMD 1989).
Guyana rices had high-intermediate AC, low-intermediate GT, and mainly hard GC (Table 6). Rustic, Champion, and varieties N and S had high AC, low GT, and hard GC (Appendix). Varieties N and S had harder cooked rice than Rustic and Champion. Bluebelle, Starbonnet, and variety T had intermediate AC and GT and medium-hard GC. Grain length varied from extra long to medium, but most were long and slender. Only cooked rice hardness and alkali spreading value were significantly correlated ( r = 0.68*, n = 10).
Paraguay
P araguay produced 88,000 t of rough rice in 1989 (FAO 1990b). Annual consumption of milled rice was 12 kg per capita in 1979- 81 (FAO 1984) and 13 kg in 1986-88 (FAO 1990a). About 63%
of the total rice area was planted with CICA varieties during the 1981- 82 season (Dalrymple 1986).
North, Central, and South America 49

Rices from Paraguay had mostly high AC, low GT, and hard GC (Table 6). Of the 15 rices analyzed from the 1990 crop, 12 had high AC, Bluebelle and CICA6 had intermediate AC, and Vista had low AC (Appendix). CEA-1 and Vista had medium GC. Vista had the softest cooked rice and the lowest L-W ratio of 2.4. Long slender grains pre- dominated.
Cooked rice hardness correlated with Amylograph setback ( r = 0.88**, n = 15) and consistency ( r = 0.76**), AC ( r = 0.88**), and GC ( r = –0.75**). Amylose content correlated significantly with Amylo- graph setback ( r = –0.73**) and consistency ( r = –0.68**), and GC ( r = –0.82**). Gel consistency in turn correlated significantly with Amy- lograph setback ( r = –0.73**) and consistency ( r = –0.68**). Grain length correlated with GC ( r = –0.61*) and AC ( r = –0.59*) and grain width correlated with Amylograph setback ( r = 0.52*) and consistency ( r = –0.56**).
Peru
R ough rice production in Peru was 1.1 million t in 1989 (FAO 1990b). Annual per capita consumption of milled rice was 28 kg in 1979-81 (FAO 1984) and 34 kg in 1986-88 (FAO 1990a).
Important varieties in the Costa region are Inti, Viflor, and Ama- zonas; San Martin and Alto Mayo are important in the Selva Alta region (J.L. Hernandez, Instituto Nacional de Investigacion Agraria y Agroin- dustrial Peru, 1990, pers. commun.). Amazonas has soft texture and flavor. Consumer preferences may change because of the new free market system in which US rices, such as Bluebelle and Labelle, can be imported. More than 60% of the rice area in Alto Mayo was planted to CICA8 in 1984 (Dalrymple 1986). A market sample of Ecasa rice had 18% AC (RCMD 1987).
Peruvian rices had all nonwaxy AC types, mostly low GT, and variable GC (Table 6). Among the varieties mentioned above, Inti, Viflor, and Amazonas had low AC and GT. San Martin and Alto Mayo had intermediate AC, low GT, and medium GC (Appendix). High-AC rices predominated (Table 6). The soft texture and flavor of Amazonas may be due to its low AC. All were long-grained rices, although San Martin was only 6.5 mm long with L-W ratio of 2.6. Earlier maturing, short, medium-shaped grain varieties were Mochica and Radin China. Grain size was more often long than medium and grain shape more medium than slender.
50 Grain quality evaluation of world rices

Cooked rice stickiness correlated with Amylograph setback ( r = –0.94**, n = 12) and consistency ( r = –0.89**), GC (r = 0.86**), AC (r = –0.90**), and cooked rice hardness (r = –0.58*). Cooked rice hardness correlated with Amylograph setback ( r = 0.75**, n = 23) and consistency (r = 0.67**), GC (r = –0.58**), and AC (r = 0.62**). Amylose content also correlated with Amylograph setback (r = 0.65**, n = 33) and consistency (r = 0.67**), and GC (r = –0.59**, n = 27). Gel consistency correlated negatively with Amylograph setback ( r = –0.60**, n = 25) and consistency ( r = –0.54*). Amylograph peak viscosity was correlated with alkali spreading value ( r = –0.51**, n = 33) and protein content (r = –0.53**).
Surinam
R ough rice production in Surinam was 260,000 t in 1989 (FAO 1990b). Annual consumption of milled rice per capita was 85 kg in 1979-81 (FAO 1984). Supply per capita was estimated
at 94 kg/yr in 1986-88 (FAO 1990a). An estimate of 1986 consumption was more than 100 kg/capita (RCMD 1987) and 147 kg/capita in 1987- 88 (RCMD 1989). Half of Surinam's rice is exported, mainly to the Eu- ropean Economic Community (EEC) (Dalrymple 1986). Part of the ex- ported rice was parboiled. Two market samples of local rices had intermediate AC and intermediate GT (RCMD 1987,1989).
Surinam rices had all nonwaxy AC types, mainly intermediate GT, and soft GC (Table 6). Earlier rice samples had AC ranging from low to high (Appendix). Samples of promising lines during 1984 had six inter- mediate and four high-AC rices. The grains were also mainly extra long and slender, a distinct character of Surinam rices. They exhibited high Amylograph peak viscosity and low setback and consistency. Most of them had soft-medium GC.
Cooked rice stickiness correlated with Amylograph peak viscosity ( r = 0.91**, n = 10), setback (r = –0.85**) and consistency (r = –0.79**), AC (r = –0.86**), grain length ( r = 0.65*), alkali spreading value (r = –0.72*), and GC (r = 0.63*). Cooked rice hardness correlated with GC (r = –0.71**, n = 22) and alkali spreading value (r = 0.65**). Amylose content correlated with Amylograph peak viscosity ( r = –0.82**, n = 12) and setback (r = 0.81**), grain length (r = –0.58**, n = 25), and alkali spreading value (r = 0.52**, n = 34). Gel consistency correlated with alkali spreading value ( r = –0.74**, n = 31) and Amylograph peak viscosity (r = 0.65*, n = 12) and setback (r = –0.62*). Alkali spreading value also correlated with Amylograph setback ( r = 0.64*) and consis- tency ( r = 0.66*).
North, Central, and South America 51

Venezuela
R ough rice production in Venezuela was 313,000 t in 1989 (FAO 1990b). Annual consumption of milled rice per capita was 23 kg in 1979-81 (FAO 1984) and 13 kg in 1986-88 (FAO 1990a).
Araure 1 represented about 80% of the modern variety area in 1981-82 and CICA4 occupied the remaining 20% (Dalrymple 1986).
Rices had high AC, low GT, and medium-hard GC (Table 6). Araure 1 had high AC, low GT, and hard GC (Appendix). About half the other varieties had medium GC. Grain length was either long or medium and mainly medium-shaped. Palmar and P2231F4-138-6-1 gave softer cooked rice than Cimarron and Araure 1 and Araure 4. Cimarron had Amylograph consistency similar to that of Palmar and
Amylograph consistency and gel consistency were correlated (r = –0.96**, n = 5). Cooked rice hardness correlated with Amylograph setback (r = 0.94*), alkali spreading value (r = 0.90*), and grain length (r = 0.94*). Gel consistency and grain width were also correlated ( r = –0.85*, n = 6).
P2231F4-138-6-1.
52 Grain quality evaluation of world rices

Summary In both North and South America, high AC predominates over inter- mediate and low AC (Table 6). Only the USA has waxy and very low- AC rices. Intermediate AC is the preferred type in Brazil (upland rice), Bolivia, Chile, Mexico (upland), and the USA (long grain), and proba- bly Surinam. Low AC is preferred in Argentina, Peru, and the USA (short and medium grain); high AC is desired in Brazil (irrigated rice), Colombia, Costa Rica, Mexico, Guyana, and Venezuela. Cubans prefer low-intermediate-AC rices. Waxy rices in the USA are produced in California (Webb et al 1985).
Long, slender-grained rices predominate over medium-grained rices, particularly in North America. Long, medium-shaped grain is more common in South America. Extra long grains predominate in Surinam. Short-grained rices are represented only in the USA and Peru.
Cooked rice hardness correlates significantly with GC in 12 coun- tries, with Amylograph setback in 10, with Amylograph consistency in 8, and with AC in 7. Amylose content and Amylograph setback are significantly correlated in 10 countries, and with Amylograph consis- tency in 8. Gel consistency correlates significantly with Amylograph setback and consistency in 10 countries.
North, Central, and South Arnerlca 53


Europe
E
R
urope produced 2.2 million t of rough rice in 1988 (0.45% of world total). The corresponding rough rice availability in 1986- 88 was 2.9 million t (FAO 1990a,b). Per capita milled rice
supply in 1986-88 was 3.8 kg/yr.
Bulgaria ough rice production in Bulgaria was 50,000 t in 1989 (FAO 1990b). Annual per capita consumption of milled rice was 4 kg in 1979-81 (FAO 1984) and 4.4 kg in 1986-88 (FAO 1990a).
Rice production in Bulgaria was 99% Krasnodarski 424 and 1 % Belozem (K. Perfanov, Institute of Introduction and Plant Genetic Resources, 1990, pers. commun.). Krasnodarski 424 had intermediate AC, low GT, and soft GC (Appendix). Belozem had low AC, low GT, and soft GC. Both had similar grain size and shape (Table 7). All 1985 samples had short, bold grains, except N:11M and Plovdiv 22, which had medium grain. Most of these samples had low AC, compared with earlier samples which had up to 27% AC. Krasnodarski 424 had the softest cooked rice despite its intermediate AC, probably because of its low protein content.
Grain length and width were negatively correlated ( r = –0.54**, n = 14). Amylose content correlated with alkali spreading value ( r = –0.60**, n = 23), and Amylograph peak viscosity ( r = –0.63**, n = 18), setback ( r = 0.71**) and consistency ( r = 0.78**). Cooked rice hardness correlated with GC ( r = –0.64**, n = 15) and protein content ( r = 0.71**), whereas cooked rice stickiness correlated with protein content ( r = –0.79*, n = 8), GC ( r = –0.79*), and Amylograph setback ( r = –0.76*) and consistency ( r = –0.76*).

Table 7. Protein content and classification of milled rice in Europe based on apparent AC, final GT, and GC. IRRI, 1965 91.
Sample Protein (%) AC a GT b GC c
Source (no.) Range Mean Wx VL L I H L I HI H S M H
Bulgaria 23 6-10 7.4 0 0 14 8 1 23 0 0 0 17 4 0 France 50 5-12 7.1 0 0 31 17 2 50 0 0 0 29 12 5 Greece 10 5- 8 6.4 0 0 3 5 2 8 2 0 0 4 4 2 Hungary 42 6-11 7.2 0 0 15 26 1 38 4 0 0 10 22 7 Italy 40 5- 8 6.9 0 0 14 25 1 39 1 0 0 20 7 5 Portugal 31 5- 8 6.8 0 0 17 13 1 30 1 0 0 26 4 1 Russia 25 5- 7 6.4 0 0 16 9 0 17 4 3 1 22 3 0 Spain 12 6-13 8.2 0 0 9 3 0 12 0 0 0 9 0 0
Total 233 5-13 7.0 0 0 119 106 8 217 12 3 1 137 56 20
a Wx = waxy (0-5.0%). VL = very low (5.1-12.0%,), L = low (12.1-20.0%), I = Intermediate (20.1-25.0%). and H = high (>25%). b Indexed by alkali
gel consistency values: S = soft (61-100 mm). M = medium (41-60 mm). and H = hard (25-40 mm). spreading value: L = low (6-7), I = Intermediate (4-5). HI = high-Intermediate (3). and H = high (2). c Only samples analyzed from mid-1971 have

France
F rance produced 96,000 t of rough rice in 1989 (FAO 1990b). Annual consumption of milled rice per capita was less than 4 kg in 1979-81 (FAO 1984), 3.94 kg in 1988 (RCMD 19891, and 3.7 kg/
yr in 1986-88 (FAO 1990a). Major varieties planted in 1989 to 16,508 ha (104,200 t yield) were Ariette (3,683 ha), Cigalon (2,785 ha), Lido (2,515 ha), and Onda (1,500 ha) (J. Faure, CIRAD/IRAT, 1990, pers. commun.). New varieties are Alfa, Cripto, Koral, Miara, Ringo, and Rocca. Medium- and long-grained varieties are consumed locally, but 20-30% of short-grained rices are exported. Long-grained US, Suri- nam, and Thai rices are preferred, except for use in desserts. Two market samples of French rice had 18% AC and L-W ratio of 2.5-2.7 (RCMD 1989).
Medium-sized and -shaped grains predominated among French rices (Appendix). French rices had mainly low-intermediate AC, low GT, and soft-medium GC (Table 7). Ariette, Cigalon, Lido, and Onda all had low AC, low GT, and medium-soft GC (Appendix). But Ariette and Onda had medium-sized and -shaped grain, Lido had short, medium-shaped grain, and Cigalon had short, bold grain. None of the new varieties approached the intermediate (23-25%) AC of Arlesienne (Feillet and Marie 1979).
Delta was the first translucent long-grained variety released as a replacement for Arlesienne, which was susceptible to shattering and cracking. Arlesienne had 6-8 kg/7 cm2 cooked rice hardness compared with 5-7 kg/7 cm2 for Delta. Arlesienne had positive Amylograph setback and consistency values (310-410 BU) that were higher than those of Delta. The 1989-90 samples of Cripto and Alpha (Alfa) (short- medium, bold grains), and Arlesienne, Rocca, Koral, Ringo, and Miara (medium-long, medium-shaped grains) all had low-intermediate AC. Cripto had hard GC and AC as high as Arlesienne’s (Appendix). Many of the samples were Italian varieties except for Miara, Cigalon, and Onda.
Cooked rice stickiness correlated with Amylograph setback ( r = –0.93**, n = 10) and consistency ( r = –0.95**), GC ( r= –0.82**, n = 11), AC ( r = –0.72*), cooked rice hardness ( r = –0.66*), and grain width ( r = –0.86**, n = 8). Amylograph peak viscosity correlated with grain length ( r = 0.60**, n = 24) and AC ( r = –0.64**, n = 31). Gel consistency correlated with Amylograph setback ( r = –0.69**, n = 27) and consis- tency ( r = –0.54**), cooked rice hardness ( r = –0.59**), and grain width ( r = –0.55**).
Europe 57

Greece
G reece produced 110,000 t of rough rice in 1989 (FAO 1990b). Annual consumption of milled rice per capita was less than 4 kg/yr in 1979-81 (FAO 1984) and 4.3 kg/yr in 1986-88 (FAO
1990a). Both indica (30%) and japonica (70%) varieties are grown. Indica varieties Bluebelle E and Rea, with L-W >3 and about 23% AC, are particularly popular in urban areas where consumption is increas- ing (S. Hadjisavva, Institut de Cereales, 1990, pers. commun.). The popular japonica varieties are Axios, Strimonas, Evropi, Ispaniki A, and Roxani. Roxani has L-W >2. Both parboiled and raw rices are consumed (RCMD 1987). A market sample of Rozza had 18% AC (RCMD 1987).
The Greek rices had variable AC, low GT, and variable GC (Table 7). The 1984 samples had low-intermediate AC, but the 1989 samples included high-AC rices (Appendix). Amylose content values in 1989 for the same three varieties were at least 5% higher. Rea and Bluebelle E had the hardest cooked rice and highest Amylograph consistency and setback. Low-AC Axios had the softest cooked rice. Japonica varieties had low-intermediate AC, low GT, and medium-soft GC. Indica varieties Bluebelle E (long, slender grain) and Rea (medium size and shape) had intermediate-high AC, low-intermediate GT, and medium-hard GC. All japonica varieties had medium-long, medium- shaped grains.
Cooked rice hardness correlated with Amylograph setback ( r = 0.91*, n = 6) and consistency ( r = 0.97**) and grain width ( r = –0.70*, n = 10). Amylose content correlated with Amylograph setback ( r = 0.90**, n = 6) and consistency ( r = 0.97**) and GC ( r = –0.93**, n = 10). Gel consistency correlated with Amylograph setback ( r = –0.92**, n = 6) and consistency ( r = –0.85*) and protein content ( r = –0.65*, n = 10).
Hungary
R ough rice production in Hungary was 45,000 t in 1989 (FAO 1990b). Consumption was 3-4 kg/yr (I.K. Simon, Research Institute for Irrigation, 1990, pers. commun.). Per capita
supply of milled rice in 1986-88 was 3.7 kg/yr (FAO 1990a).
The preferred variety was Oryzella with L-W ratio of 2.8-3.0 (long grain). Oryzella, Ringola, Sandora, and Karmina had highly translu- cent grains, medium texture, high volume expansion on cooking, and
58 Grain quality evaluation of world rices

no aroma. A market sample of short-grained Hungarian milled rice had 22% AC, low GT, and 7.8% protein (RCMD 1987).
Long grains predominated over medium and short grains, and medium shape predominated over bold and slender (Appendix). The Hungarian rices had mainly intermediate-low AC, low GT, and me- dium GC (Table 7). The preferred variety, Oryzella, had intermediate AC, low GT, and long, medium-shaped grain (Appendix). Ringola, Sandora, and Karmina had the same traits, except Karmina which had slightly shorter grain. Low-AC samples in 1989 had softer cooked rice (4.5-5.2 kg/7 cm2 Instron hardness) than intermediate-AC rices (6.5- 7.6 kg/7 cm2). Only G-238/SZ-11 had high protein with 10.7%.
Grain length and width were significantly correlated (r = –0.53**, n = 38). Cooked rice stickiness correlated with cooked rice hardness ( r = –0.85**, n = 12), GC ( r = 0.76**, n = 121, and Amylograph consistency ( r = –0.68*). Cooked rice hardness correlated with Amylograph peak viscosity (r = 0.60**, n = 38) and setback (r = –0.35**), and GC ( r = –0.69**). Amylose content correlated with Amylograph setback (r = 0.52**, n = 42) and consistency (r = 0.52**), alkali spreading value (r = 0.44**, n = 42), grain width ( r = –0.33*, n = 38), and GC ( r = –0.32*, n = 39).
Italy
I taly produced 1.2 million t of rough rice in 1989 (FAO 1990b). Mean per capita consumption of milled rice was 4 kg/yr in 1979- 81 (FAO 1984), 4.8 kg (Juliano et al 1990) or 5.2 kg (RCMD 1989)
in 1988, and 4.8 kg/yr in 1986-88 (FAO 1990a). Long, coarse-grained varieties with excellent water absorption and
high AC are generally preferred (R. Carriere, Associazione Industrie Risiere Italiene, 1990, pers. commun.). Regional preferences are also observed, but trademarks are becoming more important relative to variety name. Major varieties planted in 1988 were Lido (49,000 ha), Arborio (22,000 ha), Balilla (20,000 ha), Europa (13,000 ha), and Ringo and Sant Andrea (11,000 ha each) (Baldi et al 1989). Reported AC values were Arborio, 19.6%; Balilla, 20.7%; Europa, 19.7%; Ringo, 19.3%; and Sant Andrea, 19.0% (Baldi et al 1978). Newer varieties, such as Bonnet Bell and Elio, had 24% AC (Baldi et al 1989). Market samples had 16-
In a survey of Rome retail rice markets in May 1988, Italian brown and milled raw and parboiled rices had mainly low AC, low GT, and more soft gel than medium gel (Juliano et al 1990, Kaosa-ard and
21% AC (RCMD 1987,1989).
Europe 59

Juliano 1991). Milled rice protein was 5.5-8.8% (6.9% mean). Raw rice was cheaper than parboiled rice. Carnaroli was an exception (interme- diate AC, hard GC); it had a higher retail price than even parboiled rices.
Medium and short grains predominated over long grains, and medium shape over bold (Appendix). Italian rices had intermediate- low AC, low GT, and mainly soft GC (Table 7). The popular variety, Lido, had short, medium-shaped grain, intermediate AC, low GT, and soft GC (Appendix). Arborio (long, medium-shaped) and Balilla (short, bold) had wider grains with white core or belly, intermediate AC, low GT, and soft GC. Both gave softer cooked rice than Lido. Europa, Ringo, and Sant Andrea had medium size and shape, intermediate AC, and softer cooked rice than Lido.
No rice had replaced the 24-25% AC Raffaello, which gave the hardest cooked rice, until Bonnet Bell, Carnaroli, and Elio were re- leased. Among the tested Italian varieties, Raffaello had the least sticky and hardest cooked rice; Padamo, the softest cooked rice; Ringo and Sant Andrea, the stickiest (Mazzini et al 1990). Among the three 1990 samples, long, medium-shaped grained Bonnet Bell and Carnaroli had intermediate AC; short, bold-grained Elio had high AC (Appendix).
Cooked rice stickiness correlated significantly with cooked rice hardness (r = –0.80**, n = 11), Amylograph setback (r = –0.86**), consistency (r = –0.80**) and peak viscosity ( r = 0.63*), GC (r = 0.83**), and AC (r = –0.91**). Cooked rice hardness correlated with Amylo- graph setback (r = 0.80**, n = 11) and consistency (r = 0.90**), grain width (r = –0.68**, n = 18), AC (r = 0.63**, n = 19), and GC (r = –0.53*). Gel consistency also correlated with Amylograph setback ( r = –0.84**, n = 11), consistency (r = –0.94**) and peak viscosity (r = 0.60*), and AC (r = –0.55**, n = 29). Amylose content correlated with Amylograph peak viscosity (r = –0.81**, n = 19) and setback (r = 0.63**), and alkali spreading value (r = 0.48**, n = 37). Protein content and grain length also correlated (r = 0.84**, n = 10).
Portugal
P ortugal produced 147,000 t of rough rice in 1989 (FAO 1990b). Annual per capita consumption of milled rice was 16 kg in 1979- 81 (FAO 1984) and 17 kg in 1986-88 (FAO 1990a). Two market
samples of local rices had 19-21% AC (RCMD 1987). Most Portuguese rices had medium or short size and medium or
bold shape (Appendix). Portuguese rices had low-intermediate AC,
60 Grain quality evaluation of world rices

low GT, and mainly soft GC (Table 7). All the 1986 samples had low AC except for Safari, which had 21% AC (Appendix). Estrella A did not have low GT or soft GC, but had extra long, slender grain. It was the only long-grained Portuguese variety. Ponta Rubra had the highest AC (23-26%). Most samples had low Amylograph setback and consistency. Safari and Banata 35 had cooked rice harder than that of higher AC Ponta Rubra.
Grain length and width were significantly correlated ( r = –0.71**, n = 19). Cooked rice stickiness correlated with Amylograph setback ( r = –0.93**, n = 11) and consistency ( r = –0.88**), AC ( r = -0.93**), and GC ( r = 0.65*). Cooked rice hardness correlated with GC ( r = –0.68**, n = 21) and Amylograph consistency ( r = –0.44*). Amylose content correlated with Amylograph setback ( r = 0.87**, n = 21) and consistency ( r = 0.77**), and grain length ( r = –0.50**, n = 19). Grain length correlated with protein content ( r = 0.68**, n = 19) and alkali spreading value ( r = –0.80**). Grain width correlated with Amylograph peak viscosity ( r = –0.66**, n = 19). GC correlated with protein content ( r = –0.48**, n = 31).
Russia
R ussia produced 2.5 million t of rough rice in 1989 (FAO 1990b). Annual per capita consumption of milled rice was about 9 kg in 1979-81 (FAO 1984) and 7.3 kg in 1986-88 (FAO 1990a).
Milled rices had low-intermediate AC, generally low GT, and soft GC (Appendix, Table 7). Luch and Dubovski 129 had the softest cooked rice. All had low Amylograph setback and consistency. Samples from 1986 had low AC and <6 mm grain length. Grains were mostly short and bold. Only Kulon and Luch had medium-sized and -shaped grains.
Cooked rice stickiness correlated with grain length ( r = –0.86**, n = 8), cooked rice hardness ( r = 0.82*), Amylograph peak viscosity ( r = 0.72*), and alkali spreading value ( r = –0.83*). Cooked rice hard- ness, in turn, correlated with GC ( r = –0.87**, n = 18), Amylograph con- sistency ( r = –0.76**), grain width ( r = 0.50*), and AC ( r = –0.48*). Amylose content correlated with Amylograph peak viscosity ( r = –0.86**, n = 18), setback ( r = 0.90**) and consistency ( r = 0.70**), grain width ( r = 0.59**), grain length ( r = 0.52*), alkali spreading value ( r = 0.59**, n = 25), and GC ( r = 0.49*). Gel consistency correlated with Amylograph consistency ( r = 0.68**, n = 18), grain width ( r = 0.66**), and protein content ( r = –0.41*, n = 25). Alkali spreading value also
Europe 61

correlated with Amylograph peak viscosity (r = –0.82**, n = 18) and setback (r = 0.66**), and grain length (r = 0.51*, n = 18). Grain width correlated with Amylograph consistency (r = 0.69**, n = 18). Amylo- graph peak viscosity and setback were correlated (r = –0.94**) as well.
Spain
R ough rice production in Spain was 341,000 t in 1989 (FAO 1990b). Annual per capita consumption of milled rice was 6 kg in 1979-81 (FAO 1984), 6.4 kg in 1986-88 (FAO 1990a), and
7.1 kg in 1988 (RCMD 1989). Spain has traditionally grown short- and medium-grained varieties. Long-grained varieties have been planted since 1987 in response to an EEC subsidy. California variety L-202, renamed Thaibonnet by the Spaniards, was the most popular long- grained variety (RCMD 1989).
Spanish rices had low-intermediate AC, low GT, and soft GC (Table 7). All had 17-21% AC except for Betis and Rinaldo Bersani, which had 14-15% AC (Appendix). All had low GT and soft GC. Bahia was the principal variety in the late 1970s (Barber and Tortosa 1979). Later samples did not have the high protein content of Bomba, Rinaldo Bersani, and Balilla from the 1964 samples. All the 1986 samples had low AC and were similar in Amylograph setback and consistency and cooked rice hardness. Spanish rices were mainly short and bold- grained. Betis, however, had medium-sized and -shaped grain (5.9 mm), but was still shorter than rices from Portugal (8 mm) and France (6.5 mm).
Amylose content correlated with alkali spreading value (r = 0.72**, n = 12) and grain length (r = –0.76*, n = 9). Cooked rice hardness correlated with protein content (r = 0.80**, n = 9).
62 Grain quality evaluation of world rices

Summary The japonica type varieties grown in Europe have medium-short, me- dium-bold shaped grains and low-intermediate AC (Table 7). Me- dium-sized and -shaped varieties are more important than varieties with short, bold grains except in Bulgaria, Russia, and Spain. Long, medium-shaped grain is important in Hungary. A few intermediate (23-26%)-AC rices with hard cooked rice texture—Arlesienne (France), Raffaello (Italy), and Ponta Rubra (Portugal)—are observed in the older samples, but are no longer cultivated. Long-grained varieties, subsidized by the EEC in lieu of import, are being grown in France, Portugal, and Spain (Thaibonnet [L-202]).
The preferred AC type in Spain, France, Portugal, and Russia is low AC; consumers in Greece, Italy, Hungary, and Bulgaria prefer interme- diate AC. Many promising lines from Bulgaria have low AC, but its principal variety, Krasnodarski 424, has intermediate AC.
Amylose content correlates significantly with Amylograph set- back (positive) in seven European countries (except Spain), with Amylograph consistency (positive) in five, and with alkali spreading value (four positive, one negative). Cooked rice hardness correlates significantly with GC (negative) in six countries and with Amylograph consistency (positive) in four.
Europe 63


Africa
A
R
frica produced 10.7 million t of rough rice in 1988 (2.2% of world's total). In 1986-88, 13.2 million t of rough rice were available for consumption (FAO 1990a,b). Per capita milled
rice consumption in 1986-88 was 15 kg/yr.
Benin ough rice production in Benin was 8,000 t in 1986-88 (FAO 1990b) and per capita milled rice supply was 9 kg/yr (FAO 1990a). Analysis of nine popular and farmers’ field varieties
showed mostly intermediate AC, intermediate GT, and hard GC (IITA 1985). The only sample from Benin analyzed at IRRI was long, slender- grained ADNY 11, which had high AC, low GT, and medium GC (Appendix, Table 8). This may not be the typical rice in Benin, based on an IITA survey (IITA 1985).
Cameroon
T he Republic of Cameroon produced 90,000 t of rough rice in 1989 (FAO 1990b). Annual per capita consumption of milled rice was 6 kg in 1979-81 (FAO 1984) and 10 kg in 1986-88 (FAO
1990a). IR46, planted to more than 10,000 ha, was the most popular variety in northern Cameroon in 1983 (Dalrymple 1986). Tainan 5 predominated near Bamenda. The IITA Genetic Resources Unit re- ported that of 20 popular rices from farmers’ fields, 17 had high AC, 3 had intermediate AC, 17 had intermediate GT, and most had variable GC (IITA 1985).
Only two rices from Cameroon, obtained through the International Network for Genetic Evaluation of Rice (INGER), have been analyzed

Table 8. Protein content and classification of milled rice in Africa based on apparent AC, final GT, and GC. IRRI, 1965- 91.
Sample Protein (%) AC a GT b GC c
Source (no.) Range Mean Wx VL L I H L I HI H S M H
Benin Cameroon
Ghana Ivory Coast Liberia Madagascar Nigeria Senegal Sierra Leone Tanzania Togo Zambia
Egypt
Total
1 - 8.6 0 0 0 0 1 1 0 0 0 0 1 0 2 8-11 9.8 0 0 0 1 1 2 0 0 0 0 0 2
44 5-10 6.7 0 0 29 8 7 42 2 0 0 30 2 9 22 6- 9 7.8 0 0 0 7 15 5 1 5 2 0 7 6 3 21 6-11 7.9 0 0 5 7 9 4 17 0 0 7 8 6 12 6- 9 7.6 0 0 2 3 7 8 3 0 1 5 5 2 9 5-10 7.5 0 0 1 3 5 8 1 0 0 5 4 0
66 6-11 7.7 0 0 7 16 43 52 9 4 1 15 12 29 11 5-10 7.2 0 0 0 1 10 7 4 0 0 3 1 7
108 5-10 7.0 0 0 9 14 85 38 64 5 0 20 23 53 1 - 8.6 0 0 0 0 1 1 0 0 0 0 0 1 2 8 7.6 0 0 0 1 1 1 1 0 0 1 1 0 1 - 7.4 0 0 0 1 0 0 1 0 0 0 1 0
300 5-11 7.3 0 0 53 62 185 169 117 11 2 93 64 12
a Wx = waxy (0-5.0%), VL = very low (5.1-12.0%). L = low (12.1-20.0%). I = Intermediate (20.1~25.0%), and H = high (>25%). b Indexed by alkali
gel consistency values: S = soft (61-100 mm). M = medium (41-60 mm), and H = hard (25-40 mm). spreading value: L = low (6-7), I = lnterrnediate (4-5), HI = high-Intermediate (3). and H = high (2). c Only samples analyzed from mid-I971 have

(Appendix, Table 8). IAC25 had intermediate AC (as in Brazil). Tainan 5 had high AC, low GT, hard GC, and high protein content. Amylo- graph viscosity and cooked rice hardness were also higher for Tainan 5 than for IAC25. Tainan 5 had longer grain than IAC25, but both had long, medium-shaped grain.
Egypt
R ough rice production in Egypt was 2.7 million t in 1989 (FAO 1990b). Annual per capita consumption of milled rice was 31 kg in 1979-81 (FAO 1984), estimated to be 34 kg in 1981 (ITC
1984), about 35 kg in 1986 (RCMD 1987),30 kg in 1986-88 (FAO 1990a), and 23.6 kg in 1988 (RCMD 1989). Leading varieties in 1982 in terms of total area planted were Giza 17 (49.5%), Giza 171 (43.6%), Giza 159 (3.7%), Nahda (2.9%), and others (0.3%) (not including Sakha 1 [Giza 180]) (Dalrymple 1986). Current popular varieties are Giza 176 (japon- ica), Giza 175 (japonica-indica), and Giza 181 (indica).
The Egyptians traditionally consume short-grained rices. About 85% of production is from japonica types which are preferred more than the higher yielding IR varieties (RCMD 1989). The effort to popularize long-grained indica rice requires low-intermediate AC. Two market samples of Egyptian rice had 17% and 21% AC (RCMD 1987, 1989). Five popular and farmers’ field samples had low AC (l), intermediate AC (2) and high AC (2), low-intermediate GT, and variable GC (IITA 1985).
Egyptian rices had mainly low AC, low GT, and soft GC (Table 8). Giza 171, Giza 172, Giza 176, and Giza 181 had low AC, low GT, and soft GC (Appendix). Giza 171 and Giza 172 were derived from the tradi- tional variety Nahda. The high-AC rices were mainly from IR rices, including Sakha 1 with medium-hard GC, hard-cooked rice, and high Amylograph setback and consistency. Short grains predominated over medium grains, and bold shape over medium and slender grain. Giza 175 had intermediate AC, low GT, and hard GC.
Grain length and width were significantly correlated ( r = –0.85**, n = 22). Cooked rice stickiness correlated with Amylograph setback ( r = –0.89**, n = 9) and consistency ( r = –0.94**), cooked rice hardness ( r = –0.79**, n = 13), AC ( r = –0.73**), GC ( r = 0.62*), and grain width ( r = 0.68*, n = 10). Gel consistency correlated with Amylograph setback ( r = –0.96**, n = 9) and consistency ( r = –0.98**), cooked rice hardness ( r = –0.86**, n = 25), AC ( r = –0.77**, n = 40), and protein content ( r = –0.41**, n = 40). Amylose content correlated with Amylograph
Africa 67

setback ( r = 0.92**, n = 12) and consistency ( r = 0.91**) and cooked rice hardness ( r = 0.63**, n = 25). Cooked rice hardness further correlated with Amylograph setback ( r = 0.83**, n = 9), consistency ( r = 0.88**), and peak viscosity ( r = 0.69*), grain width ( r = –0.55**, n = 21), and protein content ( r = 0.51**, n = 25). Amylograph peak viscosity correlated with grain width ( r = –0.81**, n = 9) and grain length ( r = 0.84**). Protein content also correlated negatively with grain width ( r = –0.58**, n = 22).
Ghana hana produced 74,000 t of rough rice in 1989 (FAO 1990b). Annual per capita supply of milled rice was 8 kg in 1979- 81 (FAO 1984) and 8 kg in 1986-88 (FAO 19904. Of the nine
popular and farmers' field samples, eight had intermediate AC and one had high AC; all had low-intermediate GT; and seven had hard GC (IITA 1985).
Rices from Ghana had high-intermediate AC, intermediate GT, and variable GC (Table 8). Ghanaian rices obtained from and analyzed at IITA, including TOS 7460-7474, had either high or intermediate AC, intermediate-low GT, and medium-soft GC (Appendix, Table 8). TOS 7460-7474 mostly had intermediate AC, but TOS 10601-10640 mainly had high AC. GR19 also had high AC and low GT. Only Nickerie had intermediate AC among the 1965 samples. Five market samples of raw rice, obtained through West Africa Rice Development Association (WARDA), in Accra and Ashiama had 24-28% AC, low GT, and medium-hard GC (IRRI 1990, unpubl. data). It included Ghanaian variety DS3. Local rices had protein contents of 6.1 and 8.4%. Four imported rices were raw, but three of four local samples were par- boiled. Grain length was mainly medium or short, but medium shape predominated over bold.
Grain length and width were significantly correlated ( r = –0.74**, n = 15). Alkali spreading value correlated significantly with Amylo- graph setback ( r = 0.94**, n = 7) and consistency ( r = 0.96**). Grain width also correlated with GC ( r = 0.58*, n = 15).
Ivory Coast
I vory Coast’s rough rice production was 650,000 t in 1989 (FAO 1990b). Annual per capita consumption of milled rice was 59 kg in 1979-81 (FAO 1984), 64 kg in 1987 (RCMD 1989), and 58 kg in 1986-
68 Grain quality evaluation of world rices
G

88 (FAO 1990a, IRRI 1991). About 30,000 ha were planted during 1982- 83 with Boake 1896 and Bg90-2 (Dalrymple 1986).
Preference is for good head rice, good volume expansion on cook- ing, and a soft-medium, cooked-rice texture (A. A. Adewusi, WARDA, 1990, pers. commun.). Rice is usually cooked by boiling in water (Adewusi et al 1989). Ivory Coast consumers prefer the long-grained type because it cooks dry with the grains often remaining separate (Firmin 1990). Fifteen samples had 6.1-8.6% protein (mean 7.5%).
Twenty-seven market samples obtained by WARDA had 5-8% protein; 2 had low AC, 23 had intermediate AC, and 2 had high AC (A.O. Adewusi, WARDA, 1990, pers. commun.). Seven were par- boiled. Market samples of local rices had 20-29% AC (RCMD 1989). Twenty-four popular and farmers’ field samples (except IRAT 13 [low AC]) had intermediate AC; low-intermediate GT; and medium, hard, or soft GC (IITA 1985).
Ivory Coast rices had variable AC, mainly intermediate GT, and variable GC (Table 8). IRAT rices and Chianan 8 had low AC; Palawan and Tjempovelut, intermediate AC, and Bg141 and Bg187 (from Sri Lanka), high AC (Appendix). Moroberekan and IAC164 upland rices had intermediate AC similar to that of Philippine upland variety Palawan. Only Dourado (and IRAT13 from Liberia) had long grains. Low-AC rices and Moroberekan gave softer cooked rice than high-AC rices Bg141, Bg187, and Zakpale 3. Grain length was mainly medium rather than short or long. Grain was mainly medium-shaped.
Amylose content correlated significantly with Amylograph set- back ( r = 0.86**, n = 21), peak viscosity ( r = –0.70**), and consistency ( r = 0.50*, n = 20), cooked rice hardness ( r = 0.75**, n = 21), GC ( r = –0.63**), and grain width ( r = –0.75**). Cooked rice hardness correlated with Amylograph setback ( r = 0.65**) and peak viscosity ( r = –0.50*), and with grain width ( r = –0.54*). Grain width also correlated with Amylograph peak viscosity ( r = 0.69**) and setback ( r = –0.75**). Amylograph peak viscosity and setback correlated as well ( r = –0.81**, n = 21), as did Amylograph consistency and set back ( r = –0.53*, n = 20).
Liberia
L iberia produced 280,000 t of rough rice in 1989 (FAO 1990b). Annual per capita consumption of milled rice was 111 kg in 1979-81 (FAO 1984) and 105 kg in 1986-88 (FAO 1990a).
Africa 69

Suakoko 8, well-suited for cultivation in inland valley swamps with iron toxicity, covered 2,000 ha in 1978 (Dalrymple 1986). Suakoko 9, a selection from LAC23, that is suited for upland culture, covered an estimated 80,000 ha, replacing LAC23 in the early 1980s. Two market samples had intermediate AC and GT (RCMD 1987). Twenty-one popular and farmers' field rices had intermediate AC, low GT, and medium-hard GC (IITA 1985).
Liberian rices had all AC types, mainly low GT, and variable GC (Table 8). The 1981 samples and 1988 INGER rices from Liberia had variable AC, GT, and GC (Appendix, Table 8). IRAT13 and M55 had low AC, LAC23 and Moroberekan had intermediate AC, and the rest had high AC. M55 gave the lowest Amylograph setback and consis- tency and the softest cooked rice. Grain length was long or medium except for short-grained Mahsuri. Grain shape was mostly medium. Five market samples of raw rice from Fendall obtained through WARDA had 7-11 % protein, 26-29% AC, low GT, and hard or medium GC (IRRI 1990, unpubl. data). One local sample was parboiled as was one of three imported rices.
Cooked rice hardness correlated with grain width ( r = –0.76**, n = 12), AC ( r = –0.71**), Amylograph consistency ( r = 0.99**, n = 31, and GC ( r = –0.63*, n = 12). Amylose content in turn correlated with Amylograph peak viscosity ( r = 1.00**, n = 3), grain width ( r = –0.81**, n = 12) and length ( r = –0.60*), and alkali spreading value ( r = 0.60*). Gel consistency further correlated with alkali spreading value ( r = –0.63*).
Madagascar
R ough rice production in Madagascar was 2.38 million t in 1989 (FAO 1990b). Annual per capita consumption of milled rice was 128 kg in 1979-81 (FAO 1984) and 114 kg in 1986-88 (FAO
1990a, IRRI 1991). Preferred varieties differ by region (B.B. Shahi, Madagascar-IRRI,
Rice Research Project, 1990, pers. commun.): High plateau (deficit area)—coarse grain, intermediate AC, soft- medium GC, low GT, and 40% red rices (Rojofotsy, Rojomena, Vary vato, Ambabalava type, Chianan 8). In Fiancrantsva, the southern part of the high plateau, long-grains, intermediate AC, medium GC, low GT, white grain (Vary lava 1031, Vary lava 1). Northwest coastal area (surplus)—medium-long, translucent grain, medium GC, intermediate AC, and low GT (Tsipala, Ali combo, Kiriminy, Kalila).
70 Grain quality evaluation of world rices

Southwest area, such as Tanandava, Morandava and East Coast - round white chalky grain, low AC, and soft GC (Botry, Sary Tsipala, IR8, Taiwanese type, Mampana, Tsimatahotrosa, Ben- giza). Lac Alaotra region (surplus)—medium-long, white grain, medium GC, and intermediate AC (Makalioka 34, Makalioka complex, Madigal, Tsipala complex, some Vary lava). Retail market samples in Marovoay, Lac Alaotra, and
Antananarivo City in 1986-87 were mainly medium-long, medium- shaped, high AC, low GT, and variable GC (Andrianilana et al 1990). Three market samples had 21-27% AC (RCMD 1987). Twenty farmers’ field varieties were reported to have more intermediate than high or low AC, intermediate GT, and more hard than soft or medium GC (IITA 1985).
The 1986 Madagascar samples mostly had high AC, but Chianan 8 had low AC. IAC25, Madinika, and Tsipala A were intermediate-AC varieties (Appendix, Table 8). All had low GT except Rojofotsy (red rice), which had intermediate GT. Gel consistency was either soft or medium. Amylograph viscosity results suggested the absence of hard GC among the high-AC rices. Chianan 8 and Rojofotsy had the softest cooked rice; Madinika, the hardest. Chianan 8 (bold) and Tsipala A (medium-shape) had short grains, but Ali Combo and Madinika had extra-long, slender grain. All grain lengths and shape (except round) were represented.
Cooked rice hardness correlated with grain width ( r = –0.69*, n = 9) which in turn correlated with Amylograph consistency ( r = –0.68*). Amylose content correlated with Amylograph setback ( r = 0.85**) and consistency ( r = 0.76*). Gel consistency and alkali spreading value were highly correlated ( r = –0.86**).
Mali
R ough rice production in Mali was 329,000 t in 1989 (FAO 1990b). Annual per capita consumption of milled rice was 21 kg in 1979-81 (FAO 1984) and 24 kg in 1986-88 (FAO 1990a).
Four farmers’ field samples had high AC, intermediate-low GT, and variable GC (IITA 1985). Market samples of local and imported raw rices from Bamako, Niono, and Dioro were obtained through WARDA. Out of 20 local market samples, 10 were raw and 10 were parboiled. Only two out of seven imported rices were parboiled. All local rices had high AC, low GT, and hard GC, except one with soft GC (IRRI, 1990,
Africa 71

unpubl. data). Protein content was 5-8% (mean 6.2%). Grain is long and mainly slender and medium-shaped.
Nigeria
R ough rice production in Nigeria was 1.4 million t in 1989 (FAO 1990b). Annual per capita consumption of milled rice was 12 kg in 1979-81 (FAO 1984) and 11 kg in 1986-88 (FAO 1990a,
IRRI 1991). Parboiled rice was popular (RCMD 1989). Faro26 was planted on 10,000 ha in 1984 in Kwara State. Faro27 was grown on more than 50,000 ha in Anambra State and also in Lake Chad Basin (Dal- rymple 1986). Market samples of local rices had 21-26% AC (RCMD 1989). Of 19 popular and farmers’ field rices, 16 had intermediate AC and three had high AC; all had low-intermediate GT and variable GC (IITA 1985).
The 66 samples from Nigeria mainly had high AC, low GT, and hard GC (Appendix, Table 8). The 1988 samples included six lines: three with high AC and three with low AC. The four check varieties were intermediate- and high-AC rices. Low-AC ITA307 and ITA135 had the lowest Amylograph setback and consistency and the softest cooked rice. High-AC rices Bg90-2, Faro27, ITA212, and ITA222 gave the hardest cooked rices and highest Amylograph setback and consis- tency. The new rices were long-grained with medium to slender shape. Overall, long predominated over medium and extra long grains, and medium shape over slender.
Cooked rice stickiness correlated with Amylograph setback ( r = –0.94**, n = 10) and consistency ( r = –0.90**), GC ( r = 0.87**), and AC ( r = –0.87**). Cooked rice hardness correlated with Amylograph set- back (r = 0.56**, n = 32), GC ( r = –0.71**, n = 33), alkali spreading value ( r = 0.56**), and grain width ( r = –0.46*, n = 30). Gel consistency correlated with Amylograph setback ( r = –0.77**, n = 32) and consis- tency ( r = –0.62**), alkali spreading value ( r = –0.68**, n = 56), and AC ( r = –0.59**). Amylose content correlated with Amylograph setback ( r = 0.75**, n = 42) and consistency ( r = 0.70**), alkali spreading value ( r = 0.69**, n = 66), and grain width ( r = –0.44**, n = 35). Alkali spreading value also correlated with Amylograph setback ( r = 0.69**, n = 42) and consistency ( r = 0.65**).
72 Grain quality evaluation of world rices

Senegal
S enegal produced 168,000 t of rough rice in 1989 (FAO 1990b). Annual per capita consumption of milled rice was 62 kg in 1979- 81 (FAO 1984), 59 kg in 1986-88 (FAO 1990a), and 60 kg in 1987-
88 (RCMD 1989). Leading modern varieties during the 1981-82 season were I-Kong-Pao, KSS, IR8, Jaya, and D52-37 in the North; I-Kong-Pao, IR8, IR442-2-58, and IR1529-680-3 in the South; and I-Kong-Pao in the East (Dalrymple 1986). DJ.12.519 (semidwarf) appears promising for shallow, drought-prone areas and could replace I-Kong-Pao, which has become susceptible to neck blast.
Preferred varieties had good grain swelling on cooking, soft- medium cooked rice, but no premium for head rice (A. O. Adewusi, WARDA, 1990, pers. commun.). Cooking rice with other ingredients and pan frying in oil are equally important as simple boiling (Adewusi et al 1989).
Of 13 raw rices obtained from markets by WARDA, one had low AC, two intermediate AC, and 10 high AC. All had 5-8% protein (A.O. Adewusi, WARDA, 1990, pers. commun.). Market samples of local rices Bahia and Sequial had 17-18% AC (RCMD 1987). Consumers traditionally preferred 100% brokens (RCMD 1989). Mean AC of 1988 local varieties was 26.6% (Adewusi et al 1989). Twenty farmers’ field rices had 18 with intermediate and 2 with high AC, intermediate or low GT, and soft or hard GC (IITA 1985).
Market samples in 1977 and 1990 samples from Institut Senegalais de Recherches Agricoles (ISRA), St. Lois, had predominantly high AC except for DJ 684 D, which had intermediate AC (Appendix, Table 8). All grain sizes and shapes were represented; I-Kong-Pao (bold) and DJ.12.519 (medium) were short-grained. ROK5 had the softest cooked rice. DJ 684 D had hard-cooked rice, probably because it had high protein content and gave the hardest GC.
Length and width of grain were correlated ( r = –0.94**, n = 6). Cooked rice hardness correlated with Amylograph consistency ( r = 0.92**) and GC ( r = –0.89*). Gel consistency correlated with Amy- lograph consistency ( r = –0.98**). Protein content correlated with AC ( r = –0.80**, n = 11) and alkali spreading value ( r = 0.78**). Alkali spreading value correlated with AC ( r = –0.81**) and Amylograph peak viscosity ( r = 0.88*, n = 6). Amylograph peak viscosity and grain length were also correlated ( r = 0.88*).
Africa 73

Sierra Leone
R ough rice production in Sierra Leone was 430,000 t in 1989 (FAO 1990b). Annual per capita consumption of milled rice was 92 kg in 1979-81 (IRRI 1991) and 84 kg in 1986-88 (FAO
1990a, IRRI 1991). ROKl5 and ROKl6 are rainfed upland varieties that were grown on about 150,000 ha in 1984 (Dalrymple 1986).
Preferred varieties have good head rice yield, good grain swelling on cooking, and soft-medium cooked rice (A.O. Adewusi, WARDA, 1990, pers. commun.). Of 24 popular and farmers' field rices, 20 had intermediate AC, two had low AC, and two had high AC. All had intermediate GT, and variable GC (IITA 1985). Thirteen market samples had five with intermediate AC and eight with high AC, and 6-11% protein; eight were parboiled (A. O. Adewusi, WARDA, 1990, pers. commun.). Mean AC of 1988 local rices was 24.3% (Adewusi et al 1989).
Samples of irrigated, upland, and tidal swamp varieties were predominantly high AC (Appendix, Table 8). Upland and irrigated rices had low- and intermediate-AC entries, but all tidal swamp rices had high AC, intermediate GT, and hard-medium GC. Grain size and shape were variable, but most were medium-short, medium-slender- shaped. Some long-grained rices were included in the samples. ROK3 had harder cooked rice than ROKl6, evident from their GC and Amylograph viscosity.
Cooked rice hardness correlated with grain width ( r = –0.40**, n = 44), GC ( r = -0.42**), AC ( r = 0.51**), and alkali spreading value ( r = 0.44**). Grain width correlated with AC ( r = –0.60**, n = 85), and grain length with GC ( r = 0.47**).
Tanzania
T anzania produced 570,000 t of rough rice in 1989 (FAO 1990b). Annual per capita consumption of milled rice in 1986-88 was 18 kg (FAO 1990a). Twelve popular and farmers' field rices had
nine with low AC and GT and three with intermediate AC and GT (IITA 1985). The INGER sample of Salama had high AC, low GT, and hard GC (Appendix, Table 8). It had long, medium-shaped grain.
74 Grain quality evaluation of world rices

Togo
R ough rice production in Togo was 29,000 t in 1989 (FAO 1990b). Annual per capita consumption of milled rice was 9 kg in 1979- 81 (FAO 1984) and 11 kg in 1986-88 (FAO 1990a). The two
samples from INGER were TGR94 (intermediate AC and GT) and IR46 (high AC and low GT) (Appendix). IR46 had intermediate GT at IRRI and was medium-sized and -shaped. TGR94 had lower Amylograph setback and consistency and softer cooked rice than IR46. It also had short, bold grain.
Zambia
R ough rice production in Zambia was 12,000 t in 1989 (FAO 1990b). Per capita annual consumption in 1986-88 was about 1.6 kg (FAO 1990a). Ten popular and farmers’ field samples
had four varieties with intermediate (AC), four with high AC, and two with low AC, but eight had intermediate GT, one high-intermediate GT, and one low GT (IITA 1985). Seven samples had soft GC and three had medium GC. Two samples were a mixture of red and white- pericarped grains. Kalembwe was one of four basic varieties grown in 1984 (Dalrymple 1986). It had intermediate AC and GT, medium GC (Appendix), and medium, bold grains.
Africa 75

Summary High-AC rices predominate in Africa (Table 8), except in Egypt (low AC), and part of Madagascar and probably Ivory Coast (intermediate AC). Low-AC rices are important in Egypt, Ivory Coast, Liberia, Madagascar, Nigeria, and Sierra Leone. Low GT predominates over intermediate GT, and hard and soft GC over medium GC. Grain length is mostly medium, followed by short and long. Grain shape is mostly medium, then slender and bold. Long grains predominate in Liberia, Mali, and Nigeria; medium grains in Ivory Coast; medium-short grains in Ghana and Sierra Leone; and short, bold grains in Egypt. All grain types are present in Madagascar. Not enough samples were obtained from Benin, Cameroon, Tanzania, Togo, and Zambia to make any con- clusion on rice quality characteristics.
The most common significant correlation is between GC and cooked rice hardness in five countries, followed by AC and hardness, AC and grain width, and hardness and grain width in four countries.
76 Grain quality evaluation of world rices

Oryza glaberrima and other wild rices Two major cultigens of rice are grown in Africa. Oryza glaberrima is rarely grown in pure stands; instead it is usually mixed with O. sativa. Samples were derived from the IRRI germplasm bank. The IITA gene bank provided 180 accessions of O. glaberrima.
The O. glaberrima samples were all nonwaxy and had predomi- nantly high AC, low GT, and soft-medium GC (Appendix, Table 9). The four low-AC rices with 18.9-19.4% AC had 9-12% protein and may actually be intermediate-AC types. Liberia had more intermediate-AC than high-AC rices. Protein analyses of earlier samples were very limited (Ignacio and Juliano 1968). O. glaberrima reflected the distribu- tion of rice starch properties of O. sativa in Africa but had less low AC and hard GC (Table 8).
Protein content correlated significantly with alkali spreading value ( r = 0.73**, n = 15) and AC ( r = 0.54%). Gel consistency correlated with alkali spreading value ( r = –0.24**, n = 179) and AC ( r = 0.18*).
Apparent AC and GT were more evenly distributed in other wild species than in O. glaberrima (Table 9, 10). All AC types were repre- sented except very low AC. Intermediate GT predominated; high GT followed. High GT was prevalent in O. rufipogon, O. nivara, O. breviligu- lata, O. latifolia, and O. punctata. Only two high-AC samples of O. officinalis had soft GC. Protein content of the milled rice from wild rices was more than that of O. sativa, except in O. latifolia.
Amino acid composition of the brown rice for wild species was similar to that of cultivated rice (Ignacio and Juliano 1968).
Most of the 1990 samples were thin-grained. Brown rice 100-grain wt was less than 1 g. Grain length was 2.9-6.3 mm; width was 1.1-2.8 mm. O. ridleyi had a L-W ratio of 5.7. It was test tube-milled for alkali spreading value.
Among O. breviligulata entries, AC and alkali spreading value were correlated ( r = 0.82*, n = 7). Among O. rufipogon entries, AC correlated significantly with protein content ( r = –0.81**, n = 10) and alkali spreading value ( r = 0.92**); the latter correlated with protein content ( r = –0.72**, n = 11).

Table 9. Classification of O. glaberrima accessions obtained from IRRI and IlTA based on apparent AC, final GT, and GC. IRRI, 1965,1967,1982, 1991.
Sample AC a GT b GC c
Source (no.) L I H L I S M H
Burkina Faso d 13 0 0 13 10 13 2 8 0 Cameroon 14 0 1 13 13 1 5 7 1 Chad 8 0 1 7 8 0 5 3 0 Gambia 7 0 2 5 6 1 6 0 0 Guinea 11 1 1 9 9 2 6 3 0 Ivory Coast 15 0 2 13 15 0 7 4 3 Liberia 32 0 18 14 32 0 12 16 4 Mali 9 0 1 8 9 0 9 0 0 Nigeria 41 0 11 30 39 2 23 13 3 Senegal 21 0 5 16 21 0 13 5 3 Sierra Leone 19 0 10 9 17 2 11 5 1 Zaire 2 0 1 1 2 0 0 2 0 Others 3 3 0 0 0 3 0 0
Total 195 4 53 138 181 24 99 66 15
a L = low 12.1-20.0%. I = intermediate 20.1-25.0%, and H = high >25%. b Indexed by alkali spreading value: L = low 6-7 and I = intermediate 4-5. c Only samples analyzed from mid-1971 have GC values: S = soft 61-100 mm. M = medium 41-60 mm, and H = hard 25-40 mm. d Upper Volta.
Table 10. Distribution of milled rice of wild Oryza species other than O. glaberrima in terms of apparent AC, final GT, and GC. IRRI, 1965, 1967, 1989, 1991.
Sample Protein (%) Apparent AC a GT b GC c
Oryza species (no.) Mean Wx VL L I H L I HI H S M H
O. alta O. australiensis O. brachyantha O. breviligulata O. eichingeri O. grandiglumis O. latifolia O. minuta O. nivara O. officinalis O. perennis O. punctata O. ridleyi O. rufipogon O. stapfie
Total
2 12.0 0 0 0 2 0 1 1 0 0 0 0 0 2 12.1 0 0 0 2 0 0 2 0 0 0 0 0 1 12.1 0 0 0 1 0 1 0 0 0 0 0 0 7 13.9 0 0 1 1 5 1 5 0 1 0 0 0 2 10.7 0 0 0 1 1 1 1 0 0 0 0 0 2 10.4 0 0 0 2 0 2 0 0 0 0 0 0 2 7.8 0 0 0 2 0 0 1 0 1 0 0 0 1 12.0 0 0 0 1 0 0 1 0 0 0 0 0 9 11.3 0 0 3 4 2 1 5 0 3 0 0 0 4 11.0 0 0 1 1 2 2 2 0 0 2 0 0 1 13.1 0 0 0 1 0 1 0 0 0 0 1 0 1 11.1 0 0 1 0 0 0 0 0 1 0 0 0 1 12.3 0 0 0 1 0 1 0 0 0 0 0 0
11 11.3 1 0 8 2 0 2 3 0 6 0 0 0 3 15.6 0 0 0 0 3 0 3 0 0 0 0 0
49 11.9 d 1 0 14 21 13 13 24 0 12 2 0 0
a Wx= waxy(0-5.0%), VL=very low (5.1-12.0%), L= low (12.1-20.0%), I =intermediate (20.1-25.0%), and H = high (>25%). b Indexed by alkali spreading value: L = low (6-7), I = intermediate (4-5), HI = high-intermediate (3), and H = high (2). c c Only samples analyzed from mid-1971 have gel consistency values: S = soft (61-100 mm), M = medium (41-60 mm), and H = hard (25-40 mm).
78 Grain quality evaluation of world rices
0

General discussion and conclusions Grain properties are summarized by continent. Milled rice has a mean protein content of 7.3% (Table 11). High AC predominates over inter- mediate and low AC in all continents except Europe. Low GT is more prevalent than intermediate GT. Soft GC is more prevalent than me- dium and hard GC, except in Africa, which has hard GC.
More people prefer intermediate AC than other AC types (Table 12) based on the grain quality preference of cooked rice being soft but not very sticky. Thus, the analyzed major varieties that are often recom- mended based on overall performance do not always reflect the preferred grain quality types. This trend becomes obvious when an AC scattergram (from Tables 5-8) is compared with the preferred AC type based on grain quality (Table 12). Wide variation in quality preferences within a country or region of a country is evident for Brazil, China, India, Madagascar, Pakistan, Philippines, Thailand, and USA.
All grain size and shape types are represented, except round shape. Medium-sized grain has plurality over long grains. Short and medium shape predominates, followed by slender, and then bold. Extra long grain is important mainly in Surinam. Long slender grain is important in the Americas and in exporting countries such as Myanmar, Thai- land, Pakistan, and Vietnam. Medium grain has plurality in Africa, but grain size differs widely among the countries sampled. Medium and short grains are important in Asia and Europe: medium grains in Cambodia, India, Indonesia, Laos, West Malaysia, Nepal, Pakistan, Philippines, and Turkey; short grains in Bangladesh; Bhutan; China; Japan; Republic of Korea; China-Taiwan; and Vietnam (traditional varieties); and both types in Sri Lanka. In Europe, long grain is the major type in Hungary; medium grain in France, Greece, Italy, and Portugal; and short grain in Bulgaria, Russia, and Spain.
The correlation of Amylograph setback with Amylograph consis- tency is deleted from country discussions. Forty-two countries/loca- tions have positive correlations significant at the 1% level and three others at the 5% level. Amylose content-Amylograph setback cor- relations are significant in 41 locations; AC-Amylograph consistency and GC-cooked rice hardness in 38; AC-cooked rice hardness and Amylograph setback-cooked rice hardness in 33; AC-GC in 30; GC- Amylograph consistency in 29; Amylograph consistency-cooked rice

Table 11. Summary of protein content and classification of milled rice based on apparent AC, final GT, and GC, by continent and by wild rice species. IRRI, 1963-91.
Sample Protein (%) Apparent AC a GT b GC c
Source (no.) Range Mean Wx VL L H I H L I HI H S M H
Oryza sativa L. Asia 1626 4-14 7.8 105 26 334 378 783 976 542 83 17 574 333 426 Australia d 24 5-10 6.7 2 0 13 7 2 17 6 1 0 19 2 1 North America 190 4-13 7.2 5 1 52 55 77 125 55 8 2 84 53 40 South America 301 5-13 7.9 0 0 72 95 134 233 58 8 2 107 82 99 Europe 233 5-13 7.0 0 0 119 106 8 217 12 3 1 137 56 20 Africa 300 5-11 7.3 0 0 53 62 185 169 117 11 2 93 64 112
Total 2674 4-14 7.7 112 27 643 703 1190 1737 790 114 24 1014 590 698
0. glaberrima 195 9-14 12.0 0 0 4 53 138 181 14 0 0 99 66 15 Others 49 8-17 11.9 1 0 14 21 13 13 24 0 12 2 0 0
Total 244 8-17 11.9 1 0 18 74 151 194 38 0 12 101 66 15
a Wx = waxy (0-5.0%). VL = very low (5.1-12.0%). L = low (12.1-20.0%), I = Intermediate (20.1-25.0%), and H = high (>25%). b Indexed by alkali spreading value: L = low (6-7). I = intermediate (4-5), HI = high-intermediate (3), and H = high (2). c Only samples analyzed from mid-1971 have gel consistency values: S = soft (61-100 mm), M = medium (41-60 mm), and H = hard (25-40 mm). d Excludes four samples from New Zealand.
Wild species

Table 12. Preferred rice grain type (based on apparent AC) in various rice-producing countries. IRRI, 1991. a
Waxy Low Intermediate High
Asia Laos China (japonica) Cambodia Thailand (North) Japan China b (japonica)
Republic of Korea India (Basmati) Nepal Indonesia Taiwan, China Malaysia
(japonica) Myanmar Thailand (Northeast) Pakistan (Basmati)
Philippines Thailand (Central) Vietnam
Outside Asia Argentina Brazil (upland) Australia Cuba Cuba Italy Madagascar (South- Ivory Coast
west) Liberia Russia Madagascar Spain Nigeria USA (short, medium USA (long grain)
grain)
Bangladesh China (indica) India Pakistan (IR6 type) Philippines Sri Lanka Thailand (North,
Central, South)
Brazil (irrigated) Colomb ia Guinea c
Mexico Peru
a Estimates taken from countries which produced 0.1% or more of total world rice production. b Data from the China National Rice Research Institute, Hangzhou. c Data from the International Institute for Tropical Agriculture, Lagos, Nigeria.
hardness in 27; GC-Amylograph setback and stickiness-Amylograph setback in 26; AC-alkali spreading value in 21; and grain length-width, cooked rice hardness-stickiness, and grain width-cooked rice hardness in 18.
Protein content, AC, GT (alkali spreading value), GC, Amylograph viscosity, cooked rice hardness and stickiness, and grain length and width vary widely for each location. Actual consumer demand analy- ses of country samples and surveys of quality preferences by national programs are needed to verify and fully describe the rice grain quality prized in each location.
The mean protein for 230 samples of wild rices is 11.9%. This is much higher than that of cultivated rice (Table 11). High AC, low GT, and soft GC predominate.
Africa 81

References cited Adewusi A O, Nyanteng V K, Takeda M (1989) Incorporating consumer preferences in
rice improvement objectives. Annual Rice Review Meeting, 24-26 April, WARDA. Bouake, Ivory Coast. 22 p.
Andrianilana F, Rasolo F, Rakotonjanahary R, Juliano B 0, Perez C M, Flinn J C, Shahi B B (1990) Grain quality characteristics of rice in Madagascar retail markets. Plant Foods Hum. Nutr. 40:21-30.
Baldi G, Fossati G, Molette M (1978) Varieta di riso in Italia. Ente Nazionale Risi, Milan, Italy.
Ente Nazionale Risi, Milan, Italy. Baldi G, Mozzini F, Molette M (1989) Varieta di riso in Italia. Aggiornamiento 1-1988.
Barber S, Tortosa E (1979) Rice grain quality evaluation in Spain. Pages 167-173 in Proceedings of the Workshop on Chemical Aspects of Rice Grain Quality. Interna- tional Rice Research Institute, P.O. Box 933, Manila, Philippines.
rice. J. Food Sci. Technol. 17:189-193. Bhattacharya K R, Sowbhagya C M, Indudhara Swamy Y M (1980) Quality of Indian
Blakeney A B (1979) Rice grain quality evaluation in Australia. Pages 115-121 in Proceedings of the Workshop on Chemical Aspects of Rice Grain Quality. Interna- tional Rice Research Institute, P.O. Box 933, Manila, Philippines.
Breckenridge C (1979) Rice grain evaluation in Sri Lanka. Pages 175-181 in Proceedings of the Workshop on Chemical Aspects of Rice Grain Quality. International Rice Research Institute, P.O. Box 933, Manila, Philippines.
Cagampang G C, Perez C M, Juliano B O (1973) A gel consistency test for eating quality of rice. J. Sci. Food Agric. 24:1589-1594.
Choudhury N H (1979) Studies on quality of rice in Bangladesh. Pages 123-127 in Proceedings of the Workshop on Chemical Aspects of Rice Grain Quality. Interna- tional Rice Research Institute, P.O. Box 933, Manila, Philippines.
Choudhury N, Kabir K A, Biswas S K, Islam R (1991) Influence of rice grain properties on market price in Bangladesh. Pages 332-350 in Grain postharvest research and development: priorities for the nineties. Proceedings of the 12th ASEAN Seminar on Grain Postharvest Technology, Surabaya, Indonesia, 29-31 August 1989. J.O. Naew- banij, ed. ASEAN Grain Postharvest Programme, Bangkok, Thailand.
Dalrymple D G (1986) Development and spread of high-yielding rice varieties in developing countries. Bureau of Science and Technology, Agency for International Development, Washington, D.C. 117 p.
Damardjati D G, Oka M (1991) Evaluation of rice grain characteristics preferred by Indonesian urban consumers. Pages 268-292 in Grain postharvest research and development: priorities for the nineties. Proceedings of the 12th ASEAN Seminar on Grain Postharvest Technology, Surabaya, Indonesia, 29-31 August 1989. J.O. Naew- banij, ed. ASEAN Grain Postharvest Programme, Bangkok, Thailand.
Del Mundo A M, Kosco A A, Juliano B O, Siscar J J H, Perez C M (1989) Sensory and instrumental evaluation of texture of cooked and raw milled rices with similar starch properties. J. Texture Stud. 20:97-110.

Duff B (1991) Trends and patterns in Asian rice consumption. Pages 1-22 in Rice grain marketing and quality issues. International Rice Research Institute, P.O. Box 933, Manila, Philippines.
Efferson J N (1985) Rice quality in world markets. Pages 1-13 in Rice grain quality and marketing. International Rice Research Institute, P.O. Box 933, Manila, Philippines.
FAO—Food and Agriculture Organization (1984) Food balance sheets. 1979-81 aver-
FAO—Food and Agriculture Organization (1990a) Food balance sheets. 1986-88 aver-
FAO—Food and Agriculture Organization (1990b) Rice. FAO Q. Bull. Stat. 3(4):18-26,
age. Rome.
age (computer printout). Rome.
53, 71. Feillet P, Marie R (1979) Rice breeding for grain quality in France. Pages 129-133 in
Proceedings of the Workshop on Chemical Aspects of Rice Grain Quality. Interna- tional Rice Research Institute, P.O. Box 933, Manila, Philippines.
Firmin A (1990) Quality characteristics of fifteen rice varieties in the Ivory Coast. Food Chem. 39:357-362.
Halick J V, Kelly V J (1959) Gelatinization and pasting characteristics of rice varieties as
Hirao M (1990) Trend of rice consumption in Japan. Farming Jpn. 24(1):14-20. Huang P C (1987) Changing pattern of rice grain production, consumption and dietary
life in Taiwan. Pages 47-52 in Proceedings of the International Symposium on Dietary Life of Rice-eating Populations, Kyoto, 24 Oct 1987. Research Institute for Production Development, Kyoto.
Husain A N (1984) Quality parameters for Malaysian rice varieties. MARDI Res. Bull.
Ibabao M G B, Perez C M, Juliano B O (1987) Screening rice varieties for resistance to fissuring for improved milling quality. Pages 389-397 in Grain protection in post- harvest systems. Proceedings of the 9th ASEAN Technical Seminar on Grain Post- harvest Technology, 26-29 August 1986, Singapore. B.M. de Mesa, ed. ASEAN Crops Postharvest Programme, Taguig, Metro Manila, Philippines.
Ignacio C C, Juliano B O (1968) Physicochemical properties of brown rice from Oryza species and hybrids. J. Agric. Food Chem. 16:125-127.
IITA—International Institute for Tropical Agriculture (1985) Annual report 1984. Ibadan, Nigeria.
IRRI—International Rice Research Institute (1990) Program report for 1989. P.O. Box 933, Manila, Philippines.
933, Manila, Philippines. 320 p.
East. UNCTAD/GATT, Geneva.
related to cooking behavior. Cereal Chem. 36:91-98.
12:320-332.
IRRI—International Rice Research Institute (1991) World rice statistics 1990. P.O. Box
ITC—International Trade Centre (1984) Rice: a survey of selected markets in the Middle
Juliano B O (1979) Amylose analysis in rice—a review. Pages 251-260 in Proceedings of the Workshop on Chemical Aspects of Rice Grain Quality. International Rice Re- search Institute, P.O. Box 933, Manila, Philippines.
References cited 83

Juliano B O (1985) Criteria and tests for rice grain qualities. Pages 443-524 in Rice chemistry and technology. 2d ed. B.O. Juliano, ed. American Association of Cereal Chemists, St. Paul, Minnesota.
Juliano B O, Duff B (1991) Rice grain quality as an emerging research priority in national programs. Pages 55-64 in Rice grain marketing and quality issues. International Rice Research Institute, P.O. Box 933, Manila, Philippines.
Juliano B O, Pascual C G (1980) Quality characteristics of milled rice grown in different countries. IRRI Res. Pap. Ser. 48.25 p.
Juliano B O, Perez C M, Alyoshin E P, Romanov V B, Bean M M, Nishita K D, Blakeney A B, Welsh L A, Delgado L L, El Baya A W, Fossati G, Kongseree N, Mendes F P, Brilhante S, Suzuki H, Tada M, Webb B D (1985) Cooperative test on Amylography of milled rice flour for pasting viscosity and starch gelatinization temperature. Starch 37:40-50.
Juliano B O, Perez C M, Blakeney A B, Castillo D T, Kongseree N, Laignelet B, Lapis E T, Murty V V S, Paule C M, Webb B D (1981) International cooperative testing on the amylose content of milled rice. Starch 33:157-162.
Juliano B O, Perez C M, Kaosa-ard M (1990) Grain quality characteristics of export rices in selected markets. Cereal Chem. 67:192-197.
Juliano B O, Perez C M, Maranan C L, Abansi C L, Duff B (1989) Grain quality characteristics of rice in Philippine retail markets. Philipp. Agric. 72:113-122.
Kaosa-ard M, Juliano B O (1991) Assessing quality characteristics and price of rice in selected international markets. Pages 23-35 in Rice grain marketing and quality issues. International Rice Research Institute, P.O. Box 933, Manila, Philippines.
Khush G S, Juliano B O (1985) Breeding for high-yielding rices of excellent cooking and eating qualities. Pages 61-69 in Rice grain quality and marketing. International Rice Research Institute, P.O. Box 933, Manila, Philippines.
Khush G S, Paule C M, de la Cruz N M (1979) Rice grain quality evaluation and improvement at IRRI. Pages 21-31 in Proceedings of the Workshop on Chemical Aspects of Rice Grain Quality. International Rice Research Institute, P.O. Box 933, Manila, Philippines.
Kongseree N (1979) Physicochemical properties of Thai rice varieties and methodology used in quality improvement. Pages 183-190 in Proceedings of the Workshop on Chemical Aspects of Rice Grain Quality. International Rice Research Institute, P.O. Box 933, Manila, Philippines.
Little R R, Hilder G B, Dawson E H (1958) Differential effect of dilute alkali on 25 varieties of milled white rice. Cereal Chem. 35:111-126.
Luo Y K, Min J, Wu X J (1987) Milled rice qualities in Hong Kong market [in Chinese]. Chin. J. Rice Sci. 1:192-197.
MAPT—Myanmar Agricultural Produce Trading (1990) National Workshop on Pro- motion of Premium Rice through Varietal Selection and Product Development. Ministry of Trade, Rangoon, Union of Myanmar. 54 p.
Mazzini F, Fantone G C, Cormegna M (1990) Stickiness and hardness of cooked rice of Italian varieties [in Italian]. Euroryza 1:36-41.
84 Grain quality evaluation of world rices

Merca F E, Masajo T M, Bustrillos A D (1979) Rice grain quality evaluation in the Philippines. Pages 161-165 in Proceedings of the Workshop on Chemical Aspects of Rice Grain Quality. International Rice Research Institute, P.O. Box 933, Manila, Philippines.
Ohtsubo K, Siscar J J H, Juliano B O, Iwasaki T, Yokoo M (1990) Cooperative study of Texturometer and Instron texture measurements on cooked Japanese milled rices. Rep. Nat. Food Res. Inst. 54:l-9.
Chem. 4:185-195. Perez C M, Juliano B O (1979) Indicators of eating quality for non-waxy rices. Food
RCMD—Rice Council for Market Development (1987) Evaluation of world rice varie- ties and types. Houston, Texas. 184 p.
ties and types. Update I. Houston, Texas. 98 p. RRI—Rice Research Institute, Department of Agriculture (1982) The RD rice varieties
in Thailand. Bangkok. 12 p. Rivenburgh D V (1961) Analysis of selected varieties and grades of rice moving in world
trade in terms of US official rice standards. U.S. Dep. Agric. Foreign Agric. Serv. Marketing Res. Rep. 460.40 p.
RDA-Rural Development Administration Crop Experiment Station (1990) Rice varietal improvement in Korea. 2d ed. R.K. Park, S.Y. Cho, H.P. Moon, H.C. Choi, N.K. Park, and Y.K. Choi, eds. Suwon. 109 p.
Simpson J E, Adair C E, Kohler G O, Dawson E H, Deobald H J, Kester E B, Hogan J T, Batcher O M, Halick J V (1965) Quality evaluation studies of foreign and domestic rices. U.S. Dep. Agric. Tech. Bull. 1331. 186 p.
Song S (1990) Improvement of rice quality — Taiwan’s experience. Pages 45-47 in Abstracts of the Asian Symposium on Rice and Nutrition, 22-23 June 1990, Taipei. Taipei Dietitians Association, Taipei.
RCMD—Rice Council for Market Development (1989) Evaluation of world rice varie-
TCA—Taiwan Council of Agriculture (1987) Rice varieties in Taiwan 1930-1987. Taipei. 339 p.
Unnevehr L J, Juliano B O, Perez C M, Marciano E B (1985) Consumer demand for rice grain quality in Thailand, Indonesia, and the Philippines. IRRI Res. Pap. Ser. 116.
Webb B D (1990) Quality characteristics of some imported specialty rice varieties. Pages 93-94 in Proceedings of the 23rd Meeting of the Rice Technical Working Group, Beloxi, Mississippi, 26-28 Feb 1990. Texas A&M University College Station, USA.
Webb B D, Bollich C N, Carnahan H L, Kuenzel K A, McKenzie K S (1985) Utilization characteristics and qualities of United States rice. Pages 25-35 in Rice grain quality and marketing. International Rice Research Institute, P.O. Box 933, Manila, Philip- pines.
Wong L C Y, Hussain A N, Ali A, Ithnin B (1991) Understanding grain quality in the Malaysian rice industry. Pages 293-311 in Grain postharvest research and develop- ment: priorities for the nineties. Proceedings of the 12th ASEAN Seminar on Grain Postharvest Technology, Surabaya. Indonesia, 29-31 August 1989. J.O. Naewbanij, ed. ASEAN Grain Postharvest Programme, Bangkok, Thailand.
20 p.
References cited 85

Acknowledgments The data on properties of milled rice are the results of the accumulated effort of the IRRI Biochemistry Unit in the Plant Breeding, Genetics and Biochemistry Division since 1962. The IRRI Analytical Services Laboratory took over the protein analyses in 1977.
Special thanks go to those who processed and analyzed rice samples: E.L. Albano, L.J. Cruz, R.G. Santiago, E. Almendral, E. Delfin, O. Diongco, J. Beato, L. Estenor, A. Fabellar, G. Elizondo, F. Gulay, and R. Punzalan. Some country samples were analyzed by S.K. Biswas (Bangladesh), Y.-K. Luo (China), D.T. Castillo (Cuba), A.A. El- Shirbeeny (Egypt), S.M. Jagtap (India), D.S. Damardjati (Indonesia), Y .B. Kim (Republic of Korea), A.N. Hussain (Malaysia), M. Thant (Myanmar), N.B. Ramos-Lapurga and F.E. Merca (Philippines), O.T. Bobade (Nigeria), C. Breckenridge (Sri Lanka), and Le Huu Hieu, Le Thi Bech Lien, and Le Thi Thu Thuy (Vietnam).
Ted Gillin, Statistics Division, FAO, Rome, supplied information about rice supply
We also acknowledge those who supplied samples and grain quality information from national programs, including INGER representatives in Latin America, Africa, and at WARDA.
and use in various countries from the 1986-88 food balance sheet.

Institutions and organizations supplying rice samples
Argentina—Estacion Experimental de Arroz, Universidad Nacional de la Plata, 1900 La Plata.
Australia— Agricultural Institute, New South Wales Department of Agriculture, Yanco, New South Wales 2703. Bangladesh— Bangladesh Rice Research Institute, Joydebpur. Benin— INGER Africa, c/o International Institute of Tropical Agriculture (IITA), Ibadan, Nigeria. Bhutan— International Rice Germplasm Center (IRGC) International Rice Research Institute (IRRI) (D. Senadhira and G.L. Denning). Bolivia— International Network for Genetic Evaluation of Rice (INGER) Latin America, c/o Centro Internacional de Agricultura Tropical (CIAT), Cali, Colombia. Brazil— Instituto Rio Grandense do Arroz, Cachoeirinha 94900; Centro Nacional de Pesquisa de Arroz e Feijão, Empresa Brasileira de Pesquisa Agropecuaria, 74001 Goiania, Goias. Brunei Darussalam— Kilanas Agricultural Research Centre, Department of Agriculture, Bandar Seri Begawan 2059. Bulgaria— Institute of Introduction and Plant Genetic Resources, "K. Malkov", 4122 Sadovo, District Plovdiv. Cambodia— Directorate of Agriculture, Phnom Penh; IRRI-Cambodia Project, Phnom Penh-Day Eth; Prey Phdau and Tuk Will Research Stations. Cameroon— INGER Africa, c/o IITA, Ibadan, Nigeria. Chile— Estacion Experimental Quilamapu, IIA, Chillan; INGER Latin America, c/o CIAT, Cali, Colombia. China— Cereal Chemistry Department, China National Rice Research Institute, Hangzhou, Zhejiang. Colombia— Rice Breeding Program, Instituto Colombiano Agropecuario Regional No. 8, Villavicencio; INGER Latin America, c/o CIAT, Cali, Colombia. Costa Rica— INGER Latin America, c/o CIAT, Cali, Colombia. Cuba— Estacion Experimental del Arroz “Nina Bonita”, Bauta, Havana. Dominican Republic— INGER Latin America, c/o CIAT, Cali, Colombia. Ecuador— INGER Latin America, c/o CIAT, Cali, Colombia. Egypt— Grain and Bread Technology Section, Ministry of Agriculture, Giza; Arid Lands Agricultural Development Program, Cairo; Rice Research Station, Field Crops Research Institute, Agricultural Research Center, Giza. El Salvador— Agricola Dolores Cruz, S.A., Beneficio de Arroz “La Terminal,” San Salvador and INGER, c/o CIAT, Cali, Colombia.

France — Laboratoire de Cereales, Sous-Direction des Cultures Vivrieres, Institut de Recherches Agronomiques Tropicales et des Cultures Vivrieres (IRAT), Centre International de Recherche Agronomique pour le Developpement (CIRAD), 34060, Montpellier Cedex 01. Gambia — INGER Africa, c/o IITA, Ibadan, Nigeria. Ghana — Agricultural Irrigation Research Station, University of Ghana, Kpong; INGER Africa, c/o IITA, Ibadan, Nigeria. Greece — Institut de Cereales, 54110 Thessalonique. Guatemala — INGER Latin America, c/o CIAT, Cali, Colombia. Guyana — Institute of Applied Science and Technology, University Campus Turkeyen, Greater Georgetown. Haiti — INGER Latin America, c/o CIAT, Cali, Colombia. Hungary — Rice Section, Research Institute for Irrigation, 5540 Szarvas. India — Directorate of Rice Research, Rayendranagar Hyderabad, A.P. 500030; Konkan Krishi Vidyaputh Karjat (Kolaba), Maharashtra State. Indonesia — Central Research Institute for Agriculture, Bogor; Sukamandi Research Institute for Food Crops, Sukamandi, Subang, West Java. Iran — Rice Research Institute, Rasht. Ivory Coast — CIRAD-IRAT 04 BP125, Bouake; IITA; INGER Africa, c/o IITA, Ibadan, Nigeria. Italy — Centro di Ricerche sul Riso, Ente Nazionale Risi, Mortara. Japan — National Food Research Institute, Tsukuba, Ibaraki 305; Central Research Laboratory, Japan Grain Inspection Association, Ichikawa-shi, Chiba-ken. Korea, Republic of — Yeongnam Crop Experiment Station, Rural Development Admini- stration, Milyang; Crop Experiment Station, Rural Development Administration, Suwon. Laos — United States Agency for International Development, Vientiane, IRRI-Cambo- dia Project, Phnom Penh. Liberia — INGER Africa, c/o IITA, Ibadan, Nigeria. Madagascar — Madagascar-IRRI Rice Research Project, Antananarivo 101. Malaysia — Malaysian Agricultural Research and Development Institute, 13200 Kepala Batas, Seberang Perai; Agricultural Research Centre, Tuaran, Sabah; Agricultural Research Centre, Semongok, 93720 Kuching, Sarawak. Mali — West Africa Rice Development Association (WARDA), c/o ADRAO, Bouake., Ivory Coast. Mexico — Centro de Investigaciones Agricolas de Sinaloa, Culiacan, Sinaloa; National Rice Improvement Program, Zacatepec, Morelos. Myanmar (Burma) — Soil and Chemistry Division, Agricultural Research Institute, Yezin, Pyinmana. Nepal — National Rice Improvement Program, Department of Agriculture, Pariva- napur, Narayani Zone. Nigeria — IITA, Ibadan; National Cereals Research Institute, Moor Plantation, Ibadan.
88 Grain quality evaluation of world rices

Pakistan— Rice Research Institute, Kala Shah Kaku, Lahore, Punjab; Rice Research Institute, Dokri. Panama —INGER Latin America, c/o CIAT, Cali, Colombia. Paraguay— INGER Latin America, c/o CIAT, Cali, Colombia. Peru— Universidad Agraria, Lima; Estacion Experimental Agropecuaria de Lam- bayeque S.I.P.A., Lambayeque; Estacion Experimental Agropecuaria “Vista Florida”, Instituto Nacional de Investigacion Agraria y Agroindustrial, Chiclayo. Philippines— University of the Philippines at Los Baños; Bureau of Plant Industry, Maligaya Rice Research and Training Center, Muñoz, Nueva Ecija; College of Natural Sciences and Mathematics, Mindanao State University, Marawi City; IRRI. Portugal— Empresa Publica de Abastecimiento de Cereais, Lisbon. Russia— Rice Processing Department, All-Union Rice Research Institute, Belozernoe, Krasnodar. Sénégal— CREA, Faculte de Droit et Sciences Economiques, Universite de Dakar, Dakar-Fann; Institut Senegalais de Recherches Agricoles, St. Lois. Sierra Leone— WARDA, Rokupr; Rice Research Station, Rokupr; INGER Africa, c/o IITA, Ibadan, Nigeria. Spain— Instituto Agroquimica y Tecnologia de Alimentos, Valencia. Sri Lanka— Central Agricultural Research Institute, Peradeniya. Surinam— Rice Research and Breeding Station, Foundation for the Development of Mechanized Agriculture in Surinam, New Nickerie. Taiwan, China— Agronomy Division, Food and Agriculture Division, Council of Agri- culture, Taipei, Taiwan 10728; Taichung Agricultural District Experiment Station Changhua, Taiwan; Joint Commission on Rural Reconstruction, Taipei, Taiwan. Tanzania— INGER Africa, c/o IITA, Ibadan, Nigeria. Thailand— Central Breeding Station, Ministry of Agriculture, Bangkhen, Bangkok 10900; Pathum Thani Rice Research Center, Thanyaburi, Pathum Tani 12110. Togo— INGER Africa, c/o IITA, Ibadan, Nigeria. Turkey— Department of Agroecology and Plant Improvement, Faculty of Agriculture, Ege University, Bornova, Izmir. USA— National Rice Quality Laboratory, U.S. Department of Agriculture, Beaumont, Texas 77706; Uncle Ben's Inc., Houston, TX 77251-1752; California Cooperative Rice Research Foundation, Inc., Rice Experiment Station, P.O. Box 306, Biggs, CA 95917. Venezuela— INGER Latin America, c/o CIAT, Cali, Colombia. Vietnam— Rice Office, Ministry of Agriculture, Saigon; National Institute of Agricul- tural Sciences, Hanoi; Mekong Delta Farming Systems Research Development Center, University of Cantho, Cantho, Haugiang; Postharvest Technology Institute, Hanoi. Zambia— INGER Africa, c/o IITA, Ibadan, Nigeria.
Samples of wild species were obtained from T.T. Chang, IRGC, and D.S. Brar, Plant Breeding, Genetics, and Biochemistry Division, IRRI. The O. glaberrima samples were from N.Q. Ng, Genetic Resources Unit, IITA, Ibadan, Nigeria.
Institutions/organizations 89

Sources of 1990 grain quality information in national programs Argentina— Vidal A A, Estacion Experimental “Ing. Agric. Julio Hirschhorn,” Facultad de Agronomia, Universidad Nacional de la Plata, Suc. 6-C. Correo 47,1900 La Plata. Australia— Blakeney A B, Yanco Agricultural Institute, Yanco, NSW 2703. Bangladesh —Choudhury N H, Grain Quality and Nutrition Division, Bangladesh Rice Research Institute, Gazipur. Bhutan— Chettri G B, Department of Agriculture, Thimphu. Brazil— de Maia De Castro E, Centro Nacional de Pesquisa de Arroz e Feijão, Empresa Brasileira de Pesquisa Agropecuaria, 74001 Goiania, Goias; Carmona P S, Instituto Rio Grandense do Arroz, Cachoeirinha. Brunei Darussalam— Hong O-J, Kilanas Agricultural Research Centre, Department of Agriculture, Bandar Seri Begawan 2059. Bulgaria— Perfanov K, Institute of Introduction and Plant Genetic Resources ‘K. Malkov’, 4122 Sadovo, District Plovdiv. Cambodia— Chaudhary R C, IRRI-Cambodia Project, P.O. Box 01, Phnom Penh. Chile— Alvarado R A, Estacion Experimental Quilamapu, IIA, Chillan. China— Luo Yu-kun, Cereal Chemistry Department, China National Rice Research Institute, Hangzhou, Zhejiang, Colombia— Leal D M, Instituto Colombiano Agropecuario Regional No. 8, Apartado Aereo 2011, Villavicencio; Cuevas F P, INGER Latin America, c/o CIAT, Apartado Aereo 67-13, Cali. Cuba— Castillo D T, Instituto de Investigaciones del Arroz, Km 16 1/2, Autopista del Mediodia, Bauta, Havana Province. France— Faure J, Laboratoire de Cereales, Sous-Direction des Cultures Vivrieres, IRAT, CIRAD, 34060 Montpellier Cedex 01. Greece— Hadjisavva S, Institut de Cereales, 54110 Thessalonique. Guyana— Gordon EM, Institute of Applied Science and Technology, University Campus Turkeyen, P.O. Box 101050 Greater Georgetown. Hungary— Simon I K, Rice Section, Research Institute for Irrigation, 5540 Szarvas. Italy— Carriere R, Associazione Industrie Risiere Italiene, 27036 Mortara. Japan— Chikubu S, Department of Food Science and Nutrition, Tokyo University of Agriculture, Setagayaku, Tokyo; Yokoo M, Research Planning Section, Research Plan- ning and Liaison Department, National Agriculture Research Center, Ibaraki, Tsukuba, 305. Korea, Republic of— Chung G S, Yeongnam Crop Experiment Station, Rural Develop- ment Administration, Milyang; Park R K, Crop Experiment Station, Rural Develop- ment Administration, Suwon. Liberia— Adewusi A O, Postharvest Technology Unit, WARDA, 1000 Monrovia 10; INGER Africa, c/o IITA, Ibadan, Nigeria.

Madagascar— Shahi B B, Madagascar-IRRI Rice Research Project, Antananarivo 101. Malaysia— Husain A N, Malaysian Agricultural Research and Development Institute, 13200 Kepala Batas, Seberang Perai; Idris J, Agricultural Research Centre, Tuaran, Sabah; Sim P, Agricultural Research Centre, Semongok, 93720 Kuching, Sarawak. Mexico— Lozano L D, Instituto Nacional de Investigaciones Forestales y Agropec- uarias, Apartado Postal No. 10, Chapingo. Myanmar— Sein Tun, Soil and Chemistry Division, Agricultural Research Institute, Yezin, Pyinmana. Nigeria— Alluri K, INGER Africa, c/o IITA, Ibadan. Puru— Hernandez J E, Estacion Experimental Agropecuaria 'Vista Florida', Instituto Nacional de Investigacion Agraria y Agroindustrial, Apartado 116, Chiclayo, Philippines— Escuro P B, Rice Varietal Improvement Program (RVIP), PhilRice, College, Laguna; Del Mundo A M, RVIP, PhilRice, and associate professor, Institute of Human Nutrition and Food, College of Human Ecology, University of the Philippines at Los Baños, College, Laguna. Taiwan, China— Teng Y C, Agronomy Division, Food and Agriculture Division, Council of Agriculture, Taipei, Taiwan 10728. Thailand— Kongseree N, Pathum Thani Rice Research Center, Thanyaburi, Pathum Thani 12110. USA —Webb B D, Rice Research Southern Region, ARS USDA, Beaumont, Texas 77713. Vietnam— Le Thu Thuy, Mekong Delta Farming Systems Research and Development Center, University of Cantho, Cantho, Haugiang; Le Doan Dien, Postharvest Technol- ogy Institute, Hanoi; Le Thi Bich Lien, Postharvest Technology Institute, Hanoi.
Sources of information 91

Cross reference index of variety names A ADNY2 Liberia see ROK11 Liberia/
Sierra Leone Akibare Japan see also Chucheongbyeo
Rep. of Korea Alfa see Alpha France B Bg90-2 Sri Lanka see also Bg90-2 Liberia,
BR1 see Chandina Bangladesh BR2 see Mala Bangladesh BR4 Bangladesh see also Sin-thein-gi
Nepal, Nigeria
Myanmar BR5 see Dulhabhog Bangladesh BR7 see Balam Bangladesh BR8 see Asha Bangladesh BR9 see Sufala Bangladesh BR-IRGA409 see IRGA409 Brazil, Para-
guay, USA BR-IRGA4lO see IRGA410 Brazil BR-IRGA411 see IRGA411 Brazil BR-IRGA412 see IRGA412 Brazil BR-IRGA413 see IRGA413 Brazil BR-IRGA414 see IRGA414 Brazil Brrisail see BR4 Bangladesh C Chu Cheong byeo see also Akibare Rep.
CICA4 Colombia see also Chancay Peru D D25-4 see Nga Kywe Myanmar DR-83 see IR2053-261-2-3 Pakistan Doonqara see YRL25 Australia Dum Safid see Dom Safid Iran Dum Safid 76 see Dom Suffaid 76 Iran Dum Siah see Dom Siah Iran Dum Surkh see Dom Surkh Iran Dum Zard see Dom Zard Iran
of Korea
E Echuca see YRM6 Australia ECIA67 see IAC14 Cuba ECIA179 see IAC15 Cuba F FAROl see Bg79 Nigeria FARO2 see Dl14 Nigeria FARO4 see KAVl2 Nigeria FARO5 see Makalioka 823 Nigeria FARO6 see I.C.B. Nigeria FARO7 see Mali Ong Nigeria FAR08 see Mas2401 Nigeria FARO9 see Siam29 Nigeria FARO10 see Sindano Nigeria FAROl 1 see OS6 Nigeria FARO12 see SML 140/10 Nigeria FARO13 see IR8 Nigeria FARO14 see B Type x Kunter Nigeria FARO15 see Bg79 x IR8 Nigeria FARO16 see Tjina x TN1 Nigeria FARO17 see Mas2401 x TNl Nigeria FARO18 see Tjina Nigeria FARO19 see IR20 Nigeria FARO20 see BPI-76 (Bicol) Nigeria FARO21 see Taichung Native 1 Nigeria FARO22 see IR627-1-31-4-3-7 Nigeria FARO23 see IR5-47-2 Nigeria FARO24 see De Gaulle Nigeria FARO25 see FARO × 56/30 Nigeria FARO29 see Bg90-2 Nigeria FAROX 147 see Mas2401 x B572 Nigeria FAROX 166 see Tjina × IR8 Nigeria FAROX 1880 see Tjina//IR8 × IR8 Ni-
geria G Giza 173 see Reiho Egypt Giza 180 see Sakha1 (IR579-48-1-2) Egypt

Goolarah see YRF6 Australia Gurdil see Radin Jawa Sierra Leone I I.K.P see I-Kong-Pao Senegal IR8 Philippines see also Milagro Filipino
Mexico, Ria Malaysia, IR8 Nigeria (FARO13)
IR20 Philippines see also IR20 Bangla- desh, IR20 Nigeria
IR22 Philippines see also Navolato A71, Mexico
IR28 Philippines see also Amol-2 Iran, BR6 Bangladesh
IR43 Philippines see also IR1529 Cuba Irrisail see IR20 Bangladesh
J J104 see Jucarito 104 Cuba Jasmine see Khao Dawk Mali 105 Thai-
land Jasmine-85 USA see also IR841-67-1 Phil-
ippines L Laxmi see IR2061-628-1 Nepal Leuang Hawm see Khao Hawn Nakorn
Patom Thailand M MR1 see Setanjung Malaysia MR7 see Sekencang Malaysia MR10 see Sekembang Malaysia MR27 see Kadaria Malaysia MR47 see Pulut Siding Malaysia MR52 see Manik Malaysia MR71 see Muda Malaysia MR73 see Makmur Malaysia MR77 see Seberang Malaysia Mahsuri Malaysia see also Pajam Bangla-
desh, Manawhari Myanmar, Mahsuri India
Matchandu see Madcandu East Malay- sia (Sabah)
Mehran 69 see IR6 (IR6-156-2) Pakistan
Molawin see RSBRc4 Philippines Moosa Taron 1 see Moosa Tarom 1 Iran Mukta see BR11 Bangladesh Mussa Tarom 110 see Moosa Tarom 110
Iran N Nahalin see RSBRc2 Philippines P PK487 see Basmati 385 Pakistan PSBRc 1 see Makiling Philippines Pelita 1-1 Indonesia see also Pale Thwe
Myanmar Perla see IAC13 Cuba Podiwee A-8 see Podiwi A-8 Sri Lanka Progoti see BR10 Bangladesh Pulot Siding see Pulut Siding Malaysia R ROCK5 see ROK5 Senegal, Sierra Leone S Saavedra V4 see IR-1529 (IR1529-430-3)
Bolivia Sabitri see IR2071-124-6-4 Nepal Salarie see Salari Iran Seo Gwang Byeo see Seu Gwang Byeo
Seo Nam Byeo see Seu Nam Byeo Rep. of
Seomjin Byeo see Seumjen Byeo Rep. of
Rep. of Korea
Korea
Korea T Texmati see Della USA Thaibonnet Spain see L-202 USA Tono Brea/IR8 see Juma 58 Dominican
Republic Y Yar-1 see C22 Myanmar Yeong Deogbyeo see Yong Jubyeo Rep.
of Korea
Cross reference index 93

Acronyms of rice varieties/lines
Code
A AA Adt
B BAL/SK BAM
BD B-E- Bg
BH BJM BKNFR
BL
BPI
BQ BR
BR BRJ
BW
C
C
Meaning
Antersal
Aduthurai
Berhampur
Batalagoda
Deepwater rice Bangkhen-floating rice
Balandean
Bureau of Plant Industry
Bangladesh rice
Bihar rice Bangladesh rice Joydebpur Bombuwella
College of Agriculture
Centro Operativo Colonia Mascias
Station/Country
India Sierra Leone Aduthurai Rice Expt. Stn, Tamil Nadu, India
Hungary Turkey Berhampur Rice Res. Stn., Berhampur, Orissa, India Sierra Leone Philippines Central Agric. Res. Inst., Batalagoda, Sri Lanka Sierra Leone Indonesia Prachinburi Rice Expt. Stn., Ransang, Prachinburi, Thailand Central Res. Inst. for Agric. Expt. Stn., Balandean, Banjar, Indonesia Dept. of Agriculture, Manila, Philippines Sierra Leone Bangladesh Rice Res. Inst., Jovdebpur, Dhaka, Bangladesh Bihar, India Bangladesh Rice Res. Inst., Joydebpur, Dhaka, Bangladesh Bombuwella Rice Res. Stn., Bombuwella, Sri Lanka
University of the Philippines, Los Baños, Laguna, Philippines Sta. Fe, Argentina
-
- -
- -
-
-

CEA CENTA
CH CICA
CINIA CN CNA CP
CR
CR
D DA
DB DJ
E EAL ECIA
EEA
EMPASC
EPEAL
FARO
FAROX
FB FMC
G GC GEB
GR Gz
Centro Nacional de Tecnificacion Agricola Chira Centro Instituto Colombiano Agropecuario
Cuba Los Palacios
Central rice
Costa Rica
Paraguay El Salvador
India Cali, Colombia ex International Center for Tropical Agriculture Chile Vietnam Philippines Rice Res. Stn., Los Palacios, Perai del Rio, Cuba Central Rice Res. Inst., Cuttack, Orissa, India Costa Rica
Myanmar Dacca Dacca Res. Stn., Dacca,
Bangladesh Dhaka, Bangladesh Bangladesh
Pakistan
Nigeria Peru
Estacion Central Havana, Cuba Investigaciones del Arroz Estacao Experimental Cachoeira, Brazil do Arroz
Empresa Brasileira de Pesquisa Agropecuaria (EMBRAPA), Goiania, Goias, Brazil Brazil
Federal Agricultural Nigeria Research Oryzae Federal Agricultural Nigeria Research Oryzae Cross
Philippines Peru
Hungary Sierra Leone
Government Economic Tamil Nadu Agric. Univ., Botany Coimbatore, Tamil Nadu,
India Ghana
Center, Giza, Egypt Giza cross Agricultural Research
Acronyms 95
-
- -
-
-
- -
-
-
- -
- -
-

H
H
H HSC
IAC
ICA
ICTA
IET
IGP INIAP IR
IRAT
IRGA
ISA
ITA
Iz
J
JS
K KAV KN
KS
KT
Hybrid
Instituto Agronomico de Campinas Instituto Colombiano Agropecuaria Institute of Agricul- tural Science and Technology Initial Evaluation Trial
IRRI rice
Institut de Recherches Agronomiques Tropicales et des Cultures Vivrieres (France) Instituto Rio Grandense do Arroz
Institute of Tropical Agriculture Izmir
Jeypore
Karjat
Kuningan
Kala Shah Kaku
Central Agric. Res. Inst., Batalagoda, Sri Lanka Estacion Experimental de Arroz, Univ. Nacional de la Plata, Argentina
Hungary
Sao Paolo, Brazil
Cali, Colombia
Guatemala
Japan
All-India Coordinated Rice Improvement Program, Hyderabad, India India Ecuador Int. Rice Res. Inst., Los Baños, Laguna, Philippines Bouake, Ivory Coast
Cachoeira, Brazil
Dominican Republic/ Sierra Leone Int. Inst. of Tropical Agriculture, Ibadan, Nigeria Izmir, Turkey
Rice Res. Stn. (OUAY), Jeypore, Orissa, India All-India Coordinated Rice Improvement Program, Hyderabad, India
Karjat, Maharashtra, India Nigeria Rice Res. Stn., Kuningan Branch, Cirebon, Indonesia Rice Res. Stn., Kala Shah Kaku, Lahore, Pakistan Nepal
96 Grain quality evaluation of world rices
-
- -
- -
-
-
-

L
L LAC
LD
M
M
MG M R
MRC
MTL
N
OM
OS
P
PARC
PK
PNA PSBRc Ptb
RAU
RC RD RH ROK
ROHYB
Long grain
Lua (paddy) Liberian Agric. Co.
Labuduwa
Medium grain
Maros
MARDI rice
Maligaya Research Center
Mien Tay Lua
Nong Nghiep (Agriculture)
O Mon
Oryza sativa
Palmira
Philippine Atomic Research Center Pakistan
Philippine Seed Board Rice Pattambi
Rajendra Agricultural University
Rice Department
Rokupr
WAR lines
California Coop Rice Res. Found. Inc., Biggs, CA, USA Cantho Univ., Cantho, Vietnam Central Agric., Res., Inst., Suakoko, Liberia Govt. Farm, Labuduwa, Galle, Sri Lanka
California Coop Rice Res. Found. Inc., Biggs, CA, USA Maros Agric. Res. Inst., Maros, Sulawesi, Indonesia Brazil Malaysia Agric. Res. and Dev. Institute, Kuala Lumpur, Malaysia Maligaya Rice Res. and Training Center, Muñoz, Nueva Ecija, Philippines Cantho Univ. Cantho, Vietnam
Vietnam
Cuu Long Delta Agric. Tech. Center, 0 Mon, Hau Giang, Vietnam Federal Dept. of Agriculture, Nigeria
CIAT Substation, Palmira, Colombia Quezon City, Philippines
Rice Res. Inst., Kala Shah Kaku, Lahore, Pakistan Peru Manila, Philippines Central Rice Res. Stn., Pattambi, Kerala, India
Pusa, Bihar, India
Sierra Leone Bangkok, Thailand Sierra Leone Rice Res. Stn., Rokupr, Sierra Leone WARDA Rice Res. Stn., Rokupr, Sierra Leone
Acronyms 97
-
-
-
-

RP Rice Project
RPW RTN
RU
S
SL SLU
SML
SPR
SR
T
TGR TOS
TP
U UPL-Ri
V
WAR
X
YRB
YRF
YRL
YRM
Short grain
Samalkot
Stechling Mechanische Landbouw Suphan Buri rice
Suweon rice
Type
Tropical Oryzae selection
University of the Philippines at Los Baños-Rice
West Africa Rice
Yanco rice bold
Yanco rice fragrant
Yanco rice long
Yanco rice medium
98 Grain quality evaluation of world rices
All-India Coordinated Rice Improvement Program, Hyderabad, India India Agric. Res. Stn., Maharashtra, India
MARDI Rice Research Center, Malaysia
California Coop Rice Res. Found. Inc., Biggs, CA, USA Sierra Leone Rice Res. Stn., Samalkot, Andhra Pradesh, India SML Agric. Found., New Nickerie, Surinam Suphan Buri Rice Expt. Stn., Suphan Buri, Thailand Suweon Crop Expt. Stn., Suweon, Korea
Central Rice Res. Inst., Cuttack, Orissa, India Togo Int. Inst. of Tropical Agriculture, Ibadan, Nigeria Sabah, Malaysia
Vietnam College, Laguna, Philippines
Vietnam
West Africa Rice Development Association, Bouake, Ivory Coast
El Salvador
Yanco Agric. Inst., Yanco, LSW, Australia Yanco Agric. Inst., Yanco, NSW, Australia Yanco Agric. Inst., Yanco, NSW, Australia Yanco Agric. Inst., Yanco, NSW, Australia
- -
-
-
-
-
-
-
-

Appendix

Appendix Quality characteristics of milled rice, by country, and wild rice.
Date Amy- Alkali Gel Amylograph viscosity lnstron Crop analyzed Protein lose spread- consis- Length Width Water year (%) (%) ing tency Peak Set- Consis- Hard- Sticki- (mm) (mm) regime b
(mo) (yr) value (mm) back tency ness ness (BU) a (Bu) (Bu) (kg) (g-cm)
AGULAO X DESC. BLUEBELLE SEL.DREW BLUEBONNET SEL.INTA BOND CALA P.A. CHAJARI P.A.
CLAUDIO P.A. COL. MASCIAS 5 CUPALEN P.A. DAWN P.A. ENTRERRIANO P.A. FORTUNA INTA FORTUNA INTA GUAYAQUIRARO
ClCA Y DESC 3-1-2-3-1
H124-36-1-1-1-2 H135-20 H135-23 H135-48-2
0 RYZA SA TI VA
ARGENTINA
83 11 84 6.8 18.3 7.0 76 76 8 76 7.7 22.0 7.0 60 76 8 76 6.2 24.5 5.2 65 83 11 84 8.3 25.8 6.5 48 76 8 76 6.8 20.0 7.0 80 76 8 76 5.8 21.3 7.0 76 83 11 84 7.1 18.9 4.8 60 76 8 76 7.8 16.8 7.0 81 83 11 84 8.2 17.2 6.6 76 76 8 76 8.6 16.3 7.0 82 76 8 76 7.5 25.9 7.0 60 76 8 76 5.9 21.8 7.0 75 76 8 76 9.0 22.1 6.9 57 83 11 84 7.0 19.6 7.0 82 83 11 84 9.4 21.6 6.0 30 83 11 84 6.9 25.3 6.8 32 83 11 84 7.4 17.4 4.2 66 83 11 84 8.2 18.2 3.0 67 83 11 84 7.1 19.0 3.0 91
- 7.0
- 7.0
- 8.4
- 7.4
- 7.5 - 9.3 - 8.8 - 7.7 - 8.8 - 7.8
- 7.0 2.6
- 6.6 2.0
- 6.5 2.0
- 6.8 2.0
- 6.7 2.6 - 6.4 2.1 - 6.5 2.2 - 6.5 2.1 - 6.7 2.4 - 6.3 2.2
- - - - - - - - - - - - - - - - - - - -
- - - - - - - - - - - - - - - - - -
- -
- -
-
- - - -
- -
- -
-
- - - -
- -
- -
-
- - - -
- -
- -
-
- - - -
- -
- -
-
- - - -
I I I I I I I I I I I I I I I I I I I

H136-22 83 11 84 H149-2-3 83 11 84 H149-3-2-2 83 11 84 H150-4-4-1 83 11 84 H156-1-1-2 83 11 84 H156-40-1 83 11 84 H7-39-1 83 11 84 H7-45-1 83 11 84 H7-9-1-1 83 11 84 H7-9-1-2 83 11 84 H7-9-1-3 83 11 84 IET4940-1-1-1 83 11 84 INACORA SEL.IBERA 76 8 76 IR841 83 11 84 LA PLATA AYUl F.A. 76 8 76 LA PLATA GUALEYAN F.A. 76 8 76 LA PLATA ITAPE F.A. 76 8 76 LEMONT 83 11 84 LUCAS P.A. 76 8 76 MONTIEL P.A 76 8 76 NANCAY P.A. 76 8 76 SF CAPlAQUl C.A. 76 8 76 SF CAPlAQUl C.A. 83 11 84 TAIPERO P.A. 76 8 76 VILLAGUAY P.A. 83 11 84 YAMANI M.A. 76 8 76 YERUA P.A. 76 8 76
AMAROO 89 7 89 BARU 77 1 78 BLUEBONNET 50 64 7 65 BOGAN 89 7 89 CALORO 64 7 65
7.9 16.6 3.1 68 6.6 18.2 5.0 84 6.6 19.2 5.1 61 6.7 25.4 7.0 30 7.4 19.2 6.0 51 6.4 19.6 5.5 40 7.8 19.8 6.3 69 8.1 25.1 6.0 51 8.3 22.7 7.0 53 7.8 24.5 4.3 69 8.8 20.6 5.6 81 8.6 28.8 7.0 43 8.6 19.3 5.4 84 7.8 19.4 7.0 54 7.0 20.3 7.0 67 8.6 17.9 7.0 70 7.0 16.3 3.7 95 7.8 23.1 6.7 47 7.4 26.0 7.0 44 8.5 19.8 6.9 85 9.0 22.1 7.0 59 6.3 24.9 5.8 68 7.6 24.1 5.2 46 8.2 16.5 7.0 80 6.6 20.8 4.7 71 7.0 21.0 7.0 75 8.3 18.2 7.0 79
AUSTRALIA
6.0 17.5 7.0 75 720 -130 260 7.7 14.6 4.5 100 880 -150 250 8.0 27.4 6.2 - 870 -50 430
5.5 23.0 7.0 - 630 -30 310 5.6 18.6 6.2 82 740 -160 230
8.1 7.2 7.6 8.7 8.6 8.5 8.2 8.6 8.7 7.9 6.8 8.5
7.9
8.3
8.5
6.0
6.5 1. 9 6.9 2. 0
- 7.1 2.0 6.3 2.1
- 6.9 1.9 - 6.2 2.0
6.2 2.5 - 6.5 2.3 - 7.5 2.1 - 7.6 2.1 - 7.2 2.2 - 6.0 2.1
- 6.7 2.2
- 6.4 2.1
- 6.2 2.0
- 7.0 2.3
5.0 - 5.4 2.6 6.0 112 6.1 2.2
4.9 - 5.4 2.5
- - - - - - - - - - - - - - - - - - - - - - - - - - - - - - - - - - - - - - - - - - - - - - - - - - - - - - - - - - - - - - - - - - - - - - - - - - - - - - - - -
- - - - - - - - -
- - - - - - - - - - - -
- - -
- - - - - -
- - -
- - - -
- - - -
-
-
- -
-
- - -
- - - -
-
- -
I I I I I
I I I I I I I I I I I I I I I I I I I I I I I I I I I

Date Amy- Alkali Gel Amylograph viscosity lnstron Crop analyzed Protein lose spread- consis- Length Width Water year (%) (%) ing tency Peak Set- Consis- Hard- Sticki- (mm) (mm) regime b
(mo) (yr) value (mm) back tency ness ness (BU) a (Bu) (Bu) (kg) (g-cm)
CALROSE CALROSE CALROSE EARLY CALORO INGA INGA INGA INGA KANGAROO EX
HONGKONG KULU KULU KULU KURO MOCHI PELDE STARBONNET TARRA 140 YRF6 (GOOLARAH) YRL25 (DOONQARA) YRM6 (ECHUCA)
70 7 72 7.5 20.1 6.9 94
81 - 81 6.0 19.0 7.0 76 77 1 78 6.5 20.1 7.0 80 65 0 200
80 2 82 5.6 20.6 4.8 88 81 - 81 6.5 17.2 3.7 90 85 - 86 7.7 15.8 6.2 73 73 - 73 7.0 19.0 7.0 84
69 7 72 5.9 19.4 3.4 100 70 7 72 5.3 21.3 5.2 100
77 1 78 6.5 18.4 7.0 91 800 -200 180
77 1 78 7.1 17.5 4.8 92 940 -240 205
77 1 78 6.0 20.3 5.6 89 950 -270 200 71 7 72 5.9 - 7.0 100 89 7 89 6.4 18.5 7.0 78 800 -60 330 85 6 86 7.0 21.6 4.9 48 77 1 78 8.0 - 6.0 36 795 -135 90 89 7 89 9.6 16.3 6.8 77 730 -120 230 89 7 89 7.1 25.6 7.0 48 730 -40 280 89 7 89 5.9 18.5 7.0 78 760 -110 270
BANGLADESH
AMISHRAJ 73 4 73 6.3 29.5 7.0 48 ASHA (BR8) 78 10 78 6.1 30.4 7.0 56 1050 950 850 ADSHABHOG 73 4 73 7.7 25.0 6.5 BALAM (BR7) (IR 2053-87-3-1) 78 10 78 5.5 23.5 4.8 84 1075 -15 390 BR10 (PROGOTI) 79 - 80 9.3 31.4 5.5 86
6.0 5.2 6.6 6.0 5.3 5.3
5.8
5.2
5.6 4.7 7.4 5.2
8.8
5.8 7.6
142
118 139
147
254
56
128 66
5.3 2.7 5.4 2.7
6.5 2.0 7.2 2.6 7.1 2.1
7.0 2.0
6.7 1.8 6.5 1.9 4.9 2.8 6.6 1.9 6.9 2.0 5.3 2.6
5.3 2.5
- - - - - - - - - - - -
- - - - - -
- - -
- - - - - - -
- - - - -
- - - - - -
- - - -
- - -
- - -
-
- - - - - -
- -
-
- -
- -
I I I
- - I I I I I I
I I I I I I I I I I
- - - - - - -
- - - - - -
- - -
I I I I I

BR10 (PROGOTI) BR11 (MUKTA) BR11 (MUKTA) BR11 (MUKTA) BR3 BR3 BR4 (BRRISAIL) BR4 (BRRISAIL) BR4 (BRRISAIL) BR6 (IR28)
CHANDINA (BR1)
CHIANUNG SEN-YU-6 DA29 DA29 DA31 DA31 DHARIAL DULAR DULHABHOG (BR5) DULHABHOG (BR5) DULHABHOG (BR5) HABIGANJ BORO II HABIGANJ BORO II HABIGANJ BORO IV HABIGANJ BORO VI HABIGANJ BORO VI HABIGANJ BORO Vlll HASHIKALMI HASHIKALMI IR20 (IRRISAIL) IR36 JESSOBALAM KATAKTARA KATAKTARA KATARIBHOG
BRJ3-12-B-15
(lR532-1-176)
85 6 86 8.4 27.2 6.0 42
85 6 86 7.1 27.0 6.0 64
73 4 73 5.1 29.7 7.0 54 78 10 78 5.7 29.5 7.0 44 78 10 78 8.4 29.3 7.0 38 85 6 86 6.5 28.1 6.0 39
78 10 78 6.2 31.0 7.0 38 73 4 73 6.1 29.2 7.0 42 78 10 78 5.8 30.6 5.0 91
79 - 80 7.8 30.8 5.7 92
85 - 86 6.7 25.5 7.0 30
85 - - 86 9.0 25.2 6.6 26
79 - 80 9.0 29.4 6.8 48 73 4 73 5.2 30.6 6.0 85 6 86 6.2 28.2 5.4 95 73 4 73 5.8 19.1 7.0 100 85 6 86 8.4 16.0 7.0 68 78 10 78 9.1 29.5 5.0 89 73 4 73 11.3 27.4 3.0 70 73 4 73 8.8 26.1 6.9 32 78 10 78 10.9 27.2 7.0 37 85 6 86 7.3 24.7 6.1 33 73 4 73 12.0 20.6 3.8 78 10 78 7.1 27.4 5.2 69 78 10 78 9.5 28.9 4.6 62 73 4 73 8.6 23.8 4.2 50 78 10 78 6.8 28.7 5.8 66 73 4 73 10.6 21.5 4.0 73 4 73 10.0 29.2 2.9 58 78 10 78 8.9 29.5 6.2 78 85 6 86 7.6 26.3 6.0 32
73 4 73 6.8 30.1 6.8 70 73 4 73 9.6 28.8 3.1 75 77 10 78 7.1 29.1 5.0 78 73 4 73 7.3 27.4 6.2 60
79 - 80 9.7 29.4 5.0 72
770
1105 1010
1030
890
730
510
970 695
960
810
730
50
620 620
1150
200
345
500
85 365
130
520
260
310
795 630
1090
520
460
470
405 540
410
660
480
9.1 - 6.0 2.1 7.7 64 7.7 - 5.5 2.5 8.3 - 5.7 2.5
7.4 35 5.7 2.4 8.8 33 9.0 - 5.5 2.1
10.0 - 5.9 2.2 0.1 54 5.7 1.9
5.4 69 5.0 2.3
8.0 51
7.7 - 7.5 2.2
7.7 - 7.0 2.5 8.0 55 4.8 2.6
8.0 50 3.5 1.9 8.3 - 3.9 2.0
6.0 72 3.8 2.5 6.0 41 5.1 2.3
2.7 5.6 61 4.0 2.7
7.0 45 4.2 2.4 8.0 - 5.6 2.1 6.8 71
6.0 55 5.2 2.1
- - -
- - -
- -
- -
- -
- -
- -
- - -
- -
-
- -
- -
- - - - -
- -
- -
-
- - -
- - - -
- - - -
- -
-
-
- -
- -
- - -
-
-
- -
-
- - -
- - - - - - - - - -
- - - -
- -
- - - -
- -
- - - -
- -
- -
- -
- -
- - - -
- - -
- - - - - - - - - - - -
- - - -
- -
- -
- -
- - - -
l l l l
l l l l l l l
l l l l l l l l l l l l l l l l l l l l l l l l

Date Amy- Alkali Gel Amylograph viscosity lnstron Crop analyzed Protein lose spread- consis- Length Width Water year (%) (%) ing tency Peak Set- Consis- Hard- Sticki- (mm) (mm) regimeb
(mo) (yr) value (mm) back tency ness ness (BU) a (Bu) (Bu) (kg) (g-cm)
KATARIBHOG 77 10 78 10.7 23.5 6.2 40 6.0 71 4.4 1.7 I LATISAIL 73 4 73 6.7 31.5 6.0 I LATISAIL 77 10 78 8.6 29.7 6.1 61 1130 705 775 8.6 37 5.0 2.4 I LATISAIL 85 6 86 6.8 28.8 5.0 46 - 9.1 - 5.8 2.4 I MALA (BR2) (lR272-4-1-2) 77 10 78 6.2 30.9 5.3 84 1290 690 800 9.0 66 5.3 2.3 I NlZERSAlL 73 4 73 7.3 31.3 7.0 I NlZERSAlL 77 10 78 8.7 29.1 7.0 32 955 905 865 8.0 31 4.5 1.9 I NlZERSAlL 85 6 86 7.1 28.0 6.0 38 8.7 - 5.4 2.0 I PAJAM 85 - 86 7.1 26.6 6.0 26 900 780 1000 7.2 - 5.4 2.1 I PAJAM (MAHSURI) 85 6 86 7.3 25.6 5.9 28 8.7 - 5.3 2.0 I PAJAM II 77 10 78 5.0 28.7 6.3 30 870 1050 970 9.4 40 I PATNAI 23 73 4 73 6.2 31.6 7.0 100 I PATNAI 23 85 6 86 7.3 28.8 5.0 93 - 8.3 - 7.3 2.1 I RAJASAIL 73 4 73 9.0 28.1 6.0 58 I RAJASAIL 85 6 86 7.5 28.6 5.0 43 - 8.8 - 5.5 2.4 I SUFALA (BR9) 10 78 6.5 31.0 7.0 42 1030 1175 995 9.7 56 I TILOKKACHARI 73 4 73 5.4 29.2 6.0 71 I
BENlN
ADNY11 EX INGER 88 11 90 8.6 29.8 6.9 42 680 495 615 9.0 - 7.4 2.0
BHUTAN
ATTEY 88 7 89 7.3 23.8 7.0 37 7.8 - 5.0 2.5 I BG400-1 88 7 89 8.5 26.0 7.0 30 - 9.1 - 6.1 2.0 I BOMTELING 83 6 86 5.6 24.8 7.0 46 - 5.3 2.5 I BR153-2B-10-1-3 88 7 89 6.6 28.7 7.0 38 800 350 600 9.7 - 5.9 2.1 I
- -
- -
- -
- - - -
- -
- - - - - - - - - - -
- - - - - - - -
- - -
- - -
- - - - - - -
- - - - - - -
- - - - - - -
- - -
- - - -

BW293-2 CHIRANG ATTEY CHIRANG BAGHEY CHIRANG SUKHIMEY DJAMBARAN RED DJAMBARAN WHITE DUMJA KAAP GUNJA
IR64 KACHUM KAMSING KAMSING (DEEP) LOCAL VARIETY MILYANG 54 MRAH NGURMLINGBOO NO. 11 PARO DUMJA PARO MAAP PASAKACHUM PUNAKHA MAAP PUNAKHA SAKHA SEMKAAP SHINTILA SUKHIMAY SUNGPA SUNGSUNG THIMPHU DUMJA THIMPHU MAAP THIMPHU MAAP (RED) WANGDI KAAP WANGDI MAAP WANGDI MAAP (RED) ZAKHA KAAP ZECHUM
lR20913-B-26-2-2-3
88 86 86 86 77 77 83 83 88 88 83 83 83 77 88 83 83 88 86 86 83 86 86 83 83 88 83 83 86 86 88 86 86 88 88 83
7 12 12 12
9 9 6 6 7 7 6 6 6 9 7 6 6 7
12 12
6 12 12
6 6 7 6 6
12 12
7 12 12
7 7 6
89 86 86 86 77 77 86 86 89 89 86 86 86 77 89 86 86 89 86 86 86 86 86 86 86 89 86 86 86 86 89 86 86 89 89 86
8.3 5.9 6.2 7.7 5.9 4.8 5.6 7.0 7.2 6.4 7.1 7.0 9.0 6.7 6.4 6.6 6.4 7.7 7.4 7.2 5.8 6.2 7.4 6.8 6.6 8.6 7.1 5.4 7.0
26.2 7.0 23.8 7.0 23.9 7.0 22.4 6.9 30.4 4.8 29.6 5.0 23.5 7.0 25.4 7.0 25.8 7.0 26.6 7.0 24.7 6.8 24.9 6.0 24.3 6.0 27.8 4.5 27.4 7.0 25.8 7.0 24.7 7.0 18.9 7.0 22.0 6.2 22.2 6.7 24.9 7.0 23.2 7.0 17.6 7.0 25.1 7.0 24.8 7.0 23.6 7.0 25.9 7.0 26.2 7.0 22.4 6.7 22.0 6.1 23.4 7.0 25.6 6.1 22.2 6.7 23.5 7.0 27.6 7.0 24.2 7.0
28 34 31 27 55 95 38 38 30 63 54 49 47 88 38 42 37 66 27 31 47 35 34 43 46 35 51 58 32 33 32 83 33 37 96 35
115 235 125
410 190
175 85
370
195 200
150 220
360
10.2 8.1 7.6 7.6
10.7 6.9
9.4
5.4 6.7 7.4
7.4 7.2
7.5
7.0 7.3 7.6 7.2 7.8 6.9 8.6
- 5.8 2.4 4.1 2.5
- 4.7 2.6 - 4.6 2.7
5.2 2.4 - 5.6 2.6 - 6.2 2.3 - 6.9 2.1
- 4.4 2.9 - 4.4 2.8
- 6.3 2.0 - 4.6 2.6 - 5.3 2.6 - 5.0 2.8 - 5.3 2.7
- 5.1 2.6
455 580 470
-20 35
-15
475 560
215 50 5.2 2.6
- 5.1 2.7 500 745
10 -250
- 4.9 2.7 6.6 2.1
- 4.8 2.4 - 5.0 2.6
- 5.1 2.6 - 5.0 2.6 - 5.0 2.6 - 5.3 2.5 - 5.3 2.7 - 5.6 2.4 - 5.8 2.3 - 5.7 2.7 - 5.5 2.4 - 5.8 2.3 - 5.2 2.4
580 100
580 465
-40 15 7.1
8.3 5.9 6.9 7.3 7.1 6.9
440 560
60 15
440 190
- - - - - - - - - - - - - -
- - - -
- - - -
- -
- -
- -
- -
- -
- -
-
-
- - -
- - - -
- - -
-
-
- - -
l l l l l l l l l l l l l l l l l l l l l l l l l l l l l l l l l l l l
- - -
- - - - - - - - - - - - - - - - - - - - - - - - - - - -
- -
- - - -
- - - -
- -
- -
-

Date Amy- Alkali Gel Amylograph viscosity lnstron Crop analyzed Protein lose spread- consis- Length Width Water year (%) (%) ing tency Peak Set- Consis- Hard- Sticki- (mm) (mm) regime b
(mo) (yr) value (mm) back tency ness ness (Bu) a (Bu) (Bu) (kg) (g-cm)
BOLIVIA
BLUEBELLE 90 7 90 9.9 22.4 6.6 48 BLUEBONNET 90 7 90 9.3 22.4 6.0 49 CICA8 90 7 90 7.8 24.8 7.0 31 DORADO 90 7 90 7.7 22.6 6.8 44 lR1529 (SAAVEDRA V4) 90 7 90 7.4 18.6 7.0 59 IR-DOMINICANO 90 7 90 6.9 23.6 5.8 68
BRAZIL
410 M030 AGULHA BlCO TORTO AGULHA PRECOCE ARAGUAIA ARAGUAIA BATATAIS BATATAIS BATATAIS BlCO TORTO BLUEBELLE BLUEBELLE BLUEBELLE BR4 CABACU CABACU CALORO
86 10 86 8.2 25.8 7.0 31 76 11 76 7.8 16.5 2.7 100 76 11 76 6.6 19.8 7.0 100 89 12 89 9.0 25.4 7.0 40 90 12 90 9.2 22.4 7.0 36 66 6 67 10.2 24.0 4.9 62 89 12 89 8.5 25.4 6.8 34 90 12 90 7.2 23.8 6.8 35 90 12 90 6.1 17.0 3.8 63 76 11 76 6.4 23.8 5.0 100 86 10 86 6.2 24.4 5.2 44 90 12 90 6.1 24.1 6.7 36 90 12 90 9.4 24.0 7.0 53 89 12 89 8.3 15.8 5.0 90 90 12 90 8.3 15.2 5.0 85 90 12 90 9.6 22.3 7.0 34
- 8.6 - 7.6 - 10.5
700 40 360 7.3 750 -95 290 5.2 760 -85 315 6.4
795 465 525
710 40 370
815 50 340 660 50 380
675 5 210
800 -210 245
10.6
7.2 8.7
7.9 7.0 5.3
10.1 7.4 9.0 4.9 5.1 8.3
- 7.2 2.4 - 7.1 2.2 - 7.4 2.2 - 6.4 3.0 - 6.6 2.5 - 7.0 2.2
- 6.8 2.0 I I I
- 7.4 2.3 U - 6.9 2.3
I - 6.7 2.7 U - 6.3 2.8 U - 6.8 2.7
I - 6.7 2.1 I - 6.4 2.1 U - 7.0 2.5 - 7.2 2.5 U - 7.0 2.6 - 5.5 3.1
- - -
- - -
- - - - - - - - - - - - - -
- - - - - - -
- - - - - - - - - - - - -
- - - - - -
- - - - - -

CENTRO AMERICA CENTRO AMERICA CICA4 CICA7 CICA8 CICA9 CUIABANA CUIABANA DAWN DE ABRIL DOURADAO DOURADO AGULHA DOURADOPRECOCE EEA201 EEA404 EEA404 EEA405 EEA406 EMCAPA 1 EMPASC 101 EMPASC 102 EMPASC 103 EMPASC 104 EMPASC 104 EX ClAT EPEAL 101 EPEAL 102 FORMOSA GUAPORE GUAPORE GUARANI GUARANI IAC1278 IAC164 IAC165 IAC25 IAC25 IAC4440
89 90 90 90 90 90 89 90 90 90 90 66 66 76 76 90 76 76 90 90 90 90 90 89 90 90 76 89 90 89 90 90 90 90 89 90 90
12 12 12 12 12 12 12 12 12 12 12
6 6
11
89 90 90 90 90 90 89 90 90 90 90 67 67 76 76 90 76 76 90 90 90 90 90 89 90 90 76 89 90 89 90 90 90 90 89 90 90
8.8 25.2 7.0 60 8.2 23.3 7.0 45 9.3 24.6 7.0 35 9.1 27.2 7.0 26 7.9 28.2 7.0 26 8.6 26.6 7.0 26
9.6 23.3 7.0 29 6.0 26.9 7.0 36 8.1 28.3 7.0 28
11.2 14.4 4.4 81 13.4 19.7 5.0 38 12.5 19.7 5.0 66
5.3 20.4 7.0 100 5.5 16.3 6.4 100 9.8 19.6 7.0 33 5.5 15.4 2.5 100 5.8 15.5 7.0 100
11.7 21.9 6.8 38 7.9 26.0 7.0 26 8.0 25.5 7.0 26 7.5 28.6 7.0 32 8.1 17.2 7.0 56 6.9 27.0 7.0 28 7.4 27.8 7.0 28 8.1 27.8 7.0 26 7.0 17.9 7.0 90 7.8 22.0 5.6 56 9.5 19.4 6.6 70 8.2 26.0 7.0 48 8.1 24.8 7.0 48 8.5 27.1 7.0 28
10.9 22.5 7.0 33 10.4 23.4 7.0 46
9.1 24.4 6.9 46 9.9 22.8 7.0 43 5.3 29.5 7.0 26
9.4 25.8 7.0 48
655 20 330 7.8
8.1 10.8 9.8
11.4 7.6 7.8 7.4
10.7 5.0
8.1 - 7.3 2.5 U
6.6 2.4 - 6.4 2.2 - 7.0 2.1 - 6.6 2.2 I - 7.0 2.2 - 8.2 2.2 U
7.2 2.2 - 6.4 2.0 - 7.2 2.4 - 7.6 2.6
- 7.0 2.6
- 7.0 2.6 6.9 2.2
- 7.2 2.2 6.7 2.1
- 6.7 2.3
- 6.7 2.2 - 6.6 2.3
- 6.9 2.2 I
- 6.9 2.6 U - 6.5 2.6 - 7.5 2.6 U - 7.2 2.6 U
- 7.1 2.7 - 7.4 2.7 U
- 6.5 2.4 U - 6.5 2.3
- 6.5 2.3
- 6.9 2.5 U
650 25 330
-180 215 125 360 90 370
705 785 820
11 12 6.8 11 11 12 6.1
11.6 11.1 10.3 5.7
12 12 12 12
6 12 12 11 12 12 12 12 12 12 12 12 12 12
10.2 10.1
730 -105 280 6.1 6.2 7.3 7.6
10.8 8.5
660 85 405
660 670
65 365 50 340
7.6 7.3 7.6
10.5
- - - - -
- - - - -
- - - - -
- - - - - - - - -
- - - - - - - - - - - - - - - - - - - - - - - - - - - - - - - - - - - - - - - - - -
- - -
- - - - - - - - -
- - - - - -
- - - -
- - - -
- - - - - - - - - - - -
- -
- - - - - -
-
-
-
-
-
I I I I I
I I

Amy- Alkali Gel Protein lose spread- consis-
(%) (%) ing tency value (mm)
Amylograph viscosity lnstron Length Width Water
Peak Set- Consis- Hard- Sticki- (mm) (mm) regimeb
back tency ness ness (BU) a (Bu) (Bu) (kg) (g-cm)
Date Crop analyzed year
(mo) (yr)
IAC47 IAC47 IAC899 IGUAPE AGULHA INCA IR841 IRGA117-23-27-2 IRGA172-F4SS-39 IRGA181-F4SS-54 IRGA181-F4SS-73 IRGA407 (BR-IRGA407) IRGA408 (lR930-31-10) IRGA409 (BR-IRGA409) IRGA409 (BR-lRGA409) IRGA409 (BR-lRGA409)
EX ClAT
EX ClAT IRGA409 (BR-IRGA409)
IRGA410 (BR-IRGA410) IRGA410 (BR-IRGA410) IRGA411 (BR-IRGA411) IRGA412 (BR-IRGA412) IRGA413 (BR-IRGA413) IRGA414 (BR-IRGA414) MEARIM METICA 1 MG1 MG2 P790 L P798 L38 BS1
89 12 89 90 12 90 90 12 90 66 6 67 90 12 90 90 12 90 86 10 86 86 10 86 86 10 86 86 10 86 76 11 76 76 11 76 86 10 86 90 12 90 88 6 88
89 6 89
86 10 86 90 12 90 90 12 90 90 12 90 90 12 90 90 12 90 90 12 90 90 12 90 90 12 90 90 12 90 86 10 86 86 10 86
8.5 24.6 7.0 44 7.8 25.5 7.0 59 8.2 29.0 7.0 62 9.6 19.4 5.0 50 9.3 24.6 7.0 26
10.3 17.3 7.0 60 7.4 26.2 7.0 40 7.0 20.1 7.0 47 7.8 25.1 7.0 43 7.7 18.4 7.0 63 6.5 19.1 7.0 100
- 6.9 2.5 U - 6.8 2.6 U - 7.1 2.2
I - 6.3 2.2 - 7.6 2.2 U - 6.8 2.0 I - 6.5 2.2 I - 6.8 2.1 I - 6.6 2.1 I
I I
- 6.4 2.0 I - 6.5 2.1 I - 6.4 2.1
640 30 320 7.2 7.5 9.1
860
700 790 770 790 800
770
130
-80 505
-120 470
-190
400
255 545 135 525
95
8.5 5.7
10.3 7.6
10.0 8.3
7.8 24.1 5.0 69 7.2 25.2 7.0 32 420 485 10.2
11.3 9.9 25.3 7.0 26 - 27.6 7.0 28
6.8 27.6 7.0 28
6.8 25.5 7.0 41 9.8 76.1 7.0 26
9.8 25.7 7.0 26 9.2 27.0 7.0 26 8.7 26.2 7.0 26 7.6 29.4 7.0 42 8.9 28.4 7.0 28 8.7 27.2 6.9 26 8.5 29.1 7.0 29 7.3 26.0 7.0 32 6.9 26.2 7.0 33
10.9 16.5 6.7 58
- 6.5 2.1
770 425 465 10.1 - 6.6 2.1 I 11.5 - 6.6 2.1 I
- 6.3 - 7.1 2.3 11.8 - 6.4 2.1
- 10.9 - 5.9 2.2 - 11.8 - 6.8 2.2 - 10.5 - 6.4 2.2 - 10.7 - 6.7 2.3 U - 10.1 - 7.1 2.3 I - 9.7 - 6.6 2.2
775 485 525 10.0 - 6.4 2.1 I 790 485 515 11.3 - 6.8 1.9 I
- - - - - -
- - -
- - - - - -
-
- -
- - - - - - -
- - - -
- - - - - - - - - - - - - - - - - -
- - - - - -
- - -
-
-

PACHA MURCHA PESAGRO 101 PESAGRO 102 PESAGRO 103 PRATAO PRATAO PRECOCE PRATAO PRECOCE RIO PARANAIBA RIO PARANAIBA TRIUNFO
0.026 EXP0’80 00.55/1 CISADANE DISOBOK LUMUT MR100 MR101 MR73 MR77 MR84 MR97
BELLARDONE BELOZEM KRASNODARSKI 424 KRASNODARSKI 424 MARITZA B MONTICELLI N:10 M N:11 M
90 12 90 90 12 90 90 12 90 90 12 90 66 6 67 66 6 67 90 12 90
90 12 90 90 12 90
89 12 89
89 11 89 89 11 89 89 11 89 88 11 89 88 11 89 89 11 89 89 11 89 89 11 89 89 11 89 89 11 89 89 11 89
67 4 68 85 6 86 72 8 73 77 6 78 77 10 78 72 8 73 85 6 86 85 6 86
9.8 25.9 7.0 44 8.4 28.4 6.9 26 8.2 28.9 7.0 72 8.6 28.1 7.0 26
10.3 21.4 5.0 55 11.4 22.4 5.0 49 11.2 24.1 7.0 30
9.2 19.9 6.0 86 9.2 18.7 5.4 81
9.0 18.9 5.3 70
- 9.6 - 9.9 - 9.4
860 95 385 - 10.8
805 75 360 580 165 410 8.8 715 -165 215 5.8
665 -135 225 6.1 - 6.6
- 6.2 3.0 - 6.7 2.3 - 6.4 2.1 - 7.2 2.3
I I
- 7.1 2.6 - 7.3 2.5 U - 7.1 2.5 I - 7.1 2.6 U
BRUNEI DARUSSALAM
6.9 24.6 5.5 44 13.5 22.6 7.0 28 6.2 23.8 5.0 54
7.2 28.8 7.0 36 7.3 30.8 6.0 38 8.4 25.7 7.0 40 8.5 29.8 6.0 30
6.9 25.0 6.0 50 8.6 9.7 3.0 49
6.5 29.7 7.0 76 6.7 28.7 7.0 30
730 70 405 95 870 -160
890 -120 610 480 880 380
760 -130
590 100 570 310 330 430 670 550
395 275 320 270 315
655 360 490 420 660
580
6.9
5.1 6.2 3.5
9.6 7.2 9.0
10.4
8.2
9.8
9.8
- 6.9 2.0 I - 7.7 2.1 I - 6.3 2.5 I - 5.9 1.9 I - 4.9 2.2 I - 7.2 2.2 I - 6.7 2.1 I - 6.6 2.1 I - 6.4 2.1 I - 6.7 2.2 I - 6.8 2.2 I
7.0 27.3 6.3 6.9 16.0 7.0 7.2 20.9 7.0 6.1 22.4 7.0 7.5 20.0 7.0
7.3 23.1 7.0 9.5 17.8 7.0
8.5 18.7 7.0
BULGARlA
- 665 71 960
88 610 61 665 82 49 950 52 970
82
50 285 I -360 50 6.4 - 4.8 2.9 I
I 30 200 5.1 103 4.7 3.1 I
0 215 6.6 91 5.1 2.7 I I
-145 225 8.3 - 5.0 3.0 I -335 35 7.8 - 5.9 3.0 I
- - - - - - -
- - - - - - -
- - - -
- -
- -
- -
- -
- - - -
- - - -
- -

Date Amy- Alkali Gel Amylograph viscosity lnstron Crop analyzed Protein lose spread- consis- Length Width Water year (%) (%) ing tency Peak Set- Consis- Hard- Sticki- (mm) (mm) regimeb
(mo) (yr) value (mm) back tency ness ness (Bu) a (Bu) (Bu) (kg) (g-cm)
N:24 D N:44 PLOVDIV PLOVDIV 1/1 PLOVDIV 19/1 PLOVDIV 22 PLOVDIV 22 PLOVDIV 24/1 PLOVDIV Y PLOVDIV YP RANBALI ROSA SESILLA SLAVA USPECH
BANLA PHADU CHHMAR KRAHUM CHHMAR PROM CHHMAR PROM KANDAL CHHUTHANA CHHUTHANA CHHUTHANA CHONG BANLA CHONG BANLA DID
85 6 86 8.2 17.0 6.7 64 85 6 86 6.0 17.7 7.0 79 67 4 68 9.8 24.3 6.8 72 77 10 78 7.4 22.8 7.0 60
77 10 78 6.5 19.8 7.0 92 85 6 86 7.4 18.0 7.0 76
77 10 78 6.0 20.2 7.0 74 77 10 78 6.9 19.4 7.0 75
85 6 86 6.1 20.0 7.0 64 72 8 73 8.3 18.4 7.0 86 67 4 68 8.6 25.0 6.1 73 8 73 8.0 19.2 7.0 76
77 10 78 7.5 22.7 7.0 47
77 10 78 6.2 19.0 7.0 82
72 8 73 8.5 19.9 7.0 78
1100 1035
685 600 615 665
1080 790 670 690
1020
7 10
88 11 89 6.0 26.2 7.0 72 4 73 8.6 28.5 3.1 89 2 90 5.5 28.4 6.4 89 2 90 5.4 30.6 6.8 64 4 65 12.0 16.8 6.0 72 4 73 7.7 18.9 6.4 88 11 89 10.1 23.9 6.9 72 4 73 6.3 29.1 3.5 88 11 89 7.0 25.7 6.0 64 4 65 6.5 14.9 3.7
CAMBODlA
46 570 30 54 795 39 790
- 725 64 30 710 32 48 800
- 970
-475 30 7.6 - 4.8 3.1 -445 -10 7.0 - 5.3 2.9
155 305 7.6 87 5.4 3.1 100 275 6.6 68 4.9 2.9
-85 215
-45 190 6.2 97 -425 10 7.4 - 6.5 2.5 -130 190 5.7 113 5.1 3.0
-10 210 5.6 106 5.3 3.2 -30 200 6.2 105 5.3 2.9
-355 25 6.0 - 5.3 2.9
-40 225
310 480 8.0
285 585 8.9 265 560 8.2 -65 200
260 500 8.2
-10 390 6.5 -320 190
7.1 2.2
5.7 1.8 - 5.5 1.8
- 5.5 2.2
- 5.3 2.5
- - - -
- -
- - - - - - -
- - - - - - - - - - - -
- - - - - - -
- - - - - - - - -
- - - - - - - - - - -
- - - - - - -
- - - -
I I I I I I I I I I I I I I I
I
I I
I
I

F3C23.2.2 HIB14 KONG KHMAU KONG TELL K131 KRAHAM LEAK SANLEK LEAK SANLEUK LEAK SLEK NEANG MEAS NEANG MEAS NEANG MENH NEANG MlNH NEANG MlNH NEANG MlNH TONN NEANG MON NEANG SAR PHKA PNOS PHKA SLA PHKAR SLA PRAM BEI KOUR PRAM BEI KUOR SAM LEAV SRAU SAR STRAUV KOL
IAC25 EX INGER TAINAN 5 EX INGER
ClNlA 196 ClNlA 234 ClNlA 239
64 4 65 64 4 65 72 4 73 72 4 73 89 2 90 72 4 73 88 11 89 72 4 73 64 4 65 88 11 89 72 4 73 88 11 89 89 2 90 88 11 89 88 11 89 88 11 89 89 2 90 89 2 90 88 11 89
88 11 89 88 11 89
72 4 73
89 2 90
89 2 90
88 11 90 88 11 90
90 10 90 90 10 90 90 10 90
6.0 24.9 6.0 6.7 22.1 5.2
4.1 25.1 3.0 64 5.7 29.2 6.3 85 6.2 27.6 3.5 6.2 25.3 6.0 54 5.0 29.8 4.6 7.2 23.1 5.2 5.7 26.4 6.2 54 5.9 27.5 3.1 31 5.9 29.0 6.5 38 5.4 30.6 6.9 70 6.5 26.2 6.0 54 7.7 16.8 7.0 78 6.5 28.5 6.8 34 5.4 31.2 6.8 72 5.5 31.3 6.6 72 6.0 26.4 6.9 42 5.5 29.6 7.0 49 5.9 28.4 6.0 32 5.7 25.1 6.1 58 5.8 29.6 6.9 56 7.1 29.2 3.5 30
5.4 24.8 3.7
680 825
745
850
820 850
900 760 800 820 830 755 755 7 30 790 830 840 765
345 -40
225
-30
50 -10
320 345
50 -110 360 295 375 120 260 370
-90 295
485 200
530
410
350 410
630 6 10 430 280 630 565 615 460 575 650 360 575
CAMEROON
8.4 24.6 6.0 34 680 50 385 11.2 27.4 7.0 27 695 505 665
CHILE
6.0 19.0 7.0 72 520 15 265
7.9 19.4 7.0 74 530 0 240 6.6 19.4 7.0 78 570 -40 225
8.7
6.5
6.8
8.3 8.7 6.8 5.6 7.9 9.2 9.5 6.2 8.8 9.0 5.7 8.4
5.8 9.1
4.4 4.8 5.2
I I I I
I
I I
I
- 6.5 2.0
5.5 2.2
- 5.3 2.2
- 5.5 2.4 - 5.5 2.3 - 5.2 2.2 - 7.7 2.3
- 6.2 2.1 - 5.6 2.4
5.5 2.1 - 5.8 2.1
5.8 1.9 - 6.7 2.5 - 5.4 2.3
- 6.2 2.3
I
- 6.7 2.4 - 7.4 2.5
- 7.8 2.2 - 7.6 2.2 - 7.1 2.4
- - - - - - -
- - - - - - -
- - -
-
- -
- -
-
- -
-
- - -
-
- -
- -
- - - -
- - - -
- - - -
- - - -
-
- - -
-
-
- - - -
-
-

Date Amy- Alkali Gel Amylograph viscosity lnstron Crop analyzed Protein lose spread- consis- Length Width Water year (%) (%) ing tency Peak Set- Consis- Hard- Sticki- (mm) (mm) regime b
(mo) (yr) value (mm) back tency ness ness (BU) a (Bu) (Bu) (kg) (g-cm)
ClNlA 268
DIAMANTE
NIQUEN ORO ORO
QUELLA
QUILA 67320
CRISTAL-INDUS
DIAMANTE-INIA
PERLA-INDUS
QUELLA-INIA
720
CE48 AI-CHI-NAN
CH'ANG-KO 21 CHAI-YEH-CHING 8 CHAO-YANG-TSAO 18 CHE-CHANG 9 CHEN-CHIEN-NUO CHIEN 75-10 CHING-FENG 2 CHING-FENG 5 CHING-FENG 7 CHING-FENG 8 CHING-HSI 3 CHING-HSI 9
90 10 90 6.6 20.6 7.0 90 10 90 7.1 20.0 7.0 80 9 80 9.6 21.6 7.0 90 10 90 6.4 21.2 7.0
80 9 80 8.5 21.0 7.0 90 10 90 5.5 20.1 7.0 90 10 90 7.3 18.7 7.0 80 9 80 8.3 21.0 7.0 90 10 90 6.4 20.6 7.0 90 10 90 6.7 20.4 7.0
80 9 80 10.3 20.8 7.0
81 9 82 8.1 18.8 3.0 76 2 77 7.6 27.0 5.2 81 9 82 8.5 21.5 7.0 76 2 77 9.1 26.8 4.8 76 2 77 7.0 25.8 4.0 76 2 77 8.6 27.5 5.0 76 2 77 11.2 25.5 5.9 76 2 77 8.1 1.0 6.0
76 2 77 8.4 17.8 7.0 76 2 77 6.8 19.7 7.0 76 2 77 7.0 18.4 7.0 76 2 77 7.2 16.0 6.8 76 2 77 6.6 18.5 6.8
76 2 77 9.0 27.4 6.3
76 2 77 7.0 17.8 7.0
66 445 66 510 94 565 75 465 61 485 66 540 68 540 78 515 84 470 63 475 68 505
CHINA
67 48 50 59 46 45 57 80 36 92 86 86 98
100 98
90 240 25 250
70 255 80 200
50 295
45 180 75 270 30 250
-50 145
-15 155
-5 235
5.0 5.2 5.2 5.6 6.4 5.9 5.0 5.3 6.4 5.8 5.1
5.8
6.1
- 7.6 2.2 - 6.9 2.8
- 7.5 2.6
- 5.6 3.1 - 6.8 2.7
- 5.5 2.9 - 6.7 2.6
- 5.1 2.8
- 4.9 2.8 - - - - - - - - - - - - - - - - - - - - - - - - - - - - - - - - - - - -
- - -
- - -
- - -
- - - - - -
l
l l
l
l
l l l l l l l l l l l l

CHU-LIEN-AI DONG-TING-WAN-XIAN ER-BAI-AI ER-JIN-QING ER-JIU-QING GUANG-LU-AI 4 GUI-CHAO 13 HSIANG-AI-TSAO 7 HSIANGAI-TSAO 9 HSIANG-KENG 12 HSIANG-KENG 13 HSIANG-NUO 1 HSIN-CHING-AI HSIN-TIEH-TA HUA 03 JIA HU 4 JlME EX HONGKONG JIN-NUO 3 KWANG-ER-AI 5 LI-YOU 57 NAN-ERH-AI 5 NAN-GAN 34 NAN-JING 11 NAN-KENG 11 NAN-KENG 33 NAN-TSAO 32 NAN-TSAO 33 NEW SILVER BAMBOO
EX HONGKONG NEW SOUTH JIM
EX HONGKONG NEW WEST JIM
EX HONGKONG NEW YEW JIM
EX HONGKONG NONG-HU 6 NONG-HU 6
76 2 77 9.0 25.1 4.6 81 9 82 9.6 28.3 6.3 81 9 82 8.7 27.4 5.4 83 10 84 11.8 24.5 5.0 81 9 82 11.0 22.8 5.0 81 9 82 11.5 25.4 5.2 81 9 82 7.2 28.3 7.0 76 2 77 8.6 25.7 4.9 76 2 77 6.2 26.8 4.8 76 2 77 6.6 17.4 6.9 76 2 77 7.8 15.1 6.6 76 2 77 7.4 1.0 6.0 76 2 77 8.0 24.4 5.9 76 2 77 7.9 26.7 5.0 91 7 91 10.8 13.1 7.0 83 10 84 8.3 20.8 7.0 63 7 65 7.7 31.3 5.9 81 9 82 9.1 1.3 7.0 76 2 77 5.6 28.4 5.0 81 9 82 7.3 19.0 7.0 76 2 77 8.6 27.0 4.9 81 9 82 9.6 17.0 7.0 81 9 82 13.0 27.8 6.2 76 2 77 6.0 15.6 6.9 76 2 77 7.2 15.8 7.0 76 2 77 10.5 24.2 4.9 76 2 77 7.1 27.9 4.7 73 - 73 6.5 29.5 5.5
73 - 73 8.0 28.9 6.4
73 - 73 7.4 29.0 5.0
73 - 73 7.3 29.1 6.2
81 9 82 8.8 21.4 7.0 83 10 84 6.2 19.5 7.0
36 29 42 29 29 29 29 34 43 88 78 88 32 52 70 49
100 64 53 40 52 30 93 99 56 44 81
33
56
62
42 52
540 20 300
970 -339 175 880 220 550
1120 -360 200
I 8.5 - 6.1 2.1 6.4 - 5.5 2.5 8.2 - 5.4 2.5 I 8.6 - 5.3 2.4 6.8 - 5.0 2.6 7.8 - 5.1 2.7
I I I I I I I
9.1 14 4.9 2.9 I I
4.7 - 4.9 2.7 I
5.2 - 4.8 2.8 I
7.0 - 5.1 2.8 7.7 - 5.5 2.5
- 5.8 2.6
I I I I I
I
I
I
7.0 - 4.8 2.7 7.4 31 5.0 2.8 I
- - - - - - - - -
- - - - - - - - - - - - - - - - - - - - - - - - - - - - - - - - -
- - - - - - - - - - - - - - - - - - - - - - - - - - - - - - - - -
- - -
- - -
- - -
- - - -
- - - - - - -
- - - - - - - - - - - - - - - - - - - - -
-
-
- - -
- - -
- - - -
- - - - -
-
-
-
- - - - - - - - - - - - - - -
- - -
- - -
- - -
-
- - -

Date Amy- Alkali Gel Amylograph viscosity lnstron Crop analyzed Protein lose spread- consis- Length Width Water year (%) (%) ing tency Peak Set- Consis- Hard- Sticki- (mm) (mm) regime b
(mo) (yr) value (mm) back tency ness ness (Bu) a (Bu) (Bu) (kg) (g-cm)
PAO-KWANG 81 QING-ER-AI 1 QING-GANG-HANG SEE MEW HUNG
EX HONGKONG
SHANGHAI PEARL EX HONGKONG
SHAN-YOU 6
SHUANG-NUO 4 SZE MEE EX HONGKONG TIEH-KU-AI 4 TIEH-LU 17 TUNG-CH'IU-AI WAHNAM EX HONGKONG WAN-CHAN XIANG-AI-ZAO 7 XIANG-AI-ZAO 9 YAU JIM EX HONGKONG YAU JIM EX HONGKONG
ZHE JIE 66 ZHENG GANG ZHAO
YU-CHI-231-8
ZHONG-DAN 2 ZHONG-HUA 8 ZHONG-HUA 9 ZHONG-XI 7720 ZHONG-ZUO 75 ZHONG-ZUO 9 ZHU-FEI 10 ZHU-KE 2
76 2 77 8.4 26.3 4.9 30 81 9 82 9.9 27.6 5.6 29 83 10 84 10.3 31.2 6.0 55 73 - 73 7.5 29.1 5.2 70
81 9 82 11.7 25.4 7.0 29 63 7 65 6.4 21.9 6.9
81 9 82 9.7 1.2 7.0 92 63 7 65 6.7 30.0 5.7 76 2 77 6.1 27.9 4.0 44 76 2 77 9.8 23.2 4.6 70 76 2 77 10.2 26.6 6.0 42 63 7 65 6.9 31.4 6.4 76 2 77 10.3 26.2 4.8 39 81 9 82 8.3 27.6 5.5 29 81 9 82 7.4 28.4 5.4 29 63 7 65 7.3 30.4 6.4 64 7 65 7.0 29.0 4.5 81 9 82 10.6 28.8 6.2 30 83 10 84 8.0 21.8 7.0 43 83 10 84 9.7 30.8 6.3 28
81 9 82 7.2 21.0 7.0 62 81 9 82 6.6 21.6 7.0 70 81 9 82 7.2 19.6 6.3 69 81 9 82 8.4 19.3 5.0 57
81 9 82 7.9 19.6 7.0 59
81 9 a2 7.6 19.4 4.9 65 81 9 a2 9.6 28.0 5.0 29 81 9 82 8.8 28.3 5.0 29
440
380
980
650
810 980
830 735
420
220
150
370
310
-140 425
440
370
490
560
600 480
270 535
7.3 9.6
8.2
4.4
6.6 7.5
8.5 8.6 9.1 6.3 5.2 4.0 5.2 5.5 5.1 6.6 7.5
I - 5.8 2.6 - 5.2 2.5 I
I
- 5.8 2.3 I
- 4.7 2.6 I I I I I I
- 5.4 2.6 - 5.5 2.9
I I
5.8 2.3 8 5.1 2.9 I
5.0 2.5 I - 4.9 2.8 - 5.0 2.8 - 5.0 2.8 - 4.8 2.8 - 5.5 2.7
- 6.7 2.3 - 6.7 2.3
- 5.3 2.8
-
- - - - - - - - - -
- - - - - - -
- - - - - - - -
- - - - - - - -
- - - - - - - - - - - - - - - - - - - - -
- - - - - - - - - - - - - - - - - -
- - - - - - - - - -
- - - -
- - - - - - - - - - - - - - - - - - - - - - - - -

BLUEBONNET 50 BLUEBONNET 50 BLUEBONNET 50 CICA4 (lR930-31) CICA4 (IR930-31) CICA6 CICA6 EX ClAT CICA7 CICA7 CICA8 CICA8 ClCA8 EX ClAT CICA8 EX ClAT CICA9 CICA9
I R8 JAPON METICA 1 MONOLAYA ORYZICA 1 ORYZICA 1 EX ClAT ORYZICA 2 ORYZICA 3 ORYZICA LLANOS 4 ORYZICA LLANOS 5 TAPURIPA
ICA-10
CR1113 (lR822-81-2) CR1707
COLOMBIA
71 11 71 5.8 25.6 6.8 67 76 6 77 7.9 23.7 6.0 84 77 3 78 11.4 23.1 6.8 53 71 11 71 7.3 25.8 6.8 80 77 3 78 8.7 27.4 6.4 100 77 3 78 8.5 28.8 7.0 41 89 6 89 7.3 26.3 7.0 28 76 6 77 10.0 22.4 7.0 30 77 3 78 9.9 28.3 7.0 32 77 3 78 9.1 28.3 7.0 78
88 6 88 - 28.1 6.8 31
77 3 78 8.0 29.4 7.0 50 71 11 71 5.8 21.6 4.7 98
90 6 91 7.6 26.5 6.0 42
89 6 89 5.5 25.8 6.9 44 76 6 77 8.8 24.8 7.0 59
71 11 71 6.6 28.8 7.0 71 11 71 7.4 27.0 4.8 90 6 91 7.5 28.2 7.0 52 71 11 71 7.0 25.2 5.2 94
89 6 89 6.6 28.6 7.0 29 90 6 91 7.3 24.5 5.7 49 90 6 91 9.4 21.1 5.0 42 90 6 91 7.0 26.8 7.0 27 90 6 91 9.0 26.0 7.0 28 71 11 71 8.0 27.0 6.8 53
90 6 91 8.0 28.5 7.0 30
730
755 820
745
880 840
720
850
835
850 795 765 765
-35
25 610
545 380 490
530
565
620
-60 -130 260 250
- 6.6 240 6.6
280 5.2 700 7.8
605 7.2 535 7.2 720 8.2
580 7.6
750 9.9
805 8.9
385 6.2 300 5.5 375 9.5 330 10.6
COSTA RlCA
90 7 90 9.4 25.4 7.0 28 710 310 300 11.2 90 7 90 13.3 23.7 7.0 26 - 11.8
59 77
75 40
45 44 49
41 48
I 6.7 2.1 I 6.6 2.0 I
I 6.2 2.2 I
I 6.7 2.4 I 6.7 2.1 I
I 6.3 2.1 I 6.8 2.2 6.6 2.2 I 6.9 2.1 I 6.8 2.2 I 6.6 2.3 I
I I I
6.9 2.2 I
7.2 2.1 6.8 2.2 I 6.7 2.2 6.4 2.0 6.6 2.4 7.4 2.2
I
6.9 2.1 U 6.8 2.1 U - -
- - - - - -
- - - -
- - - - - -
- -
- - -
- - -
- -
-
- -
- -
-
- -
- - -
- - -
-
-
- -
- - -
- - -
- - -
- -
-
- - - -
- - -
- - -
- -
- - -
- - -
- - - - - - -
- - -
- - -
- - - - -
- -

CR1821 CR5272
AMISTAD 82 BLUEBELLE CARIBE I CARIBE I CP3C2 EClA 31-104-2-1-7 EClA 31-14-1-1-1 GUARINA IAC13 (PERLA) IAC14 (ECIA 67) IAC15 (ECIA 179) IR1529 (IR43) lR1529 (IR43) lR1529-382-4
IR880-C9 IR880-C9 ITALIAN VARIETY JUCARITO 104 (IR480/
JUCARITO 104 (IR480/
JUCARITO 104 (IR480/
lR759-54-2-2-2
IR930)
IR930)
IR930)
Date Amy- Alkali Gel Amylograph viscosity Crop analyzed Protein lose spread- consis- year (%) (%) ing tency Peak Set- Consis-
(mo) (yr) value (mm) back tency (Bu) a (Bu) (Bu)
90 7 90 8.6 25.8 7.0 90 7 90 10.7 24.2 6.1
85 6 86 7.6 18.2 7.0 78 4 79 7.4 22.4 4.7 78 4 79 7.6 23.2 7.0 85 6 86 7.5 26.6 7.0 85 6 86 7.8 19.6 6.3 85 6 86 7.1 16.6 6.0 85 6 86 8.3 18.0 3.0 85 6 86 8.1 25.5 5.0 90 6 91 7.0 17.6 7.0 90 6 91 6.7 17.1 7.0 90 6 91 7.0 16.8 7.0 78 4 79 6.2 16.8 6.2 85 6 86 7.5 17.1 6.4 78 4 79 6.3 28.1 7.0 78 4 79 7.4 28.0 4.8 78 4 79 6.8 27.7 7.0 85 6 86 8.3 27.7 7.0 78 4 79 7.6 15.6 7.0 85 6 86 9.0 23.2 4.8
85 6 86 8.2 24.4 5.0
85 6 86 7.9 23.8 5.0
28 28
CUBA
81 76 45 54 59 78 75 72 76 70 80 77 82 42 53 31 28 95 58
51
47
670 825 835 785 405 590
730 -210 50 745 -70 220 490 180 260 605 40 155 845 -285 60 915 -375 30 840 -280 60 690 0 120 900 -270 255 890 -225 280
870 -265 155 845 -280 105 745 635 695 785 305 480 865 385 570 860 320 480 750 -215 120
975 -270 280
740 -255 80
740 -185 115
770 -210 100
lnstron Length
Hard- Sticki- (mm) ness ness (kg) (g-cm)
- 6.4 10.0 - 6.5
8.7 - 6.9 6.0 119 6.9 6.8 100 6.9 8.0 - 6.8 8.3 - 7.0 6.8 - 6.8 8.3 - 7.0 7.8 - 7.7 4.3 - 7.2 4.4 - 6.8 4.0 - 6.8 4.9 174 6.6 7.6 - 6.8 6.9 66 6.6 7.0 77 5.9 7.6 74 6.7
10.1 - 6.7 4.7 154 7.7 8.6 - 7.0
8.8 - 7.0
8.8 - 6.9
Width Water (mm) regime b
2.2 U 1.9 U
2.0 I 2.0 I 2.3 I 2.2 I 2.2 I 2.0 I 2.2 I 2.1 I 2.2 I 2.1 I 2.1 I 2.1 I 2.0 I 2.2 I 2.0 I 2.2 I 2.1 I 2.2 I 2.4 I
2.4 I
2.4 I

JUCARITO 104 (IR480/ 85 6 86 IR930)
JUCARITO 104 (IR480/ 85 6 86 IR930)
NAYLAMP (lR930-2-6) 78 4 79 NAYLAMP (lR930-2-6) 85 6 86 PNA12-1-2-6 PNA46
78 4 79 78 4 79
ISA40 JUMA57
90 11 90 90 11 90
JUMA58 (TONO BREA/IR8) 90 11 90 JUMA58 (TONO BREA/ 88 6 89
JUMA58 (TONO BREA/ 89 6 89
JUMA61 90 11 90 JUMA63 90 11 90 P3831 90 11 90 TANIOKA 90 11 90
IR8) EX ClAT
IR8) EX ClAT
BLUEBONNET 50 BRASlLElRO CAFURINGA CHATO SERRANO CHEPITA COLORADO DONATO
INlAP10 GO-31430
90 11 90 90 11 90 90 11 90 90 11 90 90 11 90 90 11 90 90 11 90 90 11 90 90 11 90
8.0 24.2 4.8 49 780 -225 75
7.9 24.4 4.4 48 780 -215 125
5.8 28.2 7.0 41 730 580 650 8.2 28.6 7.0 32 695 365 420 7.4 28.1 7.0 31 760 540 665 7.7 27.7 5.1 47 800 320 490
DOMINICAN REPUBLIC
8.8 25.3 7.0 26 705 805 855 8.2 24.0 7.0 30 430 470 540 7.3 25.4 7.0 27 670 800 860
28.4 7.0 29
6.7 27.0 7.0 29
4.4 25.3 7.0 27 750 1020 999 8.6 13.8 5.0 54 825 -175 230 7.7 26.6 7.0 28 735 805 860 8.8 23.1 7.0 36 605 275 490
ECUADOR
7.7 23.6 7.0 36 765 5.6 28.5 7.0 30 950
6.2 29.6 7.0 36 885 6.3 28.6 7.0 28 925 7.7 24.0 7.0 41 730 6.3 26.1 6.9 56 770 6.0 28.5 6.8 49 620 6.8 24.6 6.8 48 770
5.7 29.1 7.0 33 880
135 685 630 470 500 155 185 405 230
455 880 835 735 770 480 530 590 530
9.1 - 6.9 2.3
8.8 - 6.6 2.4
7.0 79 6.6 2.1 11.0 - 7.1 2.1
7.0 67 6.6 2.0 7.8 74 6.7 2.1
9.5 8.2 9.6
- 7.0 2.2
- 6.9 2.3
10.7 3.4 9.6 7.3
7.1 9.4 9.3 9.2 8.9 6.8 7.4 8.6 7.6
- 7.0 2.2 - 6.0 2.4 - 7.4 2.2 - 5.8 2.3 - 7.1 2.3 - 6.6 2.4 - 7.4 2.1 - 6.8 2.4 - 6.9 2.2
I
I I I I
I
- - - - - - - - -
- - - -
- - - -
- - - - - - - - - - - -

Date Amy- Alkali Gel Amylograph viscosity lnstron Crop analyzed Protein lose spread- consis- Length Width Water year (%) (%) ing tency Peak Set- Consis- Hard- Sticki- (mm) (mm) regimeb
(mo) (yr) value (mm) back tency ness ness (BU) a (Bu) (Bu) (kg) (g-cm)
INlAP11 INIAP415 INIAP6 INIAP7 NO TE AHUEVES PLATA AL BOLSILLO SABIDO TRIPA DE POLLO
AGAMI MI ARABI ARABI CR259-93 CR259-93 CR316-3-1-4 CR484-2-1-2 CR484-8-1-3 GIZA14 GIZA159 GIZA159 GIZA170 GIZA171 (NAHDA/
GIZA171 (NAHDA/ CALADY 40)
CALADY 40)
90 11 90 6.3 25.7 6.2 54 785 90 11 90 6.3 27.6 7.0 28 860 90 11 90 6.4 26.0 6.8 60 740 90 11 90 6.4 27.8 7.0 30 785 90 11 90 5.8 30.1 7.0 34 1215 90 11 90 7.0 20.3 6.6 89 560 90 11 90 5.9 28.7 6.2 39 880 90 11 90 5.9 29.1 6.9 30 920
70 770 185 615 275 230 420 415
425 860 500 715 775 445 700 670
EGYPT
73 4 73 6.6 25.3 7.0 30 66 9 66 5.8 22.7 6.1 73 4 73 6.9 24.8 6.0 30 77 7 78 6.2 20.2 7.0 96 78 4 79 5.4 18.0 6.8 84 78 4 79 6.1 28.4 5.0 63 78 4 79 4.8 17.8 6.0 85 77 7 78 7.0 19.9 7.0 96 73 4 73 7.5 18.5 7.0 72 66 9 66 5.3 17.9 7.0 73 4 73 6.4 18.5 7.0 68 73 4 73 6.4 18.3 7.0 70 77 7 78 6.6 18.4 7.0 86
78 4 79 4.8 17.1 6.2 94
930 -150 265
720 -85 165
805 -155 160
1020 -330 190
720 -120 15
7.0 9.9 6.8 6.9 9.6 8.7 8.9 9.0
- 7.3 2.2 - 6.8 2.3 - 6.5 2.2 - 6.9 2.3 - 6.7 2.3 - 7.2 2.2 - 6.5 2.4 - 6.8 2.4
5.3 139
7.0 100 5.0 227 5.2 136
5.1 144
4.5 2.8
4.5 2.8 5.0 2.8
4.9 2.5
- - - - - - - -
- - - - - - - - - - -
- - -
- - -
- - -
- - - - - -
- - - - - - - - - - -
- -
- -
- -
- -
- -
- -
- -
-
- - - - - - -
IT IT IT I I I I I
IT IT I I
I

GIZA171 (NAHDA/
GIZA172 (NAHDA/KISAME) GIZA172 (NAHDA/KISAME) GIZA175 (GZ1394-10-1) GIZA176 (GZ2175-5-6)
CALADY 40)
GIZA181 (lR1626-203) GIZA181 (lR1626-203) GIZA181 (lR1626-203) GZ1108-4-1-3 GZ1368-5-4 GZ2175-5-1 GZ2175-5-3 GZ2175-5-4 H230-173 lR1615-246 lR1615-246 lR1615-31-3 lR19743-46-2 lR2153-43-2-5 IR28 KIM RAD C-57 NABATAT ASMAR NAHDA NAHDA REIHO (GIZA 173) REIHO (GIZA 173) SAKHA 1 (GIZA 180,
SAKHA 1 (GIZA 180,
YABANI 15
lR579-48-1-2)
lR579-48-1-2)
86 4 87 6.5 17.8 7.0
77 7 78 6.0 20.0 7.0 78 4 79 5.2 17.4 7.0 86 4 87 7.7 23.5 7.0 86 4 87 6.6 18.6 7.0
78 4 79 6.2 17.3 6.8 86 4 87 7.2 20.1 7.0 86 4 87 7.7 24.8 7.0 86 4 87 7.7 24.8 7.0 86 4 87 6.7 18.9 7.0 86 4 87 6.7 18.6 7.0 86 4 87 6.7 19.0 7.0 73 4 73 5.7 16.2 7.0 77 7 78 8.3 20.0 7.0
77 7 78 8.6 19.2 7.0 86 4 87 9.7 25.2 7.0
86 4 87 8.6 26.0 4.2 77 7 78 7.4 18.0 7.0 73 4 73 7.6 24.7 7.0 66 9 66 4.6 18.2 7.0 73 4 73 6.4 17.6 7.0
78 4 79 5.2 17.3 6.9 77 7 78 6.7 27.6 7.0
78 4 79 6.2 28.0 6.8
73 4 73 6.9 16.5 7.0
77 7 78 8.0 19.6 7.0
78 4 79 6.2 17.8 6.3
78 4 79 6.4 27.7 7.0
77 7 78 7.3 19.6 7.0
68
95 89 28 72 90 82 60
27 66 69 76 90
80 90 27 66 35
100 30
96 98 88 46
32
92
28
89
730
895
870
800
770
985
785
875
-120
-210
-175
-110
-200
-240
-145
600
140
175
175
170
130
210
160
695
6.0 - 4.7 2.4
5.4 134 4.8 2.7
8.3 - 4.6 2.4 6.2 - 4.6 2.5 6.4 115 6.4 2.1
6.2 - 6.1 2.0 11.2 - 4.9 2.4 11.2 - 5.0 2.2
5.7 - 4.7 2.7 6.6 - 4.7 2.5 6.5 - 4.7 2.6
6.6 115 6.0 2.1
6.6 111 6.2 2.1 10.0 - 5.6 2.1
6.1 86 8.5 5.0 128 4.7 2.7
IT
5.6 134 4.6 2.8
8.8 51 5.9 2.0
7.7 77
- 5.9 2.0
I
I I I I I I I I I I I I I I I I I I I I
I I I I I
I
I
- - -
- - - - - - - - - - - - -
- - - - - - - - - - - - - - - - - - - - - - - - - - - - - - - -
- - - - - - -
- - - - - - - - - - - - - -
- - - - - - - - - - - -
- - - - - - -
- - - - - - -
- - - - -
- - - -

Date Amy- Alkali Gel Amylograph viscosity lnstron Crop analyzed Protein lose spread- consis- Length Width Water year (%) (%) ing tency Peak Set- Consis- Hard- Sticki- (mm) (mm) regime b
(mo) (yr) value (mm) back tency ness ness (Bu) a (Bu) (Bu) (kg) (g-cm)
BLUEBONNET CENTA A1 CENTA A2 CENTA A4 CENTA A5 LINEA 5 (P4725F2-9-2
-MS) LIRA MASOL 1 MASOL 4 NIL0 1 X-10 XICA-9
ALPHA [ALFA) ARIETTE ARLATAN ARLATAN ARLESIENNE ARLESIENNE ARLESIENNE ARLESIENNE ARLESIENNE ARLESIENNE ARLESIENNE
79 9 80 9.6 22.0 90 11 90 9.6 25.7 90 11 90 9.7 25.3 90 11 90 5.8 27.1 90 11 90 5.9 25.5 90 11 90 8.2 26.4
79 9 80 8.2 22.9 79 9 80 10.8 23.0 79 9 80 8.7 22.2 79 9 80 7.6 27.5 79 9 80 7.8 22.3 79 9 80 6.8 27.4
EL SALVADOR
6.0 74 625 7.0 26 595 7.0 26 570
6.9 37 835 6.5 42 830
6.4 32 585
6.2 84 575 6.7 40 560 5.8 78 590 5.0 93 515 7.0 58 625 7.0 42 715
-70 695 540 660 215 475
20 235
-15 185 150 555
205 735 630 810 545 615
225 355 210 330 325 655
FRANCE
89 6 91 7.0 19.4 7.0 65
86 11 87 6.5 20.4 7.0 55 88 4 89 6.0 21.0 7.0 51 66 7 67 9.6 20.9 7.0 53 72 5 73 8.6 22.9 7.0 41
77 4 79 8.2 23.3 7.0 48 78 4 79 5.8 25.3 7.0 46 86 11 87 6.3 24.8 7.0 40 88 4 89 6.2 25.3 7.0 36
88 7 89 5.9 17.2 7.0 72
76 8 77 8.0 23.8 7.0 40
565 -5 165 770 -80 310
565 -10 265 690 200 380
610 220 390 625 125 310
500 200 410
6.9 10.7 10.2
9.6 8.0
10.2
6.9 7.4 6.8 6.8 7.4 8.0
- 6.6 2.3 - 6.4 2.2 - 6.9 2.2 - 7.7 2.1 - 6.9 2.3
4.8 5.7 3.2 I 5.3 - 6.3 2.6 I
- 5.2 2.9 I 6.1 - 5.4 3.1 I
I I
7.2 54 5.9 2.7 I 6.1 90 I 6.0 107 6.4 2.7 I
7.6 - 6.2 2.9 I - 6.0 2.8 I
- - -
- - - - - -
- - - - - -
- - - - - -
- - -
- - -
- -
- -
- -
-
- -
- -
- -
- -
- -
-
-

-
ARLESIENNE BALILLA BALILLA BALILLA BALILLA BALILLA 28 CALENDAL CESARIOT CESARIOT CESARIOT CESARIOT BETA THETA CIGALON CIGALON CIGALON CIGALON CIGALON CRIPTO CRISTAL CRISTAL CRISTAL DELTA DELTA DELTA DELTA EURIBE EURIBE EURIBE EURIBE KORAL LIDO MARATHON MIARA ONDA PYGMALION RINGO ROCCA
90 72 77 78 86 66 86 66 72 86 72 66 72 77 86 88 90 72 77 78 72 78 86 88 66 72 77 78 90 88 86 90 88 86 89 89
6 91 8.9 23.2 7.0 36 5 73 7.0 20.6 7.0 100 4 79 5.8 22.5 7.0 79 4 79 6.0 21.9 7.0 71
11 87 5.7 21.0 7.0 52 7 67 7.5 19.0 7.0
11 87 5.7 18.9 7.0 68 7 67 10.7 16.9 7.0 5 73 8.3 18.8 7.0 72
11 87 7.0 19.1 6.9 70 5 73 8.2 20.1 6.5 84 7 67 11.8 16.3 7.0 5 73 7.2 19.2 7.0 98 4 79 7.4 21.7 7.0 82
11 87 6.8 20.4 7.0 52 7 89 7.7 17.1 7.0 68 6 91 8.0 23.8 7.0 30 5 73 7.3 19.3 7.0 76 4 79 5.9 19.9 7.0 79 4 79 5.1 19.9 7.0 81 5 73 7.6 18.3 7.0 82 4 79 5.8 18.1 7.0 82
11 87 6.2 18.6 6.9 75 7 89 7.4 14.4 7.0 68 7 67 8.4 15.6 7.0 5 73 8.1 19.1 7.0 66 4 79 7.1 18.0 7.0 62 4 79 7.0 18.0 7.0 71 6 91 7.7 19.0 7.0 56 7 89 6.4 17.8 7.0 50
11 87 4.9 19.4 7.0 61 6 91 9.5 15.8 7.0 66 7 89 6.8 16.3 7.0 60
11 87 7.8 19.9 7.0 54 6 91 7.1 18.0 7.0 72 6 91 6.4 20.5 7.0 80
510
585 595 515 610 655 730
685
675
670 590 590 490
730 620
705 775 880 845
660 675 580 650 655 600 630 570 675 675
135
-15 -15 -50
115 -230
-35
-185
40
-120 -110
10 150
-115 -85
-175 -250 -150
-75
-95 -115
-90 90
-180 -115
1 -100 -110 -105
355
170 165 105 285
55 220
100
255
145 90
290 365
135 140
115 55
300 260
165 165 235 380
75 215 280 105 255 255
6.9
4.5 134 4.2 135 7.9
6.6
7.4
4.3 135 7.5 5.4 7.0
4.6 129 4.6 134
5.3 144 6.9 6.0
5.8 140 6.0 154 5.1 6.3 5.4 4.9 5.7 8.0 4.2 3.8
6.6 3.2
4.5 2.3
4.4 2.7 4.6 2.6 6.0 2.8
5.7 2.7
5.7 2.4 4.8 2.7 4.9 2.8 5.4 3.0
5.6 2.4
6.6 2.4 6.5 2.5 6.8 2.6
5.9 2.4 6.2 2.3 6.6 2.6 5.3 2.4 5.3 2.9 7.0 2.1 6.3 2.6 5.9 2.7 6.4 2.8 6.7 2.9
- - - -
-
- - - - -
-
-
- -
- - - - - - - - -
- - - - - - - - - - - - -
- - - - -
-
- - -
- - - - - - - - -
- - - - - -
- -
- - - - - - - - - - -
- - - - - - - -
- -
- -
I I I
I I I I I
I I
I I I I
I I
I I I I
I I I I I I I I I
I I I I I
I I
I I I

Date Amy- Alkali Gel Amylograph viscosity lnstron Crop analyzed Protein lose spread- consis- Length Width Water year (%) (%) ing tency Peak Set- Consis- Hard- Sticki- (mm) (mm) regimeb
(mo) (yr) value (mm) back tency ness ness (Bu) a (Bu) (Bu) (kg) (g-cm)
SMERALDO ITALIEN STIRPE 136-7T STIRPE 136-7T
77/44/54 GR 19 EX INGER NlCKERlE SML 128/4 SML 242 SML 352 TOS10,601 EX IlTA TOS10,604 EX IlTA TOS10,607 EX IlTA TOS10,617 EX IlTA TOS10,619 EX IlTA TOS10,626 EX IlTA TOS10,635 EX IlTA TOS10,640 EX IlTA TOS7460 EX IlTA TOS7461 EX IlTA TOS57463 EX IlTA TOS7465 EX IlTA TOS7468 EX IlTA TOS7469 EX IlTA TOS7474 EX IlTA YOGAGA
86 11 87 5.9 19.2 6.9 72 785 -250 65 7.5 86 11 87 5.2 19.8 7.0 67 88 4 89 5.3 18.2 7.0 78 600 -120 230 6.1
GHANA
65 11 65 9.0 27.1 5.0 88 11 90 8.9 27.7 7.0 28 65 11 65 9.0 24.3 4.5 65 11 65 8.9 29.2 4.9 65 11 65 8.0 29.2 4.7 65 11 65 9.1 28.4 4.2 85 10 86 7.2 25.8 4.1 47 85 10 86 7.1 26.2 3.0 78
85 10 86 7.0 26.4 4.9 95 85 10 86 7.0 25.4 3.0 40 85 10 86 8.0 26.2 4.4 85 85 10 86 6.5 26.6 4.7 91
85 10 86 7.2 26.2 4.7 51
85 10 86 5.8 23.0 5.1 70 85 10 86 8.1 25.4 4.9 92 85 10 86 6.4 23.2 4.5 38 85 10 86 7.5 25.6 5.0 87 85 10 86 8.1 21.6 6.0 42 85 10 86 8.3 22.1 6.0 44 85 10 86 8.1 22.1 6.0 43 85 10 86 7.9 21.5 6.0 55 65 11 65 8.1 32.8 5.0
645 55 265 650 560 690 9.0 695 0 235 580 70 250
580 50 250 775 -55 260
520 135 295
- 5.7 2.4 I - 5.4 2.7 I - 5.5 2.8 I
I
I I I I
- 6.3 2.2 I - 6.2 2.2 I - 6.2 2.2 I
- 6.8 2.4
- 4.9 2.7 I
- 6.2 2.5 I
- 6.0 2.5 I
- 6.4 2.2 I
- 4.8 2.7 I
- 6.2 2.5 I - 6.0 2.2 I - 4.6 2.7 I - 5.2 2.4 I - 5.1 2.5 I - 5.3 2.6 I
I I
- - - - - - - - - - - - - - - -
- - - - - - - - - - - - - - - - - - - - - - - - - - - - - - - - - - - -
- - - - - - - - - - - - - - - - - - - -
-
- - - -
- - - -
- - - - - - -
- - - -

AXIOS BLUEBELLE "E" EVROPI ISPANlKl ISPANlKl "A" REA REA ROXANI ROXANI STRIMONAS
ICTA MOTAGUA LISA ICTA MOTAGUA
PUBESCENTE ICTA POLOCHIC ICTA QUlRlGUA ICTA TEMPISQUE PICO NEGRO PRECOZ ICTA TIKAL 2 EX ClAT
89 8 90 89 8 90 89 8 90 84 12 85 89 8 90 84 12 85 89 8 90 84 12 85 89 8 90 89 8 90
89 7 90 89 7 90
89 7 90 89 7 90 89 7 90 89 7 90 89 7 90 89 6 89
6039 83 11 84 BLUEBELLE 83 11 84 CHAMPION 83 11 84 DlWANl 83 11 84 NO. 79 83 11 84 RUSTIC 83 11 85 STARBONNET 83 11 84
GREECE
6.6 18.5 7.0 62 620 -75 260 8.0 25.8 7.0 28 5.7 20.8 7.0 52 570 - 285 5.2 17.8 7.0 81 6.8 22.7 7.0 58 555 35 325 6.0 21.4 5.0 51 6.5 28.2 7.0 30 585 250 520 5.7 15.8 4.0 89 7.0 21.0 6.0 64 715 -130 290 6.7 21.6 7.0 52 655 -65 290
GUATEMALA
7.0 22.6 7.0 50 545 500 565 6.4 25.2 7.0 46 660 615 690
5.8 26.7 6.8 38 795 605 815 7.6 26.2 6.1 42 770 375 640 6.8 27.0 5.9 56 775 505 700 6.8 24.2 6.0 84 590 -5 305 8.0 26.6 7.0 38 445 590 585 6.2 27.0 7.0 28
GUYANA
7.9 29.2 7.0 30 9.9 21.8 4.7 36
11.7 24.7 7.0 31 9.1 27.8 5.0 48 8.7 31.8 5.0 86 7.2 31.2 7.0 57 7.1 22.2 5.0 41
3.9 7.0 4.4 6.3 4.8 8.2 7.1 5.1 4.6 4.4
- 6.5 2.9 - 6.8 2.1 - 6.3 2.7 - 5.4 2.6 - 5.5 2.7 - 6.2 2.3 - 6.5 2.4 - 5.9 2.7 - 6.6 2.3 - 6.4 2.6
9.9 - 7.0 2.3 9.5 - 7.1 2.3
9.4 - 6.7 2.1 8.7 - 7.1 2.1 9.7 - 7.1 2.3 7.0 - 7.6 2.5
11.0 - 6.7 2.1 - 7.2 2.3
9.9 - 6.6 1.9 9.6 - 7.3 2.0 8.7 - 7.1 2.1 7.3 - 8.0 2.2 7.7 - 6.5 2.3 9.5 - 8.0 1.8 8.4 - 6.8 2.0
- - -
- - -
- - -
- - -
- - - -
- - - - - - - - - - - - - - - - - - - - -
I I I I I I I I I I
I I I I I I I

Date Amy- Alkali Gel Amylograph viscosity lnstron Crop analyzed Protein lose spread- consis- Length Width Water year (%) (%) ing tency Peak Set- Consis- Hard- Sticki- (mm) (mm) regime b
(mo) (yr) value (mm) back tency ness ness (Bu) a (Bu) (Bu) (kg) (g-cm)
VARIETY N VARIETY S (IR1055) VARIETY T
CRETE A PIERROT FO LTO N MADAME BLANC MANZETA TORO CRYSTAL WALIPATE
316 B-12 B-13 B-16 DUBOVSZKIJ 129 DUNGHAN SHALI DUNGHAN SHALl G-185 G-195 G-238 G-238/SZ-11 G-242
83 11 84 9.1 30.2 7.0 83 11 84 7.3 29.8 7.0 83 11 84 10.0 22.9 5.4
90 6 91 5.6 20.3 4.9 90 6 91 6.0 26.2 6.0 90 6 91 5.7 28.0 5.8 90 6 91 5.6 29.4 5.6 90 6 91 6.3 28.4 6.0 90 6 91 6.6 23.3 5.3
89 7 90 6.8 19.8 6.4 89 7 90 7.1 18.8 6.0 89 7 90 7.7 19.2 6.6 89 7 90 8.1 16.2 4.6 67 10 67 8.2 20.0 7.0 67 10 67 7.5 25.4 6.7 77 7 78 7.3 23.6 7.0 77 7 78 6.3 20.9 7.0 77 7 78 7.3 23.7 7.0 85 6 86 5.8 18.6 7.0 85 6 86 10.7 17.3 7.0 85 6 86 5.7 17.0 6.9
30 29 40
HAITI
55 1000 -160 370 86 690 10 370 92 650 50 390 91 600 115 405 89 605 190 475 54 765 -135 310
HUNGARY
66 56 54 70
58 71 52 53 41 60
635 755 735 715 785 710 710 685 750
1025 960
1170
-90 265 -180 255 -170 250 -145 255
60 275 10 260
-35 190 -15 265
-320 95 -395 25 -510 55
-105 195
11.0 - 7.2 2.0 I 10.3 - 6.5 2.3 I
7.8 - 7.0 2.3 I
5.1 - 7.1 2.0 6.6 - 6.1 2.3 6.6 - 5.9 2.3 6.8 - 6.0 2.3 7.8 - 7.0 2.4 5.7 - 6.5 2.0
5.2 - 7.3 2.7 I 4.9 - 7.0 2.6 I 4.9 - 7.0 2.6 I 4.7 - 7.0 2.6 I
I I
7.0 99 5.5 2.7 I 4.6 128 5.6 2.7 I 6.7 69 6.4 2.4 I 8.8 - 6.7 2.6 I 9.1 - 6.8 2.5 I 7.6 - 5.8 2.6 I
- - - - - - - - -
- - - - - - - - - -

G-258 G-264 G-264/SZ-1 G-316 G-341 G-409 G-780 HEIJAN-14 HSC-1 HSC-2 KAKAl 162 KAKAl 203 KAKAl 203 KALARIS KARMINA KOROSTAF
MUTASHALI MUTASHALI NUCLEORYZA NUCLEORYZA
OLlMPlA ORYZELLA RINGOLA SANDORA SZARVASI 70 SZARVASI KARCSIE TIMIS 53 VlCA
M-225
OKI-3
ADT35 AKASHl (IR8/N22)
77 7 78 85 6 86 85 6 86
77 7 78 85 6 86 85 6 86 85 6 86 89 7 90 89 7 90 67 10 67 67 10 67 77 7 78 85 6 86 89 7 90 89 7 90 85 6 86 77 7 78 85 6 86 77 7 78 85 6 86 89 7 90 89 7 90 85 6 86 89 7 90 89 7 90 77 7 78 77 7 78 77 7 78 85 6 86
77 7 78
81 7 81 79 4 80
6.4 23.0 7.0 54 7.6 24.2 7.0 34 9.7 23.2 7.0 32 7.8 23.9 6.7 57 8.0 23.8 7.0 60 8.5 22.8 6.7 50 6.9 23.2 6.0 46 7.8 17.4 7.0 46 6.2 17.7 4.9 60 6.4 18.8 4.6 72 7.2 23.2 7.0 8.7 22.4 6.8 91 6.4 22.2 7.0 63 6.6 14.5 4.8 80 6.8 22.8 7.0 31
8.1 17.6 7.0 49 7.0 21.4 7.0 92 6.4 18.8 7.0 49 6.6 23.6 7.0 48 6.2 22.5 7.0 39 7.6 17.0 7.0 55 6.6 21.4 7.0 32 7.0 22.8 6.0 40 7.1 23.4 6.8 45 5.8 23.2 7.0 44 6.6 23.6 6.8 52 7.6 20.4 7.0 78 7.1 20.4 7.0 70 6.7 23.6 6.4 41
7.6 21.8 7.0 33
755 1005
985 735 705
1070 1240
930 740 795 720 740 680
1350 495 570 980 630
1060 600
1020 625 470
1190 670 665 775 570 620
1190
-5 -50
-145
45 -5
-300 -555 -355 -175 -195
45 -45 20
-610 245 95
-405 0
-460 200
-170
225 -35
-455 55
5 -15 80
-405 -5
280 315 260 250 280 210 120 65
255 260 305 265 240 80 460 280 65
190 -35 340 220 270 410 115 390 345 270 200 165 125
6.0 10.3 10.5 6.8 7.4 8.8 8.3 8.3 4.5 5.4
6.0 7.4 7.6 7.2 9.4 4.4 7.8 7.7 9.5 5.0 7.7 8.8 7.3 6.5 6.2 5.4 5.8 9.3
lNDlA (HYDERABAD & CUTTACK)
- 22.9 5.4 76 9.0 27.5 5.4 100 455 380 410 7.0
102
99 88
102
134
69
99 100 97
85
5.8 2.7 I 6.5 2.6 I 6.4 2.3 I 6.5 2.3 I 6.6 2.4 I 7.2 2.6 I 7.0 2.5 I 4.5 3.0
I
7.0 2.6 7.4 2.6
I
I
5.4 2.7 I 5.4 2.6 I 6.8 2.7 I 5.9 2.7 I 5.3 3.0 I 7.3 2.7 I 7.3 2.8 I 5.5 2.7 I 6.0 2.8 I 7.2 2.6 I 6.1 2.5 I 7.4 2.5 I 7.4 2.5 I 7.0 2.6 I 5.4 2.7 I 6.4 2.6 I 4.4 3.0 I 6.9 2.2 I
I I
- - - - - - - - -
-
- -
- -
- - - - - - -
- -
- -
- - - -
-
- - - - - -

Date Amy- Alkali Gel Amylograph viscosity lnstron Crop analyzed Protein lose spread- consis- Length Width Water year (%) (%) ing tency Peak Set- Consis- Hard- Sticki- (mm) (mm) regime b
(mo) (yr) value (mm) back tency ness ness (Bu) a (Bu) (Bu) (kg) (g-cm)
BAM9 64 7 65 7.6 22.6 5.1 - 875 535 BASMATI 370 73 5 73 9.2 17.6 3.7 39 BASMATI 370 79 4 80 6.7 22.3 5.0 74 640 -50
CR2001 64 7 65 7.2 26.8 4.9 - 515 355 GEB24 73 5 73 8.4 26.5 7.0 32 IET1991 73 5 73 7.8 27.5 7.0 95 IET1991 73 5 73 11.3 25.8 7.0 77 IET2508 73 5 73 9.0 27.2 7.0 34 IET5656 79 4 80 10.2 27.4 5.5 70 775 205 IET5656 81 9 82 7.9 29.1 6.0 31 I ET5854 79 4 80 10.7 25.4 5.0 31 570 575 IET5897 81 9 82 7.3 29.2 6.0 88 IET6314 81 9 82 8.3 28.4 6.0 34 INDlA IR20 81 7 81 - 28.2 6.8 45 J192 64 7 65 6.3 22.0 6.0 - 735 325 JAGANNATH 73 5 73 8.8 27.8 4.8 JAYA (TN-1/T141) 73 5 73 8.2 26.8 7.0 42
JAYA (TN-1/T141) 81 9 82 6.8 29.1 7.0 30 K540 73 5 73 9.2 27.6 5.0 94 LATISAIL 73 5 73 7.6 28.0 5.0 28 MAHSURI 73 5 73 8.8 24.1 7.0 30 MAHSURI 79 4 80 10.6 27.0 5.0 31 670 460 MANOHARSALI 73 5 73 7.3 27.3 6.0 90 NElKlTCHlDl 81 7 81 - 23.4 4.2 62 PARAKKUM SlTTU 81 7 81 - 28.1 7.0 86 PTB10 64 7 65 8.1 23.5 3.0 - 770 160 RASl 79 4 80 10.1 27.7 7.0 46 370 490 RATNA 73 5 73 9.2 27.8 7.0 97
CAUVERY (TKME/TN-1) 73 5 73 9.2 28.0 5.4
JAYA (TN-1/T141) 73 5 73 9.0 26.3 7.0 43
660
210
420
400
560
495
515
390 465
5.6
7.3 8.6 7.8 7.1 8.3
9.0
7.6
7.3
127
95
71
76
83
I 6.9 1.9 I
I I I I I I I I
5.6 2.4 I I
5.2 2.6 I 5.8 2.5 I
I I I I
6.1 2.5 I 6.5 2.6 I
I I
4.8 2.0 I I I I I I I I
- - - - - - - - -
- - - - - - - - - -
- - - - - - - - - - - - - - - - - - - - - - - - - - - - - - - -
- - - - - -
- - - - - - - - - - - - - - - - -
- - - - - - - - - - - -
- - - - - - - - - - - - - - - - - - - - - - - - - - - - - - - - - - -
- - - - - - - - - - - - - - - - - - - - - - -
- - - - - -
- - - - - - -

RATNA RP193-1 RP4-14 RP4-14 RP4-14 RP5-32 RP6-17 RP79-23 RPW6-17 SL013 SUREKHA T141 T141 T3 T90 TELLAHAMSA TELLAHAMSA VANI (IR8/CR1014) VELLAI PONNI VIJAYA (T90/IR8)
AMBEMOHAR 157 JS180
KAMOD 253 KARJAT 116
KARJAT 184
KOLAMBA 42 KOLAMBA 540 PALGHAR 60 RATNAGlRl 24
KALA RATNA 1-24
KARJAT 14-7
KARJAT 7-3A
73 5 73 7.8 28.9 6.2 85 73 5 73 7.7 26.3 7.0 65 73 5 73 7.4 28.7 5.1 100 79 4 80 8.0 28.6 5.2 100 81 9 82 5.7 30.8 5.1 90
81 9 82 7.3 30.0 7.0 43 73 5 73 9.8 27.2 6.8 90 79 4 80 10.3 27.5 6.3 38 73 5 73 7.5 26.7 6.9 100 81 9 82 7.3 30.0 7.0 43 64 7 65 7.9 23.7 5.7 73 5 73 10.1 26.2 6.9 100 73 5 73 8.3 18.6 4.5 65 73 5 73 8.7 25.5 6.9 100 79 4 80 11.2 27.7 7.0 32 81 9 82 9.0 29.4 7.0 32 79 4 80 9.0 28.1 7.0 88 81 7 81 - 27.8 6.7 32 73 5 73 8.7 28.2 6.2 86
73 5 73 7.3 26.8 7.0 36
505 370 435
675 355 460
425 315 350
630 570 610
335 325 310
INDIA (MAHARASHTRA)
73 5 73 7.1 21.2 3.6 86 73 5 73 6.9 29.0 4.6 40 73 5 73 7.6 30.3 4.4 42 73 5 73 6.5 24.9 4.8 80 73 5 73 5.4 28.6 7.0 32 73 5 73 7.0 31.2 7.0 42 73 5 73 5.8 31.6 7.0 39 73 5 73 6.7 31.4 7.0 46 73 5 73 4.9 31.6 3.8 39 73 5 73 4.7 31.6 4.5 41 73 5 73 6.3 31.2 7.0 35 73 5 73 6.9 27.9 6.9 70
8.2 7.9
9.6
7.8
9.6
8.4 9.1 7.6
- 6.4 2.0
- 6.5 2.0
- 6.8 2.2
83
- 6.8 2.2
84
87
94
- 6.7 2.0
- - - - - - - - - - - - - - - - - -
- - - - - - - - - - - - - - - - - - - - - -
- - - - - - - - - - - -
- - - - - - - - - - - - - - - - - - - - - - - - - -
- - - - -
- - - - - - - - - - - - - - - -
- - - - - - - - - - - - - - - - - - - - - - - - - - - - - - - - - - - - - - - - - - - - - - - - - - - - - - - - - - - - - - - - - - - - - - - - - - - - - - - - - - - -
I I I I I I I I I I I I I I I I
I I I
I I I I I I I I I I I I

Date Amy- Alkali Gel Amylograph viscosity lnstron Crop analyzed Protein lose spread- consis- Length Width Water year (%) (%) ing tency Peak Set- Consis- Hard- Sticki- (mm) (mm) regimeb
(mo) (yr) value (mm) back tency ness ness (BU) a (Bu) (Bu) (kg) (g-cm)
SATYA ZINYA 14
+2791MR-257-2 221/BC lV/I/45/8/2 221/BC lV/I/45/8/2 531B/TK/8/16/PN/3 ANGKONG
BAHBUTONG BANIH HIRANG 1
(ACC 57553) BANIH HIRANG 2
(ACC 57554) BANIH PEKAT 1
(ACC 57555) BANIH TAYAN 1
(ACC 57556) BAOK BAO K BAOK Ill BATANG PANE BAYAR KUNING
(ACC 57557) BAYAR KUNING 1
(ACC 57558)
ASAHAN (lR2071-621-2)
73 5 73 6.0 30.1 5.2 50 - - - - - - - I 73 5 73 5.9 30.5 4.7 69 - - - - - - - I
lNDONESlA
79 - 80 8.3 21.9 2.3 75 825 63 8 63 7.4 23.1 4.9 - 960
71 10 71 8.6 22.2 4.2 50 79 - 80 9.2 23.4 4.4 63 780 78 11 79 - 13.8 7.0 79 85 6 86 9.5 21.0 4.2 45 1340 83 - 83 - 28.4 5.2 45
83 - 83 - 28.6 5.0 48
63 8 63 7.6 23.8 4.9 - 835
-205 215 -270 250
-10 350
-60 300
-550 195
- 6.3 2.3 I I I I
7.1 119 5.3 2.2 I - 5.5 2.2 I
7.1 - 6.1 2.5 I T
T
83 - 83 - 27.9 5.2 32 - - - - - - - T
83 - 83 - 1.6 6.0 100 - - - - - - - T
63 8 63 7.6 23.2 5.7 - 885 -200 295 - - - - I 71 10 71 7.1 23.7 5.0 82 - - - - - - - I
85 6 86 9.5 27.2 4.9 38 900 60 365 8.8 - 6.4 2.5 I 79 - 80 7.5 22.1 6.0 26 830 -135 295 6.8 120 5.2 2.6 U
83 - 83 - 28.4 4.4 49 - - - - - - - T
83 - 83 - 28.3 5.4 40 - - - - - - - T
- - -
- - - - - -
- - - - - - -
- - - - - - -
- - - - - - -

BAYAR KUNING 2 (ACC 57559)
BEAK GANGGAS BEAK GANGGAS BENGAWAN BENGAWAN BENGAWAN BENONG 130 BENONG 130 BIBIT DELAPAN 1
(ACC 57560) BlJl NANGKA
(ACC 57561) BILIS/BANIH HIRANG 1
(ACC 57562) BJM10 BJM11 BJM12 BJM13 BJM14 BJM15 BJM16 BJM17 BJM3 BJM4 BJM5 BJM6 BJM7 BJM8 BJM9 BOGOWONTO BRANTAS C4-63G CENDRAWATI CIKAPUNDONG CISADANE
83
63 71 63 71 76 63 71 83
83
83
86 86 86 86 86 86 86 86 86 86 86 86 86 86 86 85 78 78 79 85 79
- 83 - 27.4 5.5 30
8 63 8.4 22.0 6.0 10 71 8.0 24.7 6.0 63
10 71 7.5 26.2 5.0 67 6 76 5.3 24.4 6.0 76 8 63 8.4 24.2 5.9
10 71 7.8 24.8 6.0 49 83 - 28.6 4.6 46
- 83 - 27.8 5.6 35
- 83 - 27.8 5.1 34
4 87 7.2 27.8 5.0 32 4 87 7.5 29.8 5.8 32
4 87 7.1 29.0 5.2 34 4 87 8.5 27.9 5.1 29 4 87 7.2 27.6 5.0 30
4 87 6.8 28.8 5.0 32 4 87 8.1 27.8 6.1 28 4 87 6.7 29.8 5.0 32
4 87 6.8 29.0 5.2 30 4 87 6.8 4.8 7.0 94 4 87 7.4 27.6 5.0 30 4 87 7.0 28.6 6.0 32 6 86 8.7 24.2 4.6 33
11 79 - 28.5 4.3 67 11 79 - 25.3 4.3 70
- 80 5.0 24.5 6.2 67 6 86 7.8 22.0 5.0 50 - 80 8.5 21.2 3.2 64
8 63 7.4 22.8 4.9
4 87 7.2 29.3 5.0 36
4 87 7.4 7.6 7.0 83
4 87 7.1 28.6 5.0 32
940
890
915 820
925 870 855 840 885 815 555 875 815 915 930 900 635 820 805
1195
30 1370
790
-255
-170
-165 -140
-45 5
135 160 140
70 -195
-65 200
25 -60
140 -230
25 60
-260
-85 -550 -150
255
325
270 7.1 320
40 9.2 265 9.6 415 9.8 410 8.8 425 8.9 335 9.0
- 7.1 225 9.4 435 9.6 315 9.0 275 8.8 425 9.1
15 6.6 300 8.7 295 8.6 295 9.3
270 5.6 170 7.3 225 5.9
88
- 5.2 2.3 D - 6.3 1.7 D
- 6.1 1.8 D - 5.5 1.8 D - 6.4 2.0 D - 6.2 2.1 D - 6.6 2.1 D - 6.2 1.5 D - 5.4 2.0 D - 5.6 2.0 D - 6.2 1.6 D - 6.2 2.1 D
- 6.0 1.6 D
- 6.8 2.2 I - 6.2 2.2 I
176 5.2 2.6 U - 5.9 2.5 I
124 6.3 2.3 I
- 5.8 2.1 D
- 5.3 1.9 D
- 5.5 2.3 I - -
- -
- -
- -
- - - - - - -
- - - - - - -
- - - - - - - - - - - - - - T
T
T
T
- - - - - l - - l
l - - - - - - - - l
l - - - - - - - - l
- - - - T
-
-
- - -
- - -
- - -
-

Date Amy- Alkali Gel Amylograph viscosity lnstron Crop analyzed Protein lose spread- consis- Length Width Water year (%) (%) ing tency Peak Set- Consis- Hard- Sticki- (mm) (mm) regime b
(mo) (yr) value (mm) back tency ness ness (Bu) a (Bu) (Bu) (kg) (g-crn)
80 3 80 7.9 22.1 4.3 58 85 6 86 9.5 21.1 4.7 42 85 6 86 10.6 25.6 3.0 33 78 11 79 - 19.8 3.8 70 79 - 80 8.0 24.5 5.0 50 83 - 83 - 25.4 4.9 34 76 6 76 5.1 28.3 5.9 53 63 8 63 8.1 24.4 5.4 63 8 63 6.3 31.2 4.9 83 - 83 - 23.0 5.5 34
79 - 80 10.7 20.3 3.1 50 79 - 80 10.5 19.9 3.0 70 63 8 63 7.8 22.8 6.0 79 - 80 6.3 24.9 6.3 74 78 11 79 - 28.0 7.0 30 78 11 79 - 22.7 4.2 58 71 4 71 - 26.0 - 79 - 80 8.5 26.2 6.3 26 83 - 83 - 28.6 5.2 45 83 - 83 - 23.4 5.2 38 83 - 83 - 29.0 4.9 47
83 - 83 - 27.9 5.2 43
83 - 83 - 27.6 5.0 73
70 - 80 8.6 27.3 4.9 79 79 - 80 6.5 24.3 5.6 56
5.9 I 7.6 - 6.2 2.5 I 9.7 - 5.9 2.2 I
- 7.0 2.4 I 7.2 126 6.9 2.7 I
T 7.5 65 I
I I T
6.9 112 5.6 2.3 I 6.9 126 5.4 2.3 I
I 7.0 141 5.6 2.5 U
- 6.8 2.1 I - 6.2 1.8 I
I 8.2 81 5.9 2.3 U
T T T
T
T
7.4 92 6.5 2.2 U 6.7 135 6.0 2.2 U
CISADANE CISADANE CISOKAN CITARUM CITARUM DARUN 1 (ACC 57563) DEWI RATIH DJAMBU 129 DJELITA DWARF BIJI/NANG-
KALAYANG (ACC 57564) GADIS ClAMlS GADIS JAMBE GROPAK GEDE 97 HAWARBATU IR34 IR38 I R8 JlDAH KAMUNING (ACC 57565) KAPUAS (ACC 57566) KARANG-DUKU 1
(ACC 54101)
(ACC 57567)
(ACC 17805)
KATUMBAR KUNING 1
KATUMBAR PUTIH 1
KENCANA MUARA KEWAL
1250 705
-330 345
265 440
750 -95 255
1050 820
1030
655 810 910 705
235
260 -150
25 -160 -240
-40
465 315 590
100 230 260 295
900 445 675
600 780
285 -100
440 250
- -
-
-
- - -
- - -
- - -
- - -
- - -
- - -
- - -
- - -
- - -
- - -
-
-
-
-
-
-
- - -
- - -
- - -
- - -
- - -
- - -
- -
- - - - - -
- - -
-
-
- - -
-
-
- - -
-
-
- - -
-
-

KRIAU 1 (ACC 57568) KRUENG ACEH LAKATAN GADUR 1
(ACC 57569) LAKATAN LAKATUT 1
(ACC 57570) LAKATAN LAKATUT2
(ACC 57571) LAKATAN PAHU 1
(ACC 57572) LAYANG KUNING 1
(ACC 57573) LAYANG PUTIH 1
(ACC 57574) LAYANG PUTIH 2
(ACC 57575) LEMO 1 (ACC 20207) MANDOLIN MAYOR PADI GABADUL 1
(ACC 57576) PALINGKAU 1
(ACC 57577) PANDANWANGI PELITA 1-1 PELITA 1-1 PELITA 1-1 PELITA 1-2 PELITA 1-2 RADEN SAW0
(ACC 57578) REMADJA RENDAH PADANG RENDAH PADANG
RENDAH PADANG 2 (ACC 43740)
(ACC 57579)
83 - 83 - 1.4 6.3 85 6 86 8.8 20.9 3.0 83 - 83 - 1.5 6.4
83 - 83 - 1.5 6.8
83 - 83 - 23.7 5.8
83 - 83 - 27.9 5.5
83 - 83 - 27.8 5.8
83 - 83 - 23.4 5.8
83 - 83 - 27.2 5.2
79 - 80 7.7 14.9 2.7
a3 - 83 - 28.0 5.2
83 - 83 - 27.5 5.9
79 - 80 7.1 24.3 6.3
83 - 83 - 27.6 5.5
79 - 80 8.6 23.8 6.7 71 10 71 6.6 24.5 2.6 76 6 76 6.7 23.4 3.6
71 10 71 7.5 25.5 5.7 78 11 79 - 23.3 5.4
78 11 79 - 22.7 4.2
83 - 83 - 28.2 5.4
63 8 63 7.2 30.4 4.9 79 - 80 6.1 27.5 4.8 83 - 83 - 28.7 5.0
a3 - 83 - 29.0 4.8
100 38
100
100
45
34
38
40
50
51 58 50 50
44
40 74 76 58 38 78 83
35 56
46
1250
850 640
705
960
990 955
-455
-240 5
-20
-175
240 200
155
210 275
260
270
565 545
7.7 - 5.9 2.5
6.5 196 6.4 2.2 7.0 133 5.6 2.7
6.9 126 6.3 2.5
6.5 72 5.8 2.6 - 5.8 2.2
- 6.1 2.2
7.3 99 5.7 2.2
- - - - - - -
- - - - - - -
- - - - - - -
- - - - - - -
- - - - - - -
- - - - - - -
- - - - - - -
- - - - - - -
- - - - - - -
- - - - - - -
- - - - - - -
- - - - - - - - - - - - - - - -
- - - - - - -
- - - - - - -
T I T
T
T
T
T
T
T
T U U T
T
U I I I I I T
I I T
T
- - - - - - -
- - -
- - -
- - - -

Date Amy- Alkali Gel Amylograph viscosity lnstron Crop analyzed Protein lose spread- consis- Length Width Water year (%) (%) ing tency Peak Set- Consis- Hard- Sticki- (mm) (mm) regime b
(mo) (yr) value (mm) back tency ness ness (Bu) a (Bu) (Bu) (kg) (g-cm)
ROJOLELE ROJOLELE ROJOLELE SARANG BURUNG
SARIMAHI (ACC 18690)
SEMERU (lR2307- 247-2-2-3)
SEMERU (lR2307- 247-2-2-3)
SEMERU (lR2307- 247-2-2-3)
SENTANI SERATUS MALAM SERATUS MALAM SERATUS MALAM SERATUS MALAM SERAYU SERAYU SIBUNG RENDAH
(ACC 57580) SIBUNG TlNGGl 1
(ACC 57581) SlGADlS SUKANANDI SUKANANDI SYNTHA SYNTHA
71 4 71 - 27.0 - 76 6 76 8.0 23.8 5.9 100 79 - 80 10.2 22.0 4.8 79 83 - 83 - 27.4 6.0 43
79 - 80 9.7 23.0 4.8 44 79 - 80 8.6 25.4 7.0 66
80 3 80 8.9 28.9 7.0 60
85 6 86 8.7 25.7 7.0 58
85 6 86 8.4 19.0 3.8 52 71 10 71 10.4 23.9 4.3 54 76 6 76 6.6 24.0 6.0 66 79 - 80 9.6 23.1 5.0 55 81 - 82 8.7 23.0 6.0 38 78 11 79 - 28.5 5.0 52 79 - 80 9.8 26.1 4.9 64 83 - 83 - 27.4 5.0 43
83 - 83 - 27.7 4.9 41
63 8 63 8.2 27.8 4.9 63 8 63 7.6 23.2 5.4 71 10 71 7.6 23.9 5.6 65 71 10 71 6.2 25.2 5.3 56 79 - 80 7.3 26.1 2.5 42
6.2 2.4 7.4 2.6
5.9 2.4 6.4 2.1
6.2 2.1
6.7 2.2
6.9 2.2
7.1 2.7
5.5 2.5 6.5 2.8
6.5 2.0
7 10 845
-110 -180
210 225
6.1 5.9
76 131
820 460
-90 455
300 515
7.4 7.1
7.1
8.7
8.0
116 85
455
1310
340
-510
390
170
925 730
-130 15
260 295
6.7 7.0
76 108
91 670 305 500 7.3
1000 960
200 -60
545 360
985 240 550 8.0 95
I I U T
I I
I
I
I I I U
I I T
T
I I I I I
- - - - - -
- - - - -
- - - -
-
- - - - - -
- -
- -
- - - -
- -
- -
- -
- -
- - - -
- - - - - - -
- - - - - - -
- - - -
- -
- -
- -
- - - -
- - - -
- - - -
- -

TAMPOKONG KUNING
TAMPOKONG PUTIH 1
TUNTANG UMBANG GADABUNG 1
UMBANG GADABUNG 2
UMBANG KABATIK 1
UMBANG KABATIK 2
UMBANG KENCANA 1
UMBANG PUTIH 1
UMBANG SAMPAHIRANG
UMBANG SAMPAHIRANG
WULUNG
(ACC. 57582)
(ACC 18973)
(ACC 57583)
(ACC 57584)
(ACC 57585)
(ACC 57586)
(ACC 57587)
(ACC 57589)
(ACC 57590)
2 (ACC 57591)
172 346 NO316 ITALY
ADVANCED LINE 1033 (JAPONICA)
AHLAMI-TAROM AMOL-2 (lR28) BINAM BINAM (BEENAM) DOM SAFID (DUM SAFID) DOM SIAH (DUM SIAH)
83 - 83 - 28.0 6.0
83 - 83 - 20.3 7.0
85 6 86 8.0 27.6 5.0 83 - 83 - 27.7 5.2
83 - 83 - 28.7 5.3
83 - 83 - 27.9 5.5
83 - 83 - 27.8 5.4
83 - 83 - 28.0 5.7
83 - 83 - 28.2 5.8
83 - 83 - 27.3 6.1
83 - 83 - 10.5 7.0
79 - 80 7.3 24.0 7.0
66 6 67 4.8 14.8 6.0 66 6 67 10.0 15.0 6.0
85 7 86 7.1 27.3 7.0 85 7 86 8.1 25.7 5.6 85 7 86 7.1 28.9 7.0 85 7 86 7.9 21.6 5.0 66 6 67 11.8 22.9 5.3 66 6 67 11.2 18.3 5.3 66 6 67 10.8 17.2 5.0
34
82
37 885 65 350 53
44
48
50
36
52
38
80
48 805 65 400
IRAN
- 910 -320 140 - 820 -200 200
28 805 485 570 42 730 -75 155 28 840 455 595 50 750 -230 90
- 925 -195 265 - 845 -135 250
75 940 -190 260
T
T
8.1 - 6.6 2.4 I T
T
T
T
T
T
T
T
8.1 116 6.1 2.5 U
I I
8.8 - 7.2 2.0 I 7.3 - 6.8 2.0 I 9.1 - 6.6 2.1 I 7.4 - 6.6 2.1 I
I I I
- - - - - - -
- - - - - - -
- - - - - - -
- - - - - - -
- - - - - - -
- - - - - - -
- - - - - - -
- - - - - - -
- - - - - - -
- - - - - - -
- - - - - - - -
- - - - - - - - - - - -

Date Amy- Alkali Gel Amylograph viscosity lnstron Crop analyzed Protein lose spread- consis- Length Width Water year (%) (%) ing tency Peak Set- Consis- Hard- Sticki- (mm) (mm) regime b
(mo) (yr) value (mm) back tency ness ness (Bu) a (Bu) (Bu) (kg) (g-cm)
DOM SIAH (DUM SIAH) DOM SIAH (DUM SIAH) DOM SUFFAID 76 (DUM
DOM SURKH (DUM
DOM ZARD (DUM ZARD) DOM ZARD (DUM ZARD) FEEROUZ GARM CHAMPA GHARIB
HARAZ HASSANEE KHAZAR MEHR MEHR 111 MEHR 131 MIRZA AMBERBOW MOOSA TAROM 1
(MOOSA TARON 1) MOOSA TAROM 110
(MUSSA TAROM 110) SALARI (SALARIE) SALARI (SALARIE) SARD CHAMPA TAICHUNG 65
SAFlD 76)
SURKH)
GILL-1
TAROM-AMOL
73 8 74 9.4 20.8 5.7 46 85 7 86 8.6 22.9 5.1 54 73 8 74 8.8 20.4 4.2 48
73 8 74 10.2 21.0 5.2 53
66 6 67 10.7 19.9 5.3 73 8 74 10.0 20.0 5.6 50 66 6 67 11.3 19.2 4.0 66 6 67 7.7 27.4 5.0 66 6 67 12.3 17.2 5.0 85 7 86 7.8 28.0 5.5 32 85 7 86 7.1 28.8 7.0 36 85 7 86 9.6 22.4 7.0 36 85 7 86 8.8 22.5 4.8 56 66 6 67 10.1 19.0 4.2 73 8 74 9.0 21.8 5.1 60 73 8 74 8.6 22.2 5.8 80 73 8 74 9.5 20.3 4.0 66 66 6 67 9.6 19.3 5.0
73 8 74 8.4 21.3 4.8 54
66 6 67 11.1 20.9 5.6 73 6 67 9.6 21.0 4.3 56 66 6 67 8.0 27.5 5.0 66 6 67 8.8 16.1 6.0 85 7 86 8.9 24.2 5.0 49
720
930
940
635 820 670 805
1000
805
875
560 725 705
-180
-200
-220
90 355
0 -250 -120
-60
-155
140 -130 -130
90
250
255
245 465 125
80 355
285
245
300 195 115
7.5 50 7.2 1.9 I 8.3 - 6.9 2.1 I
I
I
I I I I I
9.1 - 6.8 2.2 I 9.7 - 7.4 2.2 I 9.1 - 6.3 2.6 I 7.7 - 7.0 1.9 I
I I I I I
I
I I I I
8.1 - 7.0 2.0 I
- - -
- - - - - - -
- - - - - - -
- - - - - - - - - - -
- - - - - - - - - - - - - - - - - -
- - - - - - - - - - - - - - - - - - - - - - - - -
- - - -
- - - - - - -
- - - - - - - - - - -
- - - - - - - -
-
- - -
-
-
-
- -

ARBORIO ARBORIO ARBORIO BAHIA BALD0 BALILLA BALILLA BALILLA GRANA GROSSA BONNET BELL CARNAROLI ELIO EUROPA EUROPA GRITNA ITAL PATNA ITALICO RONCAROLO LIDO MARATELLI MONTICELLI ORlGlNARlO PADANO RAFFAELLO RAFFAELLO RAZZA 82 RlBE RlBE RINALDO BERSANI RINALDO BERSANI 265 RING0 RIZZOTTO 264 ROMA ROMA ROSA MARCHETTl ROSA MARCHETTI
64 5 65 8.3 17.1 7.0 72 6 73 7.8 20.2 7.0 77 6 78 7.6 20.6 7.0
77 6 78 7.1 20.6 7.0 72 6 73 5.8 20.8 7.0 77 6 78 6.3 22.0 7.0 64 5 65 5.6 16.5 7.0 90 6 91 7.5 23.4 7.0 90 6 91 6.8 24.1 7.0 90 6 91 6.1 25.4 7.0 72 6 73 7.8 20.2 7.0 77 6 78 6.8 20.4 7.0 77 6 78 7.5 21.0 7.0 72 6 73 6.7 20.7 7.0 82 12 82 - 19.4 7.0 82 12 82 - 20.6 7.0 72 6 73 5.4 21.2 7.0 82 12 82 - 20.7 7.0
- 21.0 7.0 77 6 78 6.1 21.1 7.0 72 6 73 6.7 23.7 7.0 76 12 76 6.8 24.7 7.0 64 5 65 7.2 15.2 5.0 72 6 73 6.6 19.2 7.0 77 6 78 6.8 19.8 7.0
64 5 65 6.9 15.1 6.8 77 6 78 6.6 20.7 7.0 64 5 65 6.5 16.9 7.0 72 6 73 6.8 17.1 6.0 77 6 78 7.3 18.2 7.0 72 6 73 7.7 20.0 7.0 77 6 78 6.5 21.4 7.0
82 12 82 - 20.8 7.0
82 12 82
64 5 65 8.0 1 6.8 7.0
ITALY
46 89
90 48 92
85
42 32 40 49 86 79 50 68 62 58 70 68 92 28 36
78 89
91
99 94 74 89
740
640
645
580 775 440 480 425
645 680
660
550 980
710 820
710 920
880
655
640
-95
-60
-25
40 45
205 155 195
-55 -50
-50
175 -295
-90 -50
-140 -95
-160
-135
-40
145
160
200
165 325 380 365 320
170 160
190
390 190
170 280 220 175 260
120
160
4.1 106 6.4 3.0 4.4 - 5.5 2.9 4.9 102 6.6 2.8
4.2 108 4.7 2.7
7.5 - 6.9 2.7 7.0 - 7 .1 3.2 6.5 - 4.9 3.1
4.4 111 5.7 2.5 5.2 91 6.5 2.5
4.4 - 4.5 2.7 5.2 - 5.3 2.3
3.2 - 5.3 3.0 4.4 - 4.7 2.8 4.1 118 5.1 2.9
7.4 52
5.0 130 6.1 2.6
4.2 115 6.1 2.5
4.6 91 5.5 2.7
4.0 144 6.1 2.8
- - - - - - - - - - - -
- - -
- - - - - - -
- - - - -
- - - - - - -
- - - - - - - - - - - - - - - - - - - - - - - - - -
- - - - - - - - -
- - - - - - - - - - - -
- - - - - - - - - -
- - - - - - - - - - - -
- - - - - - -
I I I
I I I I
I I I I
I
I I I I I I I I I I I I I I

Date Amy- Alkali Gel AMylograph viscosity lnstron Crop analyzed Protein lose spread- consis- Length Width Water year (%) (%) ing tency Peak Set- Consis- Hard- Sticki- (mm) (rnm) regime b
(mo) (yr) value (rnm) back tency ness ness (Bu) a (Bu) (Bu) (kg) (g-cm)
SANT ANDREA 82 12 82 - 21.6 7.0 72 STIRPE 136 64 5 65 6.3 19.3 7.0 - 800 -105 230 VENERIA 82 12 82 - 20.2 7.0 72 VIALONE 64 5 65 8.1 19.3 6.8 - 930 125 445 VIALONE NANO 72 6 73 7.5 22.6 7.0 40 VOLANO 82 12 82 - 20.2 7.0 55
IVORY COAST
BG141 88 8 88 6.5 28.0 5.0 66 640 BG141 88 8 88 8.4 27.1 5.0 54 445 BG187 88 8 88 6.5 27.5 5.2 53 500 BG187 88 8 88 9.1 26.7 5.0 46 565 CHIANAN 8 88 8 88 8.2 15.6 7.0 68 690 DOURADO 88 8 88 7.0 25.7 5.2 68 605 DOURADO 88 8 88 8.2 24.7 5.0 44 720 IAC164 EX INGER 88 11 90 10.9 22.0 5.0 38 685 IRAT144 88 8 88 7.0 16.7 4.7 76 820 IRAT144 88 8 88 9.1 15.9 5.0 77 805 IRAT156 88 8 88 6.8 17.0 4.7 75 700 IRAT156 88 8 88 7.3 16.9 4.8 78 890 MOROBEREKAN EX INGER 88 11 90 8.6 21.7 6.0 50 630 PALAWAN 88 8 88 7.6 21.5 5.0 40 550 PALAWAN 88 8 88 6.3 22.9 5.0 44 785 TEKSICHUT 88 8 88 7.0 26.8 5.0 40 555 TEKSICHUT 88 8 88 7.9 27.5 5.0 44 655 TJEMPOVELUT 88 8 88 7.7 23.1 5.6 36 590 TJEMPOVELUT 88 8 88 8.4 23.6 5.9 42 765
130 190 230 205
-115
30 -380 -345 -295 -390
-85 -210
220 125
-145 -205
-270
-235
-280
340 335 255 360
180 105 340 100 125 120 125 270
95 375 435 195 175 375
4.2
4.6
4.0
8.8 8.1 7.7 8.8 6.4 8.8 6.6 6.7 6.2 7.3 6.3 6.8 6.0 7.3 6.9 7.6 8.4 7.8 8.4
- 6.0 2.9
- 5.9 2.6
- 6.6 3.2
- 5.7 2.5 I - 5.5 2.5 U - 5.4 2.4 U - 5.8 2.5 I - 4.9 3.0 I - 7.2 2.5 U
- 7.2 2.7 U 6.5 2.8 U
- 6.5 2.8 I 6.5 2.5 U
- 6.5 2.7 I
- 7.1 2.6 I
- 6.7 2.6 U - 5.3 2.6 U - 5.9 2.8 I - 6.2 2.4 U
- 5.8 2.6 U - 6.2 2.4 I
- 5.9 2.8 I
-
-
- - -
-
-
- -
-
- -
- -
- - - -
- - -
- - -
I
I I
-
-
-

ZAKPALE 3 ZAKPALE 3
AKENOHOSHI AKENOHOSHI AKIBARE AKlHlKARl AKlHlKARl AKlHlKARl CHUGOKU 102 FUJlMlNORl
HATSUNEMOCHI HATSUNEMOCHI HlERl (AROMATIC) HOKURIKU 129 HOKURIKU 130 HOKURIKU 133 HOKURIKU NO. 52 HONENWASE HONENWASE HONENWASE ISHlKARl KANTO 138 KINMAZE KINNANPUU KINPA KlYONlSHlKl KOGANEMOCHI KOSHlHlKARl KOSHlHlKARl KOSHIHIKARI KOSHlHlKARl
H87-88
88 8 88 88 8 88
86 - 88 86 - 88 72 8 73 86 - 88 86 - 88 86 - 88
72 8 73 89 12 90
70 - 71
86 - 88 86 - 88 86 - 88 66 2 67 72 8 73 76 12 76
80 9 82
72 8 73 66 2 67 76 12 76
86 - 88
70 - 71
81 - 82
86 - 88
86 - 88
86 - 88 70 - 71 66 2 67 72 8 73 76 12 76 86 - 88
8.1 26.7 5.0 37 540 200 375 8.4 27.3 5.0 39 575 205 85
JAPAN
6.8 14.1 3.4 7.7 14.6 3.0 6.4 18.2 7.0 88
6.8 14.1 7.0 7.0 14.7 7.0 6.9 14.2 3.8
7.6 13.5 3.8 44 7.6 1.0 6.5 6.5 1.0 6.7 81 7.6 20.3 4.7 88 6.5 14.0 7.0 6.9 14.4 6.4 6.9 14.3 6.5 7.4 15.6 7.0 7.3 16.1 6.0 100 6.6 16.7 7.0 68 6.9 14.4 7.0 7.2 21.6 7.0 56 8.8 14.5 7.0 60 6.0 17.6 7.0 100 6.4 12.1 6.4 5.4 19.1 7.0 55 6.8 15.2 7.0 6.5 1.0 6.3 86 6.0 12.4 7.0 5.2 15.6 6.0 100 5.0 17.3 7.0 66 6.3 13.3 7.0
7.8 14.6 7.0
7.1 18.8 7.0 92 840 515 595
665
690
715 585
560 770
625
-10 410 -75 45
-100 45
-35 255
-115 185
-120 215 -50 185
-80 35 -160 220
-195 65
8.7 8.5
5.6 6.1
6.8 5.5 6.0 5.7
4.6
6.0
5.0 6.2 5.3
6.6 5.2
6.5
6.1 6.0 5.6
5.9 4.7
120 104
105 114 100 121
370
97 115 100
89 115
115
72 112 326
81 119
5.6 2.4 U 5.9 2.5 I
5.0 2.7 I 5.2 2.6 I
I 4.6 2.6 I 4.7 2.7 I 4.7 2.8 I 5.4 2.7 I
I 6.9 2.0
I I
5.2 2.3 I 6.4 3.0 I 5.1 2.8 I
I I
4.6 2.7 I 4.6 2.7 I 4.9 2.7 5.0 3.0 I
I 4.7 2.7 I 4.4 2.6 I 4.6 2.7 I
I I I
4.6 2.6 I 4.8 2.6 I
- - - - - - - -
- - - - - - - - - - - - - - - - - - -
- - -
- - - - - - - - - - - - - - -
- - -
- - - - - - - - - - - - -
- - - -
- - -
-
-
-
-
- -
- - - -
- - - - - - - -
- - - - - -
- - - - - - - -
- -
- - - - - -
- - - - - - - - - -
- - - -
-

Date Amy- Alkali Gel Amylograph viscosity lnstron Crop analyzed Protein lose spread- consis- Length Width Water year (%) (%) ing tency Peak Set- Consis- Hard- Sticki- (mm) (mm) regime b
(mo) (yr) value (mm) back tency ness ness (Bu) a (Bu) (Bu) (kg) (g-crn)
KOSHIJIWASE KOSHIJIWASE KOSHlMlNORl KOSHlNlSHlKl MILYANG 23 MILYANG 23 NAKATAMOCHI NAKATE-SHINSENBON
NIHONBARE NIPPONBARE NIPPONBARE NIPPONBARE NIPPONBARE NORIN 1 NORIN 1 NORIN 25 NORIN 41 OUU324 OUU325 OUU326 OUU327 REIHO REIHOH RElMEl SAlKAl 168 SAlKAl 179 SAlKAl 180 SASANlSHlKl
NAN-El
66 2 67 7.8 13.6 7.0 - 710 -80 72 8 73 7.3 15.2 6.0 100 80 9 82 5.4 21.3 5.4 64
86 - 88 7.1 16.4 7.0 86 - 88 8.0 14.6 7.0
72 8 73 7.1 16.7 7.0 100 64 - 64 12.0 19.5 7.0 80 9 82 6.4 19.8 7.0 57 72 8 73 7.0 18.5 6.6 100
86 - 88 7.2 15.4 7.0
66 2 67 7.0 13.9 7.0 - 715 -105
63 - 64 8.1 21.2 7.0 - 560 150 64 - 64 8.9 17.5 7.0 86 - 88 7.8 13.7 7.0 86 - 88 6.5 15.0 7.0 86 - 88 6.5 15.5 7.0 86 - 88 7.5 15.2 7.0
80 9 82 7.1 20.8 7.0 58 72 8 73 8.2 15.6 6.0 81
86 - 88 7.2 16.2 7.0 86 - 88 6.4 16.6 7.0 72 8 73 5.6 18.2 6.8 95
76 12 76 6.0 16.2 7.0 66 675 -230
70 - 71 7.0 1.0 7.0 90 350 -5
86 - 88 8.7 14.6 7.0
86 - 88 7.8 15.1 6.9
70 - 71 9.6 1.0 7.0 86 350 -15
86 - 88 7.9 15.6 7.0
86 - 88 8.0 15.2 7.0
215
85 6.0 - 6.2
6.2 80 5.9
- 6.7 - 6.2 - 6.3
215
315 65 6.9
- 6.0 - 5.3 - 6.0 - 6.3 - 6.7
- 6.0 - 6.5 - 7.3
92 93
108 347
87 89
110
267
109 104
95 106
95
88 99
102
I I
4.7 2.8 4.9 2.7 I 6.0 2.4 I 6.5 2.3 I
I I I
4.9 2.9 4.7 2.8 I 4.9 2.7 I 4.9 2.8 I 5.1 2.7 I
I I I I
5.0 2.7 I 4.8 2.7 I 5.3 2.8 I 5.6 3.1 I 5.0 2.8 I 5.0 2.8
I 5.0 2.6 I 5.0 2.9 I 5.2 2.6 I 4.6 2.5 I
- -
- -
- -
- -
-
- - -
- - - - - -
- - -
- -
- -
- - -
-
- -
- -
- -
- - - -
- -
- - - - - -
- -
- -
- -
- -
- - - -
- -
- -
- -
-
- - - -
- - - -
-
- - - -
- - - - - - - - - - - - - -
- - - - - - - - - - -
- - - - - - - - - - -
- -

SASANlSHlKl SASANlSHlKl SENSHUURAKU SHlOKARl TAINUNG 67 TOYONlSHlKl YAMABIKO YUKHARA
AKIBARE AKIBARE AKIBARE AKIBARE AKUHlKALl BAEG YANG BYEO BAEG YANG BYEO BAEG YANG BYEO BEA KYUNG JO CHEUNG CHEUNG BYEO CHEUNG CHEUNG BYEO CHIAG BYEO CHlL SEONG BYEO CHU CHEONG BYEO
CHUNG KUNDO CHUPUNG BYEO DAE CHEONG BYEO DO BONG BYEO DO BONG BYEO DONG JIN BYEO DONG JIN BYEO EUN HA BYEO GAYA BYEO
(AKIBARE)
80 9 82 5.7 19.4 7.0 55 86 - 88 6.0 15.0 7.0 66 2 67 6.7 18.5 7.0 - 715 -65 250 72 8 73 8.1 19.3 7.0 100 86 - 88 6.7 15.4 7.0
72 8 73 8.1 17.3 6.2 100 64 - 64 10.9 18.6 7.0
86 - 88 8.7 13.5 7.0
KOREA, REPUBLlC OF
77 5 78 6.7 17.5 7.0 90 610 -125 160 81 6 83 7.7 19.3 7.0 71 82 6 83 7.3 18.4 6.7 83
81 6 83 9.1 18.5 7.0 56 81 6 83 9.2 17.1 5.0 54
84 12 85 8.9 14.1 6.0 86 67 12 67 6.7 19.1 5.0 - 630 -100 195 81 6 83 10.8 17.6 7.0 58 82 6 83 9.5 16.1 6.5 78 82 6 83 7.5 17.8 6.0 77 84 12 85 9.3 12.7 6.4 80 84 12 85 8.3 16.6 7.0 79
67 12 67 7.4 20.7 5.3 - 805 -200 200 81 6 83 8.9 18.7 7.0 55 84 12 85 8.2 15.8 7.0 78 81 6 83 8.4 19.4 7.0 66 82 6 83 8.5 18.5 6.0 80 81 6 83 7.2 19.3 7.0 65 82 6 83 6.6 18.8 7.0 84 82 6 83 7.3 18.0 6.8 72 82 6 83 7.4 18.9 7.0 55
88 - 89 6.7 19.0 7.0 72 510 35 295
82 6 83 9.2 17.5 6.0 83
- 4.9 2.7 5.6 105 4.7 2.7
5.5 104 4.8 3.0 6.3 99 4.8 2.8
4.6 39 4.6 2.7 4.9 22 4.8 2.8 3.8 34 4.8 2.8 6.4 39 4.9 2.7 5.2 12 4.7 2.7 4.9 14 5.6 2.6 4.0 38 5.5 2.7 5.8 - 5.5 2.6
4.7 21 5.8 2.5 4.2 26 5.7 2.6 5.0 17 4.7 3.0 6.3 - 4.7 2.4 6.8 - 4.8 2.7
4.5 20 5.6 2.4 6.6 - 5.1 2.8 5.2 11 4.9 3.1 3.8 22 5.0 2.7 5.0 8 4.8 2.9 5.0 17 5.0 2.8 3.8 22 4.7 2.8 4.6 11 5.8 2.5
- - - -
- - - - - - - - - - - - - - -
- - - - - - - -
- - - - - - - -
- - - - - -
- - - - - - - - - - - -
- - - - - - - - - - - - - - -
- - - -
- - - - - - - - - - - - - - - - - - - - - - - - - - - -
I I I I I I I
I I I I I I I I I I I I I I
I I I I I I I I I
- - - -
- -
-

Date Amy- Alkali Gel Amylograph viscosity lnstron Crop analyzed Protein lose spread- consis- Length Width Water year (%) (%) ing tency Peak Set- Consis- Hard- Sticki- (mm) (mm) regime b
(mo) (yr) value (mm) back tency ness ness (Bu) a (Bu) (Bu) (kg) (g-cm)
GEUM GANG BYEO GEUM GANG BYEO GWAN AG BYEO GWAN AG BYEO HAMBUR JO HANGANGCHAL BYEO HUKUHIKALI HWASEONGBYEO IR1350 JAEKEUN JINHEUNG JINHEUNG JINHEUNG JINHEUNG JINHEUNG JINJU BYEO JINJU BYEO JOSENG TONGIL JUNG WEON BYEO KUCHUN DO MAN SEUG BYEO MAN SEUG BYEO MANKEUNG MILYANG 21 MILYANG 21 MILYANG 23 MILYANG 23 MILYANG 23 MILYANG 23
81 6 83 9.5 18.8 7.0 82 6 83 7.4 18.5 7.0
82 6 83 9.2 18.1 6.6 67 1 2 67 7.6 19.4 5.0
82 6 83 8.2 17.0 7.0 88 - 89 7.9 20.3 7.0 82 6 83 9.3 17.4 6.0 63 2 64 8.3 22.7 6.6 63 2 64 8.0 22.9 6.5 72 5 73 6.7 21.6 7.0 75 6 76 7.0 19.1 7.0 77 5 78 6.6 18.2 7.0 82 6 83 7.7 18.7 7.0 81 6 83 8.2 19.6 7.0 82 6 83 8.1 18.9 7.0 81 6 83 9.2 19.4 7.0
68 12 68 8.4 20.5 7.0 81 6 83 10.0 18.1 7.0 82 6 83 8.8 17.7 6.8 72 5 73 6.2 21.3 7.0 77 5 78 8.9 15.0 7.0 81 6 83 9.7 18.1 7.0 77 5 78 7.1 19.5 7.0 81 6 83 9.4 18.5 7.0 82 6 83 9.0 17.6 5.8 84 12 85 7.8 16.5 7.0
81 6 83 9.2 19.5 7.0
88 - 89 6.7 1.8 6.0
84 12 85 8.3 12.2 7.0
51 53 55 64
100 67 86 79
77 100
98 60 57 70 55 82
54 58 80 93 49 92 64 82 72
595 550
445
555 570
625 615
530
750
840
-100 -300
-45
85 100
-85 -50
50
-200
-260
135 65
205
200 195
175 175
215
150
130
5.8 18 5.4 2.6 4.5 11 5.4 2.6 I 5.4 11 4.7 3.0 I 3.6 30 4.6 2.6 I
I 6.4 71 6.0 2.6 I 4.8 15 4.9 2.7 I 7.3 31 4.9 2.8 I 4.6 21 5.9 2.7 I
I I I
5.7 102 I 4.8 122 5.2 2.8 I 4.2 23 5.1 2.9 I 5.1 28 4.9 2.8 I 5.0 17 4.8 2.9 I 5.9 20 6.1 2.7 I 6.6 - 5.1 2.5 I
I 5.0 15 5.3 2.5 I 4.4 22 5.6 2.5 I
I 4.9 111 5.0 2.5 I 5.3 12 5.8 2.2 I 4.7 122 6.0 2.4 I 5.7 14 6.0 2.5 I 4.9 22 5.9 2.5 I 6.2 - 5.9 2.5 I
- - - - - - - - - - - -
- - - - -
- - -
- - - - -
- - - - - - - -
- - - - - - - - -
- - - - - - - - - - - - - - -
- - - - - - - - - - - - - - - - -
- - -
- - - - - - - - -
I

MILYANG 23 MILYANG 29 MILYANG 30 MILYANG 30 MILYANG 30 MILYANG 42 MILYANG 42 MILYANG 53 MILYANG 58 MILYANG 59 MILYANG 60 MILYANG 61 MILYANG 62 MILYANG 63 MILYANG 64 MILYANG 65 MILYANG 66 MILYANG 67 MILYANG 77 NAG DONG BYEO NAG DONG BYEO NAG DONG BYEO NAM PUNG BYEO NONG BAEG NONGBAEK NOPOONG NORIN 716 OU DAE BYEO OU DAE BYEO PAL GEUM PAL GWANG BYEO PAL GWENG PALKUM PALKWENG PALTAL POONGSANG BYEO
88 - 89 7.8 19.0 6.7 58 680 81 6 83 11.1 17.9 6.0 65 77 5 78 7.9 18.0 7.0 88 730 81 6 83 10.2 17.0 7.0 59 82 6 83 8.9 16.4 6.8 80 81 6 83 10.5 18.5 7.0 66 82 6 83 9.0 19.0 6.5 74 81 6 83 9.8 17.9 7.0 54 82 6 83 7.6 18.4 7.0 63 82 6 83 6.9 18.6 7.0 68 82 6 83 7.5 18.7 7.0 64 82 6 83 8.4 17.8 7.0 60 82 6 83 8.1 17.8 7.0 74 82 6 83 8.2 17.4 6.5 72 82 6 83 6.7 18.2 7.0 77 82 6 83 6.4 19.3 7.0 75 82 6 83 6.9 22.6 7.0 50 82 6 83 6.5 18.8 7.0 70 85 6 85 10.5 17.0 7.0 74 532 81 6 83 9.2 18.6 6.3 48 82 6 83 7.7 17.7 6.5 70 84 12 85 7.7 16.0 6.1 75 82 6 83 8.1 18.5 7.0 68 81 6 83 8.2 19.5 7.0 57 72 5 73 9.1 19.6 7.0 86 77 5 78 8.3 18.2 7.0 95 770
81 6 83 9.1 18.6 6.3 58 82 6 83 6.6 18.0 7.0 64 81 6 83 10.3 17.9 7.0 55
81 6 83 8.9 19.4 7.0 58 72 5 73 7.1 20.3 7.0 79
63 2 64 7.6 23.7 6.3 - 530 81 6 83 9.6 17.4 5.0 67
72 5 73 6.5 21.4 7.0 82
81 6 83 10.6 17.2 6.0 56
72 5 73 6.2 21.7 7.0 83
-85 255
-155 165
-162 65
-230 90
140 210
6.6 5.0 4.9 5.3 3.8 5.7 4.4 5.1 5.0 5.0 5.0 4.4 5.0 4.8 3.6 5.0 5.3 5.1 7.4 5.1 4.4 6.1 4.8 5.8
4.6
4.9 4.9 5.1 5.2 5.7
5.0
44 20
112 14 50 21 47 12 12 13 12 18 15 18 30 14 10 14
9 22
12 10
134
12 14 12 15 10
20
6.1 2.6 5.6 2.4 5.1 2.4 4.9 2.6 5.2 2.6 5.0 2.6 5.4 2.7 5.8 2.3 5.5 2.5 6.1 2.6 4.9 2.6 5.8 2.5 6.0 2.4 5.7 2.6 4.8 2.7 4.8 2.9 4.9 2.9 5.1 2.7
5.0 2.8 4.9 2.8 4.9 2.7 5.6 2.5 4.7 2.8
5.5 2.2
5.2 3.0 5.4 2.9 5.5 2.8 5.5 2.6 4.9 3.0
5.9 2.4
- - -
- - - - - - - - - - - - - - - - - - -
- - - - - - - - - - - - -
- - - - - - - - - - - - -
- - - - - -
- - - - - -
- - - - - -
- - - - - - - -
- - - - - - - -
- - -
- - - - - - - -
- - -
-
-
- - -
-
- - -
- - -
- - -
- - -
- - -
I I I I I I I I I I I I I I I I I I I I I I I I I I I I I I I I I I I I

Date Amy- Alkali Gel Amylograph viscosity lnstron Crop analyzed Protein lose spread- consis- Length Width Water year (%) (%) ing tency Peak Set- Consis- Hard- Sticki- (mm) (mm) regime b
(mo) (yr) value (mm) back tency ness ness (Bu) a (Bu) (Bu) (kg) (g-cm)
PUNGSAN BYEO RAEGYENG RElMEl RElMEl SADOMlNARl SAET BYUL BYEO SAM GANG BYEO SAM GANG BYEO SAM GANG BYEO SAM NAM BYEO SAM NAM BYEO SANG PUNG BYEO SEM JIN BYEO SEOL AG BYEO SEU (SEO) GWANG BYEO SEU (SEO) GWANG BYEO SEU (SEO) NAM BYEO SEU (SEO) NAM BYEO SEUMJEN BYEO SHIN 2 SHINPOONG SINSEONCHALBYEO SIROKANE SO BAEG BYEO SO BAEG BYEO SUJEUNG BYEO SUSANG JO SUWEON 213 SUWEON 213-1
82 6 83 9.4 17.8 5.5 77 5 78 7.2 14.0 7.0 81 6 83 7.9 17.5 7.0 82 6 83 6.7 17.7 6.7 81 6 83 8.0 19.2 7.0 81 6 83 9.4 17.1 5.5 81 6 83 9.4 17.1 7.0 82 6 83 7.7 16.2 7.0 84 12 85 8.3 12.8 7.0 81 6 83 8.2 19.0 7.0 82 6 83 8.2 17.6 6.8 82 6 83 8.0 17.9 7.0 84 12 85 7.3 14.9 7.0 81 6 83 9.4 17.8 7.0 81 6 83 9.9 18.0 6.0 81 6 83 9.8 17.6 7.0 81 6 83 8.3 18.5 7.0 82 6 83 6.9 17.8 7.0 82 6 83 7.3 17.6 7.0 81 6 83 7.4 18.8 7.0 63 2 64 7.8 23.2 6.6
72 5 73 6.1 20.7 7.0 81 6 83 8.8 18.0 6.0 82 6 83 7.0 16.7 6.3 82 6 83 9.2 17.2 5.5 67 12 67 7.9 17.8 5.0 72 5 73 8.0 22.3 7.0 72 5 73 8.9 22.2 7.0
88 - 89 7.6 1.7 6.0
83 86 71 73 56 75 61 82 76 59 66 74 84 65 66 75 51 58 81 68
100 85 70 84 72
72 66
- 3.6 765 -185 140 5.0
- 4.2 - 4.2 - 4.7 - 4.5 - 4.6 - 3.6
5.4 - 5.1 - 3.9 - 4.8 - 6.1 - 4.9
4.9 - 4.2 - 5.3
4.5 3.8 4.8
565 95 230 145 -40 15 5.8
- 4.6 - 4.4 - 4.5
650 -70 210
45 126
24 34 18 35 16 41
15 22 15
16 17 20 12 12
27 24
64
30 40 23
6.0 2.6 I 6.1 2.4 I 4.9 2.8 I 4.8 2.8 I 4.9 2.8 I 5.6 2.3 I 5.4 2.3 I 5.3 2.5 I 5.4 2.4 I 5.0 2.9 I 5.0 2.8 I 4.8 2.9 I 4.9 2.7 I 4.9 2.8 I 6.0 2.4 I 5.8 2.6 I 4.8 2.8 I 5.0 2.8 I 5.1 2.9 I 4.7 2.8 I
I 4.6 2.8 I
I 4.8 2.8 I 5.0 2.8 I 5.8 2.4 I
I I I
- - - - - - - - - - - - - - - - - - - - - - - - - - - - - - - - - - - - -
- -
-
- - - - - - - -
-
-
- -
- -
- -
- -
- -
- -
- - -
- - -
- - -
- - -
-
-
-
-
-

SUWEON 251 SUWEON 258 SUWEON 264 SUWEON 300 SUWEON 301 SUWEON 302 SUWEON 306 SUWEON 306 SUWEON 312 SUWEON 314 SUWEON 315 SUWEON 82 SUWEON 82 SUWEON JO TADO AEK TAE BAEG BYEO TAE BAEG BYEO TAE BAEG BYEO TAIGOL BYE TONGIL (lR667-98) TONGIL CHAL (WX-126) TONGIL CHAL (WX-126) TOYA Z1 TU DO YONGJUBYEO (YEONG
DEOG BYEO) YONGMUNBYEO YOUNG PUNG BYEO YOUNG PUNG BYEO YUSHIN YUSHIN
CHAO LEP NOK CHAO PHEUANG DENG
77 5 78 7.1 18.2 7.0 77 5 78 6.9 19.2 6.3 77 5 78 8.2 18.6 7.0 81 6 83 8.9 18.2 7.0 81 6 83 9.4 18.0 7.0 81 6 83 9.2 18.3 7.0 81 6 83 6.8 19.1 7.0 82 6 83 7.1 18.4 7.0 82 6 83 8.3 15.5 7.0 82 6 83 8.5 18.1 7.0 82 6 83 8.2 17.8 6.5 63 2 64 8.5 21.9 5.4 72 5 73 8.7 19.6 7.0 67 12 67 6.8 31.5 6.0 68 12 68 5.7 24.1 6.0 81 6 83 9.2 18.0 7.0 82 6 83 7.0 18.3 6.5 84 12 85 8.9 13.8 7.0 68 12 68 7.2 24.2 7.0 75 6 76 7.0 19.9 7.0 75 6 76 8.4 - 6.0
68 12 68 6.1 6.8 6.1 68 12 68 6.6 23.4 6.1
76 1 77 8.8 - 7.0
88 - 89 9.7 15.0 6.3
85 6 86 10.0 11.5 7.0 81 6 83 10.7 18.1 7.0 82 6 83 7.6 18.0 7.0 75 6 76 7.8 19.2 7.0 81 6 83 9.3 18.2 7.0
88 11 89 8.2 24.6 6.9 88 11 89 9.2 23.0 6.3
99 95 92 61 65 66 62 65 66 52 67
88
51 64 74
94 87
100
82
56 54 67
100 71
LAOS
27 30
855 -245 775 -195 790 170
645 451
360 2802 685 -30
600 -60 665 -95 505 -180
200 -35 685 -70 685 -110
705 -155
760 370 720 110
150 140 170
500
950 240
105 185
65
55 200 260
150
590 450
3.8 4.2 4.4 4.9 4.6 5.0 5.1 4.9 4.2 5.2 4.8
5.3 4.6 6.5
7.4 4.9
6.6
5.4 4.4 5.9 4.9
8.3 6.9
168 162 123
18 20 13 20 14 28 10 13
19 19
102 330
30
18 26
111 20
5.6 2.3 I 5.1 2.5 I 5.2 2.5 I 5.5 2.5 I 4.9 2.7 I 4.7 2.8 I 4.9 2.8 I 5.1 2.7 I 6.4 2.8 I 5.9 2.3 I 5.7 2.6 I
I I I I
6.0 2.2 I 5.8 2.3 I 5.8 2.1 I
I I I
5.6 2.5 I I I
5.4 2.6 I
5.4 2.6 I 5.9 2.4 I 6.0 2.3 I 5.7 2.5 I 5.6 2.5 I
6.5 2.2 R 6.2 2.2 R
- - - - - - - - - - - - - - - - - - - - - - - -
- - -
- - - - - - - - -
-
- -
-
- -
- - - - - - - - -
- - - - - - - - - - - - - - - -
- - - - -
- - - -
- - - - - - - - - - - - -
- -
- -
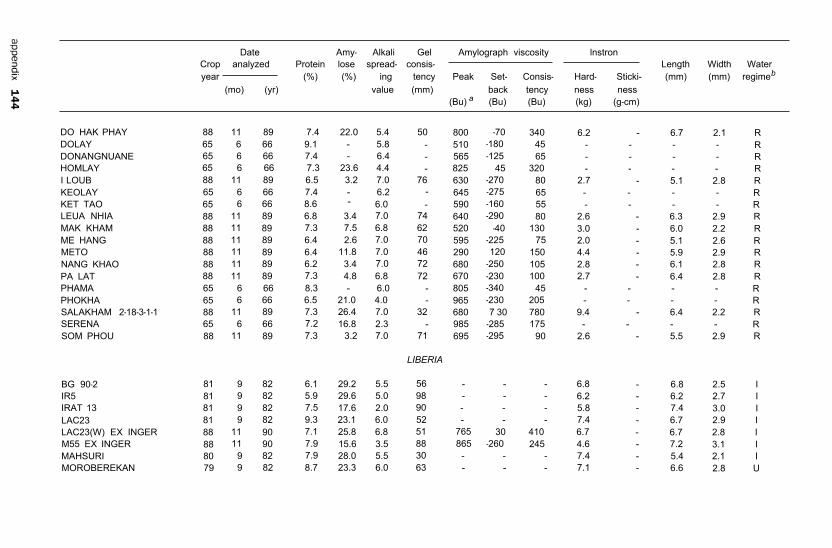
Date Amy- Alkali Gel Amylograph viscosity lnstron Crop analyzed Protein lose spread- consis- Length Width Water year (%) (%) ing tency Peak Set- Consis- Hard- Sticki- (mm) (mm) regime b
(mo) (yr) value (mm) back tency ness ness (Bu) a (Bu) (Bu) (kg) (g-cm)
DO HAK PHAY DOLAY DONANGNUANE HOMLAY I LOUB KEOLAY KET TAO LEUA NHIA MAK KHAM ME HANG METO NANG KHAO PA LAT PHAMA PHOKHA
SERENA SOM PHOU
SALAKHAM 2-18-3-1-1
BG 90-2 IR5 IRAT 13 LAC23 LAC23(W) EX INGER M55 EX INGER MAHSURI MOROBEREKAN
88 11 89 7.4 22.0 5.4 50
65 6 66 7.4 - 6.4 65 6 66 7.3 23.6 4.4 88 11 89 6.5 3.2 7.0 76
65 6 66 8.6 - 6.0 88 11 89 6.8 3.4 7.0 74 88 11 89 7.3 7.5 6.8 62 88 11 89 6.4 2.6 7.0 70 88 11 89 6.4 11.8 7.0 46 88 11 89 6.2 3.4 7.0 72 88 11 89 7.3 4.8 6.8 72
65 6 66 6.5 21.0 4.0 88 11 89 7.3 26.4 7.0 32 65 6 66 7.2 16.8 2.3 88 11 89 7.3 3.2 7.0 71
65 6 66 9.1 - 5.8
65 6 66 7.4 - 6.2
65 6 66 8.3 - 6.0
LIBERIA
800 510 565 825 630 645 590 640 520 595 290 680 670 805 965 680 985 695
81 9 82 6.1 29.2 5.5 56 81 9 82 5.9 29.6 5.0 98 81 9 82 7.5 17.6 2.0 90 81 9 82 9.3 23.1 6.0 52 88 11 90 7.1 25.8 6.8 51 765 88 11 90 7.9 15.6 3.5 88 865 80 9 82 7.9 28.0 5.5 30 79 9 82 8.7 23.3 6.0 63
-70 -180 -125
45 -270 -275
-290 -160
-40 -225 120
-250 -230 -340 -230 7 30
-285 -295
30 -260
340 45 65
320 80 65 55 80
130 75
150 105 100
45 205 780 175
90
410 245
6.2
2.7
2.6 3.0 2.0 4.4 2.8 2.7
9.4
2.6
6.8 6.2 5.8 7.4 6.7 4.6 7.4 7.1
- 6.7 2.1 R R R R
- 5.1 2.8 R R R
- 6.3 2.9 R - 6.0 2.2 R - 5.1 2.6 R - 5.9 2.9 R - 6.1 2.8 R - 6.4 2.8 R
R R
- 6.4 2.2 R R
- 5.5 2.9 R
- 6.8 2.5 I - 6.2 2.7 I - 7.4 3.0 I - 6.7 2.9 I - 6.7 2.8 I - 7.2 3.1 I - 5.4 2.1 I - 6.6 2.8 U
- - - - - - - - - - - - - - -
- - - - - - - - - -
- -
- - - - - - - -
- - - - -
- - - - - - - - - - - -
- - - - - -

ROK11 (ADNY2) ROK16 SUAKOKO SUAKOKO 8 EX INGER
ALI COMBO AMBALALAVA CHIANAN 8 IAC25 MADlNlKA MAKALIOKA ROJOFOTSY TSIPALA A VARY VATO
BG 96-3 C4-63 DAMIT MADCANDU
MR1 MR49 MR7 TAICHUNG-SEN-YU-195 TR2 TR7
(MATCHANDU)
ACHEH 62 ADAN ADAN BUDA
81 81 81 88
86 86 86 86 86 86 86 86 86
82 82 82 82
82 82 82 82 82 82
72 72 76
9 9 9
11
10 10 10 10 10 10 10 10 10
11 11 11 11
11 11 11 11 11 11
12 12
7
82 82 82 90
86 86 86 86 86 86 86 86 86
82 82 82 82
82 82 82 82 82 82
72 72 76
6.4 29.5 5.0 90 7.2 23.6 6.0 60 8.5 28.4 5.5 51 8.4 29.4 5.8 30 730 385
MADAGASCAR
7.8 26.1 6.0 100 405 145 8.6 26.6 6.3 92 600 205
10.4 21.6 7.0 43 585 -20
6.8 25.8 6.9 44 895 265 6.1 27.0 5.2 100 490 160 8.1 23.0 7.0 42 575 5 7.1 25.8 6.1 86 650 235
5.4 16.7 7.0 72 640 -210
7.2 24.4 7.0 49 730 -100
MALAYSIA, EAST (SABAH)
6.9 29.2 7.0 32 8.2 22.7 4.0 54 7.8 29.6 5.0 44 6.0 29.1 5.4 32
7.1 28.4 6.7 30 6.4 25.6 7.0 48 7.7 22.8 3.2 58 5.8 21.1 7.0 52 6.5 28.0 3.0 56 6.0 28.4 7.0 38
MALAYSIA, EAST (SARAWAK)
5.4 29.7 6.0 6.3 11.8 2.5 9.2 11.2 2.2 44 875 -235
600
245 315
30 155 110 440 260 200 370
230
8.0 - 6.6 2.1 I 7.0 6.5 2.7 I 7.6 7.0 2.2 I 9.3 - 6.3 2.2 I
7.2 8.5 6.4 8.5 9.1 8.3 6.3 7.7 7.7
8.2 2.4 I 6.2 2.4 I 4.7 2.8 I 6.8 2.4 I 7.7 2.2 I 6.5 1.9 I 6.1 2.6 I 5.4 2.3 I 6.6 2.2 I
7.2 6.4 7.6 8.2
8.2 6.5 7.0 5.1 6.2 7.0
I I
I
I I I I I I
I I
6.2 112 I
- - -
- - -
- - -
- -
- - - - - - - - -
- -
- -
- -
- -
- -
- -
- -
- -
- -
- - - -
- - - - - -
- - - -
- - - - - -
- - - -
- - - - - -
- - - -
- - - - - -
- - - -
- - - - - -
- - - -
- - - - - -

Date Amy- Alkali Gel Amylograph viscosity lnstron Crop analyzed Protein lose spread- consis- Length Width Water year (%) (%) ing tency Peak Set- Consis- Hard- Sticki- (mm) (mm) regime b
(mo) (yr) value (mm) back tency ness ness (Bu) a (Bu) (Bu) (kg) (g-cm)
ADAN DARl ADAN KURA BAHAGIA BARU 3 BlAN SU BUNTAR B CHELOM DARI KARA 1 KERIBANG MAHSURI LINE 17 MENALAM MENSIA PADI BERIS PADI HITAM PADI ITAM RADlN JAMPURAK
SAMPANGAN B SERASAN PUTEH SERENDAH KUNING SlAM 29 SRI SARAWAK TERBAT A1
RU 369-7-2
ACHEH PUTEH ANAK NAGA 21
76 7 76 7.6 18.6 76 7 76 6.4 18.4 72 12 72 6.3 28.7 82 11 82 6.2 18.8 82 11 82 5.8 27.3 72 12 72 8.2 24.1 76 7 76 7.5 29.2 76 7 76 5.7 9.9 72 12 72 5.4 29.7 76 7 76 9.0 29.0 72 12 72 6.6 28.1 72 12 72 6.2 25.2 72 12 72 6.5 25.4 82 11 82 7.3 27.4 82 11 82 6.5 27.8 76 7 76 9.0 23.9 82 11 82 5.1 18.7 82 11 82 8.4 27.3 72 12 72 6.6 24.6 72 12 72 7.1 24.1 72 12 72 6.3 28.9 72 12 72 6.3 29.3 76 7 76 14.2 23.0 82 11 82 6.1 22.5
62 7 63 7.6 30.3 62 7 63 9.2 27.7
6.5 86 6.0 86 5.0 6.2 42 5.0 38 5.0 61 5.2 57 2.2 83 6.0 5.9 42 5.0 5.0 78 4.8 80 5.0 40 4.8 44 7.0 80 3.0 74 5.0 44 5.0 84 5.5 88 5.0 62 6.0 4.2 29 5.3 68
MALAYSIA, WEST
5.0 - 750 5.0 - 700
4.7 6.1
6.9 6.6
4.3 7.0
6.0
450 640 260 460
- - - - - - - I - - - - - - - I - - - - - - - I - - - - - - - - - - - - - - - - - - - I - - - - - - - I - - - - - - - I - - - - - - - I - - - - - - - I - - - - - - - I - - - - - - - I - - - - - - - I - - - - - - - - - - - - - - - - - - - I - - - - - - - - - - - - - - - - - - - I - - - - - - - I - - - - - - - I - - - - - - - I - - - - - - - I - - - - - -
-
-
-
-
- -
- - - I - - - I

BAHAGIA (lR5-278) BAHAGIA (lR5-278) BETAS BERUYAMI,
BASMATI CHINA NO.1 CHINA NO.2 GLUTINOUS RICE IMPROVED MAHSURI JAYA KADARIA (MR27) KADARIA (MR27) KODAH NO.1 MAHSURI MAHSURI MAHSURI (MUTANT) MAHSURI MUTANT MAKMUR (MR73) MALINJA MALINJA MANIK (MR52) MR81 MR84 MR88 MUDA (MR71) MURNI PULUT MALAYSIA SATU PULUT SIDING (MR47) PULUT SIDING (MR47,
PULOT SIDING) RADIN EBOS 33 RIA (IR8) RIA (IR8)
SEBERANG (MR77) SEKEMBANG (MR10) SEKENCANG (MR7)
RIA163 (163-2-3-6-9-10)
71 10 71 7.2 77 6 77 6.6 67 - 67 8.0
67 - 67 7.7 67 - 67 9.3 67 - 67 7.0 80 9 81 6.8 77 6 77 8.0 80 9 81 7.4 86 6 86 7.1 67 - 67 5.7 71 10 71 10.9 77 6 77 6.8 88 6 89 5.8 86 6 86 5.7 86 6 86 6.9 71 10 71 6.5 77 6 77 6.8 86 6 86 6.6 88 6 89 6.5 86 6 86 6.9 88 6 89 7.3 86 6 86 6.0 77 6 77 6.6 77 6 77 7.7 80 9 81 8.2 86 6 86 6.6
62 7 63 6.4 71 12 71 77 6 77 6.3 71 12 71 86 6 86 7.6 80 9 81 8.7 77 6 77 6.2
28.9 3.8 28.4 3.4 25.4 5.3
28.5 6.1 29.0 5.1 24.0 6.3 25.4 4.8 23.0 2.0 27.3 5.0 28.2 3.1 28.1 5.0 26.6 3.5 27.0 2.7 29.0 5.0 30.9 4.9 24.4 7.0 28.4 3.8 26.6 5.0 27.4 7.0 29.8 5.0 29.8 7.0 30.6 7.0
53 100
71
53 65
45 100
81 60
42 70 39 54 50 72 96 69 33 82 74 40
100 100 100
98
33 52 77 53 58 99
365
I I I
I I I
7.3 I I
7.9 - 5.6 2.0 I 9.1 - 5.8 2.1 I
I 7.8 52 I
- 5.1 2.0 I 9.8 - 6.5 1.8 9.0 - 6.5 2.0 I 8.4 - 6.6 2.0 I
I I
10.3 - 6.8 2.0 I 9.4 - 5.9 2.0 9.5 - 6.6 2.2 I 9.9 - 6.5 1.9 9.7 - 7.2 2.1 I
I I
3.4 - 6.9 2.0 I 5.1 - 7.2 2.0 I
I I I I
9.1 - 6.4 2.1 I 8.3 - 5.9 2.0 I
- 6.5 2.0 I
860 120
630 315 310
440 590 320 440 430
820 855
1145
320 40
-200
655 980 420 360 795
415 170 335 380 285 27.2 7.0
28.0 3.0 3.0 6.0 - 7.0 -.8 6.1
30.4 5.0 30.6 7.0 28.6 7.0 30.1 7.0 29.8 4.7 27.8 7.0 22.8 2.0
485 560
890
-205 -280
245
75 35
500
330 880 55
-
-
- - - - - -
- - - - - - - - -
-
- - -
- - -
- - -
- - -
- - - - - -
- - - - - -
- -
-
-
- - - - -
- -
- - -
- - -
- -
- -
- -
- -
- -
- -
- -
- -
- -
- -
- - - -
-
- - - -
- - - -
- - - -
- - - - - -
- - - - - - - - - - - -
- - - - - -
- - - - - -
- - - -
- - -
- -

SEKENCANG (MR7) SERAUP 50 SERENDAH KUNING 60 SERIBU GANTANG SETANJUNG (MR1) SlAM SlAM 48 SRI MALAYSIA DUA SRI MALAYSIA II SRI MALAYSIA SATU
BAMOA A75 (lR837-46-2) BLUEBONNET 50 CAMPECHE A72 CAMPECHE A80 CARDENAS A80 CHAMPOTON A79 CHETUMAL A86 GRIJALVA A71 JOACHIN A74 JOJUTLA MEJORADO JUCHITAN A74 MACUSPANA A75 MORELOS A70 MORELOS A83 MORELOS A88 NAVOLATO A71 (IR22) NAVOLATO A71 (IR22)
Date Crop analyzed year
(mo) (yr)
80 9 81 62 7 63 62 7 63 80 9 81 80 9 81
62 7 63 77 6 77 80 9 81 77 6 77
67 - 67
78 5 79 70 1 72 71 1 72 78 5 79 78 5 79 78 5 79 90 2 91 78 5 79 78 5 79 78 5 79 78 5 79 78 5 79 78 5 79 90 2 91 90 2 91 71 1 72 78 5 79
Amy- Alkali Gel Amylograph viscosity lnstron Protein lose spread- consis-
(%) (%) ing tency Peak Set- Consis- Hard- Sticki- value (mm) back tency ness ness
(Bu) a (Bu) (Bu) (kg) (g-cm)
7.5 23.5 3.0 81 - - - 6.9 8.0 30.1 5.0 - 710 280 420 8.6 28.8 5.4 - 860 240 510 7.9 28.1 4.9 81 880 345 585 7.3 8.6 28.0 7.0 44 780 780 830 7.1 8.9 25.8 4.9 8.5 30.0 5.8 - 765 375 520 7.5 28.4 7.0 49 8.8 28.1 7.0 37 8.2 6.7 27.0 3.0 100
MEXICO
7.6 28.1 5.0 76 710 330 490 8.0 64 7.4 23.9 6.2 100 6.8 23.9 4.3 100 5.6 27.3 7.0 43 615 280 410 6.5 75
5.1 23.2 2.7 42 790 -180 190 6.2 102 6.3 22.8 2.8 60 840 -155 240 6.4 108
10.1 26.0 7.0 26 695 435 640 9.6 8.6 22.4 4.3 55 600 -85 170 6.0 122 5.8 17.3 4.3 74 885 -250 170 6.2 148 5.2 28.4 5.0 64 850 205 460 7.5 68 7.2 27.9 4.9 76 805 305 480 7.8 63
7.6 23.6 6.0 29 710 270 450 8.3 94 11.3 26.1 7.0 26 670 600 720 10.9
8.9 25.9 7.0 32 445 160 300 10.6 8.9 28.1 7.0 31 7.9 27.9 7.0 37 640 620 610 8.4 63
5.3 20.1 5.0 62 685 -60 200 6.6 131
Length Width Water (mm) (mm) regime b
6.4 2.1
5.7 2.1
6.6 2.1
6.7 2.1
6.4 2.1 7.3 2.1 6.6 1.9 6.8 2.0 6.9 2.3
6.4 1.9 7.2 2.6 6.8 2.3 7.4 2.6
6.2 2.0
- - - - - -
- - -
- - - -
- - - - - - - -
- - -
-
- - - - - - - - - - - - - - - - - -
I I I I I I I I I I
- - - - - - - -
- -
- -
- - - -
-
- -
- -
- - - - - - -
I I I U U U U U I I I U I I I I I

NAYARIT A72 PALIZADA A86 PAPALOAPAN A78 PIEDRAS NEGRAS A74
SAN LORENZO A72 SAN LORENZO A79 SINALOA A64 SINALOA A64 SINALOA A68
SINALOA A68
SINALOA A72 SINALOA A80 EX ClAT SINALOA A80 EX ClAT SURESTE A90 TABASCO A72 TANCASNEQUE A79 TRES RIOS A72 ZACATEPEC A79
(lR831-20-3-6)
(lR160-27-4)
(lR160-27-4)
BENGAWA(N) EX
BYAT C22 DAWEBYAN EKARINE EMATA
HONGKONG
HMAWBI-2 (lR21836-90-3)
INN-MA-YE-BAW KA THE NGA CHEIK KHAOPAPYU KHAUPHER-PHONE
71 1 72 6.4 90 2 91 10.5 78 5 79 5.8 78 5 79 5.7
71 1 72 7.0 78 5 79 6.8 70 1 72 7.5 78 5 79 7.2 70 1 72 8.0
78 5 79 9.6
88 6 88 89 6 89 6.8
78 5 79 5.5
78 5 79 5.4
71 1 72 7.5
90 2 91 7.7 71 1 72 6.4
71 1 72 6.4
65 8 66 9.1
84 12 85 6.0 82 9 a2 7.1 65 8 66 6.5 65 8 66 8.0 65 8 66 7.7 84 12 85 7.0
89 7 90 4.7 84 12 85 6.1 82 9 82 11.0 89 7 90 6.2
24.7 2.8
28.4 4.8 28.4 5.0
28.8 6.6 28.4 5.2
23.4 5.8
27.0 7.0
22.5 5.2
24.9 7.0
100 26 610 67 760 72 780
64 74 675
100 90 600 82
22.5 6.8 43 590
29.8 7.0 87
28.2 6.9 47 30.4 6.0 52
26.0 6.0 54 705 25.7 3.9 100
30.9 3.9 75 28.4 4.8 56 835
28.4 7.0 45 620
MYANMAR
27.6 5.0 48 1005
20.8 6.0 73 27.6 4.8 38
27.8 4.3 - 990
15.8 6.1 80
29.8 4.7 - 705
20.7 6.3 - 1120
19.3 7.0 61 695 5.4 7.0 86
4.6 6.8 61 16.6 6.7 58
755 295 295
335
120
260
-75
275
445
345
255 485
-180
-20
790
470 480
470
300
370
305
510
490
535
295 555 360
350
I 11.8 - 6.7 2.1 U
7.8 76 6.7 2.0 U 8.2 71 6.6 2.2 I
8.3 76 I - 6.7 2.1 I
I 7.6 83 6.2 1.8 I
- 6.7 2.4 I
8.0 76 6.7 2.4 I
I - 6.8 2.3 - 6.7 2.3
6.6 - 5.7 2.3 U I
I 7.0 102 6.6 2.1 I
8.1 69 I
I
I 6.4 - 6.6 2.2 U
I I I I
5.6 - 6.3 2.4 I
7.0 - 6.2 2.5 U 6.0 - 6.0 2.7
- - - - - - -
- - - - - -
- - - - - - -
- - - -
- - -
-
-
- - -
-
-
- - -
-
-
- - -
- - -
- - - - - -
- - - -
- - - -
- -
- -
- -
- - - -
-
- - -
-
- - -
-
- - -
- - - -
- - - -
- - - -
- - - -
- - - -
-

KYWE THWA KYWE THWA GYI
LOT THAW GYI MA NAW THU KHA MANAWHARI (MAHSURI) MEEDONE EX HONGKONG MI GAUK MYA YA NGA CHEIK NA MA THA LAY NGA CHEIK NGA CHEIK NGA CHEIK GYI NGA CHEIK PYU NGA KYWE (D25-4) NGA KYWE (D25-4) NGA KYWE (D25-4) NGA KYWE (D25-4) NGA KYWE (D25-4) NGA KYWE (D25-4) NGA KYWE (D25-4) NGA KYWE TAUNG PYAN NGA PYAG YI NGA SHINT THWE NGASEIN NGASEIN SMS NGWE TOE
PADINTHUMA PAW SAN BAY KYAR PAW SAN HMWAY
LONE-THWE-HMWE
PA LE THWE (PELITA I-1)
Date Crop analyzed year
(mo) (yr)
84 12 85 84 12 85 89 7 90 76 10 76 84 12 85 89 7 90 65 8 66 76 10 76 84 12 85 84 12 85 84 12 85 84 12 85 84 12 85 84 12 85 65 8 66 65 - 67 75 1 77 75 8 77 76 10 76
84 12 85 84 12 85 84 12 85 84 12 85 65 8 66 65 8 66 76 10 76 84 12 85 89 7 90 84 12 85 76 10 76
81 9 82
Amy- Alkali Gel Protein lose spread- consis-
(%) (%) ing tency value (mm)
6.8 6.3 7.0 63 7.0 5.4 7.0 80 6.4 15.3 7.0 68 5.6 23.8 6.0 60 6.9 24.1 5.1 56 7.1 28.1 6.2 26 6.2 20.6 4.7 5.3 29.2 5.0 57 7.6 18.7 7.0 38 8.1 19.7 4.0 36 6.8 6.5 6.1 71 5.1 5.4 6.0 80 5.9 20.8 7.0 33 6.8 5.3 6.0 85 7.2 22.8 5.4 9.6 22.3 7.0 7.1 25.0 6.0 51 7.2 23.0 5.3 59 6.8 24.3 5.9 70 7.3 21.7 5.7 40 5.7 22.2 6.0 42 7.9 20.0 5.1 38 6.3 23.5 5.0 37 7.0 6.0 6.0 62 7.4 27.8 5.0 7.0 28.8 5.2 6.0 28.6 3.9 36 7.0 21.8 5.0 71 5.5 29.9 6.0 26 6.4 21.0 5.9 39 7.5 24.5 5.9 64
Arnylograph viscosity lnstron
Peak Set- Consis- Hard- Sticki- back tency ness ness
(BU) a (Bu) (Bu) (kg) (g-cm)
890 1000
900
840
910 960
460 -180
-140
-90
160 140
745 315
250
280
445 470
4.4
9.6
5.2 82
10.5
Length Width Water (mm) (mm) regime b
7.1 2.1
5.1 2.1
5.2 2.8
7.0 2.3
- - - - - - - I - - - - - - - I - - - - - - - - - - I - - - - - - - I
- - - - I - - - - - - - I - - - - - - - I - - - - - - - I - - - - - - - I - - - - - - - I - - - - - - - I - - - - - - - I
- - - - I - - - - - - - I - - - - - - - I
- - I - - - - - - - I - - - - - - - - - - - - I - - - - - - - I - - - - - - - I - - - - - - - I
- - - - I - - - - I
- - - - - - - I - - - - - - - I - - - - - - - - - - - I - - - - - - - I
-
- -
- -
- -

PAW SAN HMWE SElN TALAY (C4-113/
YE-BAW-SEIN) SHWE CHE GYlN SHWE DIN GAR SHWE PA LIN SHWE TA SOKE
SHWEBO KHUN NI SHWEWATUN
SHWE-MAN (1)
SIN-EKARI (2) SIN-EKARI (3) SIN-THEIN-GI (BR 4) TAUNG DATE PAN TAUNG YOE NGA CHAKE WET SU PYU YAHINE YE BA ME YEBAW SElN ZEERA
84 84
76 76 84 84 89 76 89 89 89 89 76 84 84 65 84 76 65
ACCHAME MASINO 72 ANP JHUTTE 72 BAHARNI 72 BANS BARELLI 72 BASMATI 198 72 BASMATI 3 72 BASMATI JANAKPUR 72
BHALSARI 72 BlJLl BATTI 72 BRAMBUSI 72 CH45 76 CH45 78 CHAINUNG NATIVE 11 75
BG90-2 78
12 12
10 10 12 12
7 10
7 7 7 7
10 12 12
8 12 10
8
3 3 3 3 3 3 3 5 3 3 3 8 5 5
85 5.6 21.8 6.0 85 6.4 15.6 3.1
76 6.2 28.2 4.8 76 7.8 19.0 7.0 85 7.0 5.3 7.0 85 6.0 24.7 5.1 90 5.8 19.9 7.0 76 6.2 28.9 6.9 90 6.5 29.6 6.5 90 6.4 26.5 4.9 90 6.7 17.7 7.0 90 6.8 27.9 6.2 76 6.8 29.5 6.0 85 8.2 5.3 6.0 85 6.7 5.3 7.0 66 8.9 29.6 5.0 85 6.2 6.0 6.0 76 5.6 20.0 7.0 66 9.6 30.5 4.9
73 8.2 24.9 6.9 73 6.7 27.0 4.7 73 7.4 25.2 6.9 73 6.6 25.0 6.7 73 8.2 23.0 3.6 73 7.0 27.3 7.0 73 6.0 26.7 6.6 79 5.6 28.6 4.8 73 6.4 27.0 6.6 73 6.0 27.1 6.8 73 8.2 24.2 6.9
79 6.9 27.6 4.8 76 6.7 28.3 3.0
76 8.8 27.1 5.5
40 91
34 77 62 51 54 735 40 30 50 69 860 26 890 61 73 80
86 71
- 840
- 1060
NEPAL
68 28 29 61 28 26 27 50 930 43 27 66 30 1080 31 990 46
-75
-270 415
90
210
210
145 195
320
250 7 15
345
520
430
49 5 465
I I
I I I I
I 5.1 6.9 2.6
10.0 - 6.5 2.3 6.8 - 6.6 2.1 4.1 - 6.8 2.3 9.4 - 5.6 2.3
I I I I I I I
I I I I I I I
8.0 76 6.2 2.0 I I I I I
7.4 76 5.8 2.2 I I
- - - - - - - - - - - - - -
- - - - - - - - - - - - - - - - - - - - - - - - - - - -
- - - - - - - - - - - - -
- - - - - - - - - - - - - - - - - - - - -
- - - - - - - - - - - - - - - - - -
- - - -
- - - - - - - - - - - - - - - - - - - - - - - - - - - - - - - - - - -
- - - - - - - - - - - - - -
- - - - - - - - - - - - - -
- - - - - - - - - - -
- - - - - - -

Date Amy- Alkali Gel Amylograph viscosity lnstron Crop analyzed Protein lose spread- consis- Length Width Water year (%) (%) ing tency Peak Set- Consis- Hard- Sticki- (mm) (mm) regime b
(mo) (yr) value (mm) back tency ness ness (Bu) a (Bu) (Bu) (kg) (g-cm)
CHANDINA 78 5 79 6.1 29.0 4.7 88 CHIANUNG 242 75 5 76 6.3 19.6 7.0 64 CHIANUNG 242 78 5 79 6.1 20.1 7.0 86 CLAKET 27 75 5 76 8.2 19.0 7.0 70 GIZA 14 75 5 76 8.4 19.8 7.0 66 HANDIPHOOL 76 8 76 5.2 28.6 6.8 98 HANDIPHOOL 78 5 79 6.7 27.9 6.0 88 HANDIPHOOL 80 1 82 6.5 25.8 5.8 66 IET2938 78 5 79 5.5 16.0 6.0 80 lR2061-628-1 (LAXMI) 78 5 79 6.9 28.5 7.0 38 IR2071-124-6-4 (SABITRI) 78 5 79 7.2 27.4 6.0 30 JHALI 80 1 82 7.6 26.9 3.4 68 KALANIMAK 76 8 76 6.8 25.8 6.9 44 KANAKJIRA 76 8 76 8.4 27.2 3.8 38 KAOHSIUNG 41 75 5 76 6.3 18.9 7.0 80 KARIA KAMOD 72 3 73 7.4 25.1 7.0 29
KN-1B-361-8-6-9-2-8 75 5 76 6.7 28.1 7.0 45 KOUSHENG 75 5 76 6.8 19.9 7.0 73 KT31/1 75 5 76 8.9 22.6 7.0 56 KT31/4 75 5 76 6.0 24.3 7.0 35 KT32/2 75 5 76 6.0 17.2 4.0 84 MAKWANPUR MASINO 72 3 73 6.2 25.9 6.0 28 MAKWANPURI FINE 76 8 76 6.8 27.8 6.8 36 MALBHOG 72 3 73 6.9 26.3 6.8 36 NOKHI 80 1 82 6.7 26.3 3.6 68 PHUL KUMARI 72 3 73 5.6 26.7 6.0 29 POKHARALI MASHINO 78 5 79 6.7 20.0 7.0 42 POKHRELE HASHINA 75 5 76 8.4 18.7 7.0 46 SANJEERA 72 3 73 8.2 24.7 6.9 28
KN-1B-361-8-6-9-2-10 75 5 76 6.9 27.9 7.0 35
645
560
635 475
950 760 745
670 715
920
825
335
65
365 375
-280 630 620
210 340
290
-110
470 7.0 75 5.0 2.1
510 425 7.4 81 6.0 2.2
170 5.5 194 6.0 2.0
665 8.6 62 5.6 2.0
415 565
535
- 5.4 2.1
185 6.5 164 4.7 2.8
- 6.0 2.2
650 8.3 65 5.9 2.2
- 5.3 1.8
180 6.4 155 6.5 1.8
- - - - - - -
- - - - - - - - - - - - - -
- - - -
- - - - - - - - - - - -
- - - - - - - - - - - - - - - - - - - - - - - - - - - - - - - - - - - -
- - - - - - - - - - - - - - - - - - - - - - - - - - - - - - - - -
- - - -
- - - - - - - - - - - - - - -
- - - - - - - -
- - - - - -
I I I I I I I I I I I I I I I I I I I I I I I I I I I I I I
-

TAIPEI 306 TULSI PHUL
HUNGARIAN NO.1 NORIN N0.6 SHINSETSU TE PUKE GOLD
AGBEDE B TYPE X KUNTER
BEKOM BG79 (FAR01) BG79 (FAR01) BG79 X IR8 (FAR015) BG79 X IR8 (FAR015)
(FARO14)
BG90-2 (FAR029) BG90-2 (FAR029) BG90-2 (FAR029)
EX LIBERIA
D114 (FAR02) D114 (FAR02) D99 DE GAULLE (FAR024) E425 FARO27 (lR655-79-2)
FARO27 (lR655-79-2) FARO29 (BG90-2) FAROX 56/30 (FAR025) FAROX 56/30 (FAR025)
BPI-76 (BICOL) (FAR020)
FARO27 (lR655-79-2)
75 5 72 3
70 -
70 - 70 -
70 -
64 2 78 4
70 1 64 2 78 4 78 4 85 10 85 9 88 11 81 9
78 4 64 2 78 4 64 2 78 4 70 1 85 10 85 9 88 11 85 10 78 4 88 11
76 73
71 71 71 71
66 79
72 66 79 79 86 86 90 82
79 66 79 66 79 72 86 86 90 86 79 90
7.4 19.3 7.0 67 7.6 25.3 6.5 72
NEW ZEALAND
10.5 21.1 7.0 94
11.4 21.0 7.0 96 13.2 23.1 7.0 51
8.0 20.3 7.0
NlGERlA
6.5 21.8 5.6 - 1070 7.0 27.8 6.2 38
8.6 21.8 6.0 82 8.0 29.3 5.8 375
5.9 27.5 7.0 32 7.4 24.8 6.9 35 810
7.9 27.8 6.5 31 655 6.1 29.2 5.5 56
7.4 23.3 5.2 31 6.7 28.2 5.6 - 1080 8.4 27.5 6.8 32 8.1 27.4 6.1 - 770 6.3 27.5 5.1 44 8.4 18.8 3.0 100 8.8 24.8 7.0 31 795
8.9 27.7 7.0 28 650 7.4 25.1 5.8 32 960 6.8 22.4 5.9 63 720 9.2 22.9 6.1 36 780
6.2 28.0 6.2 73
- 26.4 6.2 32 945
- 26.8 7.0 33 895
-140
375
375 145 540
360
640
425 505 560
60 -140
60
320
365
385 390 650
585
630
510 625 690 270 200 430
12.0 11.7
9.4 6.8
13.5 13.3
9.0 9.5 6.4 6.7
I I
I I I I
I
I - 6.7 2.4 I
- 6.5 2.5 I 6.3 2.4 I
- 6.5 2.3 - 6.8 2.5
I
I
I - 6.4 2.2 I - 6.4 2.1 I - 6.8 2.4 - 6.5 2.5 I
104 6.7 2.6 I - 6.5 2.6
- -
- - - - -
- -
- -
- -
- - - -
- - - -
- - - -
-
- -
- - - - - -
- - -
- -
- -
- -
- - - - - -
- - - - - -
- - - - - -
- -
- -
- -
- -
- -
- -
- -
- -
- - - -
- - - - - - - -
- -
-
- -
- - - -
- -
- - - -
-
- - -
- - -
- - - -

Date Amy- Alkali Gel Amylograph viscosity lnstron Crop analyzed Protein lose spread- consis- Length Width Water year (%) (%) ing tency Peak Set- Consis- Hard- Sticki- (mm) (mm) regime b
(mo) (yr) value (mm) back tency ness ness (Bu) a (Bu) (Bu) (kg) (g-cm)
GEB 24/37 64 2 66 9.6 27.6 6.1 I.C.B. (FAR06) 78 4 79 8.1 28.0 6.2 36 INDO CHINE BLANC 64 2 66 8.6 28.0 6.0 IR20 (FAR019) 78 4 79 7.8 27.5 7.0 30
lR5-47-2 (FAR023) 78 4 79 6.2 27.8 6.0 88 lR627-1-31-4-3-7 78 4 79 7.1 27.4 6.9 30
(FAR022) lR8 (FAR013) 78 4 79 8.4 27.6 6.8 32 ITA123 85 10 86 10.0 24.3 5.9 40 ITA128 85 10 86 10.6 15.2 3.3 65 ITA135 88 11 90 7.1 16.4 3.0 88 ITA150 88 11 90 7.4 25.7 5.8 46 ITA212 85 10 86 5.8 26.2 4.8 48 ITA212 88 11 90 7.9 29.6 6.6 32 ITA222 85 10 86 6.9 26.0 6.0 41 ITA222 88 11 90 7.7 31.0 5.8 40 ITA257 88 11 90 8.5 20.0 3.7 65 ITA306 85 10 86 6.7 26.6 5.0 49 ITA307 88 11 90 8.4 13.2 3.3 76 KAV12 (FAR04) 64 2 66 7.0 27.3 6.3
KAV12 (FAR04) 78 4 79 6.4 28.3 6.9 32 MAKALIOKA 823 (FAR05) 78 4 79 6.8 27.8 5.4 68 MALI ONG (FAR07) 78 4 79 6.2 27.8 5.7 62
MAS2401 (FAR08) 64 2 66 7.8 28.7 6.1 MAS2401 (FAR08) 78 4 79 8.0 27.5 5.7 50 MAS2401 X B572 78 4 79 7.4 27.2 5.8 31
MAS2401 X TN 1 78 4 79 10.7 27.2 7.0 29
(lR790-35-5-3)
(FAR0X 147)
(FAR017)
980
945
940 765 660 830 725
1000 815 860 880 705
1015 930 960
920 640 785
420
185
435 335
-220 -255
-10 -60
520 60
430 -60 -60
210 500
560 235 475
550
415
645 430
40 230 350 250 710 320 685 300 270 275 585
550 435 590
I
I
7.6 67 I 11.8 - 6.8 2.1 I
8.2 - 6.8 2.5 I 4.6 - 7.4 2.6 6.6 - 7.7 2.8 8.8 - 6.6 2.1 I 9.4 - 7.3 2.3 8.8 - 6.8 2.2 I 9.3 - 6.7 2.4 5.1 - 6.9 2.7 9.2 - 6.9 2.1 I 3.7 6.7 2.7
5.5 2.0 I
- 6.6 2.4 I 6.0 83 I 8.1 54 6.9 2.2 I
-
- -
- - -
-
- - -
-
- - -
- - - - - -
- - - - - -
- - - - - -
- - - - - -
- -
- - -
-
- - - - - - -
-
- - - -
- - -
- - -
- - -
- - -
- - -
- - -

OFADA OS4 OS6 (FARO11) OS6 (FARO11) OS6 (FARO11) OS6 (FARO11) SIAM29 (FARO9) SlAM29 (FARO9) SINDANO (FARO10) SML 140/10 (FARO12) SML 140/10 (FARO12) TAICHUNG NATIVE 1
TJINA (FARO18) TJINA X IR8 (FAROX 166) TJINA X TN 1 (FARO16) TJINA//IR8 X IR8
(FAROX 1880) TJINA//IR8 X IR8
(FAROX 1880) TOMA112
(FARO21)
BARA BASMATI (DOKRI) BASMATI 198 BASMATI 198 BASMATI 198 BASMATI 370 BASMATI 370 BASMATI 370 BASMATI 370 BASMATI 370 BASMATI 370 BASMATI 370
71 1 72 8.0 25.1 6.5 70 1 72 8.2 16.1 2.0 70 1 72 8.0 21.3 6.0 78 4 79 7.5 22.9 6.0 85 10 86 10.3 19.6 6.0 88 11 90 6.1 24.1 6.0 64 2 66 7.2 24.2 6.4 78 4 79 6.5 28.0 6.0 78 4 79 8.0 27.9 5.9 78 4 79 6.3 25.3 5.2 85 10 86 7.9 24.0 4.2 78 4 79 8.9 27.8 6.9
78 4 79 7.6 22.6 5.3 78 4 79 7.4 27.5 6.2 78 4 79 7.5 27.1 6.9 78 4 79 7.7 23.4 7.0
78 4 79 7.7 23.5 6.2
63 2 66 7.2 28.3 6.1
76 8 76 8.4 24.8 6.9 80 12 81 6.5 21.8 4.7 76 8 76 6.8 25.1 7.0 79 2 80 7.6 22.4 7.0
63 4 66 9.4 25.7 4.3 65 4 66 7.9 22.2 5.9 65 4 66 8.2 22.7 6.9 70 4 71 7.6 20.9 3.2 70 4 71 7.5 22.7 4.0 76 8 76 7.0 23.8 6.1 79 2 80 7.5 22.4 6.3
84 - 85 - 24.2 7.0
72 100
68 68 720 31 680 42 830
- 995 32 32 50 810 40 740 30
58 730 36 740 32 46 835
51 895
- 755
PA KIS TA N
61 36 600 71 36 32
- 645 - 805 - 900
74 1010 50 750 56 36
260 195 455 615
355 215
6.7 2.5
6.8 2.6 7.0 2.7 6.3 2.2
-40 0
40 475
6.7 99 11.4
6.5
55 0
6.3 84 8.8
8.1 2.1 8.0 2.1
6.9 2.2 5.8 2.2
6.8 2.4
6.1 2.2
-120 430
220 550
6.8 116 8.0 56
145
85
450
445
420
550
7.8 95
7.0 85
150 375 2.6 6.4 1.8
6.3 1.8
6.3 1.8
8.0 15
400 -160 -365 125
230 515 230
85 345 8.0 51
- - - - - - - - - - - - - - - - - - -
- - - -
- - - - - - - - - - - - - - - -
- - - - - - - -
- - - - - - -
- - - -
- - - - - - - - - -
- - - - - - - - - - - - - - - -
- - - - - - - - - - - - - - - -
- - - - - - - - - - - - - -
I U I I I
I
I I
I I
I
I
I
I
I I I I I I I I I I
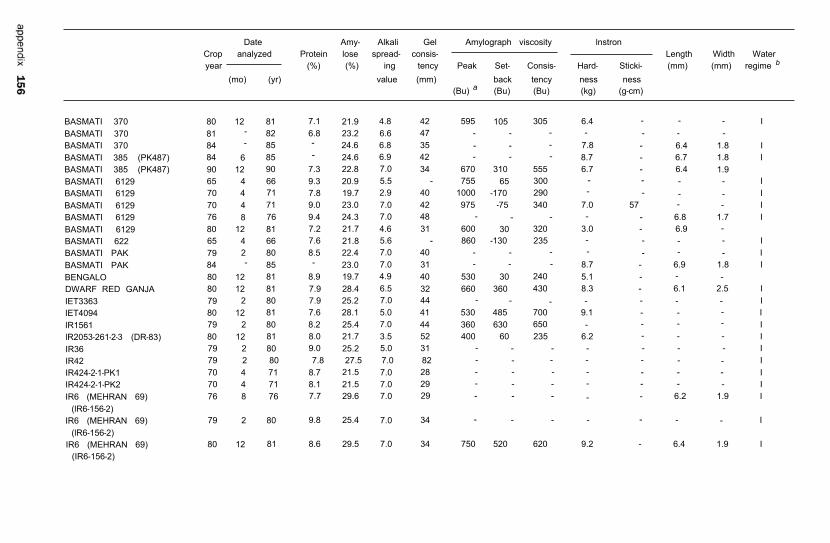
Date Amy- Alkali Gel Amylograph viscosity lnstron Crop analyzed Protein lose spread- consis- Length Width Water year (%) (%) ing tency Peak Set- Consis- Hard- Sticki- (mm) (mm) regime b
(mo) (yr) value (mm) back tency ness ness (Bu) a (Bu) (Bu) (kg) (g-cm)
BASMATI 370 BASMATI 370 BASMATI 370 BASMATI 385 (PK487) BASMATI 385 (PK487) BASMATI 6129 BASMATI 6129 BASMATI 6129 BASMATI 6129 BASMATI 6129 BASMATI 622 BASMATI PAK BASMATI PAK BENGALO DWARF RED GANJA IET3363 IET4094 IR1561
IR36 IR42
IR424-2-1-PK2 IR6 (MEHRAN 69)
IR6 (MEHRAN 69)
IR6 (MEHRAN 69)
lR2053-261-2-3 (DR-83)
IR424-2-1-PK1
(lR6-156-2)
(lR6-156-2)
80 12 81 7.1 21.9 4.8 42 595 81 - 82 6.8 23.2 6.6 47 84 - 85 - 24.6 6.8 35 84 6 85 - 24.6 6.9 42 90 12 90 7.3 22.8 7.0 34 670 65 4 66 9.3 20.9 5.5 - 755 70 4 71 7.8 19.7 2.9 40 1000 70 4 71 9.0 23.0 7.0 42 975 76 8 76 9.4 24.3 7.0 48 80 12 81 7.2 21.7 4.6 31 600 65 4 66 7.6 21.8 5.6 - 860 79 2 80 8.5 22.4 7.0 40 84 - 85 - 23.0 7.0 31 80 12 81 8.9 19.7 4.9 40 530 80 12 81 7.9 28.4 6.5 32 660 79 2 80 7.9 25.2 7.0 44 80 12 81 7.6 28.1 5.0 41 530 79 2 80 8.2 25.4 7.0 44 360 80 12 81 8.0 21.7 3.5 52 400 79 2 80 9.0 25.2 5.0 31
70 4 71 8.7 21.5 7.0 28 70 4 71 8.1 21.5 7.0 29 76 8 76 7.7 29.6 7.0 29
79 2 80 9.8 25.4 7.0 34
80 12 81 8.6 29.5 7.0 34 750
79 2 80 7.8 27.5 7.0 82
105
310 65
-170 -75
30 -130
30 360
485 630
60
520
305
555 300 290 340
320 235
240 430
700 650 235
620
6.4 I
7.8 - 6.4 1.8 I 8.7 - 6.7 1.8 I 6.7 - 6.4 1.9
I I
7.0 57 I - 6.8 1.7 I
3.0 - 6.9 I I
8.7 - 6.9 1.8 I 5.1 8.3 - 6.1 2.5 I
I 9.1 I
I 6.2 I
I I I I
- 6.2 1.9 I
I
9.2 - 6.4 1.9 I (IR6-156-2)
- - -
- - -
- - -
-
- -
- - - -
- -
- -
- -
- -
- -
- -
- -
-
- - - - - -
- -
- -
- -
- - -
- - - - - - -
- - -
- -
- -
- - - - - - -
- - - -
- - - -
- -
- - -
- - - - -
-
- - - - -
-
- - - - -
-
- - - - -
-

IR8 IR841 (lR841-36-2) JAJAI-77 JAPONICA JHONA 349 JHONA 369 KANGNI KANGNI 27 KANGNI X TOEH KS282 (BASMATI 370/
KS282 (IRRI 85 WS) MUSHKAN 41 PALMAN PALMAN 246 PALMAN 246 PERMAL PK1080 PK177 PK178 PK196 PK198 PK285 PK71 PK81 SlND BASMATI SONAHRI KANGNI SONAHRI SUGDARI SWAT PADDY
IR95)
ANAYANSI ex INGER ANAYANSI ex INGER
80 12 81 7.0 28.4 7.0 30 80 12 81 7.9 24.0 7.0 30 80 12 81 9.6 20.8 5.6 38 65 4 66 7.3 16.8 7.0 76 8 76 10.0 28.0 4.3 71 65 4 66 7.8 26.8 4.4 65 4 66 8.1 26.6 6.4 80 12 81 6.5 26.6 4.2 95 80 12 81 7.7 24.3 5.0 73 85 6 86 9.6 26.3 7.0 28
85 6 86 9.9 27.6 7.0 28 76 8 76 9.0 24.5 6.2 66 65 4 66 8.0 27.3 6.3 65 4 66 8.5 27.5 3.0 70 4 71 9.4 28.6 4.0 78 76 8 76 10.2 28.2 5.0 72 84 6 85 - 28.0 7.0 30 76 8 76 10.1 22.2 3.6 58 76 8 76 8.4 29.5 7.0 30 84 6 85 - 24.5 4.9 44 76 8 76 8.6 27.3 7.0 46 84 6 85 - 27.0 7.0 30 84 6 85 - 26.9 6.2 29 84 6 85 - 25.2 8.0 30 80 12 81 8.4 25.4 7.0 37 80 12 81 6.0 27.4 2.6 59 80 12 81 6.6 23.4 5.4 33 65 4 66 7.2 23.1 6.7
670 685 425 860
640 585 440 420
605 440
310 540 640 780
650 405 110
-240
430 140 265 100
670 570 280 180
560 325 410 150
135 315 580 580
310 430 475 600 -50 275 -30 270
PANAMA
88 6 88 - 29.2 6.2 32 89 6 89 6.2 28.9 7.0 36
8.9 9.2 7.6
7.8 5.9
11.1
8.5
10.1 9.4
11.9 9.2 8.1 5.1
- 6.1 2.4 I
- 6.1 1.8 I I I I I
- 7.0 2.0 I
- 6.5 2.1 I I I I I I
- 6.3 1.7 I I I
- 6.7 1.8 I I
- 7.0 1.8 I - 6.6 1.6 I - 6.6 1.9 I - 6.2 1.7 I
I
- 6.4 2.3 - 6.2 2.4
-
- -
- -
-
-
- -
- - - - - - - - - -
- - - - - - - - - - -
- - - - - - - - -
- -
-
- -
-
- -
- - - -
-
- - - - - -
- -
-
-
- -
- -
- -
- -
- - - - -
- - - - -
- - - - -
- - - - -
- -
- - -
- - - - -
- - - -
- -
- - -
- - -
- - -
- - -
- - -

Date Amy- Alkali Gel Amylograph viscosity lnstron Crop analyzed Protein lose spread- consis- Length Width Water year (%) (%) ing tency Peak Set- Consis- Hard- Sticki- (mm) (mm) regime b
(mo) (yr) value (mm) back tency ness ness (Bu) a (Bu) (Bu) (kg) (g-cm)
ADELAIDA BLUEBELLE CEA-1 CEA-2 CEA-3 CICA6 CICA8 IET4506 lR25909 lR9826 IRGA409 (BR-lRGA409) P2231F4 P3293F4 VISTA WILCKE 2
ALTO MAYO AMAZONAS BG90-2
CAROLINO CHANCAY (CICA 4) CHICLAYO
C-27
EAL-60
PARAGUAY
90 10 90 9.0 26.1 7.0 32 655 795 90 10 90 8.0 23.3 6.3 36 690 100 90 10 90 6.7 25.8 6.8 48 635 445 90 10 90 7.1 26.8 7.0 27 665 785 90 10 90 7.1 26.8 7.0 33 730 465 90 10 90 9.4 22.8 6.6 37 640 705 90 10 90 7.7 28.2 6.9 30 795 660 90 10 90 8.6 27.4 6.9 32 725 530 90 10 90 8.6 28.0 7.0 28 800 650 90 10 90 8.7 26.8 7.0 32 750 510 90 10 90 8.7 26.6 7.0 29 595 650 90 10 90 8.5 27.2 7.0 32 725 465 90 10 90 9.0 27.2 6.9 30 700 520
90 10 90 8.6 27.4 7.0 28 715 685 90 10 90 9.6 15.4 7.0 54 625 -90
775 435 625 795 650 950 790 690 790 670 690 650 670 220 770
PERU
90 12 90 8.9 24.0 7.0 48 90 12 90 9.4 17.6 7.0 54 90 12 90 7.1 28.1 7.0 46 67 12 67 5.9 21.1 7.0 79 10 79 7.7 25.4 6.0 50 79 10 79 9.3 28.1 6.2 34 67 12 67 10.8 27.2 5.7 67 12 67 5.4 21.9 6.5
370 580 820 820 705 745 890 870
335 165 660 10 25
415 360 -20
380 355 760 285 260 530 550 305
9.7 6.2 9.0
10.1 8.7 7.8 9.3 8.8 9.7 8.8 9.7 9.4 8.8 5.0 10.3
- 6.9 2.2 - 7.1 2.2 - 6.7 2.2 - 7.0 2.2 - 6.8 2.2 - 6.6 2.1 - 6.7 2.2 - 6.3 2.2 - 6.5 2.2 - 6.9 2.2 - 6.9 2.1 - 7.1 2.3 - 7.2 2.1 - 5.9 2.3 - 7.1 2.1
9.7 - 6.9 2.4 6.4 7.2 2.3
10.0 - 7.1 2.6 I
6.1 104 6.6 2.6 I 8.2 67 6.4 2.0 I
I I
-
- -
-
- -
- - -
- -
- -
- -

FMC-100-X5-60 FORTUNA FORTUNA HUALLAGA (lR442-2-50) INTI INTI EX INGER INTI EX INGER IR8 MlNABlR 2 MlNABlR 2 MINAGRA MINAGRA MEJORADO MOCHICA MOCHICA NAYLAMP (lR930-2-6) PERU 65 PERU 65 PNA1010-F4-64-1 PNA386-F4-341-1 PNA521-F4-90-3 PNA714-F4-304 PORVENIR RADIN CHINA SAN MARTIN SlAM GARDEN SlAM GARDEN VIFLOR
APOSTOL (ACC 5156) AUS12 AUS197 AZUCENA AZUCENA
67 12 67 67 12 67 79 10 79 79 10 79 79 10 79 88 6 88 89 6 89 79 10 79 67 12 67 79 10 79 79 10 79 67 12 67 67 12 67 78 10 79 79 10 79 67 12 67 90 12 90 90 12 90 90 12 90 90 12 90 90 12 90 90 12 90 79 10 79 90 12 90 67 12 67 79 10 79 90 12 90
86 4 87 81 5 82 81 5 82 62 7 63 63 - 64
5.1 19.2 2.7 6.8 25.2 4.7
10.4 22.1 6.0 48 6.9 28.7 6.1 42
10.2 15.3 7.0 83
6.5 18.8 7.0 76 8.5 28.1 7.0 31 5.9 20.8 6.0 8.4 16.2 4.8 86 8.4 29.0 6.6 32 6.5 31.3 6.1 95 5.7 20.0 7.0
8.0 28.6 7.0 36 6.6 26.8 5.4 90 8.1 25.6 7.0 64 8.5 26.2 7.0 26 8.2 24.9 7.0 32
9.1 16.8 7.0 65 8.4 23.8 6.6 54 7.6 27.9 7.0 35
6.2 27.6 5.7 6.8 29.1 6.8 33 8.9 17.4 7.0 80
- 16.4 7.0 83
6.7 19.0 7.0 84
8.3 17.5 7.0 82
8.0 21.7 7.0 62
1110 895 670 890 730
850 825 695 775 945 875 790 730 755 470 820 630 625 670 650 810 470
1120 845 755
-390 -105
-15 280
-145
440 -10 -60 240 415 -90 50
585 60
290 430 955 65 20
320 255 255 290 395 -25
200 285 210 530 170
620 285 190 420 600 255
610 320
325 430 540 985 340 300 525 450 350 605 560 305
PHlLlPPlNES
9.6 25.2 6.0 32 760 115 335 - 25.4 5.2 56 - 27.3 5.0 59
7.2 19.6 4.6 - 730 -90 270 13.3 21.6 5.0 - 740 25 325
7.8 7.4 6.9
7.8
7.6 8.4
8.0 9.2
8.0 9.4 9.6 5.7 6.1 8.6 7.6 7.0
8.8 5.7
8.0
113 81
160
69
114 85
128 51
73
67
I I
6.8 2.6 I 6.4 2.3 I 6.7 2.3 I 6.7 2.5 6.5 2.5 6.2 2.6 I
I 6.8 2.2 I 5.7 2.2 I
I I
5.3 2.4 I 6.8 2.2 I
I 6.9 2.3 6.9 2.5 7.3 2.4 7.4 2.4 6.9 2.4 7.5 2.2 5.3 2.4 I 6.5 2.5
I 6.0 2.1 I 7.7 2.5
4.9 2.5 I U U U U
- -
- -
- -
- -
- -
- -
-
- -
- -
- - - -
- -
- - -
- -
- -
- -
- - - - - - - -
- -
- - - - -
-
- -
- -
- -
- - - -
- - - - -
- - - -
- - - -
-
-
-

AZUCENA AZUCENA AZUCENA AZUCENA AZUCENA (ACC 328) AZUCENA (ACC 328)
BALUWADANG EX BANAWE BENGAWAN BENGAWAN BENGAWAN BENGAWAN BINAGSANG (ACC 52970) BINALASANG (ACC 44321) BINALASANG (ACC 52971) BINATO BINAYABAS (ACC 586) BINONDOK BINONDOK
B-E-3
BPI-121.407 BPI-121.407 BPI-121.407 BPI-3-2 BPI-3-2 BPI-76 BPI-76 BPI-76 BPI-76
Date Crop analyzed year
(mo) (yr)
63 - 63 68 6 69
86 4 87 86 4 87 86 9 87 62 7 63 89 12 89 62 7 63 63 - 63
72 8 72 86 9 87 86 4 87 86 9 87 62 7 63 86 4 87 66 - 67 67 - 67 72 8 72 73 - 74 78 8 78 78 10 78 86 10 86 62 7 63
63 - 63
81 - 82
63 - 64
63 - 64
63 - 63
Amy- Alkali Gel Protein lose spread- consis-
(%) (%) ing tency value (mm)
9.1 25.0 4.3 7.1 21.3 2.7 7.6 23.2 5.1 50 7.7 21.8 5.0 43
10.5 21.6 4.6 32 - 21.0 5.2 40
4.8 6.0 100 8.1 21.0 5.2
7.2 22.0 5.8 8.6 27.1 4.6
10.4 22.8 5.1 7.4 22.2 3.0
9.0 20.0 4.8 44 - 17.9 4.3 30
7.1 19.8 4.8 10.2 1.2 6.7 100 11.1 1.8 9.9 9.3 3.6 5.8 6.8 24.2 7.0 74 7.4 24.2 7.0 46 7.7 23.7 7.0 50 8.4 27.4 4.0 81 6.6 22.0 3.1 58 8.7 21.4 3.8
12.3 22.5 4.1 8.9 26.0 4.4
14.3 27.2 4.8
- 24.1 4.8 30
Amylograph viscosity
Peak Set- Consis- back tency
(BU) a (Bu) (Bu)
630 60 300 1020 -170 275
725 -135 180 800 -15 265 625 -200 110 720 20 350
660 10 315 590 55 195 785 -105 235
910 -110 220 825 -245 150 730 -260 85 810 -140 280 470 -140 15 200 25 45 190 100 60
335 135 800 -55 255 780 -270 100 830 -160 240 755 -40 285 820 -100 300 680 -20 285
lnstron
Hard- Sticki- ness ness (kg) (g-cm)
8.5 8.2 9.3
9.4 6.5
6.4
6.6 5.8 83 6.2
Length Width Water (mm) (mm) regime b
7.2 2.2 5.9 2.0 5.4 1.8
6.1 3.1
4.9 1.7
5.7 2.3
6.5 2.2 5.4 2.0 5.9 2.1
- -
- - - - - - - -
- - - - - - - - - -
- - - - - - - - - -
- - - - - - - - - - - - - - - - - - - - - -
- - - - - -
- - - - - - -
- - - - - -
- - - - - - - - - - - - - - - - - - - - -
- - - - - - - - - - - - - - - - - - - - -
U U U U U U I U I I I I U I U I I I I I I I I I I I I I
-
-

BPI-76 (NS) BPI-76 (NS) BPI-76-1 BPI-76-1
BPI-Ri-1 BPI-Ri-10 BPI-Ri-2 RPI-Ri-3 BPI-Ri-4 BPI-Ri-4 C12 C12 C131-129
BPI-76-1
C168 C168-134 C18 C18 C22 C22 C4-113 C4-137 C4-137
C4137 C4-137
C4-63 C4-63G C4-63G C463G C4-63G C4-63G C4-63G C4-63G C4-63G C4-63G
68 6 69 8.6 86 10 86 7.5 72 8 72 8.1 73 - 74 8.7 77 - 78 9.7 86 10 86 6.7 86 10 86 7.5 86 10 86 7.4 86 10 86 6.8
86 10 86 6.5 78 10 78 6.4
72 8 72 7.2 77 - 78 8.2
77 - 78 7.3 88 7 88 9.0 67 - 67 8.3 72 8 72 7.4 77 - 78 8.8 88 7 88 9.8
72 8 72 6.7
88 7 88 10.2
72 8 72 6.0
73 - 74 7.8
73 - 73 7.6
67 - 67 7.4
73 - 74 7.7 77 - 78 10.2
68 6 69 7.3
73 - 73 7.3
73 - 74 7.3 73 - 74 9.0 74 - 74 7.6 77 - 78 7.2 78 8 78 8.0 80 - 81 6.4
22.4 2.9
25.1 3.2 24.4 4.3
-.9 6.0 21.4 3.0 25.3 5.0
29.3 6.9 23.2 4.9 24.1 2.4 23.5 4.2 26.1 7.0 22.6 4.3
21.8 3.3
28.2 5.0
-.9 6.0
20.8 4.6 28.0 4.1 25.1 2.8 27.9 5.0 26.4 5.0 29.5 3.0
26.0 3.1 27.9 5.2 26.3 4.6 23.2 2.3 26.6 2.6 21.7 2.7 20.2 3.2 21.7 3.7 22.2 4.0 20.4 3.1
23.7 3.8
28.0 3.0
22.5 2.8
24.4 3.8
67 49 40 99
100 79 29
32 64
86 47
45
98
84
72 30
77 100
28
72 79 72 36 92 99
66 87
915 800 855
600 830 815
855 460
645
865
850 685
1005
760 960
820 895 830
1050
760 605
-145
-130 -300
-195 -325
40
515 15
-145
-115
-150 -215 205
80
3235
450
200 70
-210
-355 1
-285
260 150 260
5 95
215 50
670 230
250
235 155 450
280 660
495 415 320 300
265 270
170
I 6.1 5.7 2.1 I
I I
6.4 64 5.7 2.2 I 5.9 - 5.9 2 .5 I 6.7 - 6.3 2.1 I 7.6 - 5.5 2.1 I 5.2 - 6.0 2.5 I
7.6 - 6.1 2.2 I I
5.6 93 5.8 2.1 I I
5.8 97 I
I I
7.6 53 6.0 2.2 I 9.4 - 6.2 2.3 I
I I I
7.6 56 6.4 2.2 I
I I I I I I I
8.3 59 6.2 2.1 I
7.8 - 6.7 2.2 I
9.8 - 6.9 2.2 I
6.0 85 6.5 2.2 I
6.2 - 6.7 2.2 I 4.8 - 6.9 2.5 I
- -
- -
- -
- -
-
-
- -
-
-
-
-
-
- - - -
-
- -
- -
- -
-
- -
-
- - -
- -
- -
-
-
- -
- -
- - -
- -
-
- - -
- -
-
- - -
- - - -
- -
-
- -
-
- -
- -
- -
- -
- - -
- - -
- - -
- - -
- - - - - - -
- - - - - - -
- - - - - - -
- - - - - - -
-

Date Amy- Alkali Gel Amylograph viscosity lnstron Crop analyzed Protein lose spread- consis- Length Width Water year (%) (%) ing tency Peak Set- Consis- Hard- Sticki- (mm) (mm) regime b
(mo) (yr) value (mm) back tency ness ness (Bu) a (Bu) (Bu) (kg) (g-cm)
C4-63G CAMOROS (ACC 47446) CARREON CARREON (ACC 38703) CNA4120 CNA4136 DARAGADONG EX
MARAWI CITY DB-4 DINALAGA DINALAGA DINORADO DINORADO DINORADO (ACC 30333) ELON-ELON (ACC 5193) FB-121 FB-121 FB-121 GALLIANO (ACC 47209) GUINANGANG (ACC 5994) GUMALENGON EX BANAWE HINOMAY (ACC 47222) INGUIWE EX BANAWE INILANG ILANG
INTAN INTAN INTAN INTAN
INILANG-ILANG
89 7 89 7.4 20.4 4.6 48 87 11 87 6.9 24.4 5.0 40 81 5 82 - 25.4 5.1 66 86 4 87 10.6 23.0 5.0 47 86 4 87 8.6 13.7 3.0 53 86 4 87 9.0 20.2 3.0 41 89 1 90 8.3 16.7 4.0 50
67 - 67 9.1 26.1 3.2 62 7 63 6.7 17.2 5.6 68 6 69 6.7 24.8 2.9 86 9 87 - 20.6 4.6 36 86 4 87 10.4 18.9 5.0 34 87 11 87 9.7 21.9 4.9 36 86 4 87 10.3 25.2 6.0 28 62 7 63 8.0 21.9 4.9 62 - 63 8.9 25.2 4.6 62 - 63 9.1 26.0 4.6 87 9 87 - 25.2 5.0 30 86 4 87 11.4 24.2 6.2 28 89 12 89 - 2.9 6.0 100 87 11 87 7.4 27.6 5.0 78 89 12 89 - 3.0 6.0 100
86 4 87 11.5 1.9 3.1 100 62 7 63 7.2 20.9 4.9 63 - 64 10.8 23.0 5.0 68 - 74 7.2 21.2 5.7 54 72 8 72 6.0 23.8 2.9
64 -
710
640 705 720 760
680 840 985 7 10 615
860 665 585 575 945 840
690 715 800
-140
185 -150 -125 -225
-25 -90
-125 -230
-40
1 1
35 45
-60 140
-200 -55 -45
280
330 180 215 185
270 330 305 130 205
295 305 280 255 245 360
15 295 325
5.6 7.9
11.1 7.8 7.5 4.6
8.2 10.8
7.8 8.2
10.0 10.6
8.4
7.8
- 6.3 2.0 - 5.7 2.6
- 5.1 2.5 - 6.9 2.3 - 6.4 2.4 - 5.2 2.2
- 4.2 1.7 - 5.6 2.2 - 4.8 2.1 - 5.7 2.2
- 5.6 3.0 - 5.8 2.0 - 5.7 3.1
- 5.6 2.8
- - - - - - - -
- - -
- - -
- - - - - - - - -
- - -
- - -
- - - - - - - - - - - - - - -
- - -
- - - - - - - - - - - -
- - - - - - - - - - - - - - -
- -
- - - - - - - -
- - -
64 - - 3.2 -
- -
-
I U U I U U
I U U U U U I I I I U I U U U I I I I I I

IR20 IR20 IR20 IR20 IR20 IR20 IR20 IR20 IR20 IR22 IR22 IR22 IR22 IR22 IR22 IR22 IR24 IR24 IR24 IR24 IR24 IR24 IR26 IR26 IR26 IR26 IR26 IR28 IR28 IR28 IR29 IR29 IR29 IR29 IR30 IR30 IR30
72 8 72 7.3 73 - 74 8.2 73 - 74 6.8 74 - 74 7.5 77 8 77 8.7 77 2 78 8.5 87 7 87 6.9 88 5 89 9.7 89 9 89 8.2
72 8 72 8.1 71 - 74 6.8
73 - 74 9.2 73 - 74 9.2 73 - 74 9.4 76 2 77 7.3 87 7 87 7.3 72 8 72 7.1 73 - 74 7.6 73 - 74 9.8 74 - 74 6.6 76 2 77 9.0
73 - 74 8.2 74 - 74 6.2
87 7 87 6.5
77 8 77 8.3 77 2 78 8.3 87 7 87 6.5
76 2 77 8.4 87 7 87 7.3 76 2 77 8.0 77 8 77 7.8
76 8 76 8.6
87 7 87 6.8 89 10 90 7.6 76 2 77 7.6 77 8 77 6.9 87 7 87 7.3
28.4 3.6 25.4 4.8 25.4 5.2 25.6 4.2 24.6 4.0 27.4 5.0 26.4 3.0 26.6 5.9 24.9 6.1 26.0 7.0 29.1 7.0 25.7 7.0 25.7 7.0 27.2 7.0 28.9 7.0 26.6 7.0 18.8 6.9 14.2 7.0 15.4 7.0 14.6 6.7 14.6 7.0 15.7 6.6
27.1 7.0 25.5 7.0
25.3 7.0
27.8 7.0
28.4 7.0
28.5 7.0 28.3 7.0 25.4 7.0
- 6.2 - 6.8
2.7 6.0 2.0 6.0
25.6 3.5 25.7 4.7 24.4 3.0
38 32 62 55 56 26 27 28 28
30 30 31 42 27
82 46 98 88 81 31 80 56 60 45 30 33 26 99
100 100 89 88 50 54
800 935
870 760
890
630
590
635 865
1000 500 795
510
610
365 660
620
235 85
410 330
350
540
790
-95 -285
-330 400 295
540
840
95 -60
425
440 350
610 580
440
510
740
150 130
260 440 480
620
820
100 110
615
I I I I I I
9.4 I
I I I I I I
10.4 - 6.3 2.0 I I I I I I
7.1 - 6.4 2.1 I I I I I
9.2 - 5.6 2.2 I I I
12.2 - 6.6 2.0 I I I
7.7 - 5.8 2.0 I 2.0 58 6.6 2.1 I
I I
10.4 - 5.8 2.3 I
8.8 - 5.4 2.1 I
8.2 I
- - - - - - - - - - - - - - -
- - - - - - - -
- - - - - - - - - - - - - -
- - - - - - -
- - - - - - - - - - - - - - - - - - - - - -
- - - - - - - - - - -
- - - - - - - - - - - - - - -
- - - - - - - -
- - - - - - -
- - - - - - - -
- - - - - - - - - - - - - -
- - - - - - - - - - - - - -
- - - - - - - - - - -
- - - - - - - - - - - - - - - - -

Date Amy- Alkali Gel Amylograph viscosity lnstron Crop analyzed Protein lose spread- consis- Length Width Water year (%) (%) ing tency Peak Set- Consis- Hard- Sticki- (mm) (mm) regime b
(mo) (yr) value (mm) back tency ness ness (Bu) a (Bu) (Bu) (kg) (g-cm)
IR32 IR32 IR32 I R34 IR34 IR34 IR36 IR36 IR36 IR36 IR36 IR36 IR38 IR38 IR38 IR40 IR40 IR40 IR42 IR42 IR42 I R42 IR42 IR42 IR42 I R43 I R44 IR45 IR46 I R46
77 8 77 8.9 24.7 5.0 100 77 2 78 10.0 27.6 5.8 100 87 7 87 6.5 24.8 5.5 85 590 76 8 76 7.1 28.6 7.0 46 76 2 77 8.2 26.5 7.0 38 87 7 87 6.0 25.9 7.0 26 740 77 8 77 8.4 25.0 4.0 51 77 2 78 7.7 27.8 5.0 65 80 - 81 10.0 26.3 5.0 32 87 7 87 8.2 25.4 3.8 38 790
89 9 89 8.2 25.0 6.0 30 88 5 89 7.3 28.0 4.6 29 855
77 8 77 7.2 26.0 5.0 80 77 2 78 8.1 27.7 5.2 100 87 7 87 6.3 26.0 4.8 48 850 76 5 77 7.2 26.8 4.7 60 77 8 77 7.4 25.8 4.7 52
77 8 77 8.6 24.8 7.0 30 77 2 78 7.4 28.4 7.0 40
87 7 87 7.2 26.0 4.2 26 820
80 - 81 8.8 27.9 7.0 28 87 7 87 6.3 25.8 7.0 27 680 87 5 88 8.9 25.0 7.0 27 88 5 89 7.4 26.8 7.0 89 9 89 7.4 24.9 7.0 26 87 7 87 6.6 16.6 6.2 76 890 87 7 87 6.6 25.6 6.5 35 790
87 7 87 6.6 26.4 4.9 95 550 89 9 89 7.5 26.0 5.0 93
87 7 87 6.3 25.5 6.9 38 690
530
640
170 255
345
480
720
695
-270 480 660 260
630
7 50
370 600
565
670
770
850
250 640 720 450
11.5
9.3
6.4 8.5 9.9 7.7
9.3
9.0
7.8 9.5 9.7 9.9 9.2 7.6 9.0 8.2 6.6 8.4
I I
- 5.7 2.1 I I I
- 6.3 2.1 I I I
- 6.7 2.0 I - 6.3 2.0 I
I I I I
- 6.0 2.1 I I I
- 5.6 2.0 I I I
5.7 2.2 I 5.7 2.0 I 5.8 2.0 I
26 755 I I
- 6.3 2.2 U - 6.1 2.1 I - 5.1 2.0 U - 6.0 2.0 I
I
- - - - - - - - - - - - - -
- - - - - - - - - - - - - -
- - - - - - - - - - - - - - - - -
- - - - - - - - -
- - - - - - - - - - - - - -
- - - - - - - - - - - - - -
- - - - - - - - - - - - - - - - - -
- - - - -
- - - - - - - - -
- - - - - -

IR48 IR5 IR5 IR5 IR5 IR5 IR5 IR5 IR5 IR50 IR50 IR50 IR50 IR50 IR52 IR54 IR54 IR56 IR58 IR60 IR62 IR64 IR64 IR64 IR64 IR65 IR66 IR66 IR68 IR68 IR68 IR68 IR70 IR70 IR72 IR72 IR72
87 7 68 6 72 8 73 - 73 73 74 2 76 2 87 7 87 7 87 5 88 5 88 9 89 9 87 7 87 7 87 5 87 7 87 7 87 7 87 7 87 7 87 5 88 5 89 9 87 7 88 8 88 9 88 8 88 5 88 9 89 9 88 8 88 9 87 4 87 5 88 5
87 69 72 73 74 74 74 77 87 87 88 89 88 89 87 87 88 87 87 87 87 87 88 89 89 87 88 88 88 89 88 89 88 88 88 88 89
6.5 6.7 6.6 6.2 8.8 7.0 6.7 6.1 6.1 7.2 9.4 7.1 9.8 9.1 6.6 6.5
22.4 7.0 27.2 2.2 28.4 3.0 29.8 3.2 27.6 3.9 26.2 4.2 26.5 4.4 30.0 3.0 26.0 4.9 27.0 4.8 27.3 5.0 29.4 5.4 27.3 5.0 26.3 5.8 26.2 7.0 25.8 4.0 26.0 5.0 26.0 7.0 25.6 6.8 26.2 7.0 27.6 4.3 21.4 3.4 20.3 3.2 23.6 3.0 22.0 5.5
2.6 6.0 27.8 5.0 27.8 5.0 27.6 7.0 27.9 7.0 27.6 7.0 26.8 7.0 25.2 6.0 25.2 6.0 26.8 5.0 26.8 5.0 29.2 5.0
49
100 91 71 86 76 90 40 41 28 31 31 33 33 28 32 26 42 75 76 70 46 51
100 89 89 27 27 27 29 29 29 50 50 54
7 10 7 40
80 170
400 395
380 310
370 620
8.1 6.6 2.2 I I I I I I I I
- 5.2 2.4 I - 6.1 2.0 I - 6.3 1.9 I
I - 6.4 1.9 I
I - 6.4 2.0 I - 6.2 2.0 I
6.2 2.0 I - 6.5 2.0 I
5.7 2.1 I - 6.0 2.0 I - 6.0 2.2 I - 6.6 2.0 I - 7.0 2.1 I - 7.0 2.1 I
I - 6.3 1.9 I - 6.4 2.0 I - 6.4 2.0 I - 7.7 2.1 I
I - 7.7 2.1 I
I - 6.1 2.1 I
6.1 2.2 I - 6.5 2.0 I
6.6 2.0 I I
580 510
225 175
490 750
860
200 460
8.1 10.1 10.3
9.5 9.8 8.9 9.4 9.3 8.9 9.4
10.1 9.0 9.2 6.6 6.0 6.0 6.1 6.7 8.9 8.9
10.3 10.6 10.3
9.7 9.2 9.2 8.5 8.5 8.8
405 680
490 910
520 410
420 670 400 250
-190
560 650
600 800 440 450 290
265
80 460
805 620
630
315
540
7.3 7.5 660
810 320 590 830
8.4 8.2 7.1 6.6 8.2 7.0 8.2 7.1 9.2 9.2 7.9
10.5 7.9 7.4 9.1 9.1 7.6 7.6 7.6
725 -140
650 535
-180 265
690 510
735 520
680 470
680 105
330 585
- -
- - -
-
- -
- -
- - -
- - - - - -
- - -
- - -
- - - - - -
- - -
- - -
- - -
- -
- -
- -
- - -
- - - - - -
-
-
- - -
- - -
-
-
- -
- -
- - -
- - - -
- -
- -
- - - - - -
- - - - - - -
- - - - - - -

Date Amy- Alkali Gel Amylograph viscosity lnstron Crop analyzed Protein lose spread- consis- Length Width Water year (%) (%) ing tency Peak Set- Consis- Hard- Sticki- (mm) (mm) regime b
(mo) (yr) value (mm) back tency ness ness (Bu) a (Bu) (Bu) (kg) (g-cm)
IR72 IR72 IR74 IR74 IR74 IR74 IR74
IR8 IR8 I R8 IR8 IR8 IR8 IR8 I R8 I R8 IR8 IR8 IR8 lR841-67-1 IRAT104 IRAT9 KALANA (RED) EX MARAWI
CITY KHAO DAWK MALI 105 KINANDANG PATONG KINANDANG PATONG KINANDANG PATONG
IR8
KURIKIT PUTI (ACC 26882)
88 9 88 10.6 26.6 5.8 50 89 9 89 9.1 25.0 5.1 49 87 4 88 9.1 24.5 7.0 28 87 5 88 9.1 24.5 7.0 28
88 9 88 7.9 26.2 7.0 27 88 5 89 9.8 26.2 7.0 26
89 9 89 6.8 24.4 7.0 27 68 6 69 6.6 31.7 7.0 68 6 69 6.4 33.0 7.0 72 8 72 6.8 28.0 7.0 72 - 74 8.5 24.0 7.0 26
73 - 74 7.8 25.5 7.0 35 73 - 74 8.0 29.4 7.0 29
77 8 77 7.1 24.9 7.0 34 77 2 78 7.3 27.7 7.0 42 87 7 87 7.3 26.5 7.0 27 88 5 89 7.0 26.8 7.0 26 89 9 89 7.0 24.0 7.0 27
73 - 73 6.6 28.3 7.0 40
74 - 74 7.5 26.5 7.0 31
80 - 81 9.3 15.1 7.0 74 86 4 87 6.8 13.4 3.0 72 81 5 82 - 27.7 7.0 32 89 1 90 8.3 29.6 7.0 31
86 4 87 8.3 16.6 7.0 59 81 8 82 - 22.2 5.2 37 82 8 82 - 22.4 5.1 54 86 4 87 7.8 20.6 5.0 31 86 4 87 11.8 20.4 5.4 32
510
765
9.1 - 6.7 2.2 I 8.6 I 9.4 - 7.0 2.0 I 8.4 - 7.2 2.1 I
10.8 I 9.6 - 7.1 2.0 I 9.7 I
I I I I I I I
6.8 68 I I I
9.9 - 5.9 2.4 I
9.4 I 5.6 6.9
- 7.0 2.2 I - 6.3 2.8 U
U
9.8 I
10.8 - 6.5 2.3
7.7 - 7.6 2.1 D 6.3 U 5.8 U 8.0 - 4.4 2.6 U 8.1 - 5.9 1.6 I
815 375
750 625
640 585
545
1080 1060
730
780 725
600
710 785
495 -85
550 260
770 670
640 480
750 675
840
780
835
-285
470
-330
165
675
100
640 620
-40 0
250 220
- - - - - - - - -
- - - - - -
- - - - - - - - -
- - - - - - - - - - - - - - - - - -
- - - - - - - - - - - - - - - - - -
- - - - - -
- - - - - - - - - - - - - -
- - - - - - - - -
- - -
- - - - - - -
- - - - - - - - - - - -

LEB MUE NAHNG Ill 81 5 82 LUBANG (ACC 598) M527-9
87 11 87 8.0 26.0 5.0 31 67 - 67 9.1 28.5 4.4
MAGSANAYA(ACC 725) 86 4 87 10.5 20.2 5.9 36 MAGUINSALAY (ACC 303) 86 4 87 11.5 23.1 6.0 28 MAKALPO (RED) EX MARAWI 89 1 90 7.3 26.0 7.0 38
MAKAPILAY-PUSA (ACC 606) 86 4 87 11.1 1.6 6.0 99 MAKILING (PSBRc1) MALAGKIT (ACC 2060)
90 6 91 9.3 23.2 5.0 45
MALAGKIT SUNGSONG 62 7 63 6.8 5.0 6.0 MALAGKIT SUNGSONG 62 - 63 8.2 4.5 6.2 MALAGKIT SUNGSONG 63 - 64 10.4 5.0 5.9 MALAGKIT SUNGSONG 66 - 67 8.7 2.0 6.1 MALAGKIT SUNGSONG 67 - 67 8.1 2.9 5.9 MALAGKIT SUNGSONG 68 6 69 7.3 4.1 4.6 MALAGKIT SUNGSONG 68 6 69 7.0 5.0 4.5 MALAGKIT SUNGSONG 77 - 77 7.4 - 6.4 100 MALAGKIT SUNGSONG 82 - 82 9.3 1.2 7.0 74 MALAGKIT SUNGSONG 89 10 90 7.4 4.4 6.0 96 MALAGKIT SUNGSONG 62 - 63 13.8 4.3 6.9
MALIKET (ACC 44590) 86 4 87 12.0 18.7 4.6 33 MANGAREZ 62 7 63 7.5 18.8 4.9 MANGAREZ 62 - 63 8.4 18.4 4.5 MANONG BALAY 86 9 87
- 25.4 6.2 34
CITY
86 4 87 9.3 -.5 7.0 100
PUTI
(ACC 52856) - 20.8 4.3 56
MANUMBALAY 86 4 87 12.6 22.0 5.8 28 (ACC 57181)
MILAGROSA 62 7 63 8.0 20.3 4.0 63 MILAGROSA MILFOR 6(2) MILFOR 6(2) MILFOR 6(2) 63 - 63 8.5 28.3 4.1 MILKETAN 6 67 - 67 8.4 25.3 4.7 MRC10993-308 86 10 86 7.5 23.8 4.5 36
81 - 82 6.9 23.2 4.7 49 62 - 62 8.3 26.8 4.8 62 - 63 10.4 25.1 6.4
960 675 810 655
470 705 115 675 510 430 100 225 540 495 440
375
765 935 560
775
780
625 600 750 950 960
275 -95
165 60
-135
5 -235
-9 5 45
-80
525 190 380 365
15 315 20
130 150 150
8.3
6.6 11.7 5.4 2.2
7.4 - 5.4 2.3
8.4 - 5.3 2.7 6.2 6.4 2.4 6.0 5.2 2.5
-10 25 -20 35 - 4.8 2.7 -70 90 -75 50
-105 65 3.5 462 4.6 2.8
6.0 60 4.9 2.8 -55 90
-180 135 9.2 - 5.8 2.2
100 300 - 7.8
95 315 9.4 - 6.5 2.2
-145 335
-30 350
110 320 80 295
230 350 20 375
-20 320 9.7 5.9 2.0
- - - -
- - -
-
- -
- - - -
- -
- -
- -
- -
- - -
-
- -
- -
- -
-
-
- - - - - - -
-
-
- -
- - - - - -
- - - - - - - - - - - - -
U U I I I
- - - - - -
- - - -
- - - -
- -
- -
- -
I U I I I I I I I I I
- - -
- - -
I I I
- - - - - - - - -
I I I U
- - - - - - -
- - - - - -
- - - - - -
I
I
I I I I I

Date Amy- Alkali Gel Amylograph viscosity lnstron Crop analyzed Protein lose spread- consis- Length Width Water year (%) (%) ing tency Peak Set- Consis- Hard- Sticki- (mm) (mm) regime b
(mo) (yr) value (mm) back tency ness ness (Bu) a (Bu) (Bu) (kg) (g-cm)
MRC11055-430 MRC11334-979 MRC12379-927-1 MRC14364-9 MRC407-1 MRC603-303 MRC7849-584 NAM SAGUI 19
NONA BOKRA NORELON 340(CS) PALAWAN PALAWAN PALAWAN PALAWAN (A) PANGASINAN PANKAJ (ACC 46502) PANPET 63 PANPET 63 PANPET 63 PARC2-2 PATNAI 23 PERURUTONG NBA
PETA PETA PETA PETA PETA
NGUP-PUR EX BANAWE
(ACC 754)
86 10 86 6.9 24.8 6.5 58 86 10 86 6.3 25.9 4.2 37 86 10 86 6.9 21.8 3.1 64 86 10 86 6.2 20.7 3.0 51 73 - 73 7.2 23.7 6.8 66
86 10 86 5.7 27.4 4.7 38 81 5 82 - 27.6 5.2 34 89 12 89 1.6 7.0 100 85 4 87 8.9 27.2 5.0 58 67 - 67 9.0 30.2 4.8 62 7 63 6.2 19.2 5.1
68 6 69 6.1 24.4 2.0 86 4 87 7.0 20.8 4.9 35 64 - 65
68 6 69 6.9 1.6 2.0 68 6 69 6.8 2.1 2.0 71 - - 7.3 - 2.3 100 73 - 73 6.6 28.0 6.9 34 86 4 87 9.8 26.3 5.0 67 86 4 87 9.2 2.0 3.8 100
77 8 78 8.0 28.1 7.0 37
62 - 63 7.5 27.4 4.4
83 - 83 - 4.0
- 28.0 5.0 95
62 7 63 7.6 25.3 4.8
63 - 64 10.8 27.7 5.0
62 - 63 6.5 32.8 3.3 62 - 63 7.5 30.2 4.4
72 8 72 6.4 28.1 3.0
540 675 740 730
865 905
635 505
1045 780
1140 670
1170 1135
870
515 780
840 690 570 830
245 5
-250 -290
635 45
190 135
-225 10
-260 -105
-380 -375 -275
400 -260
390 440 320 375
275 8.9 - 6.9 2.0 I 210 7.4 - 6.3 2.0 I 150 6.0 - 6.5 2.0 I 120 5.9 - 5.6 2.1 I
720 8.2 45 6.6 2.1 I I
340 8.4 - 6.4 2.1 I U
345 8.4 - 4.7 2.7 U
275 - 5.0 2.4 D
395 I U
350 320
U
215 7.8 - 5.2 2.5 U I D
115 90 80 5.9 210 I
I 435 10.0 - 7.2 2.0 D
35 6.2 - 5.9 2.4 I
600 I 540 I 460 I 585 I
I
-
- - - -
-
- -
- - - - -
- -
- - - -
- - - -
- -
- -
- -
- - - -
- - - -
- - - -
- -
- -
- - - -
- -
- - -
- - - - - - - - - - - -
- - - - - - - - - - - -
- - -
- - - - - - - - - - - - - - -

PlNlDUT
POKKALI PSBRc2 (lR32809-26,
PINK-KITAN EX BANAWE
NAHALIN) PSBRc4 (lR41985-111,
MOLAWIN) PULUTAN (ITUM) EX
MARAWI CITY PULUTAN (PUTI) EX
MARAWI CITY RAMADIA (ACC 44713) RAMINAD STR 3
(ACC 32557) RAMINAD STR 3 (ACC 40) RAMINAD STR.3 RAMINAD STR.3 RAMINAD STR.3 RAMINAD STR.3
SALUMPIKIT SENORITA SERAUP KECHIL 36
STR.482 SIAM29 SIAM29 SR26 B TAPOL (ACC 615) TERIMAS EX MARAWI CITY TJERE MAS TJERE MAS TJERE MAS TJERE MAS TJERE MAS UPLRi-1 UPLRi-1 UPLRI-2
RENDA-I EX MARAWI CITY
86 89 86 90
91
89
89
86 86
87 62 62 63 63 89 81 64 62
63 63 86 86 89 62 62 63 63 72 77 88 88
9 87 - 24.2 5.0 28 12 89 1.6 7.0 100
4 87 11.9 25.2 5.0 37 6 93 - 27.4 5.0 81
6 91 - 23.4 5.0 44
1 90 6.1 9.2 5.6 84
1 90 8.6 8.3 6.9 71
4 87 8.2 26.5 5.4 86 4 87 12.0 21.2 4.6 44
11 87 8.2 23.1 4.0 45 7 63 8.5 20.9 4.7 - 63 11.6 20.8 4.1
- 63 8.4 21.8 3.1 63 12.2 23.5 4.8
1 90 7.6 27.3 6.5 56 5 82 - 28.2 5.0 81 - 64 - 3.7
7 63 7.2 25.3 5.3
- 63 13.0 31.4 6.0 - 63 7.3 31.2 5.1
4 87 8.5 26.4 5.0 42 4 87 10.5 3.2 3.0 94 1 90 8.4 29.0 6.8 44 7 63 6.9 29.0 4.7
- 63 11.8 26.2 5.9
8 72 5.5 28.1 2.8
7 88 7.6 2.1 6.0 99
- 63 10.2 29.0 4.6
- 63 6.4 30.0 5.4
- 78 7.2 1.4 6.4 100
7 88 9.8 19.2 3.3 47
795
630 520
645
710
370
530 720
700 625 790
1050 660
775
730 950 630 700 655 810 580 810 980
400 550 620
20
235 280
-65
-145
80
210 -115
10 40
-80 -370
-50
380
335 300 210
-170 -35
360 380 420 2 10
-145 -310 -150
270
375 500
300
195
150
335 155
325 330 300 300 295
575
445 550 395
50 310 530 500 530 490
50 20
180
10.2
9.7 7.2
5.6
3.1
3.5
8.8 8.6
8.2
6.7
8.2 8.2 7.3
3.3 6.3 7.4
- 5.4 2.6 - 5.3 2.5 - 7.1 2.2
- 6.6 2.3
- 5.3 2.5
- 6.6 2.2
- 5.7 2.2 - 5.9 2.1
- 5.6 2.2
= 6.4 2.0 - 6.6 2.2
520 6.4 2.5 - 6.7 2.6 - 6.6 2.3
- 6.0 2.2
- 6.9 2.2
- - - - - - -
- - - - - - -
- - - -
- - - -
- - - -
- - - -
- - - - - - -
-
- -
- - - - - - - -
- - - - - - - - - - - - - - - - - - - -
- - - - - - - - -
- - - - - -
- - -
- -
U U D I
I
I I
U I I I I
U I I
I I D I
I I I I I I I I

Date Amy- Alkali Gel Amylograph viscosity lnstron Crop analyzed Protein lose spread- consis- Length Width Water year (%) (%) ing tency Peak Set- Consis- Hard- Sticki- (mm) (mm) regime b
(mo) (yr) value (mm) back tency ness ness (Bu) a (Bu) (Bu) (kg) (g-cm)
UPLRi-3 UPLRi-4 UPLRi-5 UPLRi-5 UPLRi-7 WAGWAG WAGWAG WAGWAG WAGWAG (ACC 38847) WAGWAG (ACC 5824) WAGWAG A
ALLORIO ALLORIO ALLORIO BALILLA BALILLA BALILLA BALILLA GRANA GROSSA BALILLA GRANA GROSSA BALILLA GRANA GROSSA BANATA 35 CHINES CHINES ESTRELLA A ESTRELLA A PONTA RUBRA
88 7 88 8.9 21.3 4.6 88 7 88 7.6 26.5 6.2 86 4 87 7.3 20.6 3.0 88 7 88 9.9 18.7 3.0 88 7 88 8.7 26.8 7.0 61 - 62 7.7 30.3 2.3 85 - 85 8.1 28.8 6.9 85 4 87 8.1 28.8 6.9 87 11 87 6.5 23.1 4.6 86 4 87 10.8 25.4 6.0 62 - 63 12.3 28.2 6.0
72 5 73 7.6 21.9 7.0 77 6 78 6.4 21.2 7.0 85 9 86 5.7 19.2 7.0 72 5 73 6.8 19.3 7.0 77 6 78 5.2 20.9 7.0 85 9 86 5.6 18.4 7.0 72 5 73 6.2 20.9 7.0 77 6 78 6.5 20.4 7.0 85 9 86 6.0 17.4 7.0 85 9 86 7.2 17.2 7.0 72 5 73 6.3 20.9 7.0 77 6 78 6.5 20.9 7.0 85 9 86 7.7 16.0 4.3 88 12 89 8.4 17.5 6.0 72 5 73 7.3 25.7 7.0
42 28 40 42 35
32 32 58 31
670 820 685 610 440 910 765 765
700 880
-230 120
-110 -140 325 580 340 340
235 235
150 7.3 350 9.0 195 7.8 190 6.9 405 9.5 750 465 10.0 465 10.0
- 7.8 380 9.8 495
- 6.6 2.2 I - 6.8 2.2 I - 6.0 2.1 U
- 6.7 2.4 U 6.6 2.2 I
- 5.3 2.0 I - 4.6 2.0 I - 4.6 2.0 D - 6.3 2.3 U - 5.6 1.9 I - 5.2 2.1 I
PORTUGAL
95 92 78
100 95 80
100 79 74 62 95 82 72 56 91
680 580
685 690
665 655 615
630 855 730
5 -75
-4 5 -190
-35 -150 -155
45 -310
-4 5
190 90
160 40
180 65 50
205 45
290
I 5.2 92 5.5 2.5 I 6.8 - 5.9 2.8 I
I 4.8 108 4.4 2.6 I 6.8 - 4.9 2.8 I
I 4.8 110 I 6.8 - 5.4 2.8 I 7.5 - 5.5 3.0 I
I 4.4 102 5.0 2.8 I 7.0 - 8.1 2.1 I 5.0 - 7.8 2.1 I
I
- -
- - - - - - -
-
-
-
-
- - - - - - -
-
-
-
-
-
-
- - - - - -
- - - -
- - - - - - -
-

PONTA RUBRA PONTA RUBRA PRECOCE 6 PRECOCE 6 PRECOCE 6 PRlTS RlBE RlBE RlBE RINALDO BERSANI RINALDO BERSANI RINGO SAFARI STIRPE 136 STIRPE 136 VALLEJO
ALTAIR DUBOVSKI 129 DUBOVSKI 129 GORIZONT HORISONT JEMCHUJNYI KRASNODARSK 424 KRASNODARSK 424 KRASNODARSK(Y)I 424 KUBAN 3 KUBAN 3 KUBAN 3 KUBAN 9 KULON LIMAN LUCH SOLARIS
76 10 76 7.6 23.1 7.0 77 6 78 6.8 24.1 7.0 72 5 73 6.8 20.3 7.0 77 6 78 6.4 19.1 7.0 85 9 86 7.8 16.2 7.0 85 9 86 7.6 18.1 7.0 72 5 73 8.0 18.5 7.0 77 6 78 6.5 18.7 7.0 85 9 86 6.4 16.8 7.0 72 5 73 7.1 19.1 7.0 77 6 78 7.0 18.7 7.0 77 6 78 7.2 17.2 7.0 85 9 86 7.1 20.4 7.0 72 5 73 6.7 20.3 7.0 77 6 78 5.7 21.3 7.0 72 5 73 5.3 18.9 7.0
86 3 87 7.4 18.1 7.0 72 10 73 7.4 20.1 7.0 77 6 78 6.3 20.5 7.0 86 3 87 6.0 16.0 3.0 77 6 78 5.8 18.7 3.8 86 3 87 6.9 19.0 6.0 72 10 73 5.1 20.4 7.0 77 6 78 6.1 22.4 7.0 86 3 87 6.2 19.8 7.0 72 10 73 6.9 19.6 2.5 77 6 78 6.7 17.8 3.8 86 3 87 5.7 16.2 3.0 77 6 78 7.5 19.9 5.2 86 3 87 6.9 18.6 7.0 86 3 87 6.4 17.7 7.0 77 6 78 6.5 21.2 7.0 86 3 87 6.2 17.8 7.0
55 80 98 90 50 57 80 88 70 91 84 90 39 96 86
100
755 685
880 660 635
875 740
860 800 680
715
215 175
-210 -180 -135
-215 -255
-240 -200
-65
-55
425 335
195 50 50
140 50
155 135 145
195
RUSSlA
56 86 94 76 89 70 98 88 56 89 95 80 91 56 68 81 74
790
740 970 900 875
610 700
890 1000
815 810 815 660 840
-240
-150 -420 -305 -285
30 -135
-300 -390 -235 -240 -315
-60 -275
100
150 100 160 100
200 105
140 90
150 85 60
160 80
6.7 66 I 6.2 76 5.2 2.7 I
I 5.6 118 5.5 2.7 I 7.6 - 5.8 2.8 I 7.5 - 5.6 2.7 I
I 6.0 110 5.8 2.2 I 6.8 - 6.3 2.6 I
I 4.8 127 6.1 2.4 I 5.1 131 5.4 2.6 I 7.6 - 6.2 2.6 I
I 4.6 99 5.4 2.6 I
I
8.2 - 5.3 2.7 I I
4.3 79 5.2 2.9 I 6.4 - 4.3 2.8 I 5.0 136 4.8 2.7 I 8.4 - 4.7 2.9 I
I 5.1 103 4.8 3.1 I 8.4 - 4.5 2.8 I
I 5.0 126 4.8 3.0 I 6.5 - 4.4 2.8 I 5.4 126 4.8 3.1 I 7.9 - 5.9 2.7 I 7.0 - 4.5 2.7 I 4.1 51 6.1 2.8 I 6.6 - 4.9 2.7 I
- -
- - - - - - -
- - - - - - -
- - - - - - -
- - - - - - -
- - - - - - -
- - - - - - -
- - - - - - -
- - - - - - -

Date Amy- Alkali Gel Amylograph viscosity lnstron Crop analyzed Protein lose spread- consis- Length Width Water year (%) (%) ing tency Peak Set- Consis- Hard- Sticki- (mm) (mm) regime b
(mo) (yr) value (mm) back tency ness ness (Bu) a (Bu) (Bu) (kg) (g-cm)
SOLNECHNY SPALCHIK START USBEKSKI 2 USBEKSKI 5 USROS 269 USROS 7/13 ZHEMCHUZHNY
DJ 684 D DJ.12.519 DJAMBERAN RED
(MARKET SAMPLE) DJAMBERAN WHITE
(MARKET SAMPLE) I KONG PAO (I.K.P.) I KONG PAO
(MARKET SAMPLE) lR1529-680-3 JAYA ROK5 (ROCK5) EX
SIERRA LEONE SE3026 (MARKET
SAMPLE) SENEGALESE RICE
(MARKET SAMPLE)
77 6 78 6.3 20.4 7.0 82 750 86 3 87 6.8 18.0 7.0 68 830
72 10 73 6.0 20.8 7.0 89
77 6 78 7.0 20.5 5.4 84 870
86 3 87 7.4 16.0 3.0 66 1000 72 10 73 6.4 20.0 7.0 100
72 10 73 6.1 20.0 7.0 100 72 10 73 5.3 21.2 7.0 100
-140 175 4.6 91 4.9 2.9 -335 65 6.8 - 4.5 2.7 -360 120 7.0 - 4.2 2.7
-280 160 4.4 108 5.1 3.0
SENEGAL
90 7 90 9.9 23.6 7.0 26 635 705 760 10.3 - 6.3 2.4
77 10 77 5.9 30.4 5.0 55
77 10 77 4.8 29.6 4.9 95
90 7 90 8.3 27.4 6.8 30 980 465 780 10.3 - 5.5 2.6
90 7 90 7.1 25.3 6.8 31 890 410 695 9.6 - 4.9 2.8 77 10 77 6.5 29.7 5.8 35
90 7 90 7.6 25.4 6.9 30 690 660 745 10.3 - 6.9 2.2 90 7 90 7.3 25.4 7.0 30 700 730 745 9.5 - 6.3 2.5 90 7 90 8.2 26.2 7.0 78 460 250 435 8.4 - 7.3 2.3
77 10 77 6.7 27.8 5.0 35
77 10 77 6.7 27.8 5.0 88
- - - - - - - - - - - - - - - - - - - - - - - - - - - -
- - - - - - -
- - - - - - -
- - - - - - -
- - - - - - -
- - - - - - -
I I I I I I I I
U
I I
U
I

2/91/ZC.2 AA4A AA8A ADNY301 ADNY301 ANETHODA AZ X F46 B2039C-KN-72-5-3
BAANYALOJOPOIHUN BD2
(7-2-5-3)
BG380-2 BG400-1 BH2 BQ5B BQ5B C13E3 C13F1 C13H3 C22 C22 CP4 CP4 CP4 CP9 FAROX 299 GATANG GBASSIN GC21 GlSSl 27 INDIA PA LlL-46 IR23429-R-WAR-1 IR58 IRAT161 ISA6
SlERRA LEONE
72 6 73 7.4 30.6 4.6 100 73 4 74 4.9 27.4 7.0 73 4 74 4.6 27.9 7.0 86 4 87 6.1 28.0 5.2 30 86 - 87 9.0 25.6 5.6 27 72 6 73 7.0 28.7 5.0 60 73 4 74 8.5 18.3 3.8 86 - 87 6.8 30.2 4.7 34
72 6 73 5.6 30.1 6.0 100 72 6 73 6.6 29.6 3.8 100
86 4 87 8.0 26.7 5.0 28 73 4 74 4.8 27.6 6.0 73 4 74 6.2 27.7 7.0 86 4 87 6.9 26.6 5.8 31 72 6 73 7.2 30.1 5.0 100 73 4 74 5.2 27.1 6.5 73 4 74 5.2 28.0 7.0 86 4 87 6.6 26.4 4.8 30 86 - 87 8.2 28.6 4.9 30 72 6 73 6.1 29.9 5.8 97 86 4 87 7.5 26.8 6.6 26 86 - 87 7.6 27.9 5.4 26 73 4 74 5.7 27.8 7.0 86 4 87 7.2 22.6 4.9 36 86 4 87 7.3 28.2 6.4 31 86 - 87 6.2 28.8 5.8 28 73 4 74 5.4 27.6 7.0 86 4 87 7.5 28.0 7.0 27 72 6 73 5.5 26.7 4.6 65 86 - 87 6.4 25.4 3.2 27 86 4 87 6.7 27.2 5.8 28 86 4 87 7.3 18.0 3.0 61 86 4 87 7.3 17.5 3.0 50
86 - 87 6.9 30.4 5.0 39
- 9.4
- 10.6
- 9.0
- 8.5
- 9.2
- 7.4 - 9.4
- 10.5
- 9.6 - 7.2 - 7.4
I I I
- 5.7 2.1 I - 5.1 2.2 T
I I
- 6.0 2.4 T
I I
- 6.2 2.3 T - 5.3 2.3 I
I I
- 4.9 2.4 I I I I
- 5.6 2.1 U - 5.6 2.0 T
I - 4.8 2.3 I - 4.8 2.3 T
I - 6.2 2.8 U - 4.8 2.3 I - 5.0 2.3 T
I 5.3 2.2 I
I - 5.6 2.2 T - 5.0 2.2 I - 5.9 2.5 U - 5.9 2.2 U
- - - - - - - - - - - - - - - - - - - - - - -
- - - - - - - - - - - - -
- - - - - - - - - - - -
- - - - - - - - - - - - - - - - - - - -
- - - - - - - - - - - - - - - -
- - - - - - - - -
- - - - - - - - - - - - - - - -
- - - - - - - - - - - - - - - - - - -
- - - - - - - - - - - - - - - -
- - - - - - - - - - - - - - - - - - - - - - - - - - - -

Date Amy- Alkali Gel Amylograph viscosity lnstron Crop analyzed Protein lose spread- consis- Length Width Water year (%) (%) ing tency Peak Set- Consis- Hard- Sticki- (mm) (mm) regime b
(mo) (yr) value (mm) back tency ness ness (Bu) a (Bu) (Bu) (kg) (g-cm)
ITA235 86 4 87 6.5 16.8 3.0 66 ITA257 86 4 87 7.5 20.0 3.6 52 KUATIK KUNDOR 86 - 87 6.9 27.8 6.0 28 MAHSURI 86 4 87 5.9 28.3 5.1 26 MAUNG NYO 824-92 86 - 87 6.8 28.2 5.8 28 MOYAMBAN 1 86 4 87 6.6 27.7 4.8 28 NGIEYA YAKEI 72 6 73 7.9 28.8 5.8 82 NGIEYA YAKEI 73 4 74 8.5 26.8 5.7 RADIN JAWA (GURDIL) 86 - 87 6.9 28.5 6.4 27 RAU4045-2A 86 4 87 9.0 26.9 4.8 30 RC4-46 86 4 87 5.8 27.8 5.0 30 RH2 72 6 73 5.3 29.9 5.9 100 ROHYB1-1 86 4 87 7.7 27.6 4.9 78 ROHYB15 WAR-3-3-B-2 86 4 87 6.9 28.1 4.9 63 ROHYB15-WAR-3-3-B-2 86 - 87 7.9 28.9 5.0 56 ROHYB16-4 86 4 87 6.9 27.9 4.9 55 ROHYB4-WAR-1-1-B-2 86 - 87 6.4 30.1 5.0 42 ROHYB4-WAR-1-3-B-2 86 - 87 6.2 29.3 5.0 49 ROHYB6 WAR-6-2-B-2 86 4 87 6.8 27.6 5.5 26 ROHYB6-WAR-6-2-B-2 86 - 87 7.1 28.3 5.0 38 ROK1 86 4 87 8.7 28.4 5.0 70 ROK10 86 4 87 5.4 28.7 5.2 28 ROK10 86 - 87 7.6 27.4 5.4 27 ROK11 (ADNY2) 86 4 87 7.0 28.3 4.6 58 ROK11 (ADNY2) 86 - 87 7.4 29.0 4.9 70 ROK11 (ADNY2) EX LIBERIA 81 9 82 6.4 29.5 5.0 90 ROK12 86 4 87 7.2 28.9 5.0 28 ROK14 86 4 87 6.0 27.2 7.0 26 ROK15 86 4 87 8.6 28.0 5.0 34 ROK16 86 4 87 7.1 25.8 5.8 33
7.7 5.6
9.2
9.0
8.0 8.6
8.0 8.4
9.3
8.4
9.0 8.3
8.1
8.0 8.0 9.3
6.2 7.8
- 6.0 2.4 U - 5.7 2.5 U - 4.9 2.2 T - 4.7 2.0 I - 5.0 2.0 T - 5.4 2.1 I
I I
- 5.3 2.1 T - 4.2 2.4 I - 4.8 2.4 I
I - 5.2 2.2 I - 6.4 2.1 T - 6.4 2.1 T - 5.9 2.3 I - 6.5 2.1 T - 6.6 2.1 T - 5.6 2.3 I - 6.0 2.1 T - 6.7 2.2 U - 4.6 2.2 I
5.0 2.3 T - 5.8 2.1 I - 6.0 2.0 T - 6.6 2.1 - 6.4 1.9 I - 5.9 2.5 I - 5.7 2.1 U - 5.4 2.4 U
- - - - - - - - - - - - - - - - - - - - - - - - - - - - - - - - - - - - - - - - - - - - - - - - - - - - - - - - - - - - - - - - - - - - - - - - - - - - - - - - - - - - - - - - - -
-
-
-
- -
-
-
- - -
-
-
- - - - - -
- - -
-
-

ROK16 EX INGER ROK16 EX LIBERIA ROK2 ROK3 ROK3 EX INGER ROK4 ROK5 ROK5
ROK7 ROK8 ROK9
ROK6 (lR5-198-1-1)
RTN16-2-1-1-1 SL22-617 SR26 SUAKOKO 8 T X 52.10.1 (T X 52101) T X 52.10.1 (T X 52101) T X 5225 TOS3230 EX IITA TOS3231 EX IlTA TOS3234 EX IlTA TOS6895 EX IlTA TOS6898 EX IlTA TOS6900 EX IlTA TOS6905 EX IlTA TOS6920 EX IlTA TOS6941 EX IlTA TOS6950 EX IlTA TOS6980 EX IlTA TOS6988 EX IlTA TOS7073 EX IlTA TOS7078 EX IlTA TOS7087 EX IlTA WAR44-5-5-2 WAR44-50-4-1 WAR49-5-1-3-1
88 81 86 86 88 86 86 86 86 86 86 86 86 86 86 86 72 73 73 85 85 85 85 85 85 85 85 85 85 85 85 85 85 85 86 86 86
11 9 4 4
11 4 4
4 4 4 4
4 4 4 6 4 4 9 9 9 9 9 9 9 9 9 9 9 9 9 9 9
90 82 87 87 90 87 87 87 87 87 87 87 87 87 87 87 73 74 74 86 86 86 86 86 86 86 86 86 86 86 86 86 86 86 87 87 87
7.9 7.2 7.4 7.3 9.0 5.7 5.9 8.8 7.2 6.7 5.5 7.0 6.7 5.3 5.9 5.9 5.3 7.0 9.7 9.0 6.9 7.4 9.4 6.4 9.0 7.8 8.1 7.2 8.9 6.6 7.7 7.9 7.4 6.7 6.2 6.7 6.6
26.4 6.1 23.6 6.0 17.6 3.0 27.6 4.9 30.2 5.0 29.4 4.9 29.2 5.0 28.7 5.0 27.6 4.9 24.5 4.6 28.4 5.0 27.9 5.0 29.6 5.0 29.2 5.0 28.6 4.7 28.9 5.0 29.6 6.0 28.1 6.5 23.5 5.0
24.2 4.9 25.2 5.0 19.6 5.1 20.5 6.0 18.8 5.8 20.0 6.0 21.6 5.8 25.0 4.9 21.0 5.7 20.2 5.0 20.3 5.8 23.1 5.0 25.3 5.0 25.0 5.0 28.5 5.2 28.5 5.8 30.3 4.6
23.2 -
48 60 76 28 30 69 54 52 38 35 49 46 28 31 54 27 86
29 77 34 43 57 55 54 57 33 42 57 40 31 62 60 28 30 32
690 -40
785 580
320 6.2 - 7.0 - 7.1 - 9.0
745 9.3 - 8.4 - 7.8
- 7.8 - 8.0 - 7.8 - 8.5
- 8.9 - 8.3 - 8.5
- 6.8 2.7 - 6.5 2.7 - 5.6 2.6 U - 6.4 2.1 U - 7.1 2.3 - 6.5 2.1 T - 6.4 2.0 T - 6.0 2.1 T - 5.0 2.2 I - 5.6 2.1 I - 6.6 2.1 T - 6.4 2.0 T - 5.3 2.3 T - 5.3 2.2 I - 6.7 2.1 I - 6.4 2.1 I
I I I I
- 6.7 2.2 I - 6.8 2.3 I - 6.5 2.1 I - 4.8 3.0 I - 5.1 2.8 I - 5.2 3.1 I - 5.9 2.8 I - 6.5 2.3 I - 6.2 2.6 I - 5.9 2.6 I - 5.4 2.5 I - 5.3 2.2 I - 6.5 2.1 I - 6.6 2.1 I - 5.1 2.1 T - 4.9 2.2 T - 6.1 2.1 T
- - - - - -
- - - - - - - -
- -
- - - - - -
- - - -
- - - -
- -
- - - - - - - - - - - - - - - - - - - - - - - - - - - - - - - - - - - - - - - - - - - - - - - - - - - - - - - - - - - - - - - - - - - - - - - - - - - - - - - - - - - - - - - - - - - - - - - - - -

Date Crop analyzed year
(mo) (yr)
WAR52-384-3-2-1 86 - 87 WAR77-3-2-2 86 - 87 WAR81-2-1-2 86 - 87 WAR81-2-1-3-2 86 - 87 WAR81-2-3-2 (81-2-3-3-1) 86 - 87 WAR87-4-R1-1-1 86 - 87 WARKAIY0 4 86 4 87
BAHIA BALILIA BALILIA X SOLLANA BETIS BOMBA GIRONA JUCAR NlVA RINALDO BERSANI SENIA SEQUIAL TEBRE
62-355 62-355 62-355 A12-17 BG11-11
78 10 78 64 2 65 78 10 78 86 7 87 64 2 65 78 10 78 86 7 87 86 7 87 64 2 65 86 7 87
86 7 87 78 10 78
70 6 71 78 7 78 78 3 79 70 6 71 70 7 71
Amy- Alkali Gel Amylograph viscosity Protein lose spread- consis-
(%) (%) ing tency Peak Set- Consis- value (mm)
(Bu) a (Bu) (Bu) back tency
7.4 29.1 5.0 30 9.9 28.5 5.0 38 8.0 29.6 4.0 30 9.8 27.4 4.6 29 8.7 27.8 4.8 28 8.0 28.0 5.8 26 5.8 30.2 5.1 32
SPAlN
5.8 19.6 7.0 85
5.9 20.4 7.0 82 9.0 14.9 6.6 81
6.5 20.7 7.0 83 7.6 17.4 6.6 64 8.2 18.3 6.7 76
6.4 18.6 6.6 82 7.4 19.0 7.0 83 7.2 17.7 6.5 77
10.3 18.4 6.0
12.7 20.8 7.0
11.8 14.0 6.0
745 670 770 690 605 585 730 645 750 760 635 740
-150 -70
-170 -245 225
25 -255 -190 -125 -255
-95 -220
180 215 170
75 370 210
90 90
195 115 140
95
SRI LANKA
10.1 27.6 4.0 42 940 430 590 6.8 26.6 4.8 94 940 170 440 7.5 27.1 5.1 42 9.9 27.1 7.0 28 1050 600 810
10.6 27.0 3.3 93 460 340 355
lnstron
Hard- Sticki- ness ness (kg) (g-cm)
8.7
4.6 137
3.9 123 6.3
5.7 89 5.5 6.2
5.6 5.8 116 5.9
6.6 61 7.4 59
6.0 39
Length Width Water (mm) (mm) regime b
5.9 2.5 T 6.6 2.0 T 4.5 2.3 T 5.3 2.3 T 5.3 2.3 T 5.2 2.4 T 5.3 2.1 I
5.3 3.0 I I
4.9 2.9 I 5.9 2.6 I
I 5.2 2.7 I 5.2 2.8 I 5.1 2.8 I
I 5.5 2.8 I 5.2 2.6 I 5.3 3.1 I
I 5.1 2.5 I
I 4.2 2.5 I 3.8 2.4 I
- - - - - - - - - - - - - - - - - - - - - - - - - - - - - - - - - -
- - - - -
- - - - - -
- -
- - - - - -
-
- - - -
- - - - - - -

BG11-11 BG11-11 BG11-11 BG276-5 BG3-5 BG3-5 BG33-2 BG33-2 BG34-11 BG34-12 BG34-6 BG34-6 BG34-6 BG34-6 BG34-8 8634-8 BG34-8 BG34-8 BG35-2 BG35-7 BG379-2 BG400-1 BG573 BG90-2 BG90-2 BG94-1 BG94-1 BG94-1 BW242-5-5 BW265 BW266-7 BW267-1 BW78 ELE WEE H-4 H-4 H-4
78 7 78 3 86 6 86 6 78 7 78 3 78 7 78 3 70 6 70 6 70 6 77 7 78 3 86 6 70 6 78 7 78 3 86 6 70 6 70 6 86 6 86 6 86 6 78 7 78 3 78 7 78 3 86 6 78 3 78 3 78 3 78 3 78 7 78 3
70 6 78 7
63 -
78 79 86 86 78 79 78 79 71 71 71 78 79 86 71 78 79 86 71 71 86 86 86 78 79 78 79 86 79 79 79 79 78 79 63 71 78
7.6 7.7 8.5 6.8 7.3 6.9
10.2 10.3 10.8
9.6 9.7 9.1 8.5 7.1 7.4 8.3 8.1 6.7 7.9 8.2 7.7 7.4 7.8 5.7 5.9 8.8 9.1 7.5 8.4 7.2 8.3 8.3 7.4 7.2 9.7
11.7 8.3
24.3 5.0 26.4 5.0 22.8 4.8 25.7 4.4 25.8 5.0 28.1 5.3 26.2 6.0 26.4 6.0 27.2 3.7 28.4 4.0 27.2 4.3 25.2 5.0 26.0 5.0 25.0 5.0 27.4 4.0 25.5 5.0 26.9 4.8 26.8 4.7 25.3 3.8 26.2 4.6 26.6 4.8 26.8 5.0 23.8 5.1 28.1 5.2 28.0 5.2 25.2 5.7 26.3 5.0 26.9 5.0 25.8 7.0 27.6 5.2 26.4 7.0 27.0 5.3 25.9 4.5 26.8 4.0 31.3 5.2 27.0 5.0 26.2 5.0
90 61 36 30 95 44 73 33 51 52 31 81 37 38 46 82 30 38
84 74 28
100 44 79 32 44 29 34 33 29
100 95
31 100
635 695 615
1000 880
1040 830
570 850
1060 930
710 1100
950
935
590 930 805 940
790 805 805 880
630 630 720 910 930
365 345 190
-15 200
-140 210
475 295 305 170
-135 290 180
45
175 110 225 210
335 450 145 685
70 260 600 515 200
515 585 340 285 455 690 410
560 550 595 420
115 585 440
325
290 350 405 470
480 670 320 960
300 390 600 590 460
6.5 61 3.6 2.3 6.3 57 9.7 - 3.6 2.4 8.0 - 6.0 2.5 6.1 64 5.2 2.2 6.2 57 6.9 56 3.2 2.5 7.5 44 3.2 2.5
6.4 53 5.9 2.5 6.7 49 5.5 2.6
10.0 - 5.6 2.6
6.5 56 7.0 41 8.6 - 5.3 2.6
- 7.0 3.0 8.3 - 5.0 2.4 9.4 - 6.0 2.4
10.0 - 4.0 2.1 5.8 59 6.3 2.4 7.3 43 7.3 56 6.2 2.2 7.0 55 9.5 - 6.6 2.2 6.8 47 7.4 43 7.1 52 7.0 41 5.8 56 3.9 2.5 6.0 53
9.1 31 7.4 51
- 6.0 3.0
- - -
- - -
- - -
- - - - - - - -
- -
- -
- - - -
- -
- - -
- - -
- -
- -
- -
- -
- -
- - - - -
- -
- - - -
- - - -
- - -
- - - - - -
- - - - - -
- - - -
-
I I I I I I I I I I I I I I I I I I I I I I I I I I I I I I I I I I I I I

Date Amy- Alkali Gel Amylograph viscosity lnstron Crop analyzed Protein lose spread- consis- Length Width Water year (%) (%) ing tency Peak Set- Consis- Hard- Sticki- (mm) (mm) regime b
(mo) (yr) value (mm) back tency ness ness (Bu) a (Bu) (Bu) (kg) (g-cm)
H-4 78 3 79 7.5 27.6 5.5 42 968 382 650 7.2 41 6.3 2.4 I H-4 86 6 86 7.8 26.3 5.0 33 840 130 360 9.8 - 6.4 2.4 I H-501 63 3 64 13.5 30.8 5.3 - 335 250 265 I H-7 64 - 64 7.4 29.9 4.0 - 1100 300 620 I H-9 70 6 71 8.5 26.6 3.3 - 5.5 2.5 I K8 MUTANT 70 6 71 9.1 28.2 4.0 68 930 270 510 - 5.8 2.3 I KAHATA SAMBA 70 6 71 10.9 24.6 4.7 - 4.2 3.1 I KALU HEENATI 79 3 7 9 8.0 26.8 5.0 92 670 485 665 7.4 38 I KARAMANA 78 3 79 7.8 26.3 4.0 84 - 7.5 51 I KARAWEE 78 3 79 8.8 26.2 5.0 88 7.8 58 I
LD66 70 6 71 8.6 28.4 4.2 78 960 385 560 I LUMBlNl 78 3 79 8.9 26.5 4.2 66 - 7.0 40 I NEWUDU SAMBA 79 3 79 - 27.6 3.8 61 I PACHCHAIPERUMAL 63 - 63 10.8 28.4 4.8 - 465 320 320 I
PACHCHAIPERUMAL 70 6 71 9.7 29.6 3.7 59 720 325 495 I
PACHCHAIPERUMAL 78 3 79 9.1 26.0 5.0 84 600 350 450 7.3 55 I
KURU-WEE (SAMBA) 70 6 71 11.5 25.3 5.2 - 4.0 3.0 I
2462/11
2462/11
2462/11 PK-1 70 6 71 10.6 25.0 5.8 I PODlWl A-8 (PODIWEE 63 3 64 10.5 30.5 5.9 485 425 425 I
A-8)
A-8)
A-8)
PODlWl A-8 (PODIWEE 79 3 79 - 25.8 5.5 78 420 410 450 I
PODlWl A-8 (PODIWEE 86 6 86 8.0 26.4 4.7 86 605 85 255 7.0 - 4.1 2.6 I
PTB-16 63 - 63 10.6 30.5 5.8 - 610 590 590 I SAMBA (ACC. 7700) 70 6 71 10.6 25.3 5.6 4.0 3.0 I SlGADlS 63 - 63 8.6 30.5 6.1 - 880 445 550 I SUDURU SAMBA 79 3 79 - 25.8 5.0 73 I
- - - - -
- -
- -
- -
- - - -
- - - -
- - - - - - -
- - -
- -
- - - - - -
- - - -
- - -
-
- -
-
- - - - - - - -
- -
- -
- -
- - - -
- -
- -
- -
- - - - -
- - - -
- - -
- - - - - -
- - - -
- - -

70104/1 70135/1 71101/1 71101/9 7231/8 7464/2 7464/3 7474/14 770.51/2 770.80/5 771.42/5 771.56/1 780.2/42 780.5/4 780.7/8 780.8/4 781.62/3 781.62/6 CAMPONI CAMPONI DlWANl DlWANl DlWANl ELONI SML-1010/1 SML-22/431 SML-66H19/1 SML-67T4/4 SML-68143 SML-6921/1 SML-ACORNI SML-ALUPI SML-APANl SML-AWINI
78 1 79 7.2 22.7 3.8 78 1 79 7.3 27.2 3.9 78 1 79 8.5 22.7 5.0
78 1 79 9.4 17.1 3.2 78 1 79 7.4 27.2 4.7 78 1 79 7.3 27.7 4.9
84 9 85 7.3 21.7 5.6 84 9 85 6.7 17.2 3.6 84 9 85 7.6 24.0 6.9 84 9 85 9.3 19.7 5.9 84 9 85 6.7 15.2 3.0
84 9 85 7.1 21.1 4.6 84 9 85 7.0 22.4 5.9 84 9 85 6.0 20.9 6.1
78 1 79 7.4 23.4 3.6 79 6 79 9.9 22.8 5.1
78 1 79 7.5 23.8 4.8
78 1 79 7.5 17.8 2.0
84 9 85 7.1 15.6 3.5
84 9 85 6.2 20.0 5.4
78 1 79 6.8 22.6 4.1 79 6 79 8.9 22.8 5.8 84 9 85 8.9 20.1 5.0 84 9 85 7.3 22.0 5.0 70 12 71 6.2 25.8 5.0 71 12 71 5.8 25.6 4.8 71 12 71 8.8 26.6 7.0
71 12 71 7.2 18.6 3.0 71 12 71 8.4 27.5 6.2 71 12 71 6.6 25.0 4.8 71 12 71 7.8 24.6 4.0 71 12 71 7.2 28.1 4.4 71 12 71 7.2 28.8 7.0
71 12 71 7.8 25.8 5.2
SURINAM
87 735 66 740 62 750 64 775 92 820
58 680 90 860 66 79 41 35 70 70 60 74 45 49 69 750 70 825 87 820 60 740 45 50 76 90 28 68
100
69 680
76 57
-105 -140 -180 -185 -275
10 30
-270
-150 -70
-205 -90
200 200 180 170 150 230 260 170
200 285 180 265
7.0 5.6 6.2 6.2 5.7 6.4 6.6 6.0 8.7 7.7
10.3 11.4
7.7 7.8 8.4 8.6 8.3 7.8 5.6
5.6
8.8 9.0
100 100 108 114 122
96 89
140
99
110
8.0 1.9 7.7 2.1 8.1 2.1 8.0 1.9 8.3 2.1 7.7 2.1 7.8 2.2 8.1 2.2 7.7 2.2 7.8 2.1 7.8 2.0 7.8 1.9
8.3 2.3 8.5 2.1
8.2 2.1 8.5 2.1 7.6 2.0
7.7 2.2 8.1 2.2 7.9 2.2 7.9 2.2
7.4 2.2
6.9 2.1
8.0 2.0
8.4 2.1
- - - - - - - - - - - - - - - - - - - - - - - - - - - - - - - - - - - - - - - -
- - - -
- - - - - - - - - - - - - - - - - - - - - - - - - - - - - - - - - - - - - - - - - - - - -
- - - - - - - - - - - - - - - - - - - - - -
- - - - -
I I I I I I I I I I I I I I I I I I I I I I I I I I I I I I I I
- - - - - - - I I

Date Amy- Alkali Gel Amylograph viscosity lnstron Crop analyzed Protein lose spread- consis- Length Width Water year (%) (%) ing tency Peak Set- Consis- Hard- Sticki- (mm) (mm) regime b
(mo) (yr) value (mm) back tency ness ness (BU) a (Bu) (Bu) (kg) (g-cm)
BIR-ME-FEN BIR-ME-FEN BIR-ME-FEN CHAINUNG NATIVE 11 CHIANUNG 242 CHIANUNG 8 GUZE GUZE GUZE HSINCHU 64 HSINCHU WAXY 4
IR661 KAOHSIUNG 137 KAOHSIUNG 138 KAOHSIUNG 139 KAOHSIUNG NATIVE 2 KAOHSIUNG SELECTION 1 TAICHUNG 178 TAICHUNG 181 TAICHUNG 184 TAICHUNG 186 TAICHUNG 189 TAICHUNG 65 TAICHUNG GLUTINOUS 46 TAICHUNG GLUTINOUS 46 TAICHUNG GLUTINOUS 46
HUNG-CHUEH-CHU
TAIWAN, CHlNA
63 - 63 10.8 26.2 5.0 - 640 63 - 63 9.6 25.7 4.9 - 1075 63 - 63 7.3 25.0 4.9 - 1255 78 10 78 9.3 28.5 5.6 56 750
77 6 77 8.2 17.7 7.0 78 62 - 62 7.9 19.8 7.0 - 750
63 - 63 6.9 24.3 7.0 - 1020 63 - 63 8.1 24.8 7.0 - 1035 63 - 63 7.9 24.0 5.0 - 1120 85 9 86 4.6 15.6 6.1 73 880 80 4 81 9.3 1.3 7.0 100 80 4 81 9.7 1.6 4.6 88
71 11 71 5.5 18.2 6.8 100 71 11 71 5.4 19.2 7.0 90
71 11 71 6.9 27.9 4.6 27 78 10 78 7.3 21.4 6.2 100 440 71 11 71 7.0 18.1 6.1 84 78 10 78 9.1 17.6 6.8 100 630 71 11 71 6.9 18.3 6.0 100 71 11 71 6.6 18.6 6.0 82 85 9 86 5.8 14.0 6.0 80 885
80 2 82 - 20.1 7.0 72
78 10 78 4.7 18.5 6.0 100 870
62 - 62 6.6 18.8 6.4 - 640 62 - 62 7.1 3.0 6.4 - 290 78 10 78 8.7 1.8 6.0 100 200 80 4 81 9.2 1.5 6.4 100
215 285 175 240
-100
260 225 145
-325
-290
-55
-95
-355 30
-10 -20
360 610 560 410 250
540 525 550
90
150
130
140
30 270
70 20
6.8
6.4 5.0 5.4
4.1
4.4
5.0
7.0
3.6 5.0
64 6.0 2.2
- 4.7 2.8 - 4.4 2.7 - 4.8 2.4
207 4.5 2.8
137 4.5 2.6
157 4.3 2.8
- 4.3 2.8
320 4.4 2.8 - 4.6 2.8
- - - - - - - - - - - -
- - - - - - - - - - - - - - - - - - - -
- - - - - - - - - - - -
- - - - - - -
- - - - - - -
- - - - - - - - - - - - - -
- - - - - - - -
- - -
- - - - - - - - - - - - - - -
- - -
I I I I I I I I I I I I I I I I I I I I I I I I I I I

TAICHUNG GLUTINOUS 70 89 5 90 7.9 2.1 7.0 TAICHUNG NATIVE 1 TAICHUNG NATIVE 1
62 - 62 8.1 31.2 7.0 78 10 78 5.4 29.3 7.0
TAICHUNG NATIVE 2 71 11 71 8.0 27.9 4.8 TAICHUNG NATIVE 2 78 10 78 10.7 28.5 5.6 TAICHUNG NATIVE 3 78 10 78 7.0 18.0 6.7 TAICHUNG SEN 10 85 9 86 8.4 13.2 7.0 TAICHUNG SEN 3 85 9 86 8.3 12.8 7.0 TAICHUNG SEN GLUTINOUS 1 89 5 90 9.1 2.2 6.8 TAINAN 3 63 - 63 7.8 16.2 7.0 TAINAN 3 63 - 63 7.5 15.6 6.8 TAINAN 3 63 - 63 6.7 14.2 5.8 TAINAN 3 63 - 63 7.4 17.0 7.0 TAINAN 3 63 - 63 7.0 15.9 7.0 TAINAN 3 63 - 63 8.3 15.1 7.0 TAINAN 5 71 11 71 6.2 17.7 6.0 TAINAN 5 78 10 78 4.2 18.1 6.0 TAINAN 5 80 1 81 9.0 19.6 7.0 TAINAN 9 85 9 86 7.1 15.7 7.0 TAINAN GLUTINOUS YU 7 89 5 90 8.2 1.8 7.0 TAINUNG 67 80 1 81 9.0 18.0 6.9 TAINUNG 67 85 9 86 7.6 15.2 6.9 TAINUNG 69 85 9 86 6.5 14.7 6.8 TAINUNG 70 85 9 86 6.8 14.2 6.1 TAINUNG SEN 20 TAINUNG SEN
85 9 86 8.3 16.9 7.0 89 5 90 9.0 2.4 6.9
GLUTINOUS 2 TAINUNG SEN YU 122 85 9 86 8.6 14.2 7.0 TAIPEI 306 71 11 71 6.8 17.7 7.0 TAIPEI 309 71 11 71 5.8 19.2 7.0 TAITUNG 28 78 10 78 8.6 18.0 4.5 WU-KO-CHU 80 4 81 9.2 1.5 6.6
SALAMA EX INGER 88 11 90 8.6 26.0 7.0
100 105
38 895 28 35 460 90 760 81 840
100 395 - 900 - 1060 - 990 - 800 - 720
- 530
75 885
- 870 98
100 900 80 73 650
100 70 80 73 625 80 585 84 700 53 790
100 445
78 830 98 87
100 795 100
TANZANIA
36 715
-30 440 515
110 -250 -295 -325 -195 -230 -340 -300 -170
-80 -245
-285
-155 -15
-165 -185 -265 -240 -215
-280
-225
175
20 510 700
240 140
45 60 50
240 230 200 200 210 205
170
70 10
90 105
60 65
80
140
5 10
5.8 82 4.4 3.0 I I
6.8 48 4.8 2.6 I I
7.0 57 I 4.3 178 I 6.1 - 6.2 2.2 I 6.4 - 6.3 2.2 I 6.3 79 6.2 2.3 I
I I I I I I I
3.7 222 4.3 2.9 I 6.0 - 4.6 2.6 I 7.6 - 4.7 2.8 I 5.2 63 4.7 3.0 I 5.9 - 4.4 3.0 I 7.3 - 4.5 2.8 I 6.8 - 4.8 2.7 I 5.9 - 4.6 2.9 I 7.2 - 5.7 2.1 I 6.5 77 5.5 2.8 I
6.8 - 6.4 2.2 I I I
4.0 140 4.5 2.9 I 4.8 - 5.2 2.5 I
6.7 - 7.0 2.6
- - -
- - - -
- - - - - -
- -
- - - - - - -
- - - - - - -
- - - - - - -
- - - - - - - - - -
- - -
- - -
-
- -
- -
- -
- - -
- -
- -
- -
- -

lnstron Length Width Water (mm) (mm) regime b
Amy- Alkali Gel Amylograph viscosity Protein lose spread- consis-
(%) (%) ing tency Peak Set- Consis- value (mm) back tency
(Bu) a (Bu) (Bu)
Date Crop analyzed year
(mo) (yr) Hard- Sticki- ness ness (kg) (g-cm)
BKNFR76014-51-5-1 BUN NAHK 16-1-2-1 DAWK PAYAWN DAWK PAYORM
GAHB YANG GAM PA1 41 GAW RUANG 88 GAW RUANG 88 GAW RUANG 88
DAWLEY 4-2
HTA7205-11 lR11185-0-0-0-416-1 KHAO DAWK MALI 105 KHAO DAWK MALI 105 KHAO DAWK MALI 105 KHAO DAWK MALI 105 KHAO HAWN NAKORN
KHAO HAWN NAKORN
KHAO NlAW DAM KHAO PAHK MAW 148 KHAO PAHK MAW 148 KHAO PUONG 32 KOO MUANG LUANG LEB MUE NAHNG 111 LEB MUE NAHNG 111 LEUANG AWN LEUANG AWN
PATOM(LEUANG HAWM)
PATOM(LEUANG HAWM)
82 - 76 10 77 90 12 90 82 - 82 63 8 63 76 10 77 62 8 63 63 8 63 70 - 71 72 5 73 82 - 82
62 8 63 72 5 73 76 7 76 81 - 82 62 8 63
63 8 63
62 8 63
72 5 73
82 - 82
70 - 71
82 - 82 82 - 82 82 - 82 87 - 87
76 7 76 70 - 71
THAlLAND
4.0 354
6.0
4.7 297
6.8 2.0 6.2 2.5 7.2 1.9 7.4 2.0
7.2 2.4
6.7 2.0 6.8 2.1
7.2 2.3 8.2 2.4 7.4 2.3 7.2 2.1
7.5 2.0
- 30.0 5.0 37 8.4 - 6.8 100 8.8 25.0 6.2 62 7.6 22.7 5.9 50
11.8 2.0 6.9 8.5 - 7.0 100 6.5 5.2 6.4 9.0 22.0 4.7 8.8 24.0 5.2 100
- 29.2 7.0 31 - 30.2 5.0 38
7.8 17.3 6.8
5.4 15.6 7.0 94 7.7 14.5 7.0 60
10.7 21.4 - 54
- 15.5 - 66
13.6 24.0 6.9
105
140 280 270 275
220 215 195
375
815
730 715
1080 700
-325
-210 -25
-230 -20
1085 970
1085
-405 -235 -380 6.6 102
385 375
8.9 29.4 7.0 510 320 425
11.0 5.7 6.0 - 550 -125 100 7.7 23.7 4.9 100 990 -190 250
11.6 21.5 - 36 700 5 280 5.9 30.2 5.8 40 7.8 28.0 7.0 30 8.0 29.0 5.9 32 6.5 28.1 6.0 31 855 95 350 8.8 26.5 5.2 60 900 490 625 6.8 27.7 6.7 34 930 280 520
5.7 7.8 6.3 9.5
- - - - - - - - - - - -
- - - -
- -
- -
- - - -
- -
- - - - - - - - - - - - - - - -
- - - - - - - - - -
- - - - - - - -
- -
-
-
-
- - - - - - - - -
- - - -
- - - - - - - - - - - -
- - - - - - - - -
- - - - - - - -
- - - -
D I
U I I I I I I D D I I I
I
I
I I I D U D D I I
-

LEUANG PRA-TEW 123 70 - 71 8.4 LEUANG PRA-TEW 123 72 5 73 8.8 LEUANG YAI 76 7 76 7.6 LEUANG YAI 34 62 8 63 6.8 MUEY NAWNG 62M 63 8 63 8.5 MUEY NAWNG 62M 78 2 79 9.7 NAHNG CHALONG 82 - 82 6.9 NAHNG MON S4 62 8 63 6.5 NAHNG MON S-4 63 8 63 7.9 NAHNG MON S-4 70 - 71 7.7 NAHNG MON S-4 76 7 76 8.6 NAHNG PRAYA 132 62 8 63 8.3 NAHNG PRAYA 132 70 - 71 8.0 NlAW SAN PAHTAWNG 62 8 63 7.4 NlAW SAN PAHTAWNG 76 10 77 6.2 NlAW SAN PAHTAWNG 78 2 79 10.2 NlAW SAN PAHTAWNG 88 - 89 6.5 PAE 76 10 77 8.0
PATHUMTHANI 60 90 12 90 7.6 PIN GAEW 56 62 8 63 7.8 PIN GAEW 56 70 - 71 7.9 PIN GAEW 56 82 - 82 PIN GAEW 56 87 - 87 5.7 PLAl NGHAM 87 - 87 4.7 PUANG NAHK16 63 8 63 9.4 RD1 72 5 73 8.8 RD1 76 7 76 6.9 RD10 82 - 82 7.9 RD11 82 - 82 6.9 RD13 82 - 82 5.9 RD15 82 - 82 7.9 RD17 82 - 82 7.5 RD19 82 - 82 7.1 RD19 87 - 87 3.7 RD2 (lR253-4) 78 2 79 9.5 RD21 82 - 82 11.2 RD23 82 - 82 7.2
PAH LEUAD RAED 29-15-137 76 10 77 8.8
27.7 4.5
28.8 7.0 31.2 7.0
3.0 6.5 1.6 6.0 1.6 6.0
26.2 7.0 23.3 6.2 23.8 5.4 25.0 7.0 29.4 5.6 27.8 5.1
2.8 6.8 - 6.8
1.5 6.3 1.9 6.0 - 7.0 - 7.0
21.3 7.0 30.4 5.6
30.6 5.1 29.9 5.0 29.6 5.1 28.2 7.0
29.9 7.0 1.5 6.8
28.0 7.0 29.1 5.8 15.6 7.0 28.8 5.0 30.0 5.0 29.9 5.0
1.5 6.0 16.1 7.0 23.8 5.6
29.2 -
27.8 5.1
27.9 -
100 40 38
76 96
80 36
49
100 98
100 100 100 26
48 98 94 38
28 32 94 31 60 66 38 55 58 78 63 49
1150 885 910 850 770 495
660 735 920 685 870 945 700 540 460
795 900
605 830 750 745 865
945 440
170 275 475 620
-240 -140
240 85
-20 -135 335 285
-230 -265 -120
275 200
100 125 440 610 645
145 -120
515 515 625 660 115
75
450 330 340 335 535 535 110
70 70
470 465
255 380 465 685 730
415 50
3.6 4.0
4.9 3.4
5.0 5.2
7.4 8.4
4.6 8.4 7.0 5.5 7.0 7.7 8.3 3.7 5.8 6.9
I - 7.0 2.0 I
I I I
- 7.1 2.8 D I I I
- 6.7 2.2 I I I I
397 6.7 1.8 I 634 6.5 2.0 I
300 5.8 2.8 I 274 5.4 2.3 I
I I
- 7.4 2.1 D - 7.6 2.0 D - 7.4 2.2 D
I I
- 7.1 1.7 I - 7.3 2.1 I - 7.3 2.1 I - 6.8 2.2 I - 7.2 2.0 I - 6.5 2.2 D - 7.0 2.5 D - 7.2 2.3 D
546 6.6 2.4 I - 6.9 2.1 I - 6.9 2.0 I
689 6.3 2.6 I
- 7.5 1.8
- - - - - - - - -
- - - - - - - - - -
- - - - - - - -
- - - - - - - - - -
- - - - - - - - -
- - - - -
- - - - - - - - - - - - - - - - -
- - - - - - - - -
- - - - -
- - - - - - - - - -
- - - - - - - - - - - - - - - - - -
- - - - - -

Date Crop analyzed year
(mo) (yr)
RD25 RD27 RD3 RD4 RD4 RD4 RD6 RD6 RD6 RD6 RD7 RD8 RD9 SPR7233-32-1-6-1 SPR7270-18 TAH POW GAEW 161 TAH POW GAEW 161 TAH POW GAEW 161
IR46 EX INGER TGR94 EX INGER
BAL/SK (5Y03) BAL/SK (5Y04) BALD0
82 - 82
72 5 73 76 10 77 78 2 79
76 10 77 78 2 79
82 - 82
80 - 81
80 - 81 88 - 89 76 8 76 82 - 82 82 - 82 82 - 82 82 - 82 63 8 63 82 - 82 87 - 87
88 11 90 88 11 90
86 10 86 86 10 86 86 10 86
Amy- Alkali Gel Protein lose spread- consis-
(%) (%) ing tency value (mm)
7.3 28.6 7.0 63 6.4 25.6 6.0 55 7.7 28.2 - 29 7.0 - 2.0 100
11.5 1.7 3.7 80 10.0 1.7 3.6 80
7.8 1.5 6.2 96 8.0 1.5 7.0 96 6.1 1.9 6.0 96 6.5 25.1 3.2 67 7.4 1.5 7.0 99 8.1 28.2 6.0 34 - 30.4 5.4 97 - 28.5 5.4 56
- 29.8 5.3 32 5.2 29.6 6.0 30
6.1 - 7.0 100
11.0 28.0 4.8
Amylograph viscosity
Peak Set- Consis- back tency
(Bu) a (Bu) (Bu)
725 650 745
695 -165 105
485 -160 65
510 -255 60 935 -175 260
830 245 455
930 75 370
TOGO
7.7 30.4 6.6 92 530 335 515 7.6 22.8 5.0 56 800 -185 270
TURKEY
8.0 13.8 3.0 78 970 -405 35 6.2 16.1 7.0 82 750 -245 55
10.0 19.2 7.0 39 750 -165 105
lnstron
Hard- Sticki- ness ness (kg) (g-cm)
7.1 5.6
6.6 284 4.6 382 4.6 5.9 357 3.0 895 3.0 6.1 69
3.7 8.1
9.6
8.4 5.6
7.6 7.4
10.5
Length Width Water (mm) (mm) regime b
7.0 2.2 I 7.4 2.2 I
I 6.5 2.2 I 6.9 2.1 I 6.9 2.3 6.6 2.0 I 6.9 2.2 I 6.9 2.1 6.5 2.1
I 6.4 2.4 I 6.9 2.1 I 7.1 2.2 D 7.1 2.2 D
I 7.3 2.0 D 7.3 1.9 D
6.5 2.2 5.0 2.9
5.7 2.5 I 5.9 2.7 I 6.7 2.7 I
-
- -
-
- -
-
- -
- -
- -
- -
- -
-
- - - - -
-
- - -
- - - - - - - -
- - - -
- - - -
- - - -
- -
- - - - - - -
- -
- - -
- - -

IZ46 IZ68 KRASNODARSKY LIETO MARATELLI PA/FS4 PADONA RANBELLI RlBE ROCCA SEQUIAL
A-301 BELLE PATNA BELLE PATNA BLUEBELLE BRAZOS BRAZOS
CALMOCHI-101 CALMOCHI-101
(BIGGS, CA) CALORO CALROSE CENTURY PATNA 231 CENTURY PATNA 231 CENTURY PATNA 231 CENTURY PATNA 231 COLUSA CRUMBLY 7154
(CROWLEY, LA) CS-M3 CS-S4 DAWN
CALMOCHI-101
86 86 86 86 86 86 86 86 86 86 86
88 62 72 72 78 80 89 89 88
72 76 62 78 84 88 72 64
72 72 72
10 10 10 10 10 10 10 10 10 10 10
7 6 5 5
11
7 10
7
5 2 6
12
7 5
12
5 5 5
86 86 86 86 86 86 86 86 86 86 86
89 63 73 73 78 81 90 90 89
73 77 63 78 85 89 73 64
73 73 73
7.3 18.8 7.0 9.5 20.7 7.0 6.9 18.0 7.0 7.7 17.6 7.0 7.5 17.7 7.0 7.2 18.4 7.0 6.2 16.9 7.0 6.2 18.2 7.0 7.8 13.9 7.0 6.0 18.1 6.7 6.8 16.1 7.0
7.3 20.8 5.8 6.8 24.7 3.6 6.5 27.0 4.7 5.7 27.1 3.8 6.7 17.1 6.0 5.8 17.1 6.0 6.2 2.0 6.7 7.7 2.0 7.0 7.1 1.8 7.0
6.6 18.4 6.3 6.6 17.5 7.0 7.4 18.8 2.1 6.2 15.9 3.0 7.0 13.1 2.4 5.8 15.4 3.6 6.2 19.9 6.5
10.0 19.5 3.9
4.8 19.9 7.0 6.8 19.4 7.0 5.0 28.2 3.8
60 33 66 54 59 61 76 70 76 81 73
USA
34
100 100
92 92
100 99
100
57
86 85 80
100
450 515 630 560 635 580 775 575 820 830 785
730 795
800
145
210
615 820 820
960
-35 85
-80 -60
-100 -80
-250 -55
-315 -295 -275
-40 -190
-245
-67
-40
5 -220 -290
-290
65 110
70 40
145 145
90 155
50 70 25
320 245
125
19
40
220 335 160
280
9.0 9.6 8.4 8.4 8.8 8.9 8.2 7.8 7.5 6.6 8.0
6.1
5.5 142 5.4 6.0 78 2.0 2.2
6.8 95
4.4 166 7.1 4.6
6.4 2.7 I 7.0 2.6 I 4.9 3.0 I 6.0 2.8 I 5.6 2.9 I 6.4 2.7 I 5.4 2.8 I 5.4 3.0 I 5.9 2.5 I 6.3 2.8 I 5.2 2.9 I
7.5 2.0 I I I I
5.4 2.7 I 5.8 2.6 I 5.0 2.8 I 4.8 2.8 I 5.1 2.9 I
I 5.3 2.5 I
I 5.9 1.9 I 6.8 2.0 I 5.9 2.0 I
I I
I I I
- - - - - - - - - - -
- -
- -
- -
- -
- - -
- - -
- - -
- - -
-
-
- - -
- - -
-
-
- -
-
- -
- - - -
-
- - -
- - - -
- - -
- -
- -
- -
- - -
- -
- -
- -
- - -
- - -
- - -
- - -
- - -
- - -
- - -
-
-

Date Amy- Alkali Gel Amylograph viscosity lnstron Crop analyzed Protein lose spread- consis- Length Width Water year (%) (%) ing tency Peak Set- Consis- Hard- Sticki- (mm) (mm) regime b
(mo) (yr) value (mm) back tency ness ness (Bu) a (Bu) (Bu) (kg) (g-cm)
DELLA 81 - 82 7.5 21.8 4.5 36 IRGA409 88 7 89 7.8 26.7 7.0 79 550 460 560 12.0 JOJUTLA 78 12 78 6.4 28.7 6.4 41 900 440 620 7.4
- 6.2 1.9 I
KOKUHOROSE 76 2 77 4.7 17.0 7.0 78 595 0 185 5.9 60 7.4 2.4 I
L-202 94
88 7 89 8.2 27.2 5.0 47 495 315 530 8.1 I
L-202 89 10 90 7.4 27.4 7.0 69 - 7.1 2.0 I
L-202 (BIGGS, CA) 88 7 89 6.0 28.2 6.0 38 460 250 455 8.5 - 6.9 - 6.9 2.1 I
LABELLE 72 5 73 5.5 27.4 5.0 100 - 6.8 2.0 I
LABELLE I
75 7 76 6.9 24.1 5.2 68 870 -155 220 7.5 LABELLE
77 I 78 11 78 7.1 22.8 3.2 83 785 -175 185 6.1 104 6.3 2.0 I
LABELLE 8 0 - 81 7.8 23.4 3.7 78 LABELLE 83 - 85 8.4 24.0 5.0 50 760 -50 200
- 6.7 - 7.0 2.0 I
LABELLE I I
LABELLE 88 7 89 9.9 22.7 5.9 61 650 15 340 7.0 - 7.8 - 6.6 2.0
LEBONNET 78 11 78 6.6 23.3 4.8 78 805 -105 245 6.8 101 6.5 2.1 I - 6.5 2.0 I
LEBONNET 8 4 - 85 7.6 21.2 4.4 70 LEBONNET 88 7 89 7.3 23.0 4.9 35 755 -60 330 6.7
- 8.6 - 7.2 2.3 I
LEMONT 8 4 - 85 6.9 23.2 4.6 68 - 6.6 2.1 I
LEMONT 88 7 89 7.2 23.2 5.6 57 810 -105 240 7.4 - 8.6 - 7.7 2.1 I
LEMONT 88 7 89 9.2 24.5 6.4 44 700 50 400 8.2 - 6.6 2.1 I
LEMONT 89 10 90 8.9 25.5 5.4 62 - 7.3 2.3 I
LEMONT 89 10 90 8.2 25.2 5.6 50 6.1 - 6.7 2.2 I
- 6.3 - 6.9 2.2 I - 5.6 2.6 I
84 - 85 8.0 21.1 3.9 67
M-103 (BIGGS, CA) 88 7 89 5.8 15.4 7.0 86 730 -50 230 4.9 M-201 84 - 85 8.6 10.7 7.0 82 M-201 88 7 89 8.4 13.3 7.0 78 845 -265 230 4.4 M-201 (BIGGS, CA) 88 7 89 6.4 16.1 7.0 27 710 -155 225 4.3
- 5.6 2.4 I
M-202 89 10 90 6.5 18.4 7.0 76 - 5.5 2.5 I
M-202 (BIGGS, CA) 88 7 89 6.8 13.8 7.0 86 710 -170 210 4.4 - 5.1 - 5.6 2.8 I
M-401 (BIGGS, CA) 88 7 89 7.1 16.7 7.0 58 550 -30 240 5.2 - 5.6 2.6 I
M-7 84 - 85 5.0 16.7 7.0 72 - - - 8.1 - 5.8 2.7 I - 5.9 2.6 I
- 6.7 - 6.0 2.6 I
- -
- -
- -
- -
- -
- -
- - - -
- -
- -
-
-
-
-
- -
- - -
- - -
- -
- - - - - - -

MARS MOCHIGOME MOCHIGOME NATO NATO NATO NATO NATO NATO NEWBONNET NEWBONNET NEWBONNET NEWREX NEWREX NORTAI NORTAI PECOS REXMONT REXMONT REXORO REXORO 83 S-101 (BIGGS, CA) S-201 (BIGGS, CA) S-6 SATURN SKYBONNET STARBONNET STARBONNET STARBONNET STARBONNET TEBONNET TERSO TOR0 TORO-2 TORO-2 TORO-2 VISTA
84 83 89 62 72 75 78 84 88 84 88 89 83 84 72 75 83 88 89 70 62 88 88 75 72 84 72 78 84 88 84 76 78 84 88 89 72
7 6 5 7
11
7
7 10
5 7
7 10
5 6 7 7 8 5
5 11
7
2 12
7 10
5
85 85 90 63 73 76 78 85 89 85 89 90 85 85 73 76 85 89 90 73 63 89 89 76 73 85 73 78 85 89 85 77 78 85 89 90 73
7.9 12.5 6.7 6.4 1.1 7.0 6.3 2.5 6.8 7.2 16.3 6.0 6.3 16.8 6.0 7.2 14.4 7.0 7.6 16.4 4.9 7.7 12.2 7.0 7.3 15.0 7.0 7.3 22.2 4.4 6.4 24.4 5.6 8.2 24.0 6.2 8.3 28.4 5.0
5.2 17.0 6.0 5.4 16.1 7.0 7.6 17.6 7.0 6.7 28.8 6.0 8.4 29.9 5.6 7.3 27.0 5.0 7.6 25.5 3.2 7.0 16.3 7.0 7.0 16.4 7.0 7.4 19.9 7.0 5.2 17.0 6.0 7.7 22.8 4.6 5.2 26.6 3.7 7.4 22.6 3.1 6.6 23.1 4.7 6.9 22.3 4.8 7.8 21.2 5.0 7.2 17.5 7.0 5.0 19.8 7.0 7.3 14.3 6.7 6.8 16.6 7.0 8.4 17.4 7.0 6.5 19.4 6.0
7.8 26.1 4.9
75 100 100
80 85 79 43 59 44 56 33 43
88 53 42 48 97
81 86 58
65 100
60 48 35 58 52 65 83 76 76
160 159 755
870 815
840
775
910
865 955 795
735 710 680 735
780
760
680 630
870
20 -94
-215
-285 -255
-250
-20
150
-285 -375 355
-80 -150 -160
-85
-130
-90
-20 452
-270
20 10
195
135 145
210
375
430
155 80
610
300 230 210 180
235
335
190 225
220
7.0
5.8
5.0 5.1 7.1 5.1 8.6 6.8 6.1
9.4
4.8
10.4 9.4
4.5 4.0 5.0
8.4
6.2 8.6 7.3 7.8 6.3 6.2 7.4 4.1 4.9
71
98 136
109
100
95
86 130
6.0 2.6
5.0 2.9
5.5 2.6
5.1 2.4 7.1 2.0 6.9 2.0 6.4 2.1
7.2 1.9
6.5 2.0 7.2 2.1
4.9 2.8 5.1 2.9
7.0 2.1
6.4 2.0 7.1 2.1 6.4 1.9 7.1 2.1
6.6 2.2 7.6 2.2 6.6 2.1 7.0 2.2
- -
-
-
-
-
-
-
-
- -
- - - - - -
-
- - - - -
- - -
- -
- - -
- - -
-
-
-
-
-
-
- - - - -
- -
- -
- - - - - - - - -
- -
- -
- -
-
-
- -
- -
- - - - -
- - - -
- - -
- - -
- - -
- - -
- -
- -
- -
- - - -
- -
- -
- - -
- - -
- - - - - -
- - -
- - -
- - - -
-
- - -
- - -
- - -
- - -
I I I I I I I I I I I I I I I I I I I I I I I I I I I I I I I I I I I I I

Date Amy- Alkali Gel Amylograph viscosity lnstron Crop analyzed Protein lose spread- consis- Length Width Water year (%) (%) ing tency Peak Set- Consis- Hard- Sticki- (mm) (mm) regime b
(mo) (yr) value (mm) back tency ness ness (Bu) a (Bu) (Bu) (kg) (g-cm)
VENEZUELA
ARAURE 1 90 10 90 7.3 26.6 7.0 28 775 775 830 10.4 - 6.9 2.3 ARAURE 2 EX INGER 88 6 88 6.4 26.3 7.0 36 - 6.2 2.4 ARAURE 4 90 10 90 7.2 28.5 6.3 34 895 455 685 9.4 - 6.8 2.3 CIMARRON 90 10 90 7.4 27.9 7.0 58 445 350 410 9.8 - 7.0 2.1
PALMAR 90 10 90 7.0 25.4 6.0 50 835 -5 415 7.0 - 6.4 2.2 P2231F4-138-6-1 90 10 90 7.4 26.1 6.0 48 845 15 445 6.7 - 6.5 2.2
314 85 6 86 6.0 30.2 4.7 BA LE 81 5 81 8.1 27.7 6.2 BAO THAI 85 6 86 6.0 27.9 4.9 BAO THAI HONG 86 5 87 9.3 27.0 6.2 BAT DE 72 3 73 6.6 28.9 4.0 BAU 157 72 3 73 5.4 30.6 4.4
BONG BOI 72 3 73 7.6 22.6 4.9 BONG DEN 72 3 73 5.9 29.3 4.9
C15 86 5 87 8.2 25.6 7.0 C15 90 12 90 7.0 26.4 7.0 CA DUNG KET LO 62 7 63 7.4 27.8 5.0 CHIEM CHANH 72 3 73 6.6 29.3 4.9 CHIN HENH 89 6 90 6.0 28.6 7.0 CN2 1 (lR19746-11-3-3) 85 6 86 6.4 28.3 7.0 CN2 2 85 6 86 7.4 27.2 6.9 D148 85 6 86 7.7 27.8 6.7 DAU DEN HA NAM 86 5 87 8.2 29.2 6.0
BL-90 90 12 90 8.4 23.0 4.7
C10 88 6 89 7.5 26.0 5.9
VIETNAM
87 710 75 49 930 32 76 94 48 685 86 80 26 26 26 660
82 63 580
29 745 29 725 38
- 740
30 785
25
-115
-175
690 250
255 370 255 300
235
245
205
740 440
465 505 425 455
8.0 6.6 8.3
5.6
11.0 10.7 9.1
8.4 9.4 9.5 8.8
- 5.8 2.2 I I
- 5.2 2.4 I - 5.4 2.2
I I
I I
- 6.4 1.9
- 5.7 2.3 - 6.9 2.0 - 7.5 2.2
I I
- 7.2 2.2 - 6.2 2.0 I - 6.1 2.0 I - 6.2 2.4 I - 4.3 2.7
-
- - -
- - - -
-
- - -
- - - -
- -
- -
-
- - -
- - - -
- - -
- -
- -
- - -
- - -
- -
- -
- -
- -
- -
- -
- -
- -
- -
- - - -

DAU DO THAI BlNH DAU HAI DUONG DAU SOM THAI BlNH DAU TRANG MUON TB Dl DO HAI PHONG Dl HUONG HAI PHONG Dl SON TAY Dl VANG HAI DUONG DOC GIANG DONG 100 DONG 116 DONG 1555 DONG 166 DONG 17 DONG 380 DONG N11 DONG N13 DONG N5 DONG N6 DONG U14 DONG U17 DONG U9 DU HAI DUONG DU HUONG HA1 PHONG DU THOM HA1 DUONG DU THOM THAI BINH DU THOM THAI BINH DU VANG NAM TlNH GAO DO GIE HAI DUONG GIE HlEN NAM TlNH GIE HOA SON TAY GIE THANH HOA GIE THOM HOA BlNH GIE XA HUONG HOA BINH HOA BlNH
86 86 86 86 86 86 86 86 72 86 86 86 86 86 86 86 86 86 86 86 86 86 86 86 86 86 86 86 73 86 86 86 86 86 86 73
5 87 8.3 5 87 8.2 5 87 7.9 5 87 7.7 5 87 8.1 5 87 8.9 5 87 7.4 5 87 7.2 3 73 8.0 5 87 8.2 5 87 8.6 5 87 7.0 5 87 9.0 5 87 9.2 5 87 9.5 5 87 9.1 5 87 7.6
5 87 11.1
5 87 9.2 5 87 7.5 5 87 8.0
5 87 7.7
5 87 7.7 5 87 7.4 5 73 6.8
5 87 7.0 5 87 10.2 5 87 7.5 5 87 8.4
5 73 6.5
5 87 9.5
5 87 8.0
5 87 8.9
5 87 8.2
5 87 8.5
5 87 7.6
27.2 5.1 29.2 6.0 27.9 5.6
29.0 6.0 29.1 5.1 29.2 5.8 28.0 6.9 28.5 4.5 27.0 6.0 29.1 6.1 29.4 7.0 18.5 7.0 26.2 7.0 18.1 5.9 27.1 7.0 29.3 7.0 20.0 7.0 27.6 6.9 26.2 6.7 26.2 7.0 24.6 6.9 29.2 6.1 29.1 5.1 27.4 5.7 24.4 5.4 24.5 6.1 24.1 5.6
25.8 5.5 27.1 7.0 27.8 5.5 29.2 6.6
28.3 5.6
26.8 3.0
28.3 6.0 30.7 5.8 29.2 4.4
90 38 34 76 35 74 89 32 92 82 29 72 63 36 43 28 27 37 26 33 36 33 65 74 49 32 30 32 74 29 28 84 29 30 32 80
7.3
- 8.3
- 8.6
- 5.8 - 10.3
- 9.5
10.3 - 8.3 - 8.4
- 4.0 2.4 - 5.1 2.1
5.2 2.5 4.0 2.4
- 5.1 2.2 - 4.8 2.1
5.3 2.3 - 4.9 2.2
- 5.7 1.9 - 6.0 2.0 - 5.7 2.1 - 6.0 2.0 - 5.2 2.3
5.1 2.4 - 5.2 2.4
5.3 2.1
5.9 2.1 - 6.0 2.0 - 6.0 2.1
- 4.8 2.1 - 4.9 2.0 - 4.3 1.8 - 4.6 1.9 - 4.8 2.1
- 5.0 2.3 - 4.8 2.0
4.7 2.2 - 4.8 2.1 - 4.9 2.1
4.8 2.1
- - - - - - - - - - - - - - - - - - - - - - - - - - - - - - - - - - - - - - - - - - - - - - - - - - - - - - - - - - - - - - - - - - - - - - - -
- - - - - -
- - - -
- - - -
- - - -
- -
- - - - - - - - -
- - - - - - - - - - - - - - - - - - - - - - - - - -
- -
- - - - - -
-
- - - - -
- - -
- - -
-
- - - -
I
I
I
-

Date Amy- Alkali Gel Amylograph viscosity lnstron Crop analyzed Protein lose spread- consis- Length Width Water year (%) (%) ing tency Peak Set- Consis- Hard- Sticki- (mm) (mm) regime b
(mo) (yr) value (mm) back tency ness ness (Bu) a (Bu) (Bu) (kg) (g-cm)
HUYET RONG lR29708-13 lR29725-40 lR44595-70 IR64 NC IR66 IR68 IR9729 L13 LD347 LOC HlEN THANH HOA LOC THAI BlNH LOC THANH HOA LOC TRANG SON TAY LOC TRON HA TlNH LOC TRON NGHE AN LUA RUNG LUA THOM LUA TlEU HANOI LUA TUONG MOC TUYEN MONG CHlM ROI MOT BUI LUN MTL 58 TUYEN NANG HUONG NANG KEO NANG LlNH NANG PHET KHLAI NANG THOM NANG THOM CHO DAO
89 6 90 7.4 26.8 5.0 57 89 9 90 8.0 25.3 5.0 56 89 9 90 7.7 29.4 6.3 84 89 9 90 6.1 27.4 5.0 70 89 9 90 7.7 24.6 5.0 60 89 9 90 6.7 27.7 5.0 72 89 9 90 6.8 28.9 6.9 34 90 12 90 7.4 23.1 5.2 65 88 6 89 7.9 28.1 6.8 26 85 6 86 8.1 27.4 7.0 28 86 5 87 8.6 27.6 6.0 29 86 5 87 8.8 25.6 5.6 32 86 5 87 8.1 25.7 7.0 29 86 5 87 8.4 28.5 5.9 28 86 5 87 9.5 28.7 5.8 51 86 5 87 8.3 24.5 6.0 28 73 5 73 6.3 29.1 3.6 72 89 6 90 5.3 30.4 6.8 61 62 7 63 6.9 26.4 5.7 62 7 63 7.0 27.2 5.0
89 6 90 5.8 29.4 5.1 88 89 6 90 6.3 28.6 5.0 66 89 9 90 7.3 27.1 7.0 40 81 5 81 8.9 22.7 5.3 50 62 7 63 5.7 27.4 5.1 72 3 73 6.9 29.2 4.8 91 72 3 73 10.9 20.8 3.5 91 62 7 63 8.4 24.8 5.1 89 6 90 6.3 29.5 6.0 81
88 6 89 6.7 28.8 7.0 27
720 760 555 730 760 565 695 730
835
720 1020
830
900 950 690
1000
750 810
-60 60
335 70
0 255 655
-160
400
500 270 320
-190 -240 465
90
10 -20
335 420 530 420 370 485 740 270
535
625 560 525
325 315 650
480
355 415
6.1 6.6 7.4 5.9 6.5 7.3 9.3 4.7
10.8 8.8
7.7
8.8 6.7 6.0 9.0 6.8
6.3
- 6.5 2.0 - 7.2 2.1 - 6.7 2.2 - 7.0 2.1 - 7.4 2.1 - 7.0 2.0 - 7.9 2.1 - 6.7 2.1 - 6.3 2.3 - 6.9 2.2 I - 4.9 2.3 - 4.8 2.4 - 5.1 2.1 - 4.6 2.2 - 4.8 2.3 - 4.7 2.4
I
I I
- 6.8 2.0
4.8 2.4 - 7.2 2.0 - 7.0 2.1 - 7.0 2.1
I I I I I
- 6.8 2.0
- - -
- - - - - - -
- - - - - -
-
- - -
- -
- -
- -
- - -
- -
- -
- - - - - - - - - - - - - - -
- - - -
-
-
- -
- - - - - - -
-
-
- - - -
-
- - - - -

NANG THOM SOM NEP CAM (BLACK) NHO CHUM NHO THOM NN75-6 0M44-5 0M576-18 0M59-7 PUANG NGEON SOC NAU SOC NAU TAM TAM SO 1 TAM SO 10 TAM SO 11 TAM SO 12 TAM SO 211 TAM SO 212 TAM SO 7 TAM SO 8 TAM SO 9 TAU BAT TAU BUN TAU HUONG TAU HUONG TAU HUONG TAU HUONG TE DONG NAM TlNH TE HlEN HOA BlNH TE LOM HUNG YEN TE LUOl HOA BlNH TE MONG ME HOA BlNH TE TRANG HA GIANG TE TRANG NAM TlNH TRANG DOC TRANG LUA
73 90 73 73 88 89 89 89 62 62 72 85 86 86 86 86 86 86 86 86 86 72 89 62 73 81 89 86 86 86 86 86 86 86 62 81
5 12 5 5 6 9 9 9 7 7 3 6 5 5 5 5 5 5 5 5 5 3 6 7 5 5 6 5 5 5 5 5 5 5 7 5
73 90 73 73 89 90 90 90 63 63 73 86 87 87 87 87 87 87 87 87 87 73 90 63 73 81 90 87 87 87 87 87 87 87 63 81
7.1 29.3 4.8 10.3 2.0 7.0 7.0 29.5 4.2 8.1 29.6 4.2
10.3 14.6 7.0 7.9 27.4 5.1 7.3 28.2 6.9 8.0 27.0 7.0 7.4 28.2 4.9 7.6 28.1 5.1 9.0 28.4 5.0 8.7 24.0 5.5 8.9 23.7 6.1 9.6 25.1 6.0 9.1 24.2 6.4 7.9 25.1 6.8 8.3 28.6 6.0 9.0 28.5 6.0 8.8 25.9 6.1 8.9 25.1 6.0 9.8 24.9 6.1 8.7 21.5 4.0 7.7 26.4 5.8 7.8 24.4 5.2 7.0 27.3 3.2 7.6 22.6 5.0 7.4 22.2 5.1 7.3 28.0 4.9 9.0 27.9 4.9 6.8 28.7 6.0 7.4 18.1 7.0
10.0 26.1 6.5 7.2 24.1 6.1 7.0 28.0 6.1 8.5 22.7 4.8 8.3 23.5 5.1
96 92 96 98 52 48 35 31
82 38 32 33 32 45 74 32 41 39 39
100 61
78 68 74 73 35 44 78 27 31 31
39
20
505 590 660 615 480
150
620 400
320
275
2.1
6.1 8.1 9.0 8.5
8.6 8.5 8.4 7.7 8.7
I
I I
- 5.8 2.7
- 6.8 2.1 - 6.8 2.1 - 7.0 2.1 - 6.5 2.2
I I I
- 5.0 2.1 I - 4.6 2.1 - 4.8 2.0 - 4.7 2.1 - 4.9 2.1 - 4.8 2.1 - 4.8 2.3 - 4.9 2.1 - 4.9 2.2 - 5.1 2.5
- 6.5 2.1 I
I I
U - 6.7 2.0 - 4.8 2.1 - 4.9 2.1 - 4.6 2.4 - 4.9 2.6 - 4.9 2.3 - 4.8 2.3
4.9 2.3 I I
125 -45
600 670 675 830 900
300 420 520 450 230
1030 -300
7.0 7.6 8.5
830 715
320 125
8.5
6.3 6.0 825 -155
9.1 5.8
815 -145 7.0
- - - -
- - - - - - - - - - -
- - -
- - - - - -
- - - - - - - - - - - - - - -
- - - - - - - - - - - - - - - - - - - - - - - - - - - - - -
- -
- - - -
- - - -
- - - - - - - -
- - -
-
- - - - - - - - - - - - - -
- -
- -
- - - - - - -
- - -
- - - - - - -
-
- -

Date Amy- Alkali Gel Amylograph viscosity lnstron Crop analyzed Protein lose spread- consis- Length Width Water year (%) (%) ing tency Peak Set- Consis- Hard- Sticki- (mm) (mm) regime b
(mo) (yr) value (mm) back tency ness ness (Bu) a (Bu) (Bu) (kg) (g-cm)
TRANG MOT BUI U 14 U 16 U17 U17 U9 V.X.1.5 V.X.1.7 V14 VE VANG XUAN SO 2 XUAN SO 2
KALEMBWE EX INGER
ACC. 101395 (FRENCH
ACC. 101395 (FRENCH SUDAN)
SUDAN)
ACC. 100882 (INDIA) ACC. 100882 (INDIA)
81 5 81 7.4 27.9 6.1 32 88 6 89 7.0 22.8 6.9 32 88 6 89 6.7 26.8 6.9 30 85 6 86 6.4 28.9 4.1 66 955 88 6 89 7.3 29.4 7.0 30 88 6 89 6.8 22.8 5.4 34 85 6 86 7.2 13.9 3.0 80 1480 85 6 86 7.2 25.1 5.9 70 675 85 6 86 8.3 26.7 7.0 28 740 62 7 63 6.4 27.0 5.9 - 820 86 5 87 6.4 27.8 5.0 43 88 6 89 5.1 28.3 6.9 30
ZAMBIA
88 11 90 7.4 23.5 5.0 42 730
WILD RICES
O. ALTA
65 - 67 10.6 23.9 6.5
90 6 91 13.3 24 3 5.0
O. AUSTRALIENSlS
65 - 67 11.3 22.1 4.5 90 6 91 12.9 22.5 5.0
95 370
-700 130
480 580 410 580
-150 90
-60 345
7.0 5.1 8.5 9.0 8.8 5.5 6.3 6.4 9.5
8.6 8.4
6.1
I - 6.2 2.0 - 6.1 2.2 - 6.1 2.3 I - 5.7 2.2 - 6.2 2.0 - 7.2 1.9 I - 6.8 2.0 I - 5.4 2.5 I
I
- 5.6 2.3
- 5.8 3.2
5.6 1.7
- 5.6 2.1
- - -
- - -
- - -
- -
- -
- -
-
- - -
- -
- -
- - -
- - -
- -
- - -
-
-
-
- -
- -
- -
- -
- -
-
-
-
-
- -
- -
- - -

ACC. 101232
ACC. 100117 (GUINEA) ACC. 100119 (MALI) ACC. 100122 (GAMBIA) ACC. 100931 (SUDAN) ACC. 101252 (BURKINA
FASO) EB-27 (AFRICA) EB-31 (AFRICA)
ACC. 101422 ACC. 101429 (UGANDA)
(AFRICA) EB-T-11 (AFRICA) EB-T-13 (AFRICA) EB-T-6 (BURKINA FASO)
ACC. 101299 (BURKINA FASO)
ACC. 101301 (BURKINA FASO)
ACC. 101303 (BURKINA FASO) HG1
(llTA 7286) (BURKINA FASO) HG20
(IITA 7288) (BURKINA FASO) HG22
(IITA 7289)
90 6 91
65 - 65 65 - 65 65 - 65 65 - 65 65 - 65
65 - 65 65 - 65
90 6 91 65 - 67
65 - 67 65 - 67 65 - 67 65 - 65
65 - 65
65 - 65
81 3 82
81 3 82
81 3 82
12.1 2l.6
13.4 29.1 15.1 26.6 16.0 25.9 14.5 26.7 16.1 25.4
10.4 20.4 12.0 17.8
10.4 25.5 11.0 20.1
10.6 19.4 8.9 19.3 9.5 19.4
12.6 27.2
13.1 27.3
10.9 26.7
27.8
29.3
27.8
O. BRACHYANTHA
7.0
O. BREVlLlGULATA
5.1 4.8 5.6 4.8 5.0
4.5 2.5
O. EICHlNGERl
6.0 1.5
O. GLABERRIMA
4.5 4.5 4.5
5.0
5.0
5.6 70
6.2 55
6.1
- 5.5 1.2
- 3.4 1.3
U
U
U
5.3
44
- - - - -
- - - - - - - - - - - - - - - - - - - - - - - - - - - - - - - - - - - - - - - -
- - - - - - - - - - - - - - - -
- - - - - - - - - -
- - - - - - - - - - - - - - - - - - - - - - - - - - - - - - - -
- - - - - - - -
- - - - - - - -
- - - - - - -
- - - - - - -
- - - - - - -
- - -

(BURKINA FASO) HG24
(BURKINA FASO) HG25 (1)
(BURKINA FASO) HG25
(BURKINA FASO) HG28
(BURKINA FASO) HG30
(BURKINA FASO) HG31
(BURKINA FASO) HG32
(CAMEROON) ACC. 101263 (CAMEROON) KETE KETE
(CAMEROON) UG24(1)
(CAMEROON) UG24(2)
(CAMEROON) UG25(1)
(CAMEROON) UG25(2)
(CAMEROON) UG26(1)
(CAMEROON) UG26(2)
(IITA 7291)
(IITA 7292)
(2) (IITA 7293)
(IITA 7294)
(IITA 7295)
(IITA 7296)
(IITA 7297)
(ACC.104596)
(IITA 7268)
(IITA 7269)
(IITA 7270)
(ACC.104581)
(IITA 7272)
(ACC.104582)
Date Crop analyzed year
(mo) (yr)
81 3 82
81 3 82
81 3 82
81 3 82
81 3 82
81 3 82
81 3 82
65 - 65 81 3 82
81 3 82
81 3 82
81 3 82
81 3 82
81 3 82
81 3 82
Amy- Alkali Gel Protein lose spread- consis-
(%) (%) ing tency value (mm)
- 27.2 6.1 60
- 28.9 6.0 54
- 27.7 6.2 46
27.6 6.0 49
- 27.6 6.4 55
- 27.4 6.0 47
28.3 6.1 61
13.7 29.2 5.3 - 28.6 6.1 66
- 26.3 5.9 44
27.8 6.1 64
- 28.8 6.4 46
- 27.6 6.0 62
- 25.4 6.3 48
- 28.4 6.1 49
Amylograph viscosity
Peak Set- Consis- back tency
(Bu) a (Bu) (Bu)
lnstron
Hard- Sticki- ness ness (kg) (g-cm)
Length Width Water (mm) (mm) regime b
U
U
U
U
U
U
U
I
U
U
R
R
R
R
-
-
-
-
-
-
-
- - -
-
-
-
-
-
-
-
-
-
-
-
-
-
- -
-
-
-
-
-
-
-
-
-
-
-
-
-
- -
-
-
-
-
-
-
-
-
-
- - - -
-
-
-
-
-
-
- -
-
-
-
-
-
-
-
-
-
-
-
-
- -
-
-
-
-
-
-
-
-
-
-
-
-
- -
-
-
-
-
-
-
-
-
-
-
-
-
- -
-
-
-
-
-
-

(CAMEROON) UG26(3) 81
(CAMEROON) UG46(1) 81
(CAMEROON) UG46(2) 81
(CAMEROON) UG56(1) 81
(CAMEROON) UG56(2) 81
(ACC.104583)
(IITA 72 75)
(ACC.104584)
(IITA 72 78)
(IITA 7279) (CAMEROON) UG67(1) 81
(IITA 7283) (CHAD) GORLO (ACC.104579) 81 (CHAD) GORLO (ACC.104580) 81 (CHAD) GOURMOULOUNG 81
(CHAD) TB39( 1 ) 81
(CHAD) TB39(2) 81
(CHAD) TG17(1) (IITA 7255) 81 (CHAD) TG17 (ACC.104577) 81 (CHAD) TG18 (IITA 7257) 81 (GAMBIA) ACC. 100127 65 (GAMBIA) CG118 81
(GAMBIA) CG128 81
(GAMBIA) CG66( 1 ) 81
(GAMBIA) CG66(2) 81
(GAMBIA) CG72( 1 ) 81
(GAMBIA) CG72(2) 81
(ACC.104578)
(ACC.104597)
(ACC.104598)
(IITA 7165)
(IITA 7166)
(IITA 7149)
(ACC.104569)
(IITA 7151)
(ACC.104570)
3 82 - 23.7 6.1 36
3 82 - 27.9 6.2 70
3 82 - 27.8 6.0 46
3 82 27.5 6.1 56
3 82 - 29.1 6.3 52
3 82 - 28.0 6.1 66
3 82 - 21.7 6.4 56 3 82 - 27.9 6.5 64 3 82 - 27.8 6.0 61
3 82 - 27.9 6.0 76
3 82 - 27.8 6.0 80
3 82 - 28.4 6.0 48 3 82 - 25.4 6.5 41 3 82 - 27.3 6.0 72
3 82 - 27.3 6.2 68
3 82 - 28.4 6.0 62
3 82 - 25.4 6.0 86
3 82 - 24.6 6.0 87
3 82 - 27.8 6.1 83
3 82 - 27.8 6.0 79
- 65 12.3 24.0 5.2
R
R
R
R
R
U
R R U
I
I
U U U
R
R
U
U
U
U
- - - - - - -
- - - - - - -
- - - - - - -
- - - - - - -
- - - - - - -
- - - - - - -
- - - - - - - - - - - - - - - - - - - - -
- - - - - - -
- - - - - - -
- - - - - - - - - - - - - - - - - - - - - - - - - - - - - - - - - - -
- - - - - - -
- - - - - - -
- - - - - - -
- - - - - - -
- - - - - - -
-

Date Amy- Alkali Gel Amylograph viscosity lnstron Crop analyzed Protein lose spread- consis- Length Width Water year (%) (%) ing tency Peak Set- Consis- Hard- Sticki- (mm) (mm) regime b
(mo) (yr) value (mm) back tency ness ness (Bu) a (Bu) (Bu) (kg) (g-cm)
(GUINEA) ACC. 100134 (GUINEA) ACC. 100135 (GUINEA) ACC. 100136(1) (GUINEA) ACC. 100136(2) (GUINEA) ACC. 100137(1) (GUINEA) ACC. 100137(2) (GUINEA) ACC. 100144 (GUINEA) ACC. 100145 (GUINEA) ACC. 100152 (GUINEA) ACC. 100152 (GUINEA) ACC. 100158 (IVORY COAST)
ACC. 101297 (IVORY COAST) lG10
(IITA 71 92) (IVORY COAST) lG11
(IITA 1983) (IVORY COAST) IG14
(IITA 71 94) (IVORY COAST) IG15
(IITA 7195) (IVORY COAST) IG16
(IITA 7196) (IVORY COAST) IG17
(IITA 7197) (IVORY COAST) IG19
( IITA 71 98) (IVORY COAST) IG21
(IITA 7199)
81 3 82 - 27.0 7.0 53
81 3 82 - 27.1 6.5 77 81 3 82 - 27.2 7.0 64 81 3 82 - 27.8 6.2 86 81 3 82 - 27.2 6.1 62 81 3 82 - 27.0 6.9 66 81 3 82 - 25.4 7.0 76 65 - 67 11.7 18.9 4.5 81 3 82 - 22.9 6.4 53 81 3 82 - 27.8 6.8 44 65 - 65 13.8 25.8 5.5
81 3 82 - 27.9 6.1 42
81 3 82 - 27.4 6.8 47
81 3 82 - 26.9 6.8 34
81 3 82 29.2 6.1 68
81 3 82 29.6 6.2 88
81 3 82 27.3 6.0 36
81 3 82 - 24.0 6.2 70
81 3 82 - 25.4 6.0 46
65 - 65 9.5 28.8 5.0 U U U U U U U U U U U
U
U
U
U
U
U
U
U
- - - - - - - - - - - - - - - - - - - - - - - - - - - - - - - - - - - - - - - - - - - - - - - - - - - - - - - - - - - - - - - - - - - - - - - - - - - - - - - - - - - -
- - - - - - -
- - - - - - -
- - - - - - -
- - - - - - -
- - - - - - -
- - - - - - -
- - - - - - -
- - - - - - -
-
-
-
-
-
-

(IVORY COAST) IG22 81 3 82 - 23.2 6.0
(IVORY COAST) IG23 81 3 82 - 28.8 6.3
(IVORY COAST) IG35 81 3 82 - 28.0 6.0
(IVORY COAST) IG36 81 3 82 - 27.9 6.0
(IVORY COAST) IG37 81 3 82 - 29.4 6.1
(IVORY COAST) IG5 (1) 81 3 82 - 27.7 6.0
(LIBERIA) ACC. 102196 81 3 82 (LIBERIA) ACC. 102208 81 3 82 - 23.2 6.8 (LIBERIA) ACC. 102214 81 3 82 (LIBERIA) ACC. 102218 81 3 82 - 23.3 6.9 (LIBERIA) ACC. 102223 (1) 81 3 82 - 22.8 6.5 (LIBERIA) ACC. 102225 81 3 82 (LIBERIA) ACC. 102230
- 24.0 6.5 81 3 82 - 23.9 6.6
(LIBERIA) ACC. 102240 81 3 82 (LIBERIA) ACC. 102248
- 22.9 7.0 81 3 82 - 23.7 6.8
(LIBERIA) ACC. 102257 81 3 82 (LIBERIA) ACC. 102267
23.4 6.6 81 3 82 - 23.9 6.1
(LIBERIA) ACC. 102273 (2) 81 3 82 - 28.3 6.4 (LIBERIA) ACC. 102284 81 3 82 27.3 6.2 (LIBERIA) ACC. 102296 81 3 82 - 23.7 6.0 (LIBERIA) ACC. 102305 81 3 82 - 27.1 6.4 (LIBERIA) BAH 81 3 82 - 23.3 7.0
(LIBERIA) GBAKIAH-2 81 3 82
(LIBERIA) GBEKE-1 LATE 81 3 82 - 27.8 6.8
(LIBERIA) GBEKE-2 EARLY 81 3 82 - 27.1 6.2
(LIBERIA) GEE 81 3 82 - 23.6 6.2
(IITA 7200)
(IITA 7201)
(IITA 7202)
(IITA 7203)
(IITA 7204)
(IITA 7190) - 25.4 6.9
- 23.9 6.8
(ACC.103937)
(ACC.104549)
(IITA 5775)
(ACC.104548)
(ACC.103941)
- 27.6 7.0
59
72
85
86
79
35
58 70 82 72 52 64 74 40 60 50 54 54 72 66 36 48
50
42
60
75
U
U
U
U
U
U
U U U U U U U U U U U U U U U U
U
U
U
- - - - - - -
- - - - - - -
- - - - - - -
- - - - - - -
- - - - - - -
- - - - - - -
- - - - - - - - - - - - - - - - - - - - - - - - - - - - - - - - - - - - - - - - - - - - - - - - - - - - - - - - - - - - - - - - - - - - - - - - - - - - - - - - - - - - - - - - - - - - - - - - - - - - - - - - - - - - - - - -
- - - - - - -
- - - - - - -
- - - - - - -
- - - - - - -
-
-

Date Amy- Alkali Gel Amylograph viscosity lnstron Crop analyzed Protein lose spread- consis- Length Width Water year (%) (%) ing tency Peak Set- Consis- Hard- Sticki- (mm) (mm) regime b
(mo) (yr) value (mm) back tency ness ness (Bu) a (Bu) (Bu) (kg) (g-cm)
(LIBERIA) KELEI (ACC.103949)
(ACC.104551)
(ACC. 103943)
(ACC. 103935)
(ACC. 103951) (LIBERIA) NAJABOH
(ACC.104550) (LIBERIA) QUE (IITA 5815)
(LIBERIA) MAIWO-I
(LIBERIA) MAIWO-III
(LIBERIA) MAWOU-1
(LIBERIA) MAYWAR-II
(LIBERIA) ROK- CHU-SONE-CON-1
(LIBERIA) SHAWHON (IITA 5 725)
(LIBERIA) SlLlBUY (IITA 5892)
(LIBERIA) SOKPONG (ACC.103946)
(LIBERIA) CLAREE PANKLET (ACC.103948)
(MALI) LG34 (IITA 7116) (MALI) LG35 (IITA 7117) (MALI) MG25 (IITA 7249) (MALI) MG26(1)
(IITA 7250) (MALI) MG26(2)
(ACC.104574)
81 3 82 - 25.4 6.2 78
81 3 82 - 23.7 7.0 38
81 3 82 - 23.6 6.7 36
81 3 82 - 23.5 6.8 55
81 3 82 - 23.2 7.0 74
81 3 82 - 25.4 6.9 52
81 3 82 - 27.3 6.9 58 81 3 82 - 27.4 6.2 50
81 3 82 - 27.5 6.1 58
81 3 82 - 27.0 6.6 76
81 3 82 - 23.7 6.8 76
81 3 82 - 25.4 6.8 50
81 3 82 - 23.8 6.0 90 81 3 82 - 27.3 6.0 86 81 3 82 - 27.3 6.0 66 81 3 82 - 28.7 6.1 70
81 3 82 - 27.2 6.1 70
U
U
U
U
U
U
U U
U
U
U
U
D D R R
R
- - - - - - -
- - - - - - -
- - - - - - -
- - - - - - -
- - - - - - -
- - - - - - -
- - - - - - - - - - - - - -
- - - - - - -
- - - - - - -
- - - - - - -
- - - - - - -
- - - - - - - - - - - - - - - - - - - - - - - - - - - -
- - - - - - -

(MALI) MG26(3) (ACC.104575)
(MALI) MG27 (1) (IITA 7253) (MALI) MG27(2)
(ACC.104576) (MALI) ORYZA BARTHll
(IITA 7308) (NIGERIA) ACC. 100982 (NIGERIA) ACC. 100984 (NIGERIA) ACC. 104539 (NIGERIA) ACC. 104540 (NIGERIA) ACC. 104541 (NIGERIA) ACC. 104542 (NIGERIA) ACC. 104543 (NIGERIA) ACC. 104544 (NIGERIA) ACC. 104545 (NIGERIA) ACC. 104546 (NIGERIA) ACC. 104547 (NIGERIA) ACC. 104553 (NIGERIA) ACC. 104554 (NIGERIA) ACC. 104555 (NIGERIA) ACC. 104556 (NIGERIA) ACC. 104557 (NIGERIA) ACC. 104558 (NIGERIA) ACC. 104559 (NIGERIA) BlYA GERO
(IITA 5442) (NIGERIA) BIYAU
(ACC. 103929) (NIGERIA) DAN GANDE
(ACC.104538) (NIGERIA) DAN MANU
(ACC.104535) (NIGERIA) DAN MANU
(ACC.104536) (NIGERIA) DAN MANU
(IITA 5474)
81
81 81
81
65 65 81 81 81 81 81 81 81 81 81 81 81 81 81 81 81 81 81
81
81
81
81
81
3
3 3
3
8
3 3 3 3 3 3 3 3 3 3 3 3 3 3 3 3 3
3
3
3
3
3
82
82 82
82
65 65 82 82 82 82 82 82 82 82 82 82 82 82 82 82 82 82 82
82
82
82
82
82
- 29.4 6.0
- 28.7 6.0 - 28.6 6.0
- 28.2 6.2
13.7 25.1 5.2 12.6 27.2 5.2
- 27.0 6.5 - 27.2 6.2 - 23.5 6.0 - 23.5 6.7
- 25.5 6.4 - 23.6 6.2
- 28.1 6.1 - 27.9 6.2 - 27.8 6.0 - 24.0 6.1
- 28.1 6.5 - 22.7 6.1 - 22.2 6.0
- 27.8 6.1
- 23.6 6.0
- 27.3 6.3
- 23.5 6.1
- 27.2 6.2
- 27.8 6.1
- 28.3 6.1
- 28.3 6.2
- 23.6 6.2
70
77 68
65
48 72 52 62 43 62 60 59 72 39 63 33 58 52 78 76 51
70
63
67
67
39
R
R R
R
U U U H H H I I H H H U H U U U U
U
D
D
D
D
- - - - - - -
- - - - - - - - - - - - - -
- - - - - - -
- - - - - - - - - - - - - - - - - - - - - - - - - - - - - - - - - - - - - - - - - - - - - - - - - - - - - - - - - - - - - - - - - - - - - - - - - - - - - - - - - - - - - - - - - - - - - - - - - - - - - - - - - - - - - - - - - - - - - - - - - - - - - - - - - - - - -
- - - - - - -
- - - - - - -
- - - - - - -
- - - - - - -
- - - - - - -
- -

Date Amy- Alkali Gel Amylograph viscosity lnstron Crop analyzed ProteIn lose spread- consis- Length Width Water year (%) (%) ing tency Peak Set- Consis- Hard- Sticki- (mm) (mm) regime b
(mo) (yr) value (mm) back tency ness ness (Bu) a (Bu) (Bu) (kg) (g-cm)
(NIGERIA) FARIN DAN BOTO (IITA 5456)
(NIGERIA) HAKURI MONTOL (ACC.103969)
(NIGERIA) HAKURI MONTOL (ACC.103970)
(NIGERIA) IITA 5634 (NIGERIA) IITA 5640 (NIGERIA) IITA 5674 (NIGERIA) IITA 5678 (NIGERIA) IITA 5695 (NIGERIA) IITA 5980 (NIGERIA) KASHIN
SHANU (IITA 5430) (NIGERIA) KYANGA
81 3 82 - 23.6 6.8 43
81 3 82 - 27.5 6.7 62
81 3 82 - 25.4 6.4 70
81 3 82 - 27.4 6.2 70 81 3 82 - 23.5 6.3 56 81 3 82 - 28.4 6.2 72 81 3 82 - 29.2 6.0 82 81 3 82 - 28.2 6.5 74 81 3 82 - 25.4 6.8 60 81 3 82 - 27.3 6.0 55
81 3 82 - 28.6 6.4 61
R
H
H
U U I I H
R
D (ACC.164532) (NIGERIA) KYANGA 81 3 82 - 27.3 6.5 74 D
(ACC.104533) (NIGERIA) KYANGA 81 3 82 - 27.8 6.2 76 D
(ACC.104534) (NIGERIA) RAKIN 81 3 82 - 27.1 6.5 63 R
DANBOTO (ACC. 104528) (NIGERIA) TANBA 81 3 82 - 27.6 6.1 49 R
(ACC.104530) (NIGERIA) TATTARA 81 3 82 - 27.6 6.5 61 D
(ACC.10453T) (NIGERIA)DAN GYARAN- 81 3 82 - 27.7 6.6 74 R SHE (ACC.104531) (SENEGAL) CG10 81 3 82 - 25.4 6.1 69
(IITA 7131) U
- - - - - - -
- - - - - - -
- - - - - - -
- - - - - - - - - - - - - - - - - - - - - - - - - - - - - - - - - - - - - - - - - - - - - - - - -
- - - - - - -
- - - - - - -
- - - - - - -
- - - - - - -
- - - - - - -
- - - - - - -
- - - - - - -
- - - - - - -

(SENEGAL) CG112(1) (IITA 7161)
(SENEGAL) CG112(2) (IITA 7162)
(SENEGAL) CG112(3) (IITA 7163)
(SENEGAL) CG112(4) (IITA 7164)
(SENEGAL) CG13(2) (IITA 7135)
(SENEGAL) CG156(1) (IITA 7167)
(SENEGAL) CG156(2) (ACC.104572)
(SENEGAL) CG166(1) (IITA 7169)
(SENEGAL) CG27(1) (IITA 7138)
(SENEGAL) CG27(2) (ACC.104567)
(SENEGAL) CG27(3) (ACC.104568)
(SENEGAL) CG32(1) (IITA 7141)
(SENEGAL) CG4 (IITA 7126)
(SENEGAL) CG86(2) (IITA 7158)
(SENEGAL) CG86(3) (ACC.104571)
(SENEGAL) CG9(1) (ACC.104565)
(SENEGAL) CG9(2) (ACC.104566)
(SENEGAL) CG9(3) (IITA 7129)
81 3
81 3
81 3
81 3
81 3
81 3
81 3
81 3
81 3
81 3
81 3
81 3
81 3
81 3
81 3
81 3
81 3
81 3
82
82
82
82
82
82
82
82
82
82
82
82
82
82
82
82
82
82
- 27.7 5.8 68
- 27.8 6.0 83
- 26.8 6.0 80
- 29.1 6.1 79
- 25.4 6.0 41
- 30.0 6.0 74
- 28.4 6.0 76
- 28.3 6.2 72
- 26.8 6.5 34
- 22.7 6.7 36
- 23.6 6.2 52
- 27.2 6.8 40
- 25.4 6.0 58
- 27.9 6.2 78
- 28.4 6.0 86
- 23.7 6.0 50
- 27.3 6.2 55
- 23.6 6.0 72
R
R
R
R
U
R
R
R
U
U
U
U
U
R
R
U
U
U
-
-
-
-
-
-
-
-
- -
- -
- -
- -
- -
- -
- -
- -
- -
- -
- -
- -
- -
- -
- - - - -
- - - - -
- - - - -
- - - - -
- - - - -
- - - - -
- - - - -
- - - - -
- - - - -
- - - - -
- - - - -
- - - - -
- - - - -
- - - - -
- - - - -
- - - - -
- - - - -
- - - - -

Date Amy- Alkali Gel Amylograph viscosity lnstron Crop analyzed Protein lose spread- consis- Length Width Water year (%) (%) ing tency Peak Set- Consis- Hard- Sticki- (mm) (mm) regime b
(mo) (yr) value (mm) back tency ness ness (Bu) a (Bu) (Bu) (kg) (g-cm)
(SENEGAL) CG9(4) (IITA 7130)
(SENEGAL) CG93 (IITA 7160)
(SIERRA LEONE) GBESSAMA (ACC.103994)
(SIERRA LEONE) MALA KPAKIWA (ACC.103987)
(SIERRA LEONE) TUNKA -FORO (ACC.104563)
KATAN (ACC.103995)
KATAN (ACC.104564) (SIERRA LEONE)
ACC. 100980 (SIERRA LEONE)
ACC. 100987 (SIERRA LEONE)
ACC. 100988 (SIERRA LEONE)
ACC. 103991 (SIERRA LEONE) GBEN
-SEMA (ACC.104562)
(SIERRA LEONE)GBALAN-
(SIERRA LEONE)GBALAN-
(SIERRA LEONE) GENE- -KOI (ACC.103992)
(SIERRA LEONE) GINDAH (ACC.103988)
(SIERRA LEONE) MAKASSA (ACC.103953)
81 3 82 - 23.6 6.0 74
81 3 82 - 28.9 6.2 78
81 3 82 - 25.4 6.0 76
81 3 82 - 23.6 6.1 50
81 3 82 - 24.0 6.4 52
81 3 82 - 26.2 6.9 73
81 3 82 - 27.2 6.8 60
65 - 65 13.2 25.7 5.0
65 - 65 13.7 26.4 5.0
81 3 82 - 27.2 6.2 58
81 3 82 23.3 6.1 88
81 3 82 25.4 6.2 83
81 3 82 - 23.7 6.3 82
81 3 82 - 23.2 6.2 80
81 3 82 - 23.3 6.3 69
U
R
U
U
U
U
U
U
H
U
U
- - - - - - -
- - - - - - -
- - - - - - -
- - - - - - -
- - - - - - -
- - - - - - -
- - - - - - -
- - - - - - - -
- - - - - - - -
- - - - - - -
-
-
- - - - - - -
- - - - - - -
- - - - - - -
- - - - - - -
- - - - - - -

(SIERRA LEONE) MALA
(SIERRA LEONE) MALA
(SIERRA LEONE) MALA
(SIERRA LEONE)
(SIERRA LEONE)
(ACC. 103986)
(ACC.104561)
(IITA 6907)
PEDIKUM (ACC.103989)
PENDEKUN (ACC.103990)
(ACC.103993) (SIERRA LEONE) SALI-/
(ZAIRE) ACC. 100854 (ZAIRE) ACC. 100975
ACC. 101405 (TAIWAN,
ACC. 101405 (TAIWAN, CHINA
CHINA)
ACC. 100914 ACC. 101392 (USA)
ACC. 101141
ACC. 100905 (INDIA) ACC. 100951 (INDIA) ACC. 101145
(AUSTRALIA)
81
81
81
81
81
81
81 81
65
90
90 65
90
65 65 65
3
3
3
3
3
3
3 3
6
6
6
82
82
82
82
82
82
82 82
67
91
91 67
91
67 67 67
7.4
13.3
8.6 7.0
12.0
8.4 14.0
9.0
22.4 6.3 38
23.4 6.6 70
25.4 6.5 44
27.3 6.0 72
23.9 6.6 76
23.1 5.6 65
27.2 6.8 46 24.0 6.2 56
O. GRANDlGLUMlS
23.5 6.5
23.3 7.0
O. LATlFOLlA
25.0 5.0 22.9 2.5
O. MlNUTA
23.6 5.0
O. NIVARA
20.7 6.5 18.4 2.5 20.2 2.5
U
U
U
U
U
U
H H
- 6.1 1.6
- 4.1 1.8
- 2.9 1.5
- - - - - - -
- - - - - - -
- - - - - - -
- - - - - - -
- - - - - - -
- - - - - - -
- - - - - - - - - - - - - -
- - - - - - - -
- - - - -
- - - - - - - - - -
- - - - -
- - - - - - - - - - - - - - - - - - - - - - - --
- - -

Date Amy- Alkali Gel Amylograph viscosity lnstron Crop analyzed Protein lose spread- consis- Length Width Water year (%) (%) ing tency Peak Set- Consis- Hard- Sticki- (mm) (mm) regime b
(mo) (yr) value (mm) back tency ness ness (Bu) a (Bu) (Bu) (kg) (g-cm)
ACC. 101507 (INDIA) 65 - 67 9.8 20.8 2.5 ACC. 101520 (INDIA) 65 - 67 11.5 18.4 4.5 ACC. 101973 90 6 91 11.0 25.4 6.0 ACC. 103422 90 6 91 13.1 15.6 4.7 ACC. 103826 90 6 91 13.1 23.6 5.0 ACC. 103839 90 6 91 12.0 25.4 5.0
O. OFFlClNALlS
ACC. 100878 (THAILAND) 89 12 89 - 31.5 6.4 100 ACC. 100896 (THAILAND) 89 12 89 - 30.8 4.5 63 ACC. 100896 (THAILAND) 90 6 91 12.2 24.6 5.0 ACC. 101072 65 - 67 9.7 19.5 6.5
(PHILIPPINES)
O. PERENNlS
ACC. 103848 90 6 91 13.1 22.4 6.0
O. PUNCTATA
ACC. 101409 (GHANA) 65 - 67 11.1 18.8 2.5
O. RlDLEYI
ACC. 100821 90 6 91 12.3 23.0 7.0
- 5.6 2.6 - 5.8 2.5 - 5.7 2.8 - 5.7 2.3
- 3.1 1.6 - 3.1 1.7 - 3.4 1.9
- 6.3 2.0
- 6.1 1.
- - - - - - - - - - - - - - - - - - - - - - - -
- - - - - -
- - - - - -
- - - - - - - -
- - - - - - - - - -
- - - - -
- - - - - - - -
- - - - -
- - -

ACC. 100910 (THAILAND) ACC. 100912 (THAILAND) ACC. 100916 (CHINA) ACC. 100917
(CAMBODIA) ACC. 100923 (MYANMAR) ACC. 100944 (INDIA) ACC. 100945 (INDIA) ACC. 100946 (INDIA) ACC. 101398 (INDIA) ACC. 101448 (INDIA) ACC. 101449 (INDIA)
O. RUFIPOGON
65 - 67 13.8 19.0 2.5 65 - 67 11.4 19.8 4.5 65 - 67 13.3 19.3 2.5 65 - 67 10.5 19.3 2.5
65 - 67 10.8 19.6 2.5 65 - 67 12.0 19.9 4.5 65 - 67 11.3 19.0 2.5 65 - 67 11.2 - 4.5 65 - 67 12.6 19.4 2.5 65 - 67 8.3 21.8 6.5 65 - 67 9.2 20.8 6.5
O. STAPFIE
ACC. 100934 (SUDAN) 65 - 65 17.3 27.2 5.0 ACC. 100936 (NIGER) 65 - 65 13.7 30.4 5.0 ACC. 100939 65 - 65 15.9 30.3 5.0
a BU = Brabender units. b Water regime: U = upland, I = Irrigated. D = deepwater, R = red lowland, T = tidal/swampy, H = hydromorphic.
- - - -
- - - - - - -
- - -
- - -
- - -
- - -
- - -
- - -
- - -
- - -
- - - -
- - - -
- - - -
- - - -
- - - -
- - - -
- - - -
- - - - - - -
- - - - - - -
- - - - - - -
- - - - - - -
- - - - - - -
- - - - - - -
- - - - - - -

