grading and grade inflation at georgia tech
DESCRIPTION
Grading and Grade Inflation at Georgia Tech. Preliminary Report to the Academic Senate April 22, 2003. Grade Inflation Defined. The upward shift in the grade point average (GPA) of students over an extended period of time without a corresponding increase in student achievement. - PowerPoint PPT PresentationTRANSCRIPT
Grading and Grade Inflation at Georgia Tech
Preliminary Report to the Academic SenateApril 22, 2003
Grade Inflation Defined
The upward shift in the grade point average (GPA) of students over an extended period of time without a corresponding increase in student achievement.
Goldman, L. 1985. “The Betrayal of the Gatekeepers: Grade Inflation.” Journal of General Education 37 (2): 97-121

Methodology• Extensive study of literature• Survey of peers and other institutions of
higher education• Statistical analysis of Georgia Tech data
– Focus on undergraduate level only– Historic perspective– In-depth study of last 10 years by department

• CalTech• Carnegie-Mellon• Cornell• Johns Hopkins• MIT• Northwestern• Stanford• NC State• Penn State• Purdue
Georgia Tech’s Peer Institutions• Texas A & M• UC-Berkeley• UCLA• Florida• Illinois-Urbana• Michigan• Minnesota• Texas• Washington• Virginia Tech

Other Institutions Reviewed
• University of Arizona• University of North Carolina-
Chapel Hill• Harvard University• Louisiana State University• Hood College

Peer Review
• Surveyed 10 peers for recent grade inflation studies at their own institutions
• Compiled grading definitions, including the use of plus/minus systems, at all 20 peers
• Review of grade inflation studies at other institutions, most notably UNC-Chapel Hill and Harvard

Of the 10 Peers Surveyed…
• Five had conducted studies on grading and grade inflation
• These five “studies” ranged from the effects of a plus/minus grading system to charts showing SAT score plotted against GPA
• Interesting responses from Berkeley and MIT regarding need to do such studies
Grade Definitions at Peers• Most use 4.0 scale • Standard: A = Excellent, B=Good,
C=Satisfactory, D=Poor/Passing, F=Failure
• CalTech and MIT use Pass/Fail in freshman year
• 14 peers use some form of plus/minus grading system
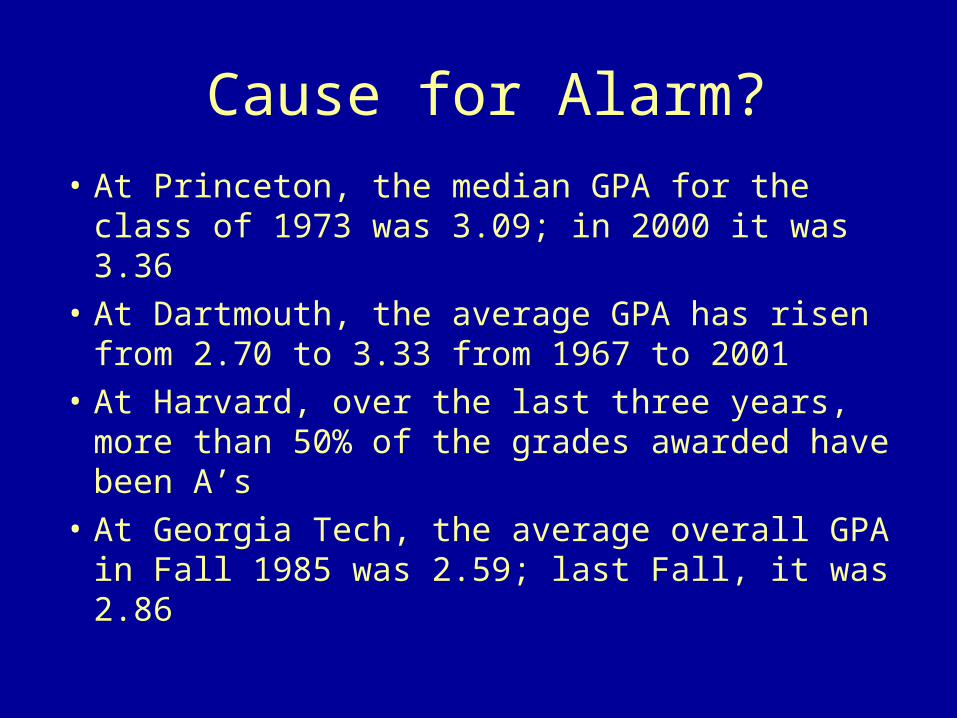
Cause for Alarm?• At Princeton, the median GPA for the class of
1973 was 3.09; in 2000 it was 3.36• At Dartmouth, the average GPA has risen from
2.70 to 3.33 from 1967 to 2001• At Harvard, over the last three years, more
than 50% of the grades awarded have been A’s• At Georgia Tech, the average overall GPA in
Fall 1985 was 2.59; last Fall, it was 2.86

Georgia Tech GPAGeorgia Tech Undergraduate GPA
Fall 1972 through Fall 2002
2.2
2.3
2.4
2.5
2.6
2.7
2.8
2.9
3
Fall
1972
Fall
1973
Fall
1974
Fall
1975
Fall
1976
Fall
1977
Fall
1978
Fall
1979
Fall
1980
Fall
1981
Fall
1982
Fall
1983
Fall
1984
Fall
1985
Fall
1986
Fall
1987
Fall
1988
Fall
1989
Fall
1990
Fall
1991
Fall
1992
Fall
1993
Fall
1994
Fall
1995
Fall
1996
Fall
1997
Fall
1998
Fall
1999
Fall
2000
Fall
2001
Fall
2002
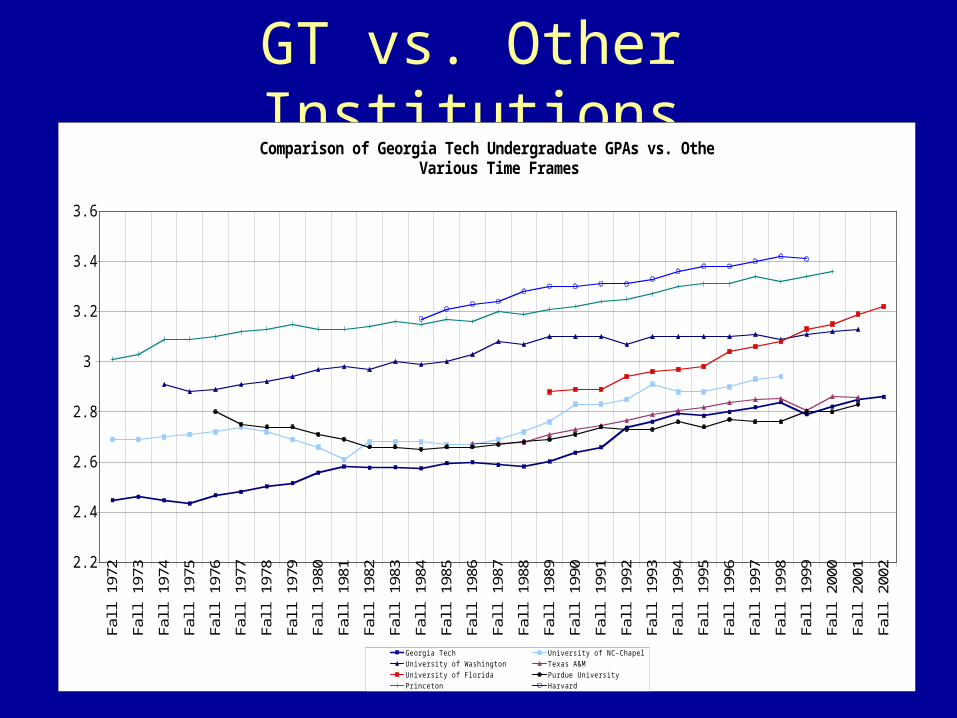
GT vs. Other InstitutionsComparison of Georgia Tech Undergraduate GPAs vs. Other Institutions
Various Time Frames
2.2
2.4
2.6
2.8
3
3.2
3.4
3.6
Fall
1972
Fall
1973
Fall
1974
Fall
1975
Fall
1976
Fall
1977
Fall
1978
Fall
1979
Fall
1980
Fall
1981
Fall
1982
Fall
1983
Fall
1984
Fall
1985
Fall
1986
Fall
1987
Fall
1988
Fall
1989
Fall
1990
Fall
1991
Fall
1992
Fall
1993
Fall
1994
Fall
1995
Fall
1996
Fall
1997
Fall
1998
Fall
1999
Fall
2000
Fall
2001
Fall
2002
Georgia Tech University of NC-Chapel HillUniversity of Washington Texas A&MUniversity of Florida Purdue University Princeton Harvard

Harvard’s Solution: Policy Change
• 15-point grading scale became the more common 4-point scale
• Honor degrees will be awarded to a limited percentage of each graduating class (20% summa cum laude and magna cum laude combined and 50% overall)

Where Does Georgia Tech Stand: Student Expectations
Fall 2000 FreshmenAnticipated
GPA All < 2.0 2.0-2.4 2.5-2.9 3.0-3.4 3.5-4.03.5-4.0 40.6% 11.4% 11.4% 16.1% 27.1% 34.1%3.0-3.4 53.3% 12.0% 19.0% 24.9% 24.3% 19.8%2.5-2.9 5.6% 7.9% 42.1% 23.7% 23.7% 2.6%2.0-2.4 0.2% 0.0% 100.0% 0.0% 0.0% 0.0%< 2.0 0.3% 50.0% 50.0% 0.0% 0.0% 0.0%
Cumulative Spring 2001 GPA

Correlation Between GT GPA and HSGPA
3.50
3.55
3.60
3.65
3.70
3.75
2.8 2.85 2.9 2.95 3 3.05 3.1
GT GPA
HS G
PA
Input Dynamics: High School GPA and Admissions Index
Freshman CohortsFall 1993-Fall 2002
High School GPA, Georgia Tech GPA, and Admissions Index
2.5
2.6
2.7
2.8
2.9
3
3.1
3.2
3.3
3.4
3.5
3.6
3.7
3.8
3.9
4
Fall
1993
Fall
1994
Fall
1995
Fall
1996
Fall
1997
Fall
1998
Fall
1999
Fall
2000
Fall
2001
Fall
2002
GT GPA HSGPA Admissions Index
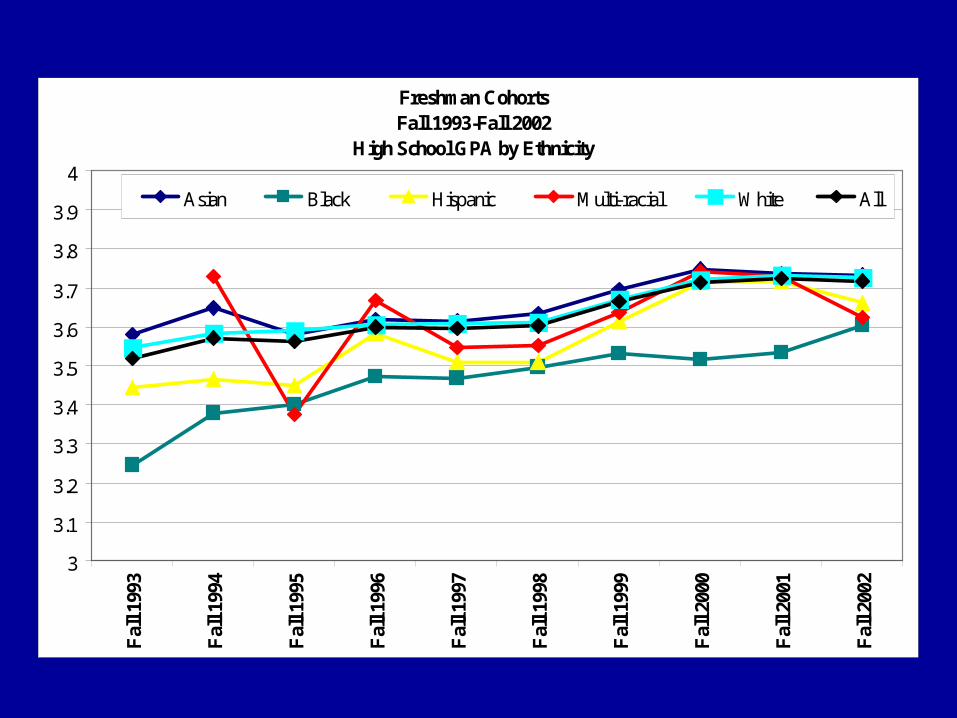
Freshman CohortsFall 1993-Fall 2002
High School GPA by Ethnicity
3
3.1
3.2
3.3
3.4
3.5
3.6
3.7
3.8
3.9
4
Fall
1993
Fall
1994
Fall
1995
Fall
1996
Fall
1997
Fall
1998
Fall
1999
Fall
2000
Fall
2001
Fall
2002
Asian Black Hispanic Multi-racial White All

Incoming Student Performance2002 Freshman Cohort
0
0.5
1
1.5
2
2.5
3
3.5
4
2 2.25 2.5 2.75 3 3.25 3.5 3.75 4
High School GPA
Fall
2002
GT
Cum
ulat
ive
GPA
1994 Freshman Cohorts
0
0.5
1
1.5
2
2.5
3
3.5
4
2 2.25 2.5 2.75 3 3.25 3.5 3.75 4
High School GPA
Fall
1994
GT
Cum
ulat
ive
GPA
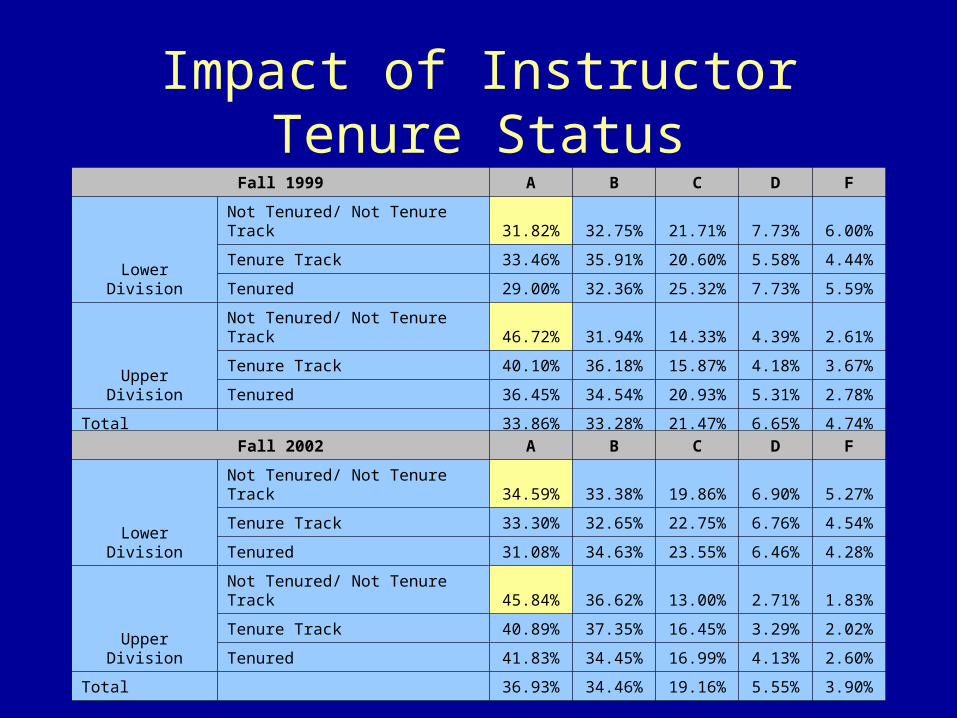
Impact of Instructor Tenure StatusFall 1999 A B C D F
Lower Division
Not Tenured/ Not Tenure Track 31.82% 32.75% 21.71% 7.73% 6.00%
Tenure Track 33.46% 35.91% 20.60% 5.58% 4.44%
Tenured 29.00% 32.36% 25.32% 7.73% 5.59%
Upper Division
Not Tenured/ Not Tenure Track 46.72% 31.94% 14.33% 4.39% 2.61%
Tenure Track 40.10% 36.18% 15.87% 4.18% 3.67%
Tenured 36.45% 34.54% 20.93% 5.31% 2.78%
Total 33.86% 33.28% 21.47% 6.65% 4.74%
Fall 2002 A B C D F
Lower Division
Not Tenured/ Not Tenure Track 34.59% 33.38% 19.86% 6.90% 5.27%
Tenure Track 33.30% 32.65% 22.75% 6.76% 4.54%
Tenured 31.08% 34.63% 23.55% 6.46% 4.28%
Upper Division
Not Tenured/ Not Tenure Track 45.84% 36.62% 13.00% 2.71% 1.83%
Tenure Track 40.89% 37.35% 16.45% 3.29% 2.02%
Tenured 41.83% 34.45% 16.99% 4.13% 2.60%
Total 36.93% 34.46% 19.16% 5.55% 3.90%

A42.0%
B36.6%
C16.5%
D3.3%
F1.5%
A47.3%
B34.2%
C14.0%
D2.9%
F1.5%
A51.9%
B33.4%
C11.8%
D2.0%
F1.0%
FY 1993
Georgia Tech 4000 Level Grade Distribution
FY 2002
FY 1999
Fiscal Year 1993, 1999, 2002
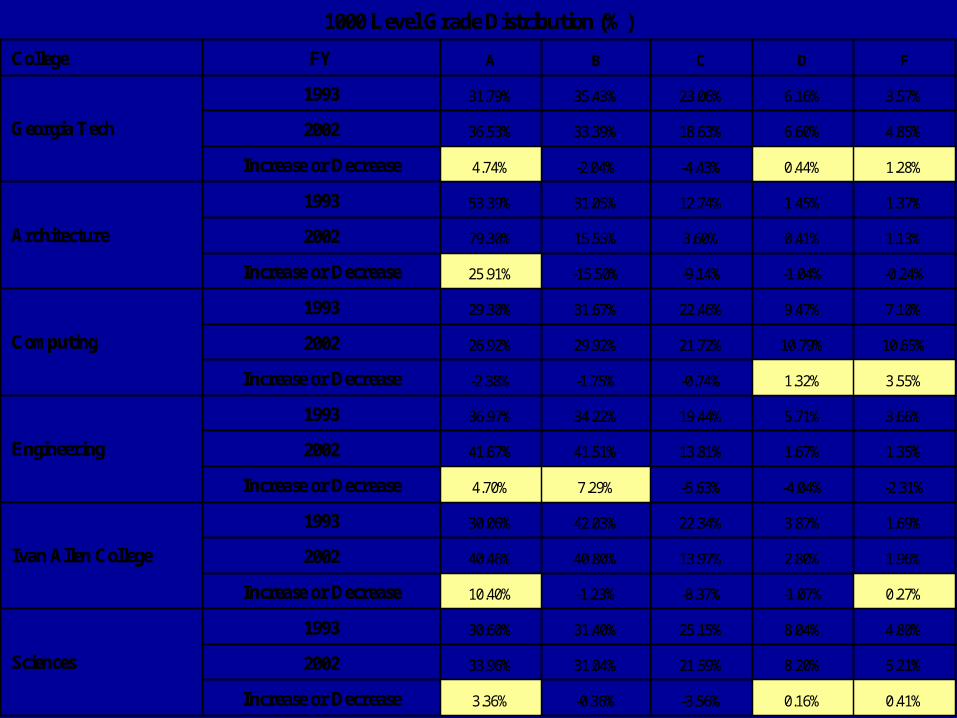
0.41%0.16%-3.56%-0.36%3.36%Increase or Decrease
5.21%8.20%21.59%31.04%33.96%2002
4.80%8.04%25.15%31.40%30.60%1993
Sciences
0.27%-1.07%-8.37%-1.23%10.40%Increase or Decrease
1.96%2.80%13.97%40.80%40.46%2002
1.69%3.87%22.34%42.03%30.06%1993
Ivan Allen College
-2.31%-4.04%-5.63%7.29%4.70%Increase or Decrease
1.35%1.67%13.81%41.51%41.67%2002
3.66%5.71%19.44%34.22%36.97%1993
Engineering
3.55%1.32%-0.74%-1.75%-2.38%Increase or Decrease
10.65%10.79%21.72%29.92%26.92%2002
7.10%9.47%22.46%31.67%29.30%1993
Computing
-0.24%-1.04%-9.14%-15.50%25.91%Increase or Decrease
1.13%0.41%3.60%15.55%79.30%2002
1.37%1.45%12.74%31.05%53.39%1993
Architecture
1.28%0.44%-4.43%-2.04%4.74%Increase or Decrease
4.85%6.60%18.63%33.39%36.53%2002
3.57%6.16%23.06%35.43%31.79%1993
Georgia Tech
FDCBAFYCollege
1000 Level Grade Distribution (%)
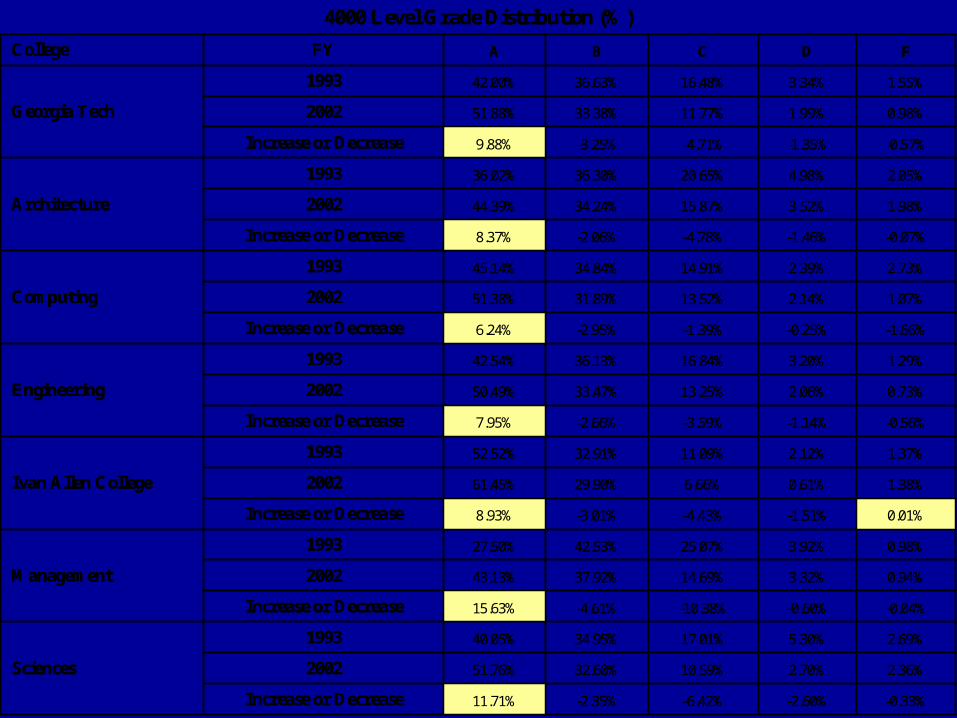
-0.33%-2.60%-6.42%-2.35%11.71%Increase or Decrease
2.36%2.70%10.59%32.60%51.76%2002
2.69%5.30%17.01%34.95%40.05%1993
Sciences
-0.04%-0.60%-10.38%-4.61%15.63%Increase or Decrease
0.94%3.32%14.69%37.92%43.13%2002
0.98%3.92%25.07%42.53%27.50%1993
Management
0.01%-1.51%-4.43%-3.01%8.93%Increase or Decrease
1.38%0.61%6.66%29.90%61.45%2002
1.37%2.12%11.09%32.91%52.52%1993
Ivan Allen College
-0.56%-1.14%-3.59%-2.66%7.95%Increase or Decrease
0.73%2.06%13.25%33.47%50.49%2002
1.29%3.20%16.84%36.13%42.54%1993
Engineering
-1.66%-0.25%-1.39%-2.95%6.24%Increase or Decrease
1.07%2.14%13.52%31.89%51.38%2002
2.73%2.39%14.91%34.84%45.14%1993
Computing
-0.07%-1.46%-4.78%-2.06%8.37%Increase or Decrease
1.98%3.52%15.87%34.24%44.39%2002
2.05%4.98%20.65%36.30%36.02%1993
Architecture
-0.57%-1.35%-4.71%-3.25%9.88%Increase or Decrease
0.98%1.99%11.77%33.38%51.88%2002
1.55%3.34%16.48%36.63%42.00%1993
Georgia Tech
FDCBAFYCollege
4000 Level Grade Distribution (%)

2
2.25
2.5
2.75
3
3.25
3.5
3.75
4
Air
For
ce A
eros
pace
Stu
d
Arc
hite
ctur
e
Bui
ldin
g C
onst
ruct
ion
City
Pla
nnin
g
Com
pute
r Sc
ienc
e
Hea
lth &
Per
form
ance
Sci
Indu
stri
al D
esig
n
Mili
tary
Sci
ence M
usic
Nav
al S
cien
ce
Aer
ospa
ce E
ngin
eeri
ng Bio
logy
Che
mic
al E
ngin
eeri
ng
Che
mis
try
and
Bio
chem
istr
y
Civ
il &
Env
iron
men
tal E
ngr
Ear
th &
Atm
osph
eric
Sci
Eco
nom
ics
Ele
ctri
cal &
Com
pute
r E
ngr
His
t, T
echn
olog
y &
Soc
iety
Indu
stri
al &
Sys
tem
s E
ngr
Inte
rnat
iona
l Aff
airs
Lite
ratu
re, C
omm
& C
ultu
re
Man
agem
ent
Mat
eria
ls S
cien
ce &
Eng
r
Mat
hem
atic
s
Mec
hani
cal E
ngin
eeri
ng
Mod
ern
Lan
guag
es
Phys
ics
Psyc
holo
gy
Publ
ic P
olic
y
Tex
tile
and
Fibe
r E
ngr
Ave
rage
Fall 1993 Fall 2002

Sources of Grade Inflation
• External– HSGPA– SAT– Admission Index– Proportion of Women
• Internal:– Variations by Dept.– Presence of Grade
Deflation in Some Units
– Impact of Instructors’ Tenure Status

Implications
SCHOOLS
EMPLOYERS
STUDENTS
FEEDBACK ANDPERFORMANCE ASSESSMENT
ASSESSMENT OFPROSPECTIVE EMPLOYEES
REPUTATION OFEDUCATIONAL INSTITUTIONS

Mitigation• Adoption of more clear and specific grade definitions• Adoption of a plus/minus grading system• Establishment of a University/Institute average GPA• Expanded transcript data• Changes to student honors• Broad dissemination of grading definitions and policies• Training for teaching assistants, adjunct faculty, and tenure-track
faculty• Self-calibration of grade distributions• External calibration of grade distributions• External enforcement of grade distributions• Standardized testing• Changes to student course evaluations

Report Outline
• Scope and Definitions• Grading at Georgia Tech
– Opinions• Analysis of Peer Institutions• Discussion
– Sources– Implications– Remedies
• Conclusions and Bibliography

Conclusions?
• Statistically, there is grade inflation• Peer comparison does not indicate cause for
alarm• Quality of incoming students is increasing • Lower level courses: quality of student
experience• Impact of tenure status of the instructors• Non-uniform departmental distribution