grade inflation in uk higher education ray bachan inflation in uk higher education ray bachan this...
TRANSCRIPT
Grade Inflation in UK higher Education
Ray Bachan
This paper examines the continual increase in the proportion of ‘good’ honour
degrees awarded by UK universities since the early 1990s. This trend has brought
with it the charge of ‘grade inflation’ that may be a result of falling standards in UK
higher education. This issue has been raised in the national press and in government
which brings into question the usefulness of the current degree classification system.
Using a stochastic frontier strategy and university-wide data we find evidence of
grade inflation in UK higher education since the mid-2000s after controlling for
changes in university efficiency in teaching and a rich array of factors assumed to
influence degree outcome. The data employed allows several other sub-themes to be
explored. We confirm the findings from previous research that a student’s pre-entry
A-level score, region of domicile and previous schooling impacting on degree
performance. This paper contributes to the relatively thin UK literature that exists on
this issue of ‘grade inflation’.
JEL I21
Key Words: Grade inflation, Stochastic Frontier, University Efficiency
Corresponding author:
Ray Bachan,
Brighton Business School,
University of Brighton,
Lewes Road, Brighton BN2 4AT
Email: [email protected]
1 Introduction
As UK higher education expanded in the 1990s there has been a corresponding increase in
the relative proportion of ‘good’ honour (or bachelor) degrees awarded. In the UK a ‘good’
degree is often taken as the award of either a first class honours degree (1st, the top
classification) or an upper second (2:1, the second best ranked classification). Recent
evidence suggests that the proportion of ‘good’ honour degrees awarded to new graduating
students by UK higher education institutions (HEIs) increased from 47.3% in 1994/95 to
61.4% in 2011/12. In absolute terms the number of ‘good’ degrees awarded increased by
113% over the period from 112,511 to 240,030 (HESA, 2012), see figure A1 in appendix 1.
This increase particularly since the early 1990s may imply a fall in educational standards
through more lenient marking (Johnes, 2004). The consequent compression of awards in the
top end of the degree class distribution has led some commentators to question whether the
current degree classification system provides correct signals on graduate quality and indeed
whether the current system of degree classification is fit for purpose (Smithers, 20111;
Gilleard, 20122; Elton, 2004; Sadler, 2009). Grade inflation has also been a particular feature
in the educational and national press3, and concern over the phenomenon has been expressed
by government. For instance, the incumbent Universities Minister, David Willets insisted that
the ‘whole system of degree classification does need reform’ (The Telegraph, January 12,
2012). We also note that the percentage of ‘good’ degrees awarded differs by university type
with ‘old’ and in particular Russell group universities awarding proportionally more ‘good’
degrees than their ‘new’ counterparts (see, figure A2 in appendix 1). Furthermore, graduates
in the social sciences and humanities tend to be awarded proportionally more ‘good’ degrees
than graduates in other fields (see, figure A3 in appendix 1). In the light of these issues the
UK government has recently recommended that a Higher Education Achievement Report
(HEAR) should be introduced in 2010/11 as ‘the key vehicle for measuring and recording
1 Mail Online, September 23, 2011
2 Carl Gilleard, The Telegraph, January 12, 2012
3See for example ‘Universities fix results in 'race for firsts'’ (Telegraph, July 15, 2013); ‘How to get a first-class
degree’ (The Telegraph, February 19, 2013); ‘British universities bend their rules to award more firsts’ (Sunday
Times, July 13, 2013); ‘Top jobs 'restricted to graduates with first-class degrees' (Telegraph, July 4, 2012);
‘University marking to be reviewed over grade inflation fears’ (Guardian, September 10, 2009);’Bursting
bubbles; education standards’ (Economist, September 29, 2007); ‘Degree grades ‘are too crude’’ (Times Higher
Education, May 7, 2004); ‘Grade expectations: university exams’ (Economist, March 20, 2004); ‘Tear up the
class system’ (Guardian, October 14, 2003); ‘Rise in good degrees not just grade inflation’ (Times Higher
Education, March 29, 2002).

student achievement’ and to be available alongside information on students’ degree class
(Universities UK, 2007:5).4
The primary focus of this paper is to examine ‘grade inflation’ in the UK using publically
available institution level data. These data provide information on degree classifications that
were awarded by pre-1992, post-1992 and post-2003 universities covering a seven year
period from 2006 to 2012 given data limitations.
This paper is arranged as follows. Section 2 provides a brief overview of the relevant
literature. Section 3 provides a description of the data employed in the empirical analyses.
The methodological framework is described in section 4 and the empirical results are
presented in section 5. The final section provides some concluding remarks.
2 Literature review
Although the literature on grade inflation using UK data is thin the phenomenon has been
widely researched in the US (see for example, Astin, 1998; Rosovsky and Hartley, 2002).
This literature points to several factors that are argued to have influenced the increase in the
GPA in many US universities these include the introduction of student assessment of
teaching (Anglin and Meng, 2000; Krautmann and Sander, 1999; Zangenehzadeh, 1988), and
the need to improve enrolments on specific undergraduate programmes (Jewell and
McPherson, 2012; Ewing, 2012; Ehrenberg, 2010; Ost, 2010; Rask, 2010; Achen and
Courant 2009; Sabot and Wakeman-Linn. 1991; Kolevson, 1981). Other authors offer a
labour market expalanation for the phenomena suggesting that graduates in diciplines that
command high wages, (e.g. STEM subjects) are awarded lower grades than graduates in
diciplines that command low wages (e.g., Arts graduates) to increase course enrollments
(Freeman, 1999). Further, it has been observed that graduates from elite ‘Ivy League’
universities are awarded highe grades than those from other types of US univerities and
colleges (Astin, 1998; Gose, 1997; Kuh and Hu, 1999; Popov and Bernhardt, 2013).5
4 See also ‘Degree classification is unfair to many graduates’ (Guardian, April 18, 2001)
5 A widely reported statistic is that 91 percent of seniors graduated with honors from Harvard in 2001 which was
largely due to a rise in A and B-grades awarded (Healy, 2001).

The issue of grade inflation is also of international concern although the literature is relatively
scarce (see for example, O’Grady and Guilfoyle, 2007, for Ireland; Dickson, 1984, for
Canada; Marginson,1995, for Australia; Bauer and Grave, 2011, for Germany; and Bagues et
al 2008, for Italy). It is also worth noting that Costrell (1994) develops a theoretical model to
describe how educational standards are set and demonstrates that if the policy maker seeks to
promote greater equality in outcomes (e.g., in terms of future labour market earnings) then
lower standards will be set.
It is argued that the upward drift in the proportion of ‘good’ degree classifications in the UK,
since the early 1990s, is due to the modularisation of degree programmes and changes in
assessment methods, with the introduction of coursework and assignments, without changes
in the boundaries delineating degree classifications (Elton, 1998; Gibbs and Lucas, 1997).
Yorke (2002) examined the association between subject field and the upward drift in ‘good’
degree classifications in the UK between 1994/95 and 1998/99. The author offers several
pedagogic reasons for the general upward trend. These include curricula development and
changing methods of assessment that focus on competences (i.e., leaning outcomes) with a
move from norm-referencing towards criterion-referencing (i.e., a move from assessing
students on their relative performance to an absolute measure of performance). Other
suggestions include greater student diligence, the closure of departments that under-perform
in the Research Assessment Exercise (RAE), the influence of external monitoring of
standards by government agencies (Elton, 1998), such as the Quality Assurance Agency
(QAA), and the pressures on universities to improve their ‘league table’ position. Yorke et
al., (2002) provide evidence to suggest that the nature of the marking schemes adopted (i.e.,
the use of percentage marking or grade-point scales) on specific modules in post-1992
universities between 1994/95 and 1998/99 influence the spread of marks and students’ overall
attainment. In general the adoption of percentage marking was found to narrow the spread of
marks and grade-point marking widens the spread. The marking processes adopted by
different subject areas provide a further reason why ‘good’ degree classifications differ
between various subject groupings and could contribute to grade inflation more generally.
The studies cited above suggest a number of factors that can potentially lead to grade
inflation. However, many of the empirical studies cited exploit cross-sectional or pooled data
and employ standard regression techniques. It is also important to note that much of the
economics literature on student academic achievement treats such achievement within the

framework of an educational production function, where students represents the ‘raw
materials’ to which educational resources or inputs are added to produce an output (e.g. final
‘grade’ or test scores). It is debatable if the grade inflation observed in these studies captures
‘pure’ grade inflation or a result of increased student effort or diligence or due to a better
quality student intake. In particular the rise in the proportion of ‘good’ degree classifications
may be a result of falling standards but may be conflated by a rise in university efficiency in
transforming raw material (students) into outputs (grades).
To address this issue Johnes and McNabb (2002) examines grade inflation in UK higher
education controlling for changes in university efficiency using a standard stochastic frontier
specification with a truncated half normal error term to control for changes in university
efficiency over time. The specification also included time dummies which if statistically
significant, it was argued, would indicate changes in standards and hence grade inflation. The
study focuses on two time frames 1973-1993 and 1995-2000 and exploited institution-level
data obtained from USR and HESA that included information on the proportion of ‘good’
degrees awarded by pre-1992 universities for the earlier period and pre-1992 and post-1992
universities in the latter period, excluding Scottish universities from both samples. The
estimation strategy employed, controlled for student-specific characteristics (gender, pre-
entry A-level scores, type of previous school and domicile), but excluded university controls.
The authors report no evidence of grade inflation in the later period. However, significant
coefficients on the time dummies were reported for the earlier period. Specifically, between
1984 and 1993 there was evidence of grade inflation with a 14% rise in students graduating
with a ‘good’ degree (measured by the estimated coefficients on the time dummies over this
period) that could not be attributed to changes in university efficiency which remained
relatively stable between 1973 and 1999 with a reduction in university efficiency in 2000.
However, it was also acknowledged that significant coefficients on the time dummies may
also indicate changes in student motivation possibly due, for example, to increasing labour
market returns for successful completion of an undergraduate programme, or a better quality
of student intake brought about by improving pedagogical processes used in lower levels of
education (assuming no grade inflation has occurred in at the tertiary or secondary level of
UK education)6 or the influence of external monitoring by the QAA. It should be noted that
6 It should be noted that A-level grade inflation has also been a concern in the UK for some time. It is reported
that there has been a steady rise in students achieving the top A-level grades since the 1980s (Tymms and Fitz-
Gibbons, 2001). More recently Smithers (2011) shows that between 1982 and 2012 the percentage of students

although the authors used panel data the frontier estimator employed could not exploit the
temporal (within) dimension of the data leading to the possibility of inefficient and
inconsistent parameter estimates.
In a more recent study Johnes and Soo (2013) exploit data from the Sunday Times University
Guide for the period 2005 to 2012 employing an institution-level true random effect
stochastic frontier estimator using a half-normal distribution for the efficiency term. They
specify an austere model controlling for student pre-entry (median) A-level point scores and
university characteristics including expenditure on educational facilities, staff-student ratio,
the institution’s RAE score, student satisfaction scores obtained from the NSS, and time
dummies. The study found A-level scores, student satisfaction, and expenditure on library
facilities impact positively and significantly on a ‘good’ degree classification. Although they
found significant coefficients on the time dummies these were negatively signed between
2006 and 2011. However, in their most basic specification controlling for pre-entry A-level
point scores and employing time (year) dummies grade inflation was observed in 2011 and
2012. They also found little evidence of changes in university efficiency which was on
average about 95% over the sample time frame.
3 Data
We examine grade inflation using university-level data. These data cover the academic years
from 2005/06 to 2011/12 inclusive and comprise 700 observations on 100 UK universities.
These universities include pre-1992 and post-1992 universities as well as post-2003
universities. We include variables that capture specific characteristics of the graduating
cohort including the gender mix, their region of domicile, the nature of degree programme
studied, the type of previous school attended, and the points for the pre-entry qualifications
attained. We also include information on university characteristics these include variables
that capture university size, expenditures on educational services and facilities, a measure of
university performance (i.e., first year student attrition), and university stability. The
passing with an A-grade increased from 8.9% in 1980 to 27% in 2011, with a slight 0.4% fall in 2012. The A-
level pass rate (grades E to A) also increased, from 68.2% to 98% in 2012. These trends lead to the annual
furore over A-level grade inflation reported in the popular media and expressed by government ministers and
contended by teaching unions. The important issue here is that if grade inflation at A-level is genuine then A-
levels grades may not send the correct signals on students’ ability/quality.
definitions of the variables employed in this analysis and their associated sources can be
found in appendix A2.
The sample time frame considered in the primary analysis is restricted to seven recent years
for several reasons. First, due to changes in the measurement of important variables over the
period (e.g., A-level pre-entry scores, see below); second, due to data availability, and third it
is necessary to use lags of up to three years for some variables so that the characteristics of
the graduating cohort are aligned as closely as possible with their entry characteristics.
Following previous studies (Johnes and Taylor, 1987; Johnes and Taylor, 1990; Yorke, 2002;
Johnes and NcNabb, 2002; McNabb, et al., 2002) we exclude Scottish universities for several
reasons. First, Scottish students admitted to Scottish universities can start their university
career at the age of 17 (usually 18 in most other UK universities). Second, it takes an extra
year to graduate from a Scottish university with a honours degree compared to other UK
universities and third, the award of non-honours degrees can be bestowed after three years of
study. This last fact increases the proportion of pass/ordinary degrees in the sample data. For
these reasons it is difficult to compare Scottish awards with those awarded in other UK
universities. We also exclude degrees programmes in Medicine, Architecture, and Education
which typically take longer than three years to complete.7 The summary statistics for the data
employed in the empirical analysis are reported in table 1 below. Column [1] shows summary
statistics for all universities and columns [2]-[4] contain summary statistics broken down by
university type.
We first note that pre-1992 universities comprise 50% of the sample with post-1992 and post-
2003 universities accounting for 32% and 18% respectively. On average, just under 60% of
honour degrees awarded by these universities are either first or upper second class. We also
note that pre-1992 universities award proportionately more ‘good’ degrees (65.8%) compared
to post-1992 universities (53.1%) and post-2003 universities (51.9%). These percentages are
in general agreement with the sector percentages reported in figure A1.
7 It is also possible that graduating students on other undergraduate programmes can take 4 years instead of 3
years to complete e.g., students on sandwich courses are generally required to undertake work placement and
some programmes require a year of study abroad, typically this extra year of study is undertaken in the 3rd
year.
From the information available it is not possible to separate those who take four years from those who take three
to graduate. However, the majority of students still complete their degrees after 3 years and we expect the
proportion of students graduating from English, Welsh and Northern Irish universities after 4 years to be
relatively small.

There are numerous studies on the effect of gender on degree performance. Several recent
studies suggest that females out-perform their male counterparts in achieving a ‘good’ degree
classification.8 We control for a possible gender differential in degree performance by
including the percentage of females graduating from each university and note that on average
a higher percentage of women (55.6%) graduate each year compared to their male
counterparts. This is true for all university types and is particularly evident in post-2003
universities where on average just over 62% of new graduates are female.
The literature also suggests that the rate of grade inflation differs across universities,
departments within universities as well as across different subject groups. In particular,
science and quantitative based programmes are generally found to be low grading fields. To
control for this effect we include information on the percentage of students graduating with a
Science degree from each university. These data reveal that just under a quarter of all
students graduate with a Science degree and we also note that the percentage graduating in
the sciences is higher in pre-1992 universities (28.2%) than in the other university types.
In general empirical evidence suggests that UK domiciled students perform better than their
non-UK counterparts.9 To examine this effect we include the percentage of UK-domiciled
students in each university. We note that 83.6% of students are UK-domiciled this percentage
is particularly high in post-2003 universities at 91.5%. This variable is lagged three years so
that it is aligned with the graduating cohort who began their degree typically three years
previously. Previous research has found that students from state schools perform better than
their counterparts from public schools (Naylor and Smith, 2004) whereas the opposite is also
found to be the case (Johnes and NcNabb, 2002). Therefore, the effect that this variable will
have on student performance and grade inflation is ambiguous a priori. This variable is also
lagged by three years to account for the cohort issue noted above. We note that on average
89.5% of new students enrolled in UK higher education were educated in state schools or
colleges and the percentage is highest in pre-2003 universities (91.5%). It would also appear
that pre-1992 universities enrol a significant proportion of students (17%) from the
independent sector.
8 See for example, (Barrow, et al., 2009; Woodfield and Earl-Novell, 2006; Naylor and Smith, 2004; McNabb,
et al., 2002). 9 See Makepeace and Baxter (1990), Marshall and Clinton (1995), Da Vita (2002), Leslie (2005), Morrison et
al., (2005), Barrow et al., (2009), Richardson (2010), and Iannelli and Huang (2013).

University admission is mostly determined by the grades achieved on a variety of pre-
university qualifications recognised by the higher education funding councils. These include
A-levels, Scottish Highers and vocational qualifications amongst others. The UK literature on
student performance finds that pre-entry points, typically A-level entry points, are a
significant predictor of undergraduate degree performance. It is important to note that the A-
level points system was revised in 2000 with the introduction of a new two-year A-level
structure: ‘syllabus 2000’. Students examined in 2002 were the first to be awarded points
according to the new points system and if they then pursued higher education they would
have typically graduated in 2005, assuming no ‘gap’ year. Moreover, entry points are only
available as a median value and it is difficult to covert previous A-level scores (where they
exist) to make them comparable to the current point system. This is one reason why the
sample period is restricted as noted earlier. To account for the variety of qualifications now
available in UK tertiary education and recognised as valid by the funding councils we use the
median entry points for all qualifications as a measure of student pre-entry quality. We argue
that including the points for all pre-entry qualifications as our measure of students’ prior
ability will more accurately reflect student quality than just focussing on A-level point scores
that are typically used in previous studies. Moreover, given the changing nature of
institutions now classified as ‘universities’ and the drive to widen participation it would seem
desirable to use a wider measure of student pre-entry quality. The median entry points for all
universities is around 295 (equivalent to about two grade Bs and one grade C at A-level) and
is lagged three years to coincide with the relevant graduating cohort. We note that on
average, and based on this measure, pre-1992 universities attract better qualified
undergraduate students than both post-1992 and post-2003 universities, on average.
Student evaluation of teaching was found to contribute to the grade inflation witnessed in the
US. We thus include the results from the National Student Survey (NSS) to account for this
possibility in the UK context. As noted earlier these data are only available for 2005 onwards,
the year the NSS was introduced. The NSS is conducted annually usually before the
publication of university examination results and are often presented through the popular
media in terms of ‘league tables’. Final year students are encouraged to complete an
anonymous questionnaire on line.10
We use the overall satisfaction score which is the
response to question 22 on the questionnaire: ‘Overall, I am satisfied with the quality my
10
The student questionnaire is available at: http://www.thestudentsurvey.com/, accessed 30/10/2013.
course’ which is reported as a percentage. The higher the percentage the greater is the
student’s level of satisfaction with the university and course. As the NSS score is published at
the end of the academic year this variable is lagged by one year to account for this fact. This
is a further reason why the sample data start in the academic year 2005/06. It is assumed that
the lower the NSS score the higher will be the percentage of ‘good’ degrees awarded in the
following year. It is assumed that faculty respond to poor NSS scores by being less harsh in
their grading the following year as universities, and departments seek to improve their
ranking in the NSS ‘league table’. It is possible that the upward drift in percentage share of
‘good’ degrees since the introduction of the NSS may be a response by faculty and
universities to improve their position in the ‘league table’ and to secure future income
streams from fee-paying students. Thus we may expect a negative association between
student satisfaction and good degrees. In other words, student dissatisfaction (a low NSS
score) may lead to more lenient marking the following year. We note that the overall level of
student satisfaction is just under 82% indicating a reasonable level of student satisfaction
across the sector. However, there is variation in student satisfaction across the sector with
students being more satisfied with their higher education experience in pre-1992 universities
than in either post-1992 and post-2003 universities.
In terms of university characteristics we include total university real expenditures (with the
base at 1998=100) on student academic facilities including library and IT expenditures and
the cost of academic service (e.g., academic staff costs and student support services). It is
anticipated that increases in these expenditures will enhance learning and improve grades.
We note that pre-1992 universities spend more on these services than other university types.
Similarly, the lower the staff-student ratio the better should be student performance. Smaller
tutorial/seminar sizes would offer greater opportunity for students to engage with tutors and
lessen the possibility of ‘free riding’ so that more effective learning can take place. We note
that on average there is between 17 and 18 students per member of teaching staff. A lower
staff-student ratio is found in pre-1992 universities with classes, on average, comprising
around 15 students per academic teaching staff with the ratio highest in post-2003
universities that operate with about 20 students per teaching staff. We also include a variable
that reflects university size, the percentage of FTE undergraduate students. On average, just
over 81% of all FTE students are on undergraduate pathways. This percentage is lowest in
pre-1992 universities (76.7%) and about 10 percentage points higher in post-2003 universities
(86.3%). We expect that this variable has a negative effect on degree classification.

We include a variable that can potentially capture student motivation and preparedness: the
percentage of student attrition in the first year. It is acknowledged that there are many factors
that can influence a student’s willingness to continue with their study beyond their first year
(see, for example, Smith and Naylor, 2001; Johnes, 1990; Johnes and Taylor, 1989). It is
possible that higher rates of student attrition imply that the students that graduate from the
cohort are of higher ability and more motivated than students that drop out. We would
therefore expect higher attrition rates to be positively associated with ‘good’ degrees if this
assumption is true. However, it is also possible that higher rates of attrition are associated
with the adoption of poor methods of teaching and learning in a particular university and
negatively associated with ‘good’ degrees. It can also indicate that high standards are applied
in the first year and if carried through to the final year can potentially negatively impact on
‘good’ degrees. Thus the anticipated sign on this variable is ambiguous. We note that, on
average, about 9% of students drop out after their first year of study and note that attrition
rates are higher in post-1992 and post-2003 universities compared to pre-1992 counterparts.
Finally, we include a variable to capture university managerial stability using Vice
Chancellors (VC) tenure. We argue that the longer the VC stays in post the more stable is
university policy and academic standards. The average VC tenure is just under five and half
years, with those administering pre-1992 being in post for a shorter time period compared to
those administering post-1992 and post-2003 universities.

Table 1 Summary Statistics
All
universities
[1]
Pre-1992
Universities
[2]
Post-1992
Universities
[3]
Post -2003
Universities
[4]
t-testb
Students
characteristics
% Good Degrees 59.27
(10.09)
65.81
(8.92)
53.15
(6.13)
51.97
(6.37) 18.59
% Female Graduates 55.57
(7.12)
53.36
(5.38)
55.32
(4.83)
62.16
(10.17) -4.41
% Science Graduates 24.75
(13.34)
28.24
(14.84)
24.04
(10.48)
16.33
(8.79) 3.69
% UK Domiciled
Students (lagged 3
years)
83.56
(9.54)
78.97
(10.02)
86.24
(5.74)
91.53
(5.89) -9.86
% Students from State
Schools (lagged 3
years)
89.51
(11.13)
82.97
(12.10)
95.51
(4.80)
96.99
(1.42) -14.77
Median entry points
(lagged 3 years)
294.88
(84.65)
358.52
(72.18)
234.02
(34.10)
226.30
(27.03) 24.14
Student Satisfaction
(NSS score lagged 1
year)
81.67
(5.30)
84.67
(4.39)
78.24
(3.97)
79.44
(4.91) 17.76
University
Characteristics
University type 1.00 0.50 0.32 0.18 N/A
ln Expenditure (in
1998 prices)
9.12
(0.71)
9.38
(0.65)
9.17
(0.51)
8.34
(0.54) 4.02
Staff-Student Ratio 17.64
(3.43)
15.40
(2.76)
19.72
(2.61)
20.16
(2.03) -18.69
% FTE Undergraduate
Students
81.13
(8.08)
76.67
(8.26)
85.18
(4.16)
86.32
(5.63) -14.28
% First Year drop Outs
(lagged 3 years)
8.89
(4.02)
6.36
(3.06)
11.26
(2.87)
11.71
(3.70) -19.12
VC tenure (years) 5.39
(3.79)
4.87
(3.42)
5.62
(3.82)
6.45
(4.43) -2.47
N 700 350 224 126 574
Notes to table:
(a) Standard deviations are reported in parenthesis for continuous variables.
(b) t-tests are used to test differences in means between pre and post 1992 universities. The appropriate critical
value at the 5% level of significance is ±1.96.
(c) Scottish Universities, the Open University, colleges of the arts, and small specialist colleges are also
excluded from the analysis due to their atypical undergraduate intake. The University of Buckingham which is a
private institution that awarded honour degrees after two-years of study is also excluded. (d) Students employed or in further study six months after graduation.
4 Methodology
The primary focus of this paper is to examine grade inflation in UK higher education from
2005/06 to 2011/12 inclusive. We examine the phenomenon using the university-wide data
that were described in the previous section. It was noted earlier that Johnes and McNabb
(2002) and Johnes (2004) suggest that the empirical literature on grade inflation, that
generally use educational production functions, fail to control for changes in university
efficiency and the ‘grade inflation’ observed may be a result of universities becoming more
technically efficient in teaching and learning. To account for changes in efficiency they use a
stochastic production frontier framework. Recent advances in stochastic frontier modelling
and software development have made it possible to estimate stochastic frontier models that
can exploit the temporal nature of the data (Belotti, et al., 2012 ; Belotti, 2012). We employ
the ‘true’ (university) random effects estimator (TRE) advanced by Greene (2005), which
develops previous stochastic random effects panel models in that it allows for time varying
university inefficiency to be distinguished from cross section university heterogeneity.
Following Johnes and Soo (2013), and for the purpose of comparison we transform the
continuous variables into natural logarithms. We also control for additional student and
university characteristics that have been found to influence student performance.
The basic model can be expressed as:
git = (α + ωi) + β' Xit + ∑ γ=
T
2ttt D + vit - uit i = 1,2,….,N t= 1,2,….,T [1]
vit ~ NID(0,σ��) and uit ≥ 0 where uit ~ N+(0,σ��)
where: git is the natural logarithm of the percentage of good degrees awarded by the ith
institution at time t; Xit is a k×1 vector of performance determining variables. Specifically,
the vector Xit includes variables that describe student specific characteristics (i.e., the natural
logarithm of; the percentage of female graduates, the percentage of science graduates, the
percentage of students who are UK domiciled (lagged 3 years), the percentage of students
from comprehensive schools (lagged 3 years), and the median A-level entry score of the
graduating cohort (lagged 3 years)). It also includes a set of variables that describe institution
specific characteristics (i.e., a university type dummy variable, the natural logarithm of

expenditure on student resources, the natural logarithm of the staff/student ratio, and the
natural logarithm of the percentage of undergraduate students). Vector X also includes the
natural logarithm of Vice Chancellor (VC) tenure (in years) to control for the level of
managerial stability in the ith
institution. We argue that this variable captures standards in
university policy that can be attributed to specific VCs. Variables that reflect university
performance are also included in the vector X and these too are transformed to natural
logarithms (i.e., student attrition rate, and the results from the NSS). A set of time specific
dummies (Dt) are employed to capture exogenous factors that affect all universities in their
award of ‘good’ degrees that are independent from changes in university efficiency (e.g., a
general fall in standards). The unknown parameters α, ωi, β, and γt are estimated using
simulated maximum likelihood techniques (for details see, Greene, 2005). In this
specification ωi, is a random effect and captures variation due to unobserved university-
specific heterogeneity not associated with university-specific variation in efficiency.
Moreover, it is assumed that ωi,, is uncorrelated with the included variables contained in the
vector X. This is a strong assumption and if it is not upheld then the coefficient estimates are
inconsistent. This should be borne in mind when interpreting the results.
The error term vit - uit in expression [1] is a composed error term and comprises of two
elements. The first term vit is symmetrically distributed and captures conventional exogenous
random shocks (i.e., effects not under the control of the institution) that vary across
universities. The second term uit is one-sided and assumed to capture changes in university
(technical) inefficiency over time. Several, distributions can be assumed for the one-sided
error term: half normal, truncated normal, and exponential (Greene, 2005; Belotti, et al., 2012
). However, there is no real guidance as to the choice between these distributions and we
assume a half normal distribution as this appears to be popular in the literature. It should be
noted that the assumed distribution may give different inefficiency estimates to the
alternatives available (Greene, 2005). Moreover, the identification of vit and uit can be
problematic if the shape of the distributions is similar or if one of these parameters account
for a large proportion of the overall distribution of the composed error. This latter issue is due
to the signal-to-noise ratio,(σ�� σ��⁄ ), which if vary large or very small will mean the
likelihood function will be relatively flat leading to convergence problems in the maximum
likelihood algorithm.11
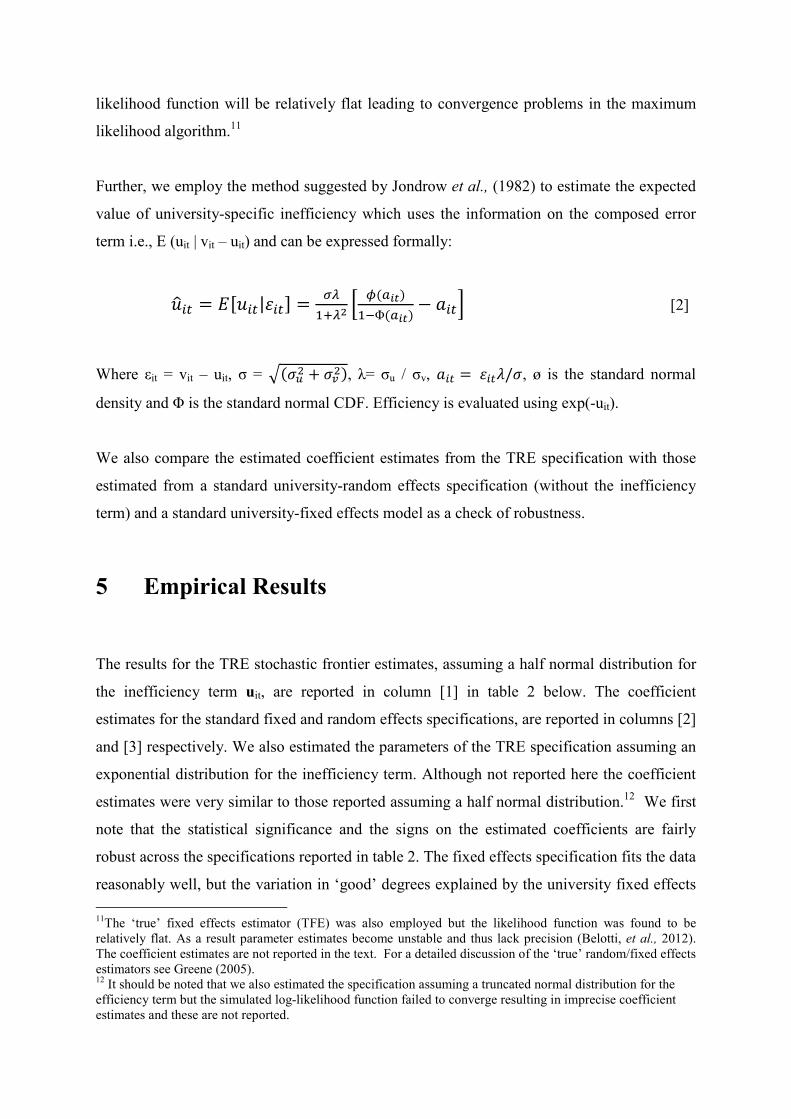
Further, we employ the method suggested by Jondrow et al., (1982) to estimate the expected
value of university-specific inefficiency which uses the information on the composed error
term i.e., E (uit | vit – uit) and can be expressed formally:
��� ����|��� ������ � ������
������� � ��� [2]
Where εit = vit – uit, σ = �!"� # !$��, λ= σu / σv, �� ��&/!, ø is the standard normal
density and Φ is the standard normal CDF. Efficiency is evaluated using exp(-uit).
We also compare the estimated coefficient estimates from the TRE specification with those
estimated from a standard university-random effects specification (without the inefficiency
term) and a standard university-fixed effects model as a check of robustness.
5 Empirical Results
The results for the TRE stochastic frontier estimates, assuming a half normal distribution for
the inefficiency term uit, are reported in column [1] in table 2 below. The coefficient
estimates for the standard fixed and random effects specifications, are reported in columns [2]
and [3] respectively. We also estimated the parameters of the TRE specification assuming an
exponential distribution for the inefficiency term. Although not reported here the coefficient
estimates were very similar to those reported assuming a half normal distribution.12
We first
note that the statistical significance and the signs on the estimated coefficients are fairly
robust across the specifications reported in table 2. The fixed effects specification fits the data
reasonably well, but the variation in ‘good’ degrees explained by the university fixed effects
11
The ‘true’ fixed effects estimator (TFE) was also employed but the likelihood function was found to be
relatively flat. As a result parameter estimates become unstable and thus lack precision (Belotti, et al., 2012).
The coefficient estimates are not reported in the text. For a detailed discussion of the ‘true’ random/fixed effects
estimators see Greene (2005). 12
It should be noted that we also estimated the specification assuming a truncated normal distribution for the
efficiency term but the simulated log-likelihood function failed to converge resulting in imprecise coefficient
estimates and these are not reported.

is high at 88%. We focus our discussion on the coefficient estimates reported in column [1]
for the TRE specification and compare these to those reported in columns [2] and [3].
In terms of student characteristics there is no statistical evidence that the gender-mix has a
significant impact on the percentage share of ‘good’ degrees. This result is robust across the
specifications reported in table 2, but runs counter to several studies that find a positive and
significant female effect on performance. These studies are generally based on earlier student
cohorts (Smith and Naylor, 2001; McNabb, et al., 2002; Barrow, et al., 2009). However, it
does confirm the finding of Johnes and McNabb (2002) of no significant female effect on
degree performance between 1995-2000 for pre-1992 and post-1992 universities (see also,
Rogers, 2007). The result reported here may reflect a quality shift with new female entrants
being of lower ability (in terms of pre-entry requirements) than females in the past and may
be a result of widening participation that has narrowed the gender differential in performance.
Students graduating with a Science degree are found to be less likely to achieve a ‘good’
degree compared to non-science graduates using the standard random effects specification.
The point estimate suggests that a ten-percent increase in the proportion of science students
reduces the number of ‘good’ degrees awarded by 0.17%, on average and ceteris paribus.
This particular result may suggest that Science subjects are more harshly marked or graded
than subjects in other subject fields and confirms the findings of existing research on this
issue noted earlier although the effect is fairly inelastic. However, this effect disappears when
we control for changes in efficiency which may suggest that more efficient teaching methods
or learning technologies have been successfully employed in this field of study. No
significant effect is detected using the standard fixed effects specification.
The estimated coefficient for UK domiciled students in the graduating cohort is statistically
significant. This particular result is in agreement with the general finding reported in the
empirical literature on student performance (see, for example, Morrison, et al., 2005; De
Vita, 2002). The point estimate suggests that a one-percent increase in the proportion of UK
domiciled students raises the share of ‘good’ degrees by 0.15%, on average and ceteris
paribus. A significant effect is also detected in the fixed effects specification reported in
column [3] however being UK domiciled has about two and a half times the impact on ‘good’
degrees compared to the effect detected using the TRE estimator. These results can be taken
to suggest that UK students have, on average, a relative advantage over non-UK domiciled
students. However, it should be noted that non-UK domiciled students include both EU and
non-EU students and there may be a wide variation in the performance of these students
compared to their UK counterparts.
We detect a significant negative association between the percentage of students enrolled from
state secondary schools in the same graduating cohort and the award of a good degree. The
coefficient estimate suggests that a one-percent increase in the proportion students from state
schools lowers the share of ‘good’ degrees by just under 0.27%, on average and ceteris
paribus and is in agreement with the finding of Johnes (2004), but runs counter to the results
reported by Smith and Naylor (2001; 2005) and McNabb et al, (2002) for earlier cohorts of
students typically drawn from pre-1992 universities. Smith and Naylor (2001; 2005) argue
that although students drawn from the independent sector perform better in terms of their A-
level points those admitted from state schools with similar A-level scores are of higher
relative ability and are more motivated than their independent sector counterparts while at
university and perform better on average than their independent counterparts. The results
presented here suggest that there has been some reversal of this between 2006 and 2012. A
similar effect is reported for the standard random effects specification, but the coefficient
estimate is insignificant in regard to the fixed effects specification in column [3]. This latter
effect may also be due to a high correlation between the fixed effects and this particular
variable and may reflect the fact that potential state-school/public-school educated enrolees
are attracted to certain types of universities based on unobserved university characteristics
(e.g., university reputation) not captured in these data.
Like many previous studies we find a significant and positive relationship between pre-entry
points and the percentage of good degrees awarded. For instance, a 10 percent increase in the
median entry points increases the share of ‘good’ degrees by about 2.5%, on average and
ceteris paribus. This also implies that a university with an average intake of students with
three A’s at A-level will award 4% more ‘good’ degrees than a university with an intake
profile which on average achieve three Bs at A-level and this result is intuitively plausible.
This effect is marginally smaller than the 5% differential reported Johnes and Soo (2013).13
13
A basic TRE specification using just the median entry score and year dummies as regressors was also
estimated, which concurs with the specification reported by Johnes and Soo (2013). The estimated coefficient
for the pre-entry point score was 0.378 [prob = 0.000], suggesting that universities with an average intake of
students with three As at A-level award 8.5% more ‘good’ degrees with institution with an average student

However, unlike Johnes and Soo (2013) we use the median UCAS entry points for all entry
qualifications, and control for a more comprehensive set of covariates and this difference may
have been anticipated. A similar entry score effect is detected for the random effects
specification reported in column [2] but is smaller in the fixed effects specification.
In contrast to Johnes and Soo (2013), we find no statistical evidence that student assessment
of teaching via the NSS impacts on degree outcome. Unlike the performance specifications
employed by Johnes and Soo (2013) the NSS score is entered using a one-period lag to reflect
the reality that the results from the survey are generally available after the final degree
classifications are awarded.14
We argue that lecturers alter their behaviour in response to the
NSS score the following year to improve ‘league table’ ranking. However, there appears to be
little incentive for faculty to behave in such a way. This is also in contrast to US studies
where the pursuit of high SET scores may induce faculty to free-ride particularly if faculty
pay, promotion or tenure is dependent on student satisfaction scores.
We also find that pre-1992 universities award more ‘good’ degrees compared to their post-
1992 counterparts. The point estimate, suggests that that this differential is 4.2 percentage
points, on average and ceteris paribus, using the TRE specification in column [1]. However,
a larger and significant effect is detected using the standard random effects estimator. This
result may be picking up a quality effect with students of higher calibre are admitted to pre-
1992 universities and we may expect better student outcomes for these universities. Very few
other university characteristics are found to be statistically associated with a ‘good’ degree
classification. There is no evidence that university spending on student related learning
facilities and the staff-student ratio is significantly associated with the share of ‘good’
degrees awarded and this is in contrast to the results reported by Johnes and Soo (2013) who
find marginal evidence that these factors impact on ‘good’ degrees. University size and our
proxy for university managerial stability exert no significant effect on the percentage of
‘good’ degrees awarded. The statistical insignificance of these factors is found across all
specifications reported in table 2. However, there is evidence that as the rate of student
attrition, in the first year, increases by one-percent ‘good’ degrees awarded falls by 0.03%, on
intake with three Bs, which is higher than that reported by Johnes and Soo (2013), but is in general agreement
with Smith and Naylor (2001a) 14
It is acknowledged that student satisfaction may enhance motivation and increase performance in the current
year, but it is not clear that students who report a high satisfaction score are necessarily more motivated than
less satisfied students.

average and ceteris paribus. This result may indicate that high standards are applied in the
first year and if carried through to the final year could potentially negatively impact on the
share of ‘good’ degrees awarded.
We now turn our attention to changes in educational standards and grade inflation. In terms
of standards we note that the size of the estimated coefficients on the academic year dummies
increase monotonically in all specification reported in table 2 since 2005/06. Using the TRE
specification reported in column [1] the estimated coefficients on the year dummies are
statistically significant from the academic year 2008/09 onwards after controlling for student
and university characterises, and most importantly university efficiency. The point estimate
on the 2011/12 dummy suggests that the proportion of ‘good’ degrees awarded increased by
about 9.6% since the academic year 2005/06 and this accounts for about four-fifths of the
12% increase in share of ‘good’ degrees over the sample period. Similar effects are noted
when the standard random and fixed effects estimators are employed, however the
coefficients on the year dummies become significant two-years earlier using these
specifications. This may be taken as evidence of falling standards that may have resulted in
the upward drift in the percentage of ‘good’ degrees awarded (i.e., grade inflation), and there
is robust evidence of grade inflation since the academic year 2008/09. However, these results
are in contrast to those reported by Johnes and Soo (2013) who find ‘negative’ grade inflation
after controlling for university expenditures on student facilities, entry scores, student
satisfaction and university research quality, but they do find some evidence of grade inflation
in 2011 and 2012 in their most austere model. Johnes and Soo (2013) argue that the grade
inflation observed in their data may be explained by the increase in tuition fees in 2006 and
2012. However, we feel the evidence presented here is more convincing evidence that this
may be the case. The difference between these results and those presented by Johnes and Soo
(2013) may be due to our use of more contextual data.

Table 2 True Random Effects, Standard Random Effects, and Standard Fixed Effects
Estimates (log form)
Variable Name
True University
Random Effects
(Half Normal) [1]
University
Random Effects
[2]
University
Fixed Effects
[3]
Students Characteristics
Ln (% Female Graduates) 0.077 (0.070) 0.078 (0.088) -0.140 (0.206)
Ln (% Science Graduates) -0.007 (0.009) -0.017 (0.009)* -0.015 (0.012)
Ln (% UK Domiciled Students)
(lagged 3 years) 0.151 (0.082)* 0.124 (0.098) 0.386 (0.180)**
Ln (% Students from State Schools) (lagged 3 years)
-0.268 (0.102)*** -0.253 (0.045)*** 0.078 (0.151)
Ln (Median entry points)
(lagged 3 years) 0.254 (0.046)*** 0.253 (0.045)*** 0.152 (0.051)***
Ln (NSS score) (lagged 1 year) 0.001 (0.102) -0.041 (0.099) -0.065 (0.107)
University Characteristics
Pre-1992 university 0.042 (0.019)** 0.054 (0.025)** †
Post-2003 university -0.025 (0.036) -0.037 (0.026) †
Post-1992 university f f †
Ln (expenditure (in 1998 prices)) -0.001 (0.011) -0.006 (0.723) -0.002 (0.018)
Ln (Staff-student ratio) -0.011 (0.027) -0.010 (0.029) -0.006 (0.034)
Ln (% FTE undergraduate students) -0.083 (0.107) -0.053 (0.125) 0.056 (0.170)
Ln (% First year drop outs)
(lagged 3 years) -0.032 (0.014)** -0.042 (0.015)*** -0.025 (0.014)*
Ln (VC tenure (years)) 0.0004 (0.0039) 0.0004 (0.0043) 0.003 (0.004)
Year Dummies
Year dummy 2012 0.096 (0.013)*** 0.103 (0.014)*** 0.116 (0.017)***
Year dummy 2011 0.054 (0.011)*** 0.068 (0.012)*** 0.078 (0.014)***
Year dummy 2010 0.031 (0.011)*** 0.046 (0.012)*** 0.052 (0.014) ***
Year dummy 2009 0.009 (0.009) 0.023 (0.009)** 0.032 (0.009)***
Year dummy 2008 0.003 (0.007) 0.014 (0.008)* 0.022 (0.008)***
Year dummy 2007 0.002 (0.009) 0.007 (0.007) 0.012 (0.007)
Year dummy 2006 f f f
σi † 0.067 0.153
σe † 0.056 0.056
rhoi † 0.589 0.882
Within-R2 † 0.314 0.337
ρ † † -0.039
!"�
0.081 (0.008) *** † †
!$� 0.029 (0.004) *** † †
!$�/!"
� 2.767 (0.011) *** † †
F-statistic§ / Wald test (�)� 665.83[0.000] 589.25 [0.000] 8.35 [0.000] §
Log likelihood -915.6472
1090.5931
Observations 700 700 700
Number of universities 100 100 100
Notes to table: (a) Robust standard errors corrected for clustering by university are reported in parentheses.
(b) * significant at 10%; ** significant at 5%; *** significant at 1%
(c) † denotes not applicable in estimation. (d) f denotes base category in estimation.
(e) σi and σe are the estimated standard deviations for the fixed effects and the error term respectively, rhoi is the fraction of the variation in
the dependent variable accounted for by the fixed effects an ρ is the correlation between the fixed effects and the included variables.

We now examine the evolution of technical efficiency over the sample time period. We
recover the uit based on the specification reported in column [1], using the method suggested
by Jondrow et al., (1982) noted earlier and use the transformation exp –(uit) to derive
efficiency scores for each university in the dataset. These are then averaged across
institutions for each year and the results are presented in figure 1 below. We first note that in
general (technical) efficiency has remained relatively constant over the period, averaging
about 94%, with a median of about 95% concurring with the level of efficiency reported by
Johnes and Soo (2013) using a TRE estimator. Similar results were found in the earlier study
by Johnes and McNabb (2002) using a standard stochastic frontier estimator who report that
mean technical efficiency remained relatively constant at around 93% between 1973 and
1993, but observed a small increase in inefficiency in 2000. The evidence presented in figure
1 suggests a small fall in efficiency across the sector between 2009 and 2012. However, the
general picture suggest that university efficiency was relatively high and stable since the mid-
2000s. The finding that university efficiency has remained stable over the time period
covered in the current analysis may help explain why the standard random effects
specification and fixed effects produced similar results to the TRE specification, and the use
of stochastic frontier models may be too elaborate in this application.
Figure 1 Average Technical Efficiency (%) UK Universities 2006-2012
80
85
90
95
100
Te
chn
ica
l E
ffic
ien
cy (
%)
2006 2008 2010 2012year
Median Efficiency Average Efficiency

6 Concluding Remarks
The purpose of this paper was to examine the possibility of grade inflation in UK higher
education. We employed a true random effects methodology to distinguish between changes
in university efficiency from unobserved university heterogeneity. We also employed a
standard random and fixed effects estimator to check for robustness. The results reported
suggest that the fixed effects specification is preferable to both random effects specifications,
given that efficiency seems to have remained relatively stable over the time horizon
considered in this analysis and has little influence on the share of ‘good’ degrees awarded.
The use of a stochastic frontier specification may therefore be unnecessary in this particular
application, and the results from other studies that use such a specification may be more
elaborate than required (Johnes and NcNabb, 2002; Johnes and Soo, 2013). The results also
confirm some standard findings in the literature. For instance, the importance of pre-entry
scores and student region of domicile are found to be important determinants of UK student
performance. There is no statistical evidence that female undergraduates outperform their
male counterparts, which may reflect a fall in average female ability and motivation, as more
females participate in higher education that are drawn from a wider ability distribution.
We find that as the proportion of students enrolled from state secondary schools and colleges
increase the proportion of good degrees awarded falls. This may be a consequence of the
policy of ‘widening’ participation with many more students from secondary schools and
colleges, and from low participation areas accessing higher education during the period
covered by these data. This result may also suggest that universities may be failing to cater
for a wider range of students that now differ in many respects, in terms of abilities and skills,
from students that have traditionally accessed UK higher education, even though spending on
student facilities and learning technologies have increased over the past decade (this may also
explain why spending on student facilities was found to be significant in the empirical
analysis). It may also simply indicate that on average state schooled students are of a lower
quality than those admitted from schools in previous decades. Student satisfaction scores
(lagged one year) and Vice Chancellor tenure were found to have no significant impact on
student performance.
Although very few university characteristics were found to be significantly associated with a
‘good’ degree classification we do find that for any particular graduating cohort the attrition
rate in their first year reduces the share of ‘good’ grades awarded. This effect may be due to
high standards being applied in the first year that are maintained over the remaining years of
study.
Finally our results show that grade inflation may have been present in English, Welsh and
Northern Irish universities since 2008/09 after controlling for university (technical) efficiency
(which remained relatively constant over the sample time frame), university type, university
and course characteristics and the characteristics of the graduating cohort. It seems plausible
that the observed upward drift in ‘good’ degree classifications may have been due to changes
in the methods of assessment and the result of modularisation of degree programmes (Yorke,
2002; Elton, 1998). If grade inflation is associated with lenient marking (or changes in the
curricula and the introduction of new methods of assessment) then it is possible that there
may be a conscious effort by UK universities to lower the ‘hedonistic’ price by lowering
standards to attract fee paying students. This may also reflect that the work of the QAA
and/or the external examination system that is a central feature of determining degree
classifications may not be as effective as it could be and this too may need re-appraising. Our
finding may suggest that employers’ concern over using UK degree classifications as signals
of graduate ability and current government efforts to review or replace the current system of
degree classification may not be misplaced.
The presence of grade inflation in UK higher education since 2008/09 is in agreement with
the evidence presented in the limited UK literature on this topic. It is acknowledged that the
time frame used in this analysis is short, covering only seven recent years, and we were
unable to control for important factors in the empirical analysis. These include a detailed
description of the learning, teaching, and the assessment strategies employed, at the course
level and a description of the individual characteristics of tutors over a longer time frame.
The inclusion of these factors in future empirical analyses would be a fruitful area for future
research. It would also be interesting, using a longer time frame, to examine the impact that
the recent increase in student tuition fees in the UK impacts on university grading in the
future.

References
Achen, A. & Courant, P., 2009. What are grades made of? Journal of Economic Perspectives,
23(3), pp. 77-92.
Anglin, P. & Meng, R., 2000. Evidence on grade inflation at Ontario's universities. Canadian
Public Policy, 26(3), pp. 361-368.
Astin, A., 1998. The changing American college student: thirty-year trends, 1966-1996. The
Review of Higher Education, 21(2), pp. 115-135.
Barrow, M., Reilly, B. & Woodfield, R., 2009. The determinants of undergraduate degree
performance: how important is gender? Brithish Educational Research Journal, 35(4), pp.
575-597.
Bagues, M., Labiniy, M. & Zinovyevaz, N., 2008. Differential grading standards and
university funding: evidence from Italy. CESifo Economic Studies, 54(2), p. 149–176.
Bauer, T. & Grave, B., 2011. Performance-related funding of universities: does more
competition lead to grade inflation? IZA Discussion Paper No 6073: Bonn:IZA.
Belotti, F., 2012. stochastic frontier analysis using Stata. Available at:
http://www.econometrics.it/?p=286 [Accessed 23 June 2013].
Belotti, F., Daidone, S., Bardi, G. & Atella, V., 2012 . Stochastic frontier analysis using
Stata. CESI Tor Vergata: Research Paper Series 10(12), No. 251.
Costrell, R., 1994. A simple model of educational standards. American Economic Review,
84(4), pp. 956-971.
De Vita, G., 2002. Cultural equivalence in the assessment of home and international business
management students. Studies in Higher Education, 27(2), pp. 221–231.
Dickson, V., 1984. An economic model of faculty grading practices. Journal of Economic
Education, 15(3), pp. 197-203.
Ehrenberg, R., 2010. Analyzing the factors that influence persistence rates in STEM
field,majors: introduction to the symposium. Economics of Education Review, 29(6), pp.
888–891.
Elton, L., 1998. Are UK degree standards going up, down or sideways? Studies in Higher
Education, 23(1), pp. 35-42.
Elton, L., 2004. Should classification of the UK honours degree have a future? Assessment
and Evaluation in Higher Education, 29(4), pp. 415-422.
Ewing, A., 2012. Estimating the impact of relative expected grade on student evaluations of
teachers. Economics of Education Review, 31(1), pp. 141– 154.
Freeman, D., 1999. Grade divergence as a market outcome. Journal of Economic Education,
30(4), pp. 344-351.
Gibbs, G. & Lucas, L., 1997. Coursework assessment, class size and student performance:
1984‐94. Journal of Further and Higher Education, 21(2), pp. 183-192.
Ginther, D. & Khan, S., 2004. Women in economics: moving up or falling off the academic
career ladder? Journal of Economic Perspectives, 18(3), pp. 193–214.
Gose, B., 1997. Efforts to curb grade inflation get an F from many critics. Chronicle of
Higher Education, 43(46), pp. 41-42.
Greene, W., 2005. Fixed and random effects in stochastic frontier models. Journal of
Productivity Analysis, 23(1), pp. 7-32.
Healy, P., 2001. Harvard figures show most of its grades are A's or B's. Boston Globe, 21
November.
Higher Education Statistical Agency, 2012. Headline statistics.
Available at: http://www.hesa.ac.uk [Accessed 12 10 2012].
Iannelli, C. & Huang, J., 2013. Trends in participation and attainment of Chinese students in
UK higher education. Studies in Higher Education, Available On line,
DOI:(:10.1080/03075079.2012.754863), pp. 1-18.
Jewell, R. & McPherson, M., 2012. Instructor-specific grade inflation: incentives, gender,
and ethnicity. Social Science Quarterly, 93(1), pp. 95-109.
Johnes, G., 2004. Standards and grade inflation. In: G. Johnes & J. Johnes, eds. The
International Handbook on the Economics of Education. Cheltenham: Edward Elgar, pp.
462-483.
Johnes, G. & NcNabb, R., 2002. Academic standards in UK universities: more for less or less
for more? Paper presented in the Royal Economic Society Conference, 27 March.
Johnes, G. & Soo, K., 2013. Grades across universities over time. Mimeo: Lancaster
University School of Mangement.
Johnes, J., 1990. Determinants of student wastage in higher education. Studies in Higher
Education, 15(1), pp. 87-99.
Johnes, J. & Taylor, J., 1987. Degree quality: an investigation into differences between UK
universities. Higher Education, 16(5), pp. 581-602.
Johnes, J. & Taylor, J., 1990. Performance indicators in Higher Education. Buckingham:
Open University Press.
Jondrow, J., Lovell, K., Materou, I. & Schmidt, P., 1982. On the estimation of technical
efficeincy in the stochastic frontier production function model. Journal of Econometrics,
19(2-3), pp. 233-238.
Krautmann, A. & Sander, W., 1999. Grades and student evaluations of teachers. Economics
of Education Review, 18(1), pp. 59-63.

Kuh, G. & Hu, S., 1999. Unraveling the complexity of the increase in college grades from the
mid-1980s to the mid-1990s. Educational Evaluation and Policy Analysis, 21(3), pp. 279-
320.
Leslie, D., 2005. Why people from the UK's minority ethnic communities achieve weaker
degree results than whites. Applied Economics, 37(6), pp. 619-632.
Makepeace, E. & Baxter, A., 1990. Overseas students and examination failure: a national
study. Journal of International Education, 1(1), pp. 36-48.
Marginson, S., 1995 . The decline in the standing of educational credentials in Australia.
Australian Journal of Education, 39(1), pp. 67-76.
Marshall, P. & Chilton, E., 1995. Singaporean students in British higher education: the
statistics of success. Engineering Science and Education Journal, 4(4), pp. 155–160.
McNabb, R., Pal, S. & Sloane, P., 2002. Gender differences in in student attainment: the case
of university students in England and Wales. Economica, 69(275), pp. 481-503.
Morrison, J., Merrick, B., Higgs, S. & Le Métais, J., 2005. Researching the performance of
international students in the UK. Studies in Higher Education, 30(3), pp. 327–337.
Naylor, R. & Smith, J., 2004. Determinants of educational success in higher education. In: G.
Johnes & J. Johnes, eds. International Handbook on the Economics of Education.
Cheltenham: Edward Elgar, pp. 415-461.
O’Grady, M. & Guilfoyle, B., 2007. Grade inflation in Irish universities (1994-2004).
Available at: http://www.stopgradeinflation.ie/Grade_Inflation_in_the_University_Sector.pdf
[Accessed 2 December 2012].
Ost, B., 2010. The role of peers and grades in determining major persistence in the sciences.
Economics of Education Review, 29(6), pp. 923–934.
Popov, S. & Bernhardt, D., 2013. University competition, grading standards, and grade
inflation. Economic Enquiry, 51(3), pp. 1764–1778.
Rask, 2010. Attrition in STEM fields at a liberal arts college: the importance of grades and
pre-collegiate preferences. Economics of Education Review, 29(6), pp. 892–900.
Richardson, J., 2010. Conceptions of learning and approaches to studying among White and
ethnic minority students in distance education. British Journal of Educational Psychology,
80(4), pp. S35-556.
Rogers, T., 2007. Measuring value added in higher education: a proposed methodology for
developing a performance indicator based on economic value added to graduates. Education
Economics, 15(1), pp. 55-74.
Rosovsky, H. & Hartley, M., 2002. Evaluation and the academy: are we doing the right
thing?
Available at:
http://www.amacad.org/publications/monographs/Evaluation_and_the_Academy.pdf
[Accessed 13 September 2013].
Sabot, R. & Wakeman-Linn, J., 1991. Garde inflation and course choice. Journal of
Economic Perspectives, 5(1), pp. 159-170.
Sadler, D. R., 2009. Grade integrity and the respresentation of academic achievement. Studies
in Higher Education, 34(7), pp. 807-826.
Smithers, A., 2011. A-levels 2011. Centre for Education and Employment: Univesity of
Buckingham.
Smith, J. & Naylor, R., 2001. Determinants of degree performance in UK universities: a
statistical anaysis of the 1993 cohort. Oxford Bulletin of Economics and Statistics, 63(1), pp.
200129-60.
Smith, J. & Naylor, R., 2005. Schooling effects on subsequent university performance:
evidence for the UK university population. Economics of Education Review, 24(5), pp. 549-
562.
Tymms, P. & Fitz-Gibbons, C., 2001. Standards, achievement and educational performance:
a cause for celebration? In: R. Phillips & J. Furlong, eds. Education, reform and the state: 25
years of politics, policy and practice . London: Routledge Falmer, pp. 156-173.
Universities UK, 2007. Beyond the honours degree classification: Burgess Group Final
Report, London: Universities UK.
Woodfield, R. & Earl-Novell, S., 2006. An assessment of the extent to which subject
variation between the arts and sciences in relation to the award of a first class degree can
explain the 'gender gap' in UK universities. British Journal of Sociology of Education, 27(3),
pp. 355-372.
Yorke, M., 2002. Degree classifications in English, Welsh and Northern Irish Universities:
trends, 1994-95 to 1998-99. Higher Education Quarterly, 56(1), pp. 92-108.
Yorke, M. et al., 2002. Does grading method influence honours degree classification?
Assessment & Evaluation in Higher Education, 27(3), pp. 269-279.
Zangenehzadeh, H., 1988. Garde infaltion: a way out. Journal of Economic Education, 19(3),
pp. 217-226.

Appendix A1
Figure A1: Honour Degree (Bachelors) Classifications (%)
All UK HEIs 1994/95 - 2011/12
Notes: All institutions include pre-1992, post-1992, and post-2003 universities, the Open University,
Colleges of the Arts, and small specialist colleges, but exclude degrees awarded in Medical Schools.
Figure A2 Good Degree Classifications by University Type (%) 1995/96 to 2011/12
Note: All universities include post-1992, pre-1992, and post-2003 universities only and the
degrees awarded by the Open University, Colleges of the Arts, and small specialist HEIs are
excluded.
'good' degrees
2:1
1st
3rd
0
10
30
20
40
50
60
fin
al de
gre
e c
lassific
atio
ns (
%)
1994 1996 1998 2000 2002 2004 2006 2008 2010 2012
year
'Good' degrees 1st class degrees
Upper second degrees 3rd class degrees
Source: Higher Education Statistical Agency (various years)available at:http://www.hesa.ac.uk/index.php/content/view/1973/239/
Russell Group
Pre 1992
All
Post 1992
Post 2003
40
45
50
55
60
65
70
75
1994 1996 1998 2000 2002 2004 2006 2008 2010 2012year
All universities Pre 1992 universities
Post 1992 universities Post 2003 universities
Russel Group universities
Source: Students in Higher Education (HESA, various years)
'goo
d' de
gre
es (
%)

Appendix A1 (cont.)
Figure A3: Good Degrees Awarded by Subject Field (%) 1994/95 to 2011/12
Notes:
Social Sciences and Humanities include: Sociology, Economics, Political Sciences, Humanities,
and Languages.
Physical Sciences include: Biological Sciences, Physics, Mathematics, Computer Science, and
Engineering, but excludes Medical, Veterinary and Agricultural related degrees.
Law includes all broadly based Law programmes.
Business and Administrative Studies include: Business Studies, Marketing, Accounting, Office
Skills, Human Resource Management, Management Studies, Finance, and other broadly based
Business programmes.
Social Sciences and Humanities
Law
Physical Sciences
Business
40
50
60
70
Go
od
Deg
rees (
%)
1994 1996 1998 2000 2002 2004 2006 2008 2010 2012year
Social Sciences and Humanities Physical Sciences
Law Business & Administrative Studies
Source: Higher Education Statistical Agency (various years)available at:http://www.hesa.ac.uk/index.php/content/view/1973/239/

Appendix 2
Variable Definitions
Variable Definition Source
% good
degrees
Percentage of 1st Class and upper second (2:1)
awarded in year of observation (leaving year)
Higher Education Statistical Agency (HESA)
% Female
Graduates
Percentage of FTE HE Female students graduating
in year of observation
HESA Students in HE
% Science
Graduates
Percentage of FTE students on science related
undergraduate programmes excluding medically
related subjects relative to Arts undergraduate
programmes
Science subjects include: Biological sciences; Veterinary science; Agriculture & related sciences;
Physical sciences; Mathematical sciences; Computer science; Engineering & technology.
Arts Subjects include: Architecture, building & planning; Social studies; Law; Business &
administrative studies; Mass communications & documentation; Languages; Historical & philosophical
studies; Creative arts & design; Education.
% UK
Domiciled
Students
Proportion of FTE undergraduate students
domiciled in the UK to all undergraduates.
HESA Students in HE: FTE undergraduate (UG) students.
UK domiciled students are those whose normal residence is in the UK (inc. Guernsey, Jersey and the
Isle of Man)
European Union (EU) students are those whose normal residence is in countries which were European
Union (EU) members as at 1 December of the reporting period.
Non-European Union students are those whose normal residence prior to commencing their programme
of study in the UK resided outside the EU.
% Students
from State
Schools
Percentage of young full-time undergraduate
entrants from state schools or colleges
Higher Education Statistical Agency (HESA)
Performance Indicators: Table T1b - Participation of under-represented groups in higher education:
Young full-time undergraduate entrants. Available at: www.hesa.ac.uk/pis/urg
Pre-entry
points
Median entry tariff points of students on
admission to specific university
The data are compiled as part of the National Student Survey (NSS) and available on the Higher
Education Funding Council for England’s (HEFCE) website:
http://www.hefce.ac.uk/whatwedo/lt/publicinfo/nationalstudentsurvey/nationalstudentsurveydata/
ln Expenditure Natural logarithm of real total expenditure
(£’000) on academic services (1998=100)
Expenditures on: Central Libraries & Information Services; Central Computer & Computer Networks;
and other academic services. Including Staff costs (Academic/Other Academic /Other service staff);
Other expenses and depreciation of equipment).
2002/03 Finance Return (£000s) Table 6 Expenditure by Activity: Academic Services
Staff-Student
Ratio
Numerator: Total FTE of students studying at
higher education institutions.
Denominator: Total FTE of teaching /teaching and
research academic staff and atypical teaching
HESA: Students and staff in HE

Variable Definition Source
staff.
% First Year
Drop Outs
Percent of full-time first degree entrants who are
no longer in HE
Performance Indicators: Table T3a - Non-continuation following year of entry: Full-time first degree
entrants. Available at: www.hesa.ac.uk/pis/urg
NSS student
satisfaction
score
The average value of overall student satisfaction
with their programme of study measured on a
scale of 0-100. The higher the rating the better is
students’ overall satisfaction with the teaching and
overall learning experience.
The data can be found on the HEFCE website:
http://www.hefce.ac.uk/whatwedo/lt/publicinfo/nationalstudentsurvey/nationalstudentsurveydata/ and
includes the response to question 22 on the student questionnaire ‘Overall, I am satisfied with the
quality my course’ that is used in the analysis. It should be noted that these scores were registered on a
scale from 1-5 in 2005 and 2006 and the results were multiplied by 20 to make them comparable to
satisfaction ratings from 2007 onwards.
VC Dummy for change of Vice Chancellor Whos Who (various years) An Annual Biography, London: A & C Black, and university websites.