gps applications for geodynamics and earthquake - annual reviews
TRANSCRIPT

January 6, 1998 23:45 Annual Reviews SEGATEXT.TXT AR29-10
Annu. Rev. Earth Planet. Sci. 1997. 25:301–36Copyright c© 1997 by Annual Reviews Inc. All rights reserved
GPS APPLICATIONS FORGEODYNAMICS ANDEARTHQUAKE STUDIES
Paul SegallDepartment of Geophysics, Stanford University, Stanford, California 94305;e-mail: [email protected]
James L. DavisHarvard-Smithsonian Center for Astrophysics, 60 Garden Street, Cambridge,Massachusetts 02138; e-mail: [email protected]
KEY WORDS: crustal deformation, plate motions, volcanos, space geodesy, postglacial rebound
ABSTRACT
Geodetic measurements obtained with the Global Positioning System (GPS) areincreasingly more widely applied in geophysical studies. In this paper, we re-view the changes to the technology of GPS geodesy over the last five years thatare responsible for this increased applicability. We survey geophysical inves-tigations employing GPS to measure coseismic, postseismic, and interseismicdeformation; plate motion and crustal deformation at plate boundaries; volcanodeformation; and the deformation associated with glacial isostatic adjustment andits application to sea-level studies. We emphasize the use of GPS determinationsfor the modeling of this wide variety of geophysical phenomena. We also discussthe recent advent of permanent GPS networks for regional geophysical studies,as well as the possible future of GPS surveying in light of the recent advances.
INTRODUCTION
The Global Positioning System (GPS), designed by the US Department ofDefense for military and civilian navigation and positioning, has become thegeodetic method of choice for studying a wide range of geophysical phenomena.GPS measurements are now in use to determine the motion of the Earth’stectonic plates, to study deformation around active faults and volcanos, and tomeasure the adjustment of the Earth’s surface due to past and present changes in
3010084-6597/97/0515-0301$08.00

P1: SDA/mkv P2: rpk/plb/vks QC: MBL/agr T1: MBL
March 27, 1997 9:30 Annual Reviews SEGATEXT.TXT AR29-10
302 SEGALL & DAVIS
the mass of the world’s ice sheets. GPS is used in combination with tide gaugesto monitor global changes in sea level. Because GPS signals are measurablydelayed as they pass through the earth’s atmosphere, GPS measurements areeven able to contribute to atmospheric studies.
Several reasons contribute to the tremendous growth in GPS research. GPSprovides three-dimensional relative positions with the precision of a few mil-limeters to approximately one centimeter over baseline separations of hundredsof meters to thousands of kilometers. The three-dimensional nature of GPSmeasurements allows one to determine vertical as well as horizontal displace-ment at the same time and place. Previously, horizontal measurements wereoften made by trilateration and vertical measurements by spirit leveling. Thefact that the two data types were almost never collected at the same time andplace complicated analysis considerably. Furthermore, vertical and horizontalinformation together often place more robust constraints on physical processesthan do either data type alone. GPS receivers and antennas are portable, operateunder essentially all atmospheric conditions, and do not require intervisibilitybetween sites.
The primary reason for the growth in crustal deformation research with GPS,however, is the fact that the technique puts an inexpensive, precise geodetictool in the hands of scores of university and other research groups. Unlikeother space geodetic techniques, such as Very Long Baseline Interferometry(VLBI) and Satellite Laser Ranging (SLR), that require large facilities andbudgets, GPS measurements can be collected by small teams with modestbudgets. For this reason, GPS has essentially replaced mobile VLBI and SLRfor the study of plate motions and plate boundary deformation. GPS has alsolargely replaced trilateration and, to a lesser degree, spirit leveling in the study ofcrustal deformation associated with earthquakes and volcanos. For example, thehighly successful Crustal Strain Project of the US Geological Survey switchedfrom a ground-based laser distance measuring device to GPS in the late 1980s.
Strainmeters still provide far greater strain sensitivity than does GPS, butthey cannot offer the spatial coverage and long-term stability of GPS. Inter-ferometric Synthetic Aperture Radar (SAR) measurements are tremendouslyexciting because of their unparalleled spatial coverage. Interferometric SARand GPS are complementary in that GPS provides long-term stability, vectordisplacements, and better temporal coverage as compared to the extensive spa-tial coverage provided by SAR. Because both GPS and SAR (as well as VLBI)involve the propagation of electromagnetic signals, they share related path de-lays through the electrically neutral lower atmosphere. Thus, results from onesystem are directly relevant to the others, and presently strong interest exists inusing GPS estimates of atmospheric water vapor to correct SAR images for thevariable path delay induced by water vapor.

P1: SDA/mkv P2: rpk/plb/vks QC: MBL/agr T1: MBL
March 27, 1997 9:30 Annual Reviews SEGATEXT.TXT AR29-10
GPS APPLICATIONS 303
GPS has already had a significant impact on the earth sciences, and a largebody of literature on the technique and results is available. Rather than attemptto comprehensively review this body of work, we focus here on representativeresults of recent (post-1991) solid earth studies employing GPS. We do notcover developments in the many other scientific applications of GPS, such asGPS meteorology. We begin by briefly reviewing changes in the technologyand our understanding of error sources during the past five years.
SURVEYING WITH GPS: TECHNOLOGY
Although the GPS technique remains fundamentally the same as that describedby Hager et al (1991) and Dixon (1991), many of the particulars have changed.[The reader is referred to these papers as well as to books by Hofmann-Wellenhof et al (1994), Leick (1995), and Parkinson et al (1996) for a thoroughdescription of the GPS system.] The situation only five years ago, as describedby Dixon (1991), consisted of 15 GPS satellites in orbit. Selective availability(SA) had been enabled, anti-spoofing (AS) had not. Satellite coverage limitedthe length of the observing session to 7–8 h per day, and most published workstill relied on the four-satellite–maximum TI-4100 GPS receiver. The currentsituation is quite different now, as discussed below.
What is the demonstrated accuracy of GPS? Five years ago, a great dealof effort was focused on this question. Nearly every article included a plotof (usually horizontal) repeatabilities of site position vs baseline length. Re-peatability is usually defined to be the root mean square (rms) residual aboutthe best-fit straight line. The translation from “repeatability” to “accuracy” isnot straightforward. For example, GPS and VLBI determinations have neverreally agreed at a level better than 10 mm or so (e.g. Larson & Agnew 1991).Since the early 1990s, publications have tended to focus on specific subjects,examples of which are orbits (e.g. Beutler et al 1996; Fliegel et al 1992), ef-fects of precipitation (e.g. Tranquilla & Al-Rizzo 1993) and snow accumulation(e.g. Jaldehag et al 1996), and atmospheric pressure loading (e.g. vanDam et al1994). (This latter is an “error” only insofar as it is ignored in the models fortime-dependent station position.) Heflin et al (1992), with a still-incompletesatellite constellation, reported a short-term (three week) rms misfitσ aboutthe weighted mean, which varied linearly with baseline lengthL
σ = a+ bL, (1)
with a = 2 mm andb = 4 parts-per-billion (ppb), for baselines in the northernhemisphere withL < 12,000 km. (Other forms forσ have been used in theliterature, includingσ 2 = a2+ b2L2.) More recently, Jaldehag (1995) reportedon long-term (two year) repeatability from the Swedish permanent GPS network

P1: SDA/mkv P2: rpk/plb/vks QC: MBL/agr T1: MBL
March 27, 1997 9:30 Annual Reviews SEGATEXT.TXT AR29-10
304 SEGALL & DAVIS
Figure 1 Weighted rms misfit about the best fit line for (a) baseline length and (b) verticalcomponent of the baseline vector, for the 21-site Swedish permanent GPS network (Jaldehag1995). Included in the analysis were several European sites of the International GPS Service forGeodynamics (IGS).
and found, for the horizontal,a = 2.6 mm andb = 0.8 ppb, and, for the vertical,a = 6.8 mm andb = 1.7 ppb, for baselines up to∼4000 km (Figure 1).Assuming that the differences between the GPS and VLBI determinations lieeither with the VLBI system or the tie between reference points, then it seemsclear that individual GPS measurements across regional scales have accuraciesof ∼2–5 mm for the horizontal components and are a factor of 3 worse for thevertical components.
Note that these conclusions are for “permanent” GPS networks. Campaign-style measurements are inevitably less precise owing to errors in centering theGPS antenna and measuring its height over the benchmark. Precision in dailyposition determinations decrease, although slowly, as the length of observingsessions decreases from 24 h. Longer observing sessions tend to average out

P1: SDA/mkv P2: rpk/plb/vks QC: MBL/agr T1: MBL
March 27, 1997 9:30 Annual Reviews SEGATEXT.TXT AR29-10
GPS APPLICATIONS 305
signal multipath (see below), and offer improved ambiguity resolution andestimation of atmospheric delays. So-called rapid-static (e.g. Merminod &Rizos 1994) or kinematic (e.g. Lu & Lachapelle 1992) methods have achievedcentimeter-level horizontal precision on short to intermediate baselines.
In the remainder of this section, we focus on four areas that have evolvedsignificantly in the last several years. These areas are (a) the GPS constellation,including the impact of broadcast signal degradation and encryption; (b) GPSreceivers and antennas, with a discussion of errors caused by antenna phase-center variations, multipath, and electromagnetic coupling; (c) available globalinfrastructure for GPS geodesy; and (d) atmospheric propagation delay, one ofthe most important sources of error in the analysis of GPS data. Of course,this is far from an exhaustive list of all issues relevant to the technology ofGPS surveying. Blewitt (1993), for example, discusses ambiguity resolution,treatment of clock errors, and surveying methods, and because of the importantchanges to GPS in the last several years, all these topics could be revisited here.Instead, our treatment is limited to several important topics, and the discussionof the detailed implications for GPS surveying methods and technology can befound in the cited works.
The GPS ConstellationThe 24-satellite GPS network was first realized in July 1992. It is difficult tooverestimate the impact that the increased satellite coverage has had, not onlyon logistical planning for a measurement campaign, but also on the accuracyachievable in parameter estimates (e.g. Santerre 1991) and, ultimately, on thekinds of science to which it is possible to apply GPS. For example, continuoussatellite coverage enables subdaily, continuous estimation of position (Genrich& Bock 1992; Elosegui et al 1996) and atmospheric water vapor and temperature(e.g. Yuan et al 1993; Rocken et al 1995). The improved geometric coverageglobally has also enabled the development of “fiducial-free” network solutions(e.g. Heflin et al 1992).
The related issues of selective availability (SA) and anti-spoofing (AS) con-tinue to be concerns in geodetic applications. Both SA and AS were imple-mented for US national security reasons, and both limit the accuracy of theGPS technique for certain applications. SA degrades the quality of the broad-cast satellite position information and clock corrections, as well as the effectivesatellite oscillator frequency. This “dithering” introduces noise to the measuredcarrier beat phases, with changes in the transmitted L1 frequency, for example,of up to 1 Hz (Feigl et al 1991). Several schemes have been developed for deal-ing with this aspect of SA (e.g. Feigl et al 1991; Rocken & Meertens 1991).For geodetic applications in which double-differencing (or its equivalent) canbe applied to synchronized observations (e.g. Hofmann-Wellenhof et al 1994),

P1: SDA/mkv P2: rpk/plb/vks QC: MBL/agr T1: MBL
March 27, 1997 9:30 Annual Reviews SEGATEXT.TXT AR29-10
306 SEGALL & DAVIS
the effect of SA is nearly negligible (Rocken & Meertens 1991). The statedpolicy of the US government is to discontinue the use of SA “within the nextdecade” (Office of Science Technology Policy 1996).
AS involves the encryption of the precise code (P-code). The coarse ac-quisition code (C/A) is still available when AS is enabled. Many of the earlyhigh-precision GPS receivers required acquisition of the P-code. One of theinitial responses to AS was the development of “squaring” receivers, which pro-vided C/A code pseudoranges (on the L1 channel only) and half-wavelengthL2 carrier phases. Halving the wavelength, however, makes resolution of inte-ger phase ambiguities much more difficult. More recently, manufacturers haveadopted a variety of methods for delivering full wavelength L2 phase data aswell as dual frequency pseudorange, even in the presence of AS (e.g. Hofmann-Wellenhof et al 1994). The observables obtained in periods of AS are somewhatnoisier, with a degradation of the signal-to-noise ratio of 14–30 dB, dependingon the method used (Hofmann-Wellenhof et al 1994). This degradation has acascading effect greater than that suggested by the propagation of larger phaseuncertainties, because these increased uncertainties hinder the elimination ofphase ambiguities from the solution.
GPS Receivers and Antennas for GeodesyBlewitt (1993) reviewed the development of GPS receivers from the early 1970sto the early 1990s. Since that publication, a great number of commercial GPSreceivers have gone on the market. One of the most significant of recent changeshas been the cost of GPS receivers. As of this writing, geodetic quality GPSreceivers cost $15,000 or less if bought in quantity, a decrease of∼50% in aboutfive years. (In the mid-late 1980s, an equivalent GPS receiver cost∼$200,000.)This decrease in cost has had an enormous impact, enabling a very large globalnetwork of permanent sites to be established, thereby increasing the accuracyof the satellite orbit determinations. The low cost also allows a greater numberof groups to become involved, increasing the variety of science that is being ad-dressed. GPS projects now typically involve a greater number of GPS receivers,which enables a greater density of sites, improving spatial resolution and easinglogistics. Finally, GPS receivers may now be dedicated to a project, enablinga growth of so-called “continuous GPS” (or “permanent GPS”) (see below).
The latest generation of GPS receivers has several practical features thatmake them far superior in the field to receivers available even a few yearsago. Receivers having eight or more physical dual-frequency channels are nowavailable, allowing all satellites in view to be tracked simultaneously. Thereceivers are very light, usually under 4 kg, and consume 12 W or less power.Data from several days can be stored in nonvolatile RAM.
An important component of ground-based GPS receiving systems that hereto-fore received relatively little attention (from geophysicists) has been the antenna.

P1: SDA/mkv P2: rpk/plb/vks QC: MBL/agr T1: MBL
March 27, 1997 9:30 Annual Reviews SEGATEXT.TXT AR29-10
GPS APPLICATIONS 307
To simplify ground-based GPS receiving systems, and to reduce costs and im-prove portability, GPS receiving systems have been designed to use antennasthat accept signals arriving from all directions. The ground-plane is designedto reduce the effects of signals received from negative elevation angles, butsuch signals are not rejected completely. These signals, reflected from nearbyobjects, interfere with the “direct” signal, causing a phase error known as mul-tipath. For example, the ground, which can be modeled as an infinite planarreflector, causes multipath that varies sinusoidally with elevation angle of thesatellite and thus nearly averages out over sufficiently long periods of time(e.g. Elosegui et al 1995). (The period of ground-based multipath oscillation,in hours, is of order(λ/H), whereλ is the L1 or L2 wavelength andH theheight above the ground.)
Objects placed very close to the antenna actually become electromagneticallycoupled to the antenna system, effectively modifying the antenna phase pattern(the variation of received phase with direction) (e.g. Krauss 1988). These phasepatterns, even for an isolated antenna system, are difficult to characterize ana-lytically (e.g. Wu et al 1993). Schupler et al (1994) measured in an anechoicchamber the electrical properties of several different models of geodetic GPSantennas. They found large (20–40◦) variations of phase with direction and sig-nificant differences between the patterns of antennas of different design. Theproblem is compounded when nearby objects become coupled to the antenna.Elosegui et al (1995) found that the electromagnetic coupling between the GPSantenna and the pillar on which it is mounted can cause large phase errors that,unlike multipath, do not average out. One implication of this problem is thatantennas of identical design, but mounted in the field differently, have differenteffective phase patterns.
Infrastructure for GPS GeodesyA large permanent infrastructure supporting GPS geodesy has, in many ways,revolutionized how geodetic observations are planned, acquired, and analyzed.The International GPS Service for Geodynamics (IGS), which formally becameoperational on January 1, 1994, is composed of a global network of permanentGPS stations, data centers, analysis centers, a central bureau, and a governingboard (e.g. Beutler et al 1993; Zumberge et al 1995). The “IGS network” ispresently composed of nearly 100 GPS stations. Each permanent site is operatedindependently by its parent institution, and the network links are provided bythe Internet. The principal products of the IGS analysis centers are routinelyavailable within several days after aquisition, and include the following: high-accuracy GPS ephemerides (orbits), Earth rotation parameters, satellite andstation clock information, and ionospheric information.
Investigators may count on the availability of nearby IGS sites, with well-measured velocities, to densify campaign-style regional GPS surveys and to

P1: SDA/mkv P2: rpk/plb/vks QC: MBL/agr T1: MBL
March 27, 1997 9:30 Annual Reviews SEGATEXT.TXT AR29-10
308 SEGALL & DAVIS
obtain an accurate tie to a global terrestrial reference frame, such as the Inter-national Terrestrial Reference Frame (ITRF) of the International Earth RotationService (IERS) (see http://hpvlbi.obspm.fr/iers/ierscb.html). Investigators mayuse data from a global subnetwork of choice to estimate satellite ephemerides,or they may utilize the IGS ephemerides provided by the analysis centers.Whereas in the past GPS analysts often spent a great amount of time acquir-ing and “cleaning” tracking data for the determination of satellite orbits, theycan now simply download high precision ephemerides from the Internet. Theavailability of a global data set means also that global geophysical studies, suchas plate motion studies reviewed below, and even some regional studies, can beundertaken for the cost of data analysis only.
Atmospheric PropagationThe atmosphere slows the propagation of the GPS signals, thereby increas-ing the observed phase. The neutral atmosphere, unlike the ionosphere, is notdispersive at GPS carrier frequencies, so that estimates of site position (in par-ticular the vertical coordinate) are sensitive to atmospheric modeling errors. InGPS studies, the atmospheric propagation delayτa is often expressed as thesum of two terms
τa(ε) = τ zhmh(ε)+ τ z
vmv(ε), (2)
whereτa is taken to be dependent on elevation angleε but not on azimuth. Thefirst term (with subscripth) represents the hydrostatic delay; the second term(subscriptv) represents the water-vapor or “wet” delay (Davis et al 1985). Eachof the two terms is the product of two quantities: the zenith delay (superscriptz)and the “mapping function,” which maps the delay at zenith to lower elevations.The total atmospheric delay at zenith is about 2.4 m.
Typically, the mapping functions are assumed to be known. Because watervapor can vary at altitude, the zenith wet delayτ z
v cannot accurately be estimatedusing surface measurements only. Although the hydrostatic zenith delay canbe accurately estimated from surface pressure, this information is often notavailable, and a nominal value for surface pressure is used. The remainingunknown delay,1τa, thus depends on1τ z
h , the difference between the truehydrostatic zenith delay and the nominal value used. The approximation thatmh(ε) ' mv(ε) enables1τa to be written as
1τa '(1τ z
h + τ zv
)mv(ε). (3)
The combined zenith-delay correction(1τ zh + τ z
v ) is then estimated in the GPSphase solution, along with site positions and other parameters. The error inEquation 3 is1τ z
h1m(ε), where1m(ε) is the difference between the hydro-static and wet mapping functions. Using the mapping functions of Niell (1996),

P1: SDA/mkv P2: rpk/plb/vks QC: MBL/agr T1: MBL
March 27, 1997 9:30 Annual Reviews SEGATEXT.TXT AR29-10
GPS APPLICATIONS 309
the average difference between the hydrostatic and wet mapping functions fora latitude of 45◦ is 4 mm forε = 20◦ and 30 mm forε = 10◦ (1τ z
h = 300 mm).This error is an effective mapping-function error that has the potential to biassite position estimates (e.g. Davis et al 1991). Thus, the error in the a priorizenith delay should be as small as possible.
Although errors in the mapping functions could have significant effects onsite parameter estimates (Davis et al 1985), these errors are small for recentlydeveloped mapping functions. Niell (1996) reported that estimated lengths ofbaselines varied by less than 5 mm as the elevation cutoff angle was reducedfrom 12◦ to 3◦, for baselines longer than 10,000 km. Given that most GPSanalyses do not use data below 15◦, we can conclude that mapping functionerrors are generally negligible (but see below).
Estimation of zenith delays from GPS data significantly weakens the so-lutions owing to the correlations between these parameters and the verticalsite coordinates. Independent estimates of wet delay from ground-based water-vapor radiometers (WVRs) (e.g. Elgered et al 1991) therefore continue to attractconsiderable attention. The accuracy of the WVR technique depends both onthe WVR instrumental calibration and on the algorithm that uses the measuredatmospheric brightness temperatures to estimate the wet delay. Although someimprovements have been made in techniques for instrumental calibration, com-parisons of side-by-side WVRs reveal rms differences of∼2–6 mm (e.g. Kuehnet al 1993; Ware et al 1993). Although much improvement has been obtainedin WVR algorithms (e.g. Johansson et al 1993), until laboratory measurementsimprove the accuracy of the attenuation coefficient and refractive index of watervapor, it is doubtful that wet delay values estimated from WVR data can exceedthe 4–6% level in accuracy (Elgered et al 1991).
A potentially more serious problem is that mapping functions are usuallyassumed to be azimuthally symmetric. This idealization of the atmospherecan lead to significant errors in the mapping function. Sinusoidal azimuthalvariations in the atmospheric propagation delay have been determined fromVLBI data (e.g. MacMillan 1995) and from WVR data (e.g. Rocken et al 1991;Davis et al 1993). Sinusoidal variations with amplitudes as large as 8 cm at 20◦
elevation have been observed (Davis et al 1993). Azimuthal mapping functionerrors have a potentially significant effect on the estimates of site position fromGPS data, but there have been few studies quantitatively assessing this effect.
GPS AND EARTHQUAKE STUDIES
As discussed in the introduction, GPS has become the geodetic method of choicefor studying deformation associated with earthquakes. Before describing someresults obtained with GPS, we first address the more general role of crustal

P1: SDA/mkv P2: rpk/plb/vks QC: MBL/agr T1: MBL
March 27, 1997 9:30 Annual Reviews SEGATEXT.TXT AR29-10
310 SEGALL & DAVIS
138˚ 140˚ 142˚ 144˚ 146˚ 148˚ 150˚40˚ 40˚
42˚ 42˚
44˚ 44˚
46˚ 46˚
0001
00020003
0004
00050006
0007
0008
0009
001000110012
00130014
001500160017
0018
00190022
0023
10 cmGPS
M8.1
Usuda fixed
Figure 2 Horizontal displacement vectors from the M8.1 Kurile Islands (Hokkaido-Toho-Oki),Japan, earthquake, October 4, 1994. Displacements are relative to a station 1100 km away. Errorellipses show 99% confidence regions. After Tsuji et al (1995).
deformation measurements in the study of earthquakes. These measurementsare complementary to seismological data because they document the full earth-quake cycle, including interseismic and transient postseismic processes, as wellas coseismic deformation. Detection of slow interseismic strain accumulationis probably the best technique we have for identifying the location of futureearthquakes in some areas, because elastic rebound requires elastic strain ac-cumulation prior to earthquakes. Postseismic strain relaxation is important inconstraining transient stress transfer and may provide insight into physical pro-cesses active on faults. For these reasons, measurement is essential of both thequasi-static deformations associated with faulting and the dynamically radiatedseismic waves.
Coseismic DeformationCoseismic displacements (e.g. Figure 2) have been determined with GPS forat least 15 recent earthquakes (Table 1). Although this table is likely to beincomplete, certainly by the time of publication, it does give a feeling for thenumber and kind of earthquakes for which GPS data have been collected.
GPS measurements can be related to the earthquake source process throughVolterra’s formula (e.g. Aki & Richards 1980) for displacement at the Earth’ssurface due to slip on a surface of displacement discontinuity in an elasticmedium. GPS measurements of surface displacement can thus be invertedto determine the geometry of earthquake rupture(s). This determination is

P1: SDA/mkv P2: rpk/plb/vks QC: MBL/agr T1: MBL
March 27, 1997 9:30 Annual Reviews SEGATEXT.TXT AR29-10
GPS APPLICATIONS 311
Table 1 Recent earthquakes for which coseismic displacements have been determinedby GPS
Earthquake Magnitude (M) References
1987 Superstition Hills, California 6.2 Larsen et al 19921989 Loma Prieta, California 7.1 Lisowski et al 1990,
Williams et al 19931989 Kalapana, Hawaii 6.1 Dvorak 19941991 Valle de la Estrella, Costa Rica 7.7 Lundgren et al 19931992 Cape Mendocino, California 7.0 Murray et al 19961992 Joshua Tree, California 6.1 Bennett et al 19951992 Landers, California 7.3 Blewitt et al 1993,
Bock et al 1993,Hudnut et al 1994,Freymueller et al 1994
1993 Guam 7.8 Beavan 19931994 Northridge, California 6.7 Hudnut et al 1996,
Shen et al 19961994 Arthurs Pass, New Zealand 6.7 Arnadottir et al 19951994 Hokkaido-Toho-Oki, Japan 8.1 Tsuji et al 19951994 Sanriku-Haruka-Oki, Japan 7.5 Miyazaki et al 19961995 Hyogo-ken Nanbu (Kobe), Japan 7.2 Tabei et al 19961995 Anatofagasta, Chile 8.1 Ruegg et al 19961995 Jalisco, Mexico 8.0 Melbourne et al 1996
particularly important for earthquakes that do not rupture the ground surface, orwhen seismic data, including aftershock distributions, do not clearly determinethe rupture geometry.
In estimating the source geometry, an earthquake is typically represented byone or more rectangular dislocations with spatially uniform slip. Once the faultgeometry is known, it is possible to determine the distribution of slip on the faultsurface, as discussed below. Estimation of the finite source geometry from ob-served displacements at the Earth’s surface is a discrete nonlinear optimizationproblem. In the past few years, a number of groups have used numerical opti-mization procedures to determine the best-fitting dislocation surface or surfaces.The methods can generally be divided into two categories: those methods, suchas nonlinear least squares or quasi-Newton methods, that make explicit use ofthe first or second derivatives and Monte Carlo methods that do not requirethese derivatives.
Several recent earthquakes have occurred in areas of sufficiently good GPS-site coverage to allow the fault geometry to be estimated solely from geodeticobservations. We summarize here results for the 1989 Loma Prieta, 1992 CapeMendocino, and 1994 Northridge earthquakes. One might reasonably wonder

P1: SDA/mkv P2: rpk/plb/vks QC: MBL/agr T1: MBL
March 27, 1997 9:30 Annual Reviews SEGATEXT.TXT AR29-10
312 SEGALL & DAVIS
why such efforts are required, given that considerable information about sourcegeometry is obtained from seismic data and direct observation of fault ruptures.The answer is twofold: First, seismic and geologic data often do not completelyconstrain the fault geometry. In all three cases considered here, primary faultrupture did not reach the Earth’s surface. In addition, aftershock distributionscan be complex, with substantial activity off the principal fault surface. Thus,geodetic observations can play a substantial role in elucidating the geometry ofthe fault rupture. The second reason is that analysis of coseismic deformationserves as a testing ground for the development of methods, which can thenbe applied to the more challenging problem of imaging the sources of post-seismic and interseismic strain. Postseismic and interseismic deformations aremuch smaller than coseismic deformations, and there is little or no supportinginformation from seismic measurements.
Arnadottir & Segall (1994) used all available geodetic data, including GPSmeasurements, to determine the geometry and slip distribution in the 1989 LomaPrieta earthquake. They used a quasi-Newton method to solve the optimiza-tion problem and a bootstrap procedure to estimate confidence intervals in thederived parameters. The location and orientation of the inferred Loma Prietadislocation surface are consistent with well-located aftershocks, with most ofthe aftershocks occurring slightly deeper than the inferred dislocation. In con-trast, some earlier results had found the best-fitting dislocation to be offset by upto 2 km from the aftershock zone. Bootstrap calculations of the confidence inter-vals showed that the slight offset between the center of the aftershock zone andthe inferred rupture was well within uncertainties (Arnadottir & Segall 1994).
For the M7 1992 Mendocino earthquake, Murray et al (1996) used a combina-tion of GPS-derived displacements, spirit-leveling measurements, and coastaluplift determined by the death of intertidal marine organisms to estimate thegeometry of the rupture surface. They used a random search procedure thatselects candidate models over some (nonuniformly spaced) grid in model space.The best-fitting dislocation has dip, location, and sense of slip consistent witha subduction zone event, making it the first well-documented earthquake tooccur on the Cascadia mega-thrust. Results of the geodetic inversion are gener-ally consistent with seismic results; however, the estimated dislocation surfacedips more steeply than either the long period nodal plane or the band of after-shocks. The best-fitting dislocation surface is also somewhat shallower thanthe aftershock zone, although the resolution of the geodetic data is such that adislocation surface within the aftershock zone could not be rejected.
The M6.7 January 1994 Northridge earthquake was possibly the best geodeti-cally monitored earthquake yet to occur. Vector displacements were determinedat 66 GPS sites (Hudnut et al 1996). Hudnut et al (1996) used the random cost

P1: SDA/mkv P2: rpk/plb/vks QC: MBL/agr T1: MBL
March 27, 1997 9:30 Annual Reviews SEGATEXT.TXT AR29-10
GPS APPLICATIONS 313
-20
-15
-10
-5
0
-10 -5 0 5 10 15 20 25
-20
-15
-10
-5
0
-10 -5 0 5 10 15 20 25
-20
-15
-10
-5
0
-10 -5 0 5 10 15 20 25
-20
-15
-10
-5
0
-10 -5 0 5 10 15 20 25
Mainshock
-20
-15
-10
-5
0
-10 -5 0 5 10 15 20 25
MU
LH
CH
AT
N
OR
T
PIC
O
RE
SE
NE
WH
0704
Figure 3 Cross section through the 1994 Northridge earthquake, showing relocated aftershocksand the uniform slip dislocation inferred from modeling of GPS displacements (thick line). Alsoshown is the extended dislocation plane used to model the spatial variation in slip (thin line). AfterHudnut et al (1996).
method and found that the best-fitting rectangular dislocation does not passthrough the principal concentration of aftershocks, but is displaced 1–2 km intothe hanging wall (Figure 3). These authors note that a model with a singledislocation surface does not fit the GPS data satisfactorily. Shen et al (1996)analyzed the same data set using an iterative search procedure. They also foundthat the data cannot be well fit by a single dislocation extending through themainshock and concentrated zone of aftershocks. By including a more steeplydipping shallow up-dip extension of the main rupture (a “hinged” fault) as wellas a secondary antithetic fault located northwest and above the main shock, theseauthors arrive at a satisfactory fit to the data. Support for deformation northwestof the mainshock comes from interferometric SAR results (Massonet et al 1996).
The systematic tendency of these geodetically inferred dislocation surfacesto be shallower than the corresponding aftershock zones has been observedfor a number of other earthquakes. A number of factors probably contribute:

P1: SDA/mkv P2: rpk/plb/vks QC: MBL/agr T1: MBL
March 27, 1997 9:30 Annual Reviews SEGATEXT.TXT AR29-10
314 SEGALL & DAVIS
systematic mislocation of aftershocks due to three-dimensional velocity varia-tions, bias in the geodetic estimates due to elastic inhomogeneity, and nonplanarfault geometry. Failure to account for elastic inhomogeneity systematically bi-ases geodetic inversions to shallow fault depths. The quality and quantity ofgeodetic observations have increased so dramatically in the last decade that itnow seems probable that the effects of inhomogeneity, and perhaps anisotropy,in the Earth’s crust can no longer be neglected (e.g. Du et al 1994).
If the geometry of the fault surface is known, then GPS observations of surfacedisplacement can be inverted for the spatial distribution of fault slip using linearinverse methods. Although the information in slip estimates is fundamentallykinematic, the estimates do provide important observational constraints on me-chanics of the earthquake process. To circumvent the inherent nonuniquenessin the inversion, the problem can be regularized by seeking slip distributionsthat simultaneously fit the data to an acceptable degree and satisfy some a prioricriterion, such as smoothness (e.g. Matthews & Segall 1993). The appropriatetradeoff between data fit and solution roughness can be quantitatively deter-mined using cross validation (Matthews & Segall 1993). Simulations showthat cross validation yields optimal estimates of the smoothing parameter for agiven model norm if data correlations are properly accounted for (Arnadottir &Segall 1994). It is reasonable to assume that the fault slip does not change direc-tion on the fault surface, in which case a non-negativity constraint is imposedon the solution.
Geodetic estimates of slip distribution complement seismic data in elucidat-ing the earthquake rupture process. The radiated seismic wave field is dependenton the slip amplitude, rupture velocity, and source time function, whereas thequasistatic displacements depend only on the final slip amplitude. Therefore, acombination of seismic and geodetic data provides stronger constraints on thespatial distribution of slip and the temporal evolution of rupture than do seis-mic data alone (e.g. Cohee & Beroza 1994). Whereas static slip distributionshave been estimated for a number of earthquakes using geodetic observations(e.g. Larsen et al 1992; Bennett et al 1995), in the last few years emphasishas been on combined inversion of seismic and geodetic data. We review hereresults for recent California earthquakes. Yoshida et al (1996) presented a com-bined geodetic and seismic inversion in their study of the Hyogo-ken Nanbu,Japan (Kobe), earthquake.
The estimated slip distribution in the 1989 Loma Prieta earthquake agreesreasonably well with inversions of strong motion seismic data (Arnadottir &Segall 1994). Using cross validation to estimate the smoothing parameter, theslip is found to be more localized than that obtained in seismic inversions. Atpresent, it is not known whether this difference is due to neglected correlations inthe data, which bias cross validation toward rough models, or whether subjective

P1: SDA/mkv P2: rpk/plb/vks QC: MBL/agr T1: MBL
March 27, 1997 9:30 Annual Reviews SEGATEXT.TXT AR29-10
GPS APPLICATIONS 315
methods used to determine the amount of smoothing in the seismic inversionstend to overly smooth the slip distribution.
Extensive data from permanent GPS (Blewitt et al 1993; Bock et al 1993),survey GPS (Hudnut et al 1994), and geodimeter networks allowed the static-slip distribution to be computed for the M7.3 Landers earthquake. Although theprecise slip distribution cannot be uniquely resolved, Johnson et al (1994) wereable to find a strict lower bound on the seismic moment using the GPS obser-vations. Slip estimates obtained from geodetic observations (e.g. Freymuelleret al 1994) indicate two major slip patches, in agreement with inversions ofseismic data. As with the Loma Prieta earthquake, cross validation leads to es-timates that are substantially more localized with greater plate slip (Freymuelleret al 1994) than those obtained from inversion of seismic data (Cohee & Beroza1994; Wald & Heaton 1994). In addition to the factors discussed above, mis-modeling of the complex rupture geometry in this earthquake could bias crossvalidation, particularly for stations very near to the fault.
Wald & Heaton (1994) included geodetic, teleseismic, and strong motion datain their analysis of the Landers earthquake. Given a consistent fault geometryand discretization, they are able to compare models obtained independentlyfrom each data set. Inclusion of permanent displacements and the near fieldseismic data should result in improved estimates of slip and rupture velocityin the earthquake. As Cohee & Beroza (1994) point out, however, assigningappropriate weights to the geodetic and seismic data is complicated by the factthat in the seismic case, errors are dominated by inaccuracy in the calculationof synthetic seismograms rather than by measurement error.
For the 1994 Northridge earthquake, Wald et al (1996) analyzed a combina-tion of seismic (teleseismic and strong motion) and geodetic (GPS and leveling)data to determine the slip distribution and rupture history of the Northridgeearthquake. In this case, inversions conducted with the various data sets donot agree well with one another. The geodetic data can be fitted reasonablywith a very smooth slip distribution that is inconsistent with the strong-motiondata. This inconsistency emphasizes the poor resolution of geodetic data forrelatively small and deep earthquakes.
Postseismic DeformationGPS will play an increasingly important role in improving our knowledge ofpostseismic processes. Traditional seismic instruments are insensitive to post-seismic processes, with the exception of aftershocks. Strainmeters and tilt-meters record short-term transients following earthquakes, but only geodeticsurvey measurements are likely to have the spatial coverage and long-term sta-bility needed to resolve postseismic strains with characteristic times of years todecades. Prior to the advent of GPS, very few postseismic data sets existed for

P1: SDA/mkv P2: rpk/plb/vks QC: MBL/agr T1: MBL
March 27, 1997 9:30 Annual Reviews SEGATEXT.TXT AR29-10
316 SEGALL & DAVIS
comparison to theoretical predictions. It will be some time before decade-longGPS data sets have been collected that follow a significant number of largeearthquakes. Nevertheless, given the precision of the measurements and therelative ease of GPS surveying, we can expect a revolution in our understand-ing of postseismic processes in the upcoming decade. In the last three yearsalone, five earthquakes of M7.5 and greater have occurred within existing GPSnetworks (Table 1).
Because they were among the first major earthquakes to be well recordedusing GPS, the 1989 Loma Prieta and 1992 Landers earthquakes are the first toyield significant postseismic strain signals. Following the Loma Prieta earth-quake, Savage et al (1994) found evidence for a decaying transient with acharacteristic time of∼1.4 years, from the first 3.3 years of data. Interestingly,the transient is most clearly expressed in the component of motion perpendicu-lar to the San Andreas fault; the fault parallel component exhibits little evidenceof a decaying transient. B¨urgmann et al (1996), when analyzing this and ad-ditional data, used a model of San Francisco Bay area deformation to removethe expected effects of interseismic deformation from the data. The residualpostseismic velocities are significantly nonzero only within about 20 km of therupture zone, effectively limiting the source of postseismic deformation to theseismogenic upper crust. Deformation at greater depths, including distributedasthenospheric flow, would generate more widely distributed deformation atthe Earth’s surface.
The residual postseismic motions include contraction normal to the trendof the San Andreas, particularly on the northeast footwall side of the fault, aswell as accelerated right-lateral deformation. Savage et al (1994) modeled thepostseismic deformation with oblique slip on a 5-km wide down-dip extensionof the coseismic rupture, as well as fault collapse on the coseismic rupture.They presumed the latter to be a reversal of dilatancy that occurred during theearthquake. B¨urgmann et al (1996) used numerical optimization methods toshow that the data are best fit by a combination of aseismic oblique-reverse slipon the Loma Prieta rupture zone and reverse slip on southwest-dipping thrustnortheast of the San Andreas fault zone. The thrust found by the inversionlies near a zone of thrust faults northeast of the San Andreas, which have beenactive in the Holocene. Models with secondary thrusting offer a comparable fitto the GPS data and a substantially improved fit to precise leveling data in thearea when compared to the fault collapse interpretation.
Extensive GPS monitoring was conducted following the 1992 Landers earth-quake. Shen et al (1994) found a decaying transient with a characteristic timeof∼1 month in the first 6 months after the earthquake. Savage & Svarc (1996)found a decay time of 84± 23 days, superimposed on a linear trend from3.4 years of data across the Camp Rock–Emerson segment of the Landers

P1: SDA/mkv P2: rpk/plb/vks QC: MBL/agr T1: MBL
March 27, 1997 9:30 Annual Reviews SEGATEXT.TXT AR29-10
GPS APPLICATIONS 317
Rupture. Savage & Svarc (1996) argued that the linear trends indicate de-formation rates that are substantially faster than those observed prior to theearthquake, which thus reflect a longer term relaxation with a time scale of atleast 5 years.
Shen et al (1994) concluded that postseismic slip was concentrated belowthe southern half of the coseismic rupture on the southern Johnson Valley andEureka Peak faults. They also inferred slip at depth below the Banning segmentof the San Andreas fault, raising concerns at the time about triggered slip onthe San Andreas and underscoring the importance of postseismic deformationmonitoring for short-term hazard evaluation. In contrast, Savage & Svarc (1996)found the greatest postseismic slip beneath the northern Camp Rock–Emersonsegment of the rupture. They also found fault collapse beneath the HomesteadValley segment and fault extension (dilatancy) beneath the southern JohnsonValley segment. A synthesis of the various data sets, including interferomet-ric SAR images, could help clarify competing interpretations of postseismicdeformation.
The proliferation of continuous GPS networks means that we can also lookforward to the ability to resolve rapid postseismic signals, which were pre-viously only measurable with strain and tilt meters. A striking example ofthis is offered by the Japanese national GPS array, which recorded a transientfollowing the Sanriku-Haruka-Oki earthquake (Figure 4).
Interseismic DeformationMany of the early studies of interseismic deformation using GPS took placein southern California. These studies were also instrumental in developinggeodetic GPS methods and in characterizing the precision and accuracy of thetechnique (e.g. Larson & Agnew 1991; Feigl et al 1993). Feigl et al (1993)presented a comprehensive review of GPS data collected in central and southernCalifornia between 1986 and 1992, as well as VLBI data collected between 1984and 1991. They also discussed methods for obtaining and combining highly pre-cise GPS solutions for the determination of station velocities in regional-scalenetworks. Daily solutions with phase ambiguities fixed to integers (where pos-sible) were estimated with very loose constraints on the station coordinates.The loosely constrained solutions (positions, covariances, and satellite states),along with comparable VLBI solutions, were then combined a posteriori todetermine station coordinates at some reference time and velocities. Differentsolutions were obtained to define a terrestrial reference frame, to determine sta-tion coordinates sufficiently accurately for ambiguity resolution, and finally todetermine the best estimate of station velocities. This approach minimized, tothe degree possible at that time, the effects of incorrect specification of fiducialstation coordinates (see also Larson et al 1991).

P1: SDA/mkv P2: rpk/plb/vks QC: MBL/agr T1: MBL
March 27, 1997 9:30 Annual Reviews SEGATEXT.TXT AR29-10
318 SEGALL & DAVIS
-0.0
20
0.02
0.04
0.06
0.080.
1
0.12
0.14
-10
-50
510
1520
2530
East (m)
M7.
5
M6.
9
Day
s si
nce
28-D
ec-1
994
Fig
ure
4Po
stse
ism
icde
form
atio
nfo
llow
ing
the
M7.
5Sa
nrik
u-H
aruk
a-O
ki,
Japa
n,ea
rthq
uake
.Sh
own
are
estim
ates
ofth
eea
stco
mpo
nent
ofdi
spla
cem
ento
fst
atio
nK
uji
onth
eea
stco
asto
fH
onsh
u,Ja
pan,
dete
rmin
edev
ery
75m
inus
ing
data
from
the
Japa
nese
perm
anen
tGPS
netw
ork.
Not
eth
atth
epo
stse
ism
icdi
spla
cem
enti
s25
–40%
ofth
eco
seis
mic
sign
al.
The
nort
hco
mpo
nent
show
sa
cons
ider
ably
smal
ler
(<2
cm)
tran
sien
t.(F
Web
b,un
publ
ishe
dda
ta.)

P1: SDA/mkv P2: rpk/plb/vks QC: MBL/agr T1: MBL
March 27, 1997 9:30 Annual Reviews SEGATEXT.TXT AR29-10
GPS APPLICATIONS 319
Feigl et al (1993) determined velocities for∼40 sites in central Californiawith horizontal uncertainties of 2–3 mm/year. The most prominent feature ofthe data is right-lateral shear associated with North America–Pacific relativeplate motion. Within uncertainties, the site at Vandenburg Air Force Base onthe central California coast appears to be moving at the predicted velocity ofthe Pacific plate, although the data do allow several millimeters per year ofoffshore motion. San Clemente and San Nicolas Islands, off the coast near SanDiego, also appear to move with Pacific plate velocity, whereas 6± 2 mm/yearof motion between the islands and the mainland could be explained by offshorestrike-slip faulting (Larson 1993).
In addition to strike-slip deformation, the GPS data reveal significant crustalshortening across the Santa Barbara Channel, the Ventura Basin, the Los AngelesBasin, and the Santa Maria fold and thrust belt (Feigl et al 1993). Althoughactive folding and thrusting parallel to the San Andreas have long been known,and have generated damaging earthquakes including the 1983 Coalinga and1985 Kettleman Hills earthquakes, detecting this shortening geodetically hasbeen difficult. Feigl et al (1993) found 5.7± 0.5 mm/year of fault normalconvergence between the California coastline and Owens Valley, which thusbounds the amount of shortening associated with individual structures acrossthis broad region. These authors also find 5± 1 mm/year of shortening acrossthe Los Angeles Basin between Palos Verdes and a site in Pasadena at the footof the San Gabriel Mountains, which is consistent with geologic estimates.
GPS data show 6± 1 mm/year of roughly north-south convergence acrossthe eastern Santa Barbara Channel (Larson 1993), which is consistent with boththe geology and current seismicity of the region. This deformation continueson land into the Ventura Basin, where shortening is occurring at a rate of 7–10mm/year, with strain-rates as large as 0.6± 0.1 microstrain/year (Donnellanet al 1993). The motion south of the Ventura Basin can be described by clock-wise rotation of a rigid block at a rate of 8◦/million years. The rate of shorteningobserved by GPS is a factor of two less than the geologic rate over the last 0.2million years, but is consistent with the geologic rate over the last 1 millionyears. Donnellan et al (1993) conclude that the basin bounding faults mustbe slipping aseismically below depths of∼5 km, but that the upper lockedsegments could fail in earthquakes as large as M∼ 6.4. An eastern extensionof these structures did rupture in the M6.7 Northridge earthquake, although toconsiderably greater depth than inferred from the GPS observations.
Bennett et al (1996) used additional GPS data through 1995 to investigatefurther the distribution of deformation across this plate boundary. Their estimateof 49 ± 3 mm/year for the North America–Pacific relative plate motion isconsistent with previous space geodetic and geological plate rate estimates.They estimate slip rates for the southern San Andreas, San Jacinto, Elsinore,
P1: SDA/mkv P2: rpk/plb/vks QC: MBL/agr T1: MBL
March 27, 1997 9:30 Annual Reviews SEGATEXT.TXT AR29-10
320 SEGALL & DAVIS
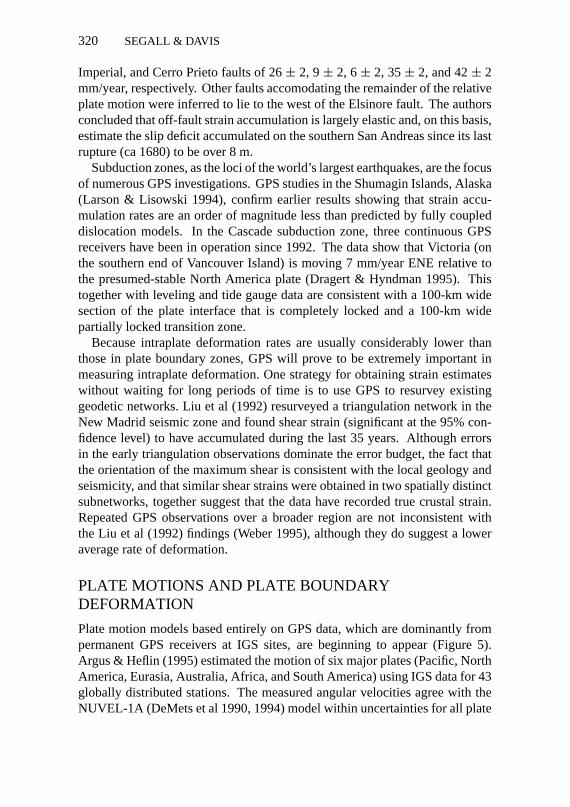
Imperial, and Cerro Prieto faults of 26± 2, 9± 2, 6± 2, 35± 2, and 42± 2mm/year, respectively. Other faults accomodating the remainder of the relativeplate motion were inferred to lie to the west of the Elsinore fault. The authorsconcluded that off-fault strain accumulation is largely elastic and, on this basis,estimate the slip deficit accumulated on the southern San Andreas since its lastrupture (ca 1680) to be over 8 m.
Subduction zones, as the loci of the world’s largest earthquakes, are the focusof numerous GPS investigations. GPS studies in the Shumagin Islands, Alaska(Larson & Lisowski 1994), confirm earlier results showing that strain accu-mulation rates are an order of magnitude less than predicted by fully coupleddislocation models. In the Cascade subduction zone, three continuous GPSreceivers have been in operation since 1992. The data show that Victoria (onthe southern end of Vancouver Island) is moving 7 mm/year ENE relative tothe presumed-stable North America plate (Dragert & Hyndman 1995). Thistogether with leveling and tide gauge data are consistent with a 100-km widesection of the plate interface that is completely locked and a 100-km widepartially locked transition zone.
Because intraplate deformation rates are usually considerably lower thanthose in plate boundary zones, GPS will prove to be extremely important inmeasuring intraplate deformation. One strategy for obtaining strain estimateswithout waiting for long periods of time is to use GPS to resurvey existinggeodetic networks. Liu et al (1992) resurveyed a triangulation network in theNew Madrid seismic zone and found shear strain (significant at the 95% con-fidence level) to have accumulated during the last 35 years. Although errorsin the early triangulation observations dominate the error budget, the fact thatthe orientation of the maximum shear is consistent with the local geology andseismicity, and that similar shear strains were obtained in two spatially distinctsubnetworks, together suggest that the data have recorded true crustal strain.Repeated GPS observations over a broader region are not inconsistent withthe Liu et al (1992) findings (Weber 1995), although they do suggest a loweraverage rate of deformation.
PLATE MOTIONS AND PLATE BOUNDARYDEFORMATION
Plate motion models based entirely on GPS data, which are dominantly frompermanent GPS receivers at IGS sites, are beginning to appear (Figure 5).Argus & Heflin (1995) estimated the motion of six major plates (Pacific, NorthAmerica, Eurasia, Australia, Africa, and South America) using IGS data for 43globally distributed stations. The measured angular velocities agree with theNUVEL-1A (DeMets et al 1990, 1994) model within uncertainties for all plate

P1: SDA/mkv P2: rpk/plb/vks QC: MBL/agr T1: MBL
March 27, 1997 9:30 Annual Reviews SEGATEXT.TXT AR29-10
GPS APPLICATIONS 321
0˚0˚
40˚
40˚
80˚
80˚
120˚
120˚
160˚
160˚
200˚
200˚
240˚
240˚
280˚
280˚
320˚
320˚
-80˚
-80˚
-40˚
-40˚
0˚0˚
40˚
40˚
80˚
80˚
AL
BH
AL
GO
AR
EQ
BR
MU
CA
NB
CA
S1
DA
V1
EIS
L
FA
IR
FO
RT
GG
AO
GR
AZ
HA
RT
HE
RS
HO
B2
KIR
U
KO
KB
KO
SG
KO
UR
MA
C1
MA
DR
MA
S1
MA
TE
MC
MU
MD
O1
ME
TS
NA
LL
NL
IB
ON
SA
PA
MA
PE
NT
PE
RT
PIE
1
RC
M5
SA
NT
ST
JO
TA
IS
TR
OM
TS
KB
US
UD
WE
ST
WE
TB
YA
R1
YE
LL
KIT
3S
HA
O
KE
RG
GU
AM
Hef
lin e
t al
., 19
965
cm/y
ear
Fig
ure
5H
oriz
onta
lve
loci
ties
ofpe
rman
ent
GPS
site
sof
the
Inte
rnat
iona
lG
PSSe
rvic
efo
rG
eody
nam
ics
(IG
S)ne
twor
k.T
here
fere
nce
fram
eis
ITR
F94.
Site
sw
ithth
esm
alle
ster
ror
ellip
ses
beca
me
oper
atio
nali
n19
91an
dha
vea
time
span
of5
year
s.T
hem
ean
time
span
is3
year
s.Fi
gure
cour
tesy
ofM
icha
elH
eflin
,Jet
Prop
ulsi
onL
ab.
(see
Arg
us&
Hefl
in19
95).

P1: SDA/mkv P2: rpk/plb/vks QC: MBL/agr T1: MBL
March 27, 1997 9:30 Annual Reviews SEGATEXT.TXT AR29-10
322 SEGALL & DAVIS
Figure 6 Velocities of sites in the Tonga arc and Lau basin in a Pacific-plate fixed-reference framebased on GPS data collected between 1990 and 1992. Error ellipses represent 2σ (86%) confidenceintervals. After Bevis et al (1995).
pairs. These results are consistent with previous studies that have shown that therelative motion of plate interiors does not change measurably over time scalesof years to millions of years. Larson & Freymueller (1995) used three yearsof IGS data from seven sites to estimate the motion of the Australian, Pacific,and Antarctic plates. Their study represents the first geodetic determinationof Antarctic plate motion. The estimated rates agree with the NUVEL no-net-rotation model of absolute plate motion to within error measurements.
Although agreement with plate motion models such as NUVEL is confirmingboth of the plate models and the geodetically derived velocities, it is not possiblesimultaneously to test geologic models and use those same models to validategeodetic results. At this date it is safe to conclude that, assuming appropriatecare has been given to maintaining a stable reference frame, GPS results provideaccurate crustal motions, so that it is now possible to focus on the differencesbetween geologic models and geodetic results. Because the rates of crustaldeformation are generally slow, time is required before results are sufficientlyrobust to force modifications of existing models. For this reason, the greatestshort term impact has been (or will be) made in plate boundary regions such asthe Phillipine Sea plate and the Lau Basin, which are characterized by diffuseback arc spreading, so that the rates of plate motion are not well constrained bysea floor magnetic anomalies.
Rapid convergence between the Pacific and Australian plates at the TongaTrench has been observed by Bevis et al (1995). The rate of motion between

P1: SDA/mkv P2: rpk/plb/vks QC: MBL/agr T1: MBL
March 27, 1997 9:30 Annual Reviews SEGATEXT.TXT AR29-10
GPS APPLICATIONS 323
three sites in Fiji, presumed to be on the Australian plate, and three sites onthe Pacific plate were found to be in excellent agreement with NUVEL-1Apredictions. Three stations on the Tonga Ridge, across the Lau Basin, movedaway from the Australian plate at rates increasing from 91± 4 mm/year inthe south to 159± 10 mm/year in northern Tonga (Figure 6). The data implyback-arc opening of the Lau Basin as the Tonga Ridge rotates clockwise at∼7◦/million years about a pole near the southern end of the Lau Basin. Beviset al (1995) suggested that the unusually high rates of mantle seismicity beneaththe Tonga Trench may be associated with the very rapid rate of subduction andback arc spreading.
Taylor et al (1995) found that the convergence rate between the southernNew Hebrides and the Australian plate is faster (103± 5 mm/year to 109±10 mm/year) than the expected rate of Australian-Pacific convergence (79–86mm/year in this region). On the other hand, in the central New Hebrides the ob-served relative motion of 42± 2 mm/year is significantly less than that expectedfrom rigid plate motion. Taylor et al (1995) attribute the faster than expectedrate in the southern New Hebrides to back arc spreading in the south Fiji basin.The slower than expected rate in the central New Hebrides is attributed to theimpinging of the D’Entrecasteaux Ridge on the subduction zone. This resultsin eastward motion of the New Hebrides with respect to the Pacific plate, com-pression in the eastern part of the arc and strike-slip boundaries at either endof the indenting D’Entrecasteaux Ridge, which is consistent with earthquakefocal mechanisms in the area.
Noomen et al (1996) employed a combination of SLR (1983–1992) andGPS surveys (1989 and 1992) to determine the motions of 19 sites in theMediterranean region from southern France to eastern Turkey. They found theArabian plate, including a station in eastern Turkey, to be moving northwardwith respect to Eurasia at a rate of∼20 mm/year. Stations in central Turkey(Anatolia) moved westward at a rate of slightly more than 20 mm/year withrespect to the Eurasian plate. Four stations in the Hellenic arc moved southwestat a rate of 29 mm/year with respect to Eurasia. Using data from a more extens-ive GPS network, Oral et al (1995) concluded that Turkey south of the NorthAnatolian fault moves as a coherent microplate with a pole of rotation locatednorth of the Sinai peninsula. The SLR measurements suggest that southernGreece and the Agean act as part of this microplate. Stations north of the NorthAnatolian fault exhibit much lower velocities with respect to the Eurasian plate,which is consistent with∼25 mm/year slip on the North Anatolian fault. Adense network across the North Anatolian fault shows localized deformationwith maximum shear oriented E-W south of the Black Sea, whereas fartherwest, in the eastern Marmara Sea region, the strain is more distributed andthe maximum shear is oriented WSW-ENE (Straub & Kahle 1995). Eastern

P1: SDA/mkv P2: rpk/plb/vks QC: MBL/agr T1: MBL
March 27, 1997 9:30 Annual Reviews SEGATEXT.TXT AR29-10
324 SEGALL & DAVIS
Turkey displays a complex pattern of oblique right-lateral convergence betweenthe Arabian and Eurasia/Anatolia plates (Oral et al 1995).
Foulger et al (1992) and Heki et al (1993) reported on results from twoGPS surveys in 1987 and 1990, 10 years after a major rifting episode on theneovolcanic zone in northeast Iceland. Rifting occurred during a series ofintrusions and eruptions between 1975 and 1981, with a cumulative extensionof 8 m across the rift system. Displacements of the GPS sites show that extensionacross a zone extending at least 100 km from the rift axis occurred roughly onedecade after the rifting event. Heki et al (1993) modeled the motions with a two-dimensional elastic plate overlying a Newtonian viscous fluid. Sudden riftingevents at the boundary of the model leads to the diffusion of strain (and stress)into the elastic plate. Using the measured opening across the rift zone as input,Heki et al (1993) found the best fit to the observations with a stress diffusivityof 10 m2/s. Assuming the thickness of the elastic plate and underlying viscouschannel is consistent with magnetotelluric results leads to a viscosity of 0.3 to2.0× 1018 Pascal-seconds. The vertical displacements do not correlate wellwith predictions of the Elsasser model, which is attributed to low precision inthe GPS height determinations.
VOLCANO DEFORMATION
GPS holds great promise for the study of volcano deformation, which canbe both episodic and rapid. Measurable deformation precedes some eruptions,which suggests the utility of GPS measurements in predicting volcanic hazards.Indeed, some dramatic GPS data have already been obtained related to volcanicprocesses.
A remarkable set of data was recorded prior to and during a submarine erup-tion off the coast of the Izu Peninsula in Japan (Shimada et al 1990; Fujinawaet al 1991). A seismic swarm, which began in late May 1989, intensified onJuly 4, 1989. A M5.5 event occurred on July 9, a harmonic tremor was recordedon July 11–12, and on July 13 there was dramatic doming of the sea surface andthe onset of a phreatomagmatic eruption. A pair of GPS stations, one locatedon the Izu Peninsula and the other on Hatsushima Island, spanned the zone ofseismicity. Although the GPS data were quite limited by today’s standards,consisting of 4 h ofdata from 4 satellites per day, 14.5 cm of extension was ulti-mately recorded between the stations. Most importantly, the GPS data recordedclear changes on July 5 and 6, several days before the onset of harmonic tremorand a week prior to visible evidence of the eruption at the sea surface. Theeruption itself was not accompanied by measurable deformation.
In addition to the GPS measurements, tilt, borehole strain, terrestrial EDM,and leveling data were also collected. Okada & Yamamoto (1991) used allthe available data to develop a time-dependent kinematic model of the source

P1: SDA/mkv P2: rpk/plb/vks QC: MBL/agr T1: MBL
March 27, 1997 9:30 Annual Reviews SEGATEXT.TXT AR29-10
GPS APPLICATIONS 325
process. The model includes a deep dike-like source accompanying the May1989 swarm, the M5.5 earthquake source, and the main dike that ultimately fedthe eruption. The main dike was inferred to have been located at a depth of7–5 km in early July, but grew to within 1 km of the sea floor by July 4, ulti-mately widening to well over a meter in width prior to the eruption. Okada &Yamamoto (1991) interpreted the lack of deformation accompanying the erup-tion to indicate that the magma intruded shallow compliant sediments, forminga sill prior to the eruption. Remarkably, bathymetric surveys showed a flat seafloor on July 9, but a survey on July 13, “minutes” before a phreatomagmaticeruption, shows a 25-m high by 300-m diameter knoll.
Rapid quasi-steady motions have been mapped on Kilauea volcano, Hawaii,using GPS (Owen et al 1995). The south flank of Kilauea, the area south ofKilauea’s two rift zones, has generated large earthquakes including a M7.2event in 1975. These quakes occurred on a buried subhorizontal fault (with theupper plate moving seaward), near the base of the volcanic pile at the contactwith the ancient sea floor. GPS data collected between 1990 and 1993 showthat the region north of the rift zones was not actively deforming, while thecentral south flank displaced seaward at rates of up to 10 cm/year (Figure 7).The extraordinarily high strain rates across the rift zones cannot be explainedby aseismic slip on the decollement alone. Dilation of the rift zones below3–4 km is required to decouple the south flank across the rift zones. Owen et al(1995) modeled the data with elastic dislocations representing the decollementand the rift zones. The GPS-derived horizontal motions require the basal faultto be slipping at a rate of at least 150 mm/year. Opening of the deep rift zonewas inferred to have taken place at a comparable rate.
GLACIAL ISOSTATIC ADJUSTMENTAND SEA LEVEL CHANGE
GPS is also playing an important role in the determination of present-day sea-level change. Tide gauges record the level of the sea surface with respect to land,which may or may not be moving vertically. Accurate measurement of verticaldisplacement rates at tide gauge stations are thus needed to correct apparentsea-level records for crustal deformation. Vertical crustal motions can arise dueto tectonic processes, groundwater and oil withdrawal, and ongoing isostaticadjustment in response to late Pleistocene deglaciation. The latter effect can besignificant even far from the ancient ice sheets (e.g. Mitrovica & Davis 1995).
The Fennoscandian region has the longest tide gauge records in the world, butbecause of the large glacial isostatic adjustment (GIA) signal, it has not beenpossible to utilize these data for estimating present-day sea-level variations(e.g. Douglas 1991). Several GPS projects, including BIFROST (Baseline In-ferences for Fennoscandian Rebound Observations, Sea Level, and Tectonics)

P1: SDA/mkv P2: rpk/plb/vks QC: MBL/agr T1: MBL
March 27, 1997 9:30 Annual Reviews SEGATEXT.TXT AR29-10
326 SEGALL & DAVIS
204˚ 30'
204˚ 30'
204˚ 40'
204˚ 40'
204˚ 50'
204˚ 50'
205˚ 00'
205˚ 00'
205˚ 10'
205˚ 10'
18˚ 50' 18˚ 50'
19˚ 00' 19˚ 00'
19˚ 10' 19˚ 10'
19˚ 20' 19˚ 20'
19˚ 30' 19˚ 30'
19˚ 40' 19˚ 40'
100 mm/yr
20 km
KEAU
RLYM
PALI
UWEK -57(23)
HULU -104(28)
HEIH -55(20)
KALA 45(21)
APUA
66YY
ACRE
HILI KAEN
KMOA
KULN HIBC
FERN
SAND
BLDR
MOAN
MTVW
STNB
WNGR
KAMK
KAPA
M801 GOAT
KFLT
KAPU
AINA KOAE
KAPO
204˚
204˚
205˚
205˚
19˚ 19˚
20˚ 20˚HP-6
Figure 7 Average horizontal velocities on Kilauea volcano for the time interval 1990–1993.Velocities are shown relative to station HP-6 on the northwest side of the island of Hawaii. Errorellipses represent 95% confidence intervals. After Owen et al (1995).
(BIFROST Project 1996), which involves permanent GPS networks in Swedenand Finland, and the Baltic Sea Level Project (Pan & Sj¨oberg 1993), have thegoal of correcting Fennoscandian tide gauges for GIA.
Another approach to estimating present-day sea-level change has been touse GPS to measure elastic deformations resulting from changes in the massof glaciers and ice sheets (e.g. James & Ivins 1995; Wahr et al 1995). Anincrease in ice mass causes GPS sites on bedrock adjacent to the ice sheet
P1: SDA/mkv P2: rpk/plb/vks QC: MBL/agr T1: MBL
March 27, 1997 9:30 Annual Reviews SEGATEXT.TXT AR29-10
GPS APPLICATIONS 327
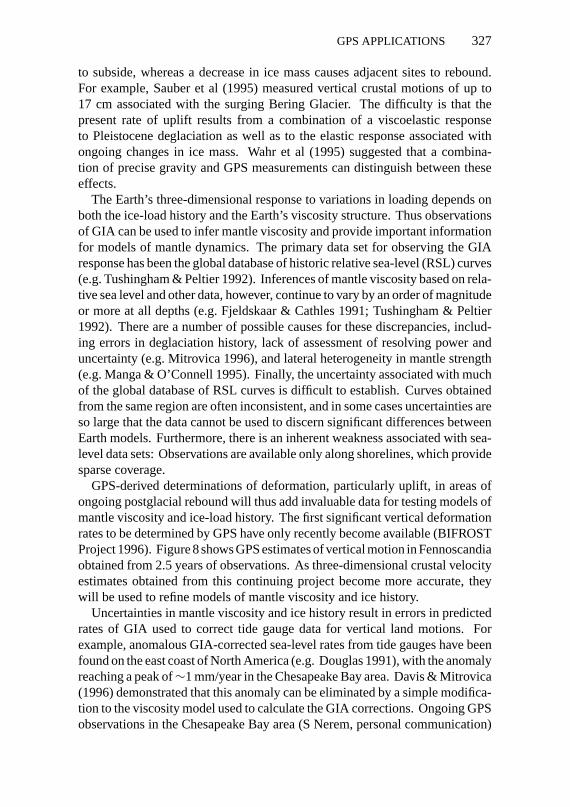
to subside, whereas a decrease in ice mass causes adjacent sites to rebound.For example, Sauber et al (1995) measured vertical crustal motions of up to17 cm associated with the surging Bering Glacier. The difficulty is that thepresent rate of uplift results from a combination of a viscoelastic responseto Pleistocene deglaciation as well as to the elastic response associated withongoing changes in ice mass. Wahr et al (1995) suggested that a combina-tion of precise gravity and GPS measurements can distinguish between theseeffects.
The Earth’s three-dimensional response to variations in loading depends onboth the ice-load history and the Earth’s viscosity structure. Thus observationsof GIA can be used to infer mantle viscosity and provide important informationfor models of mantle dynamics. The primary data set for observing the GIAresponse has been the global database of historic relative sea-level (RSL) curves(e.g. Tushingham & Peltier 1992). Inferences of mantle viscosity based on rela-tive sea level and other data, however, continue to vary by an order of magnitudeor more at all depths (e.g. Fjeldskaar & Cathles 1991; Tushingham & Peltier1992). There are a number of possible causes for these discrepancies, includ-ing errors in deglaciation history, lack of assessment of resolving power anduncertainty (e.g. Mitrovica 1996), and lateral heterogeneity in mantle strength(e.g. Manga & O’Connell 1995). Finally, the uncertainty associated with muchof the global database of RSL curves is difficult to establish. Curves obtainedfrom the same region are often inconsistent, and in some cases uncertainties areso large that the data cannot be used to discern significant differences betweenEarth models. Furthermore, there is an inherent weakness associated with sea-level data sets: Observations are available only along shorelines, which providesparse coverage.
GPS-derived determinations of deformation, particularly uplift, in areas ofongoing postglacial rebound will thus add invaluable data for testing models ofmantle viscosity and ice-load history. The first significant vertical deformationrates to be determined by GPS have only recently become available (BIFROSTProject 1996). Figure 8 shows GPS estimates of vertical motion in Fennoscandiaobtained from 2.5 years of observations. As three-dimensional crustal velocityestimates obtained from this continuing project become more accurate, theywill be used to refine models of mantle viscosity and ice history.
Uncertainties in mantle viscosity and ice history result in errors in predictedrates of GIA used to correct tide gauge data for vertical land motions. Forexample, anomalous GIA-corrected sea-level rates from tide gauges have beenfound on the east coast of North America (e.g. Douglas 1991), with the anomalyreaching a peak of∼1 mm/year in the Chesapeake Bay area. Davis & Mitrovica(1996) demonstrated that this anomaly can be eliminated by a simple modifica-tion to the viscosity model used to calculate the GIA corrections. Ongoing GPSobservations in the Chesapeake Bay area (S Nerem, personal communication)

P1: SDA/mkv P2: rpk/plb/vks QC: MBL/agr T1: MBL
March 27, 1997 9:30 Annual Reviews SEGATEXT.TXT AR29-10
328 SEGALL & DAVIS
-5
0
5
10
15
20
GP
S R
elat
ive
Rat
e (m
m/y
r)
-5 0 5 10 15 20Model Relative Rate (mm/yr)
Figure 8 Comparison of observed and predicted model values for the vertical component ofbaseline-vector rates, from BIFROST Project (1996). The predictions are based on the spectraltheory presented by Mitrovica et al (1994) and use realistic models for the viscoelastic structure ofthe Earth and the ice history.
will provide an important test of the predicted rates of postglacial rebound andthe inferred mantle viscosity structure.
PERMANENT GPS NETWORKS
Permanent or continuous GPS networks, meaning a network of GPS receiversthat are left in place for a long period, are not new. Permanent networks likeCIGNET and the IGS network (e.g. Blewitt 1993) have proven their utility tothe geodetic community for orbit determination and have also been used forplate tectonic studies (Larson & Freymueller 1995; Argus & Heflin 1995). Asthe price of GPS receivers has decreased, investigators have recently turned toregional permanent networks for geophysical studies. Shimada & Bock (1992)reported some of the earliest results from a permanent GPS network: 17 monthsof data from a 10-station array in the Kanto-Tokai (Tokyo) area of Japan. Morerecently, the BIFROST Project (1996) has measured postglacial uplift with a21-site permanent GPS network in Sweden.
In practice, continuous GPS data is usually processed to yield one estimateof site position per day, although more frequent solutions (e.g. Figure 4) canbe obtained. With these data, it is possible to study a wide range of transientdeformation processes in tectonic and volcanic regions that are not possible withconventional (often annual) GPS field campaigns. Under the right conditions,daily position determinations may yield more accurate estimates of average

P1: SDA/mkv P2: rpk/plb/vks QC: MBL/agr T1: MBL
March 27, 1997 9:30 Annual Reviews SEGATEXT.TXT AR29-10
GPS APPLICATIONS 329
deformation rates than would periodic campaign measurements. What are the“right conditions”? Simply put, the right conditions are such that the errors inthe position estimates “average out” over useful scales of space, time, or both.The efficiency with which the errors average out will be diminished if the errorsare spatially or temporally coherent (e.g. Johnson & Agnew 1995).
Many of the error sources discussed previously may be spatially or tem-porally coherent. Atmospheric mapping function errors, precipitation, snowaccumulation, multipath and antenna coupling (both of which may depend tosome degree on environmental conditions), antenna phase center variations,and atmospheric pressure loading all might be expected to have some spatialand temporal coherence. Local surficial processes may lead to temporally cor-related random motions of geodetic monuments. Langbein et al (1995) testeddeeply anchored monuments that provide better coupling to the crust and henceimprove their long-term stability.
Without doubt, the most ambitious continuous GPS network is the Japanesenational network (Figure 9). At the time of this writing, there are 610 permanentGPS stations operated by the Geographical Survey Institute (GSI) of Japan(Miyazaki et al 1996). This network represents the merging of the nationwideGPS Regional Array for Precise Surveying (GRAPES) and the ContinuousStrain Monitoring System (COSMOS), located in the Kanto-Tokai areas aroundmetropolitan Tokyo. Station spacing throughout the country is roughly 30 km,but around Tokyo the stations are more concentrated. A number of interestingresults have already been obtained from the GSI network, including coseismicdisplacements associated with three M7 and greater earthquakes, as discussed ina previous section. Strain transients following the M7.5 1994 Sanriku-Haruka-Oki earthquake (Figure 4) and associated with volcanic processes off the Izupeninsula have been recorded. Preliminary results have been obtained showinginterseismic deformation over the entire country of Japan for the past year.These data should prove to be invaluable in determining the spatial distributionof strain accumulation and the location of the elusive Eurasian–North America(or Eurasian-Okhotsk) plate boundary, as well as in obtaining an improvedunderstanding of the physics of subduction zones.
Permanent GPS networks for the study of crustal deformation have been de-veloped in southern and northern California and the northern Basin and Range.The Southern California Integrated GPS Network (SCIGN) presently consistsof 40 operational stations. Thirty new stations are planned, and funding hasbeen requested for an additional 45 stations. The Basin and Range permanentGPS network, currently being implemented, extends from the Sierra Nevada tothe Wasatch Front and is intended to measure the distribution of deformationin this region.
In northern California, the Bay Area Regional Deformation (BARD) GPSnetwork consists of 25 permanent and semipermanent stations and should

P1: SDA/mkv P2: rpk/plb/vks QC: MBL/agr T1: MBL
March 27, 1997 9:30 Annual Reviews SEGATEXT.TXT AR29-10
330 SEGALL & DAVIS
125˚E
125˚E
130˚E
130˚E
135˚E
135˚E
140˚E
140˚E
145˚E
145˚E
25˚N 25˚N
30˚N 30˚N
35˚N 35˚N
40˚N 40˚N
45˚N 45˚N
Figure 9 Permanent GPS network in Japan, operated by the Geographical Survey Institute ofJapan. Figure courtesy of Takeshi Sagiya (GSI).
expand to at least 40 receivers in 1997. King et al (1995) investigated three yearsof BARD data spanning the Hayward fault, to determine the error characteristicsof the data. They found that the data are essentially uncorrelated at lags longerthan 25 days and are only weakly correlated for lags shorter than 10 days.Within the frequency range studied (0.01–0.5 cycles per day for the daily sam-pled data), the power spectra are only mildly enhanced at low frequencies.
THE FUTURE
Some present trends seem likely to have a large impact on the future of GPSgeodesy. The price of GPS receivers is decreasing, promoting the growth of

P1: SDA/mkv P2: rpk/plb/vks QC: MBL/agr T1: MBL
March 27, 1997 9:30 Annual Reviews SEGATEXT.TXT AR29-10
GPS APPLICATIONS 331
permanent, dedicated regional networks for geophysical studies. Data collectedfor nonresearch applications (e.g. aircraft and ship navigation, regional differ-ential GPS networks) are, and will increasingly become, available for researchuses. Whereas in the past, permanent networks sacrificed spatial for tempo-ral resolution, the increased density of some GPS networks (e.g. in Japan andCalifornia) will provide unprecedented spatial and temporal sampling of crustaldeformation. Enhanced spatial coverage is vital for detecting coherent tectonicsignals.
A number of error sources that previously had not been considered in GPSstudies are now receiving serious consideration. The proliferation of permanentGPS systems provides as much data as any researcher can handle, from awide variety of locations, environments, and physical installations. Hypothesesconcerning the “repeatability” of parameter estimates may be rigorously tested,and the time- and space-dependence of parameter variations may be carefullyexamined. This wealth of data is a two-edged sword, for the groups whoseprimary task it is to process these data operationally can be strained simply tokeep up with the flow of data.
Newly collected GPS data should provide a tremendous improvement inour understanding of postseismic deformation. Increased spatial coverage willhave a profound impact on regional GPS studies. The number of sites willincrease from a few per plate, in many places, to the density needed to map thestrain-rate distribution and to associate features in the deformation field withspecific tectonic structures. The precision, greatly increased spatial coverage,and frequent sampling provided by current and future GPS networks will revealthe detailed space-time pattern of crustal deformation. These will in turn lead tosubstantial insights into the rheology of the crust and mantle and will allow fortime-dependent inversions for fault-slip distribution and the evolving geometryof magma bodies.
ACKNOWLEDGMENTS
The authors thank R Bennett, M Murray, and A Niell for their suggestions andcontributions.
Visit the Annual Reviews home pageathttp://www.annurev.org.
Literature Cited
Aki K, Richards PG. 1980.Quantitative Seis-mology: Theory and Methods.San Francisco:Freeman. 932 pp.
Argus DF, Heflin MB. 1995. Plate motion and
crustal deformation estimated with geode-tic data from the Global Positioning System.Geophys. Res. Lett.22:1973–76
Arnadottir T, Beavan J, Pearson C. 1995. De-

P1: SDA/mkv P2: rpk/plb/vks QC: MBL/agr T1: MBL
March 27, 1997 9:30 Annual Reviews SEGATEXT.TXT AR29-10
332 SEGALL & DAVIS
formation associated with the 18 June, 1994,Arthur’s Pass earthquake, New Zealand.NZ.J. Geol. Geophys.38:553–58
Arnadottir T, Segall P. 1994. The 1989 LomaPrieta earthquake imaged from inversion ofgeodetic data.J. Geophys. Res.99(B11):21835–55
Beavan J. 1993. Surface deformation due to theMw 7.8 Guam earthquake of August 8, 1993.Eos, Trans. Am. Geophys. Union74:183(Abstr.)
Bennett RA, Reilinger RE, Rodi W, Li Y, Toks¨ozMN, Hadnut K. 1995. Coseismic fault slip as-sociated with the 1992Mw 6.1 Joshua Tree,California, earthquake: implications for theJoshua Tree-Landers earthquake sequence.J.Geophys. Res.100(B4):6443–61
Bennett RA, Rodi W, Reilinger RE. 1996.Global Positioning System constraints onfault slip rates in southern California andnorthern Baja, Mexico.J. Geophys. Res.101(B10):21943–60
Beutler G, Brockmann E, Hugentobler U,Mervart L, Rotacher M, Weber R. 1996.Combining consecutive short arcs into longarcs for precise and efficient GPS orbit deter-mination.J. Geodesy70:287–99
Beutler G, Morgan P, Neilan RE. 1993. Geo-dynamics: tracking satellites to monitoringglobal change.GPS World4(2):40–42, 44,46
Bevis M, Taylor FW, Schutz BE, Recy J, IsacksBL, et al. 1995. Geodetic observations of veryrapid convergence and back-arc extension atthe Tonga arc.Nature374(6519):249–51
BIFROST Project Members. 1996. GPS mea-surements to constrain geodynamic processesin Fennoscandia.Eos, Trans. Am. Geophys.Union. 77(E07):337 and 341
Blewitt G. 1993. Advances in Global Position-ing System technology for geodynamics in-vestigations: 1978–1992. InContrib. SpaceGeodesy Geodyn.: Technol. Geodyn., Geo-dyn. Ser., ed. DE Smith, DL Turcotte, 25:195–213. Washington, DC: Am. Geophys.Union. 213 pp.
Blewitt G, Heflin MB, Hurst KJ, JeffersonDC, Webb FH, Zumberge JF. 1993. Abso-lute far-field displacements from the 28 June1992 Landers earthquake sequence.Nature361(6410):340–42
Bock Y, Agnew DC, Fang P, Genrich JF, HagerBH, et al. 1993. Detection of crustal de-formation from the Landers earthquake se-quence using continuous geodetic measure-ments.Nature361(6410):337–40
Burgmann R, Segall P, Lisowski M, Svarc JP.1996. Post-seismic strain following the 1989Loma Prieta earthquake from repeated GPSand leveling measurements.J. Geophys. Res.In press
Cohee BP, Beroza GC. 1994. A comparison oftwo methods for earthquake source inversionusing strong motion seismograms.Ann. Geo-fis.37(6):1515–38
Davis JL, Elgered G, Niell AE, Kuehn CE. 1993.Ground-based measurement of gradients inthe “wet” radio refractivity of air.Radio Sci.28:1003–18
Davis JL, Herring TA, Shapiro II. 1991. Ef-fects of atmospheric modeling errors on de-terminations of baseline vectors from verylong baseline interferometry.J. Geophys.Res.96:643–50
Davis JL, Herring TA, Shapiro II, Rogers AEE,Elgered G. 1985. Geodesy by radio interfer-ometry: effects of atmospheric modeling er-rors on estimates of baseline length.RadioSci.20:1593–1607
Davis JL, Mitrovica JX. 1996. Glacial isostaticadjustment and the anomalous tide gaugerecord of eastern North America.Nature379:331–33
DeMets C, Gordon RG, Argus DF, Stein S.1990. Current plate motions.Geophys. J. Int.101:425–78
DeMets C, Gordon RG, Argus DF, Stein S.1994. Effect of recent revisions to the ge-omagnetic reversal time scale on estimatesof current plate motions.Geophys. Res. Lett.21:2191–94
Dixon TH. 1991. An introduction to the GlobalPositioning System and some geological ap-plications.Rev. Geophys.29:249–76
Donnellan AB, Hager H, King RW. 1993. Dis-crepancy between geologic and geodetic de-formation rates in the Ventura basin.Nature366:333–36
Douglas BC. 1991. Global sea level rise.J. Geo-phys. Res.96:6981–92
Dragert H, Hyndman RD. 1995. ContinuousGPS monitoring of elastic strain in the north-ern Cascadia subduction zone.Geophys. Res.Lett.22(7)755–58
Du YJ, Segall P, Gao HJ. 1994. Dislocationsin inhomogeneous media via a moduli per-turbation approach: general formulation andtwo-dimensional solutions.J. Geophys. Res.99:3767–79
Dvorak J. 1994. An earthquake cycle along thesouth flank of Kilauea Volcano, Hawaii.J.Geophys. Res.99(B5):9533–41
Elgered G, Davis JL, Herring TA, ShapiroII. 1991. Geodesy by radio interferome-try: Water Vapor Radiometry for estimationof the wet delay.J. Geophys. Res.96:6541–55
Elosegui P, Davis JL, Jaldehag RTK, Johans-son JM, Niell AE, Shapiro II. 1995. Geodesyusing the Global Positioning System: the ef-fect of signal scattering on estimates of siteposition.J. Geophys. Res.100:9921–34
P1: SDA/mkv P2: rpk/plb/vks QC: MBL/agr T1: MBL
March 27, 1997 9:30 Annual Reviews SEGATEXT.TXT AR29-10
GPS APPLICATIONS 333
Elosegui P, Davis JL, Johansson JM, Shapiro II.1996. Detection of transient motions with theGlobal Positioning System.J. Geophys. Res.101(11):11249–61
Feigl KL, Agnew DC, Bock Y, Dong D, Donnel-lan A, et al. 1993. Space geodetic measure-ment of crustal deformation in central andsouthern California, 1984–1992.J. Geophys.Res.98(B12):1677–712
Feigl KL, King RW, Herring T, Rotacher M.1991. A scheme for reducing the effectof selective availability on precise geode-tic measurements from the Global Position-ing System.Geophys. Res. Lett.18:1289–92
Fjeldskaar W, Cathles L. 1991. Rheology ofmantle and lithosphere inferred from post-glacial uplift in Fennoscandia. InGlacialIsostasy, Sea-Level, and Mantle Rheology,ed. R Sabadini, K Lambeck, E Boschi, pp.1–19. Dordrecht: Kluwer
Fliegel HF, Gallini TE, Swift ER. 1992. GlobalPositioning System radiation force modelfor geodetic applications.J. Geophys. Res.97:559–68
Foulger GR, Jahn CH, Seeber G, Einarsson P,Julian BR, Heki K. 1992. Post-rifting stress-relaxation at the divergent plate boundary inNE Iceland.Nature358:488–90
Freymueller J, King NE, Segall P. 1994. The co-seismic slip distribution of the Landers earth-quake.Bull. Seismol. Soc. Am.84(3):646–59
Fujinawa Y, Shimada S, Ohmi S, Sekiguchi S,Eguchi T, Okada Y. 1991. Fixed point GPSobservation of crustal movement associatedwith the 1989 seismic swarm and submarinevolcanic activities off Ito, central Japan.J.Phys. Earth39:141–53
Genrich JF, Bock Y. 1992. Rapid resolutionof crustal motion at short ranges with theGlobal Positioning System.J. Geophys. Res.97:3261–69
Hager BH, King RW, Murray MH. 1991. Mea-surement of crustal deformation using theGlobal Positioning System.Annu. Rev. EarthPlanet. Sci.19:351–82
Heflin MB, Bertiger WI, Blewitt G, FreedmanAP, Hurst KJ, et al. 1992. Global geodesy us-ing GPS without fiducial sites.Geophys. Res.Lett.19:131–34
Heki K, Foulger GR, Julian BR, Jahn CH.1993. Plate dynamics near divergent bound-aries: geophysical implications of postriftingcrustal deformation in NE Iceland.J. Geo-phys. Res.98(B8):14279–97
Hofmann-Wellenhof B, Lichtenegger H,Collins J. 1994.GPS Theory and Practice.New York: Springer-Verlag. 3rd ed.
Hudnut KW, Bock Y, Cline M, Fang P, Feng Y,et al. 1994. Co-seismic displacements of
the 1992 Landers earthquake sequence.Bull.Seismol. Soc. Am.84:625–45
Hudnut KW, Shen Z, Murray M, McClusky S,King R, et al. 1996. Co-seismic displace-ments of the 1994 Northridge, California,earthquake.Bull. Seismol. Soc. Am.86(1B):S19–36
Jaldehag RTK. 1995. Space geodetic tech-niques: an experimental and theoretical studyof antenna related error sources.Tech. Rep.276. Goteborg, Sweden: Chalmers Univ.Technol.
Jaldehag RTK, Johansson JM, Ronnang BO,Elosegui P, Davis JL, Shapiro II. 1996.Geodesy using the Swedish permanent GPSnetwork: effects of snow accumulation on es-timates of site positions.Geophys. Res. Lett.23:1601–4
James TS, Ivins ER. 1995. Present-day Antarc-tic ice changes and crustal motion.Geophys.Res. Lett.22:973–76
Johansson JM, Elgered G, Davis JL. 1993. Wetpath delay algorithms for use with microwaveradiometer data. InContrib. Space GeodesyGeodyn.: Technol., Geodyn. Ser., ed. DESmith, DL Turcotte, 25:81–98. Washington,DC: Am. Geophys. Union
Johnson HO, Agnew DC, Hudnut K. 1994.Extremal bounds on earthquake movementfrom geodetic data; application to the Lan-ders earthquake.Bull. Seismol. Soc. Am.84(3):660–67
Johnson HO, Agnew DC. 1995. Monument mo-tion and measurements of crustal velocities.Geophys. Res. Lett.22:2905–8
King NE, Svarc JL, Fogleman EB, GrossWK, Clark KW, et al. 1995. ContinuousGPS observations across the Hayward Fault,California, 1991–1994.J. Geophys. Res.100(B10):271–83
Krauss JD. 1988.Antennas. New York:McGraw-Hill. 892 pp. 2nd ed.
Kuehn CE, Elgered G, Johansson JM, Clark TA,Ronnang BO. 1993. A microwave radiometercomparison and its implications for the accu-racy of wet delays. InContrib. Space GeodesyGeodyn.: Technol., Geodyn. Ser., ed. DESmith, DL Turcotte. 25:99–114. Washington,DC: Am. Geophys. Union
Langbein J, Wyatt F, Johnson H, HamannD, Zimmer P. 1995. Improved stability ofa deeply anchored geodetic monument fordeformation monitoring.Geophys. Res. J.22(24):3533–36
Larsen S, Reilinger R, Neugebauer H, StrangeW. 1992. Global Positioning System mea-surements of deformations associated withthe 1987 Superstition Hills earthquake.J.Geophys. Res.97(4):4885–902
Larson KM. 1993. Application of the GlobalPositioning System to crustal deformation

P1: SDA/mkv P2: rpk/plb/vks QC: MBL/agr T1: MBL
March 27, 1997 9:30 Annual Reviews SEGATEXT.TXT AR29-10
334 SEGALL & DAVIS
measurements. 3. Results from the south-ern California borderlands.J. Geophys. Res.98(B12):1713–26
Larson KM, Agnew DC. 1991. Application ofthe Global Positioning System to crustal de-formation measurements. 1. Precision and ac-curacy.J. Geophys. Res.96(B10):16547–65
Larson KM, Freymueller J. 1995. Relative mo-tions of the Australian, Pacific and Antarc-tic plates estimated by the Global PositioningSystem.Geophys. Res. Lett.22(1):37–40
Larson KM, Lisowski M. 1994. Strain accu-mulation in the Shumagin Islands: resultsof initial GPS measurements.Geophys. Res.Lett.21(6):489–92
Larson KM, Webb FH, Agnew DC. 1991. Ap-plication of the Global Positioning Systemto crustal deformation measurements. 2. Theinfluence of errors in orbit determinationnetworks.J. Geophys. Res.96(B10):16567–84
Leick A. 1995.GPS Satellite Surveying.NewYork: Wiley & Sons. 560 pp.
Lisowski M, Prescott WH, Savaga JC, John-stone MJS. 1990. Geodetic estimate of co-seismic slip during the 1989 Loma Prieta,California, earthquake.Geophys. Res. Lett.17(9):1437–40
Liu LB, Zoback MD, Segall P. 1992. Rapidintraplate strain accumulation in the NewMadrid seismic zone.Science257:1666–69
Lu G, Lachapelle G. 1992. Statistical qual-ity control for kinematic GPS positioning.Manuscr. Geod.17:270–81
Lundgren PR, Wolf SK, Protti M, Hurst KJ.1993. GPS measurements of crustal defor-mations associated with the 22 April 1991,Valle de la Estrella, Costa Rica earthquake.Geophys. Res. Lett.20(5):407–10
MacMillan DS. 1995. Atmospheric gradientsfrom very long baseline interferometry.Geo-phys. Res. Lett.22:1041–44
Manga M, O’Connell RJ. 1995. The tectosphereand postglacial rebound.Geophys. Res. Lett.22:1949–52
Massonet D, Feigl KL, Vadon H, Rossi M. 1996.Coseismic deformation field of theM = 6.7Northridge, California earthquake of Jan-uary 17, 1994 recorded by two radar satel-lites using interferometry.Geophys. Res. Lett.23:969–72
Matthews MV, Segall P. 1993. Statistical inver-sion of crustal deformation data and estima-tion of the depth distribution of slip in the1906 earthquake.J. Geophys. Res.98:12153–63
Melbourne T, Carmichael I, DeMets C, Hud-nut K, Sanchez O, et al. 1996. Shallow fault-ing and regional subsidence in the Mw 8.01995 Jalisco Subduction earthquake.Geo-phys. Res. Lett.(Submitted)
Merminod B, Rizos C. 1994. Optimisation ofrapid static GPS surveys.Manuscr. Geod.19:231–46
Mitrovica JX. 1996. Haskell (1935) revisited.J.Geophys. Res.101:555–69
Mitrovica JX, Davis JL. 1995. Sea level changefar from the Late Pleistocene ice sheets: im-plications for recent analyses of tide gaugerecords.Geophys. Res. Lett.22:2529–32
Mitrovica JX, Davis JL, Shapiro II. 1994.A spectral formalism for computing three-dimensional deformations due to surfaceloads, 1. Theory.J. Geophys. Res.99:7057–74
Miyazaki S, Tsuji H, Hatanaka Y, Abe Y,Yoshimura A, et al. 1996. Establishment ofthe nationwide GPS array (GRAPES) and itsinital results on the crustal deformation ofJapan.Bull. Geogr. Surv. Inst.(Jpn.) 42:27–41
Murray M, Marshall GA, Lisowski M, Stein RS.1996. The 1992M = 7 Cape Mendocino,California, Earthquake: coseismic deforma-tion at the south end of the Cascadia megath-rust.J. Geophys. Res.101:17707–25
Niell AE. 1996. Global mapping functions forthe atmospheric delay at radio wavelengths.J. Geophys. Res.101:3227–46
Noomen R, Springer TA, Ambrosius BAC,Herzberger K, Kuijper DC, et al. 1996.Crustal deformations in the Mediterraneanarea computed from SLR and GPS observa-tions.J. Geodyn.21:73–96
Office of Science and Technology Policy. 1996.US Global Positioning System Policy, FactSheet. Washington, DC: Off. Sci. Technol.Policy
Okada Y, Yamamoto E. 1991. A dyke intru-sion model for the 1989 seismovolcanic acti-vity off Ito, central Japan.J. Geophys. Res.96:10361–76
Oral MB, Reilinger RE, Toksoz MN, King RW,Barka AA, et al. 1995. Global PositioningSystem offers evidence of plate motions inthe eastern Mediterranean.Eos, Trans. Am.Geophys. Union76(2):9–11
Owen S, Segall P, Freymueller J, Miklius A,Denlinger R, et al. 1995. Rapid deforma-tion of the south flank of Kilauea Volcano,Hawaii.Science267:1328–32
Pan M, Sjoberg LE. 1993. Baltic Sea Levelproject with GPS.Bull. Geod.67:51–59
Parkinson BW, Spilker JJ Jr, Axelrad P, Enge P,eds. 1996.Global Positioning System: The-ory and Applications.Washington, DC: Am.Inst. Aeronaut. Astronaut. 2 Vol.
Rocken C, Johnson J, Nielan RE, Cerezo M,Jordan J, et al. 1991. The measurements ofatmospheric water vapor: radiometer com-parison and spatial variations.IEEE Trans.Geosci. Remote Sens.29:3–8

P1: SDA/mkv P2: rpk/plb/vks QC: MBL/agr T1: MBL
March 27, 1997 9:30 Annual Reviews SEGATEXT.TXT AR29-10
GPS APPLICATIONS 335
Rocken C, Meertens C. 1991. Monitoring selec-tive availability dither frequencies and theireffect on GPS data.Bull. Geod. 65:162–69
Rocken C, Van Hove T, Johnson J, SolheimF, Ware R, et al. 1995. GPS/STORM—GPSsensing of atmospheric water vapor for mete-orology.J. Atmos. Ocean. Technol.12:468–78
Ruegg JC, Campos J, Armijo R, BarrientosS, Briole P, et al. 1996. TheMw = 8.1Antofagasta (North Chile) earthquake of July30, 1995: first results from teleseismic andgeodetic data.Geophys. Res. Lett.23:917–20
Santerre R. 1991. Impact of GPS satellitesky distribution. Manuscr. Geod.16:28–53
Sauber J, Plafker G, Gipson J. 1995. Geodeticmeasurements used to estimate ice transferduring Bering Glacier surge.Eos, Trans. Am.Geophys. Union76:289–90
Savage JC, Lisowski M, Svarc JL. 1994.Postseismic deformation following the 1989(M = 7.1) Loma Prieta, California, earth-quake.J. Geophys. Res.99:13757–65
Savage JC, Svarc JL. 1997. Postseismic defor-mation associated with the 1992Mw = 7.3Landers earthquake, southern California.J.Geophys. Res.In press
Schupler BR, Allshouse RL, Clark TA. 1994.Signal characteristics of GPS user antennas.Navigation41:277–95
Shen Z, Ge BX, Jackson DD, Potter D, ClineM, Sung L. 1996. Northridge earthquake rup-tures based on the Global Positioning Sys-tem measurements.Bull. Seismol. Soc. Am.86(1B):37–48
Shen ZK, Jackson DD, Feng Y, Cline M, Kim M,et al. 1994. Postseismic deformation follow-ing the Landers earthquake, California, 28June 1992.Bull. Seismol. Soc. Am.84:780–91
Shimada S, Bock Y. 1992. Crustal deformationmeasurements in central Japan determined bya Global Positioning System fixed point net-work. J. Geophys. Res.97:12437–55
Shimada S, Fujinawa Y, Sekiguchi S, Ohmi S,Eguchi T, Okada Y. 1990. Detection of a vol-canic fracture in Japan using Global Position-ing System measurements.Nature343:631–33
Straub C, Kahle HG. 1995. Active crustal de-formation in the Marmara Sea region, NWAnatolia, inferred from GPS measurements.Geophys. Res. Lett.22:2533–36
Tabei T, Kato T, Catane JPL, Chachin T,Fujimori K, et al. 1996. Crustal deformationassociated with the 1995 Hyogo-ken Nanbuearthquake, Japan, derived from GPS mea-surements.J. Phys. Earth.Special issue. Inpress
Taylor FW, Bevis MG, Kuang D, Schutz BE,Recy J, et al. 1995. Geodetic measurementsof convergence at the New Hebrides is-land arc indicate arc fragmentation causedby an impinging aseismic ridge.Geology23(11):1011–14
Tranquilla JM, Al-Rizzo HM. 1993. Theoret-ical and experimental evaluation of preciserelative positioning during periods of snow-fall precipitation using the Global PositioningSystem.Manuscr. Geod.18:362–79
Tranquilla JM, Carr JP, Al-Rizzo HM. 1994.Analysis of a choke ring groundplane formultipath control in Global PositioningSystem (GPS) applications.IEEE Trans. An-tennas Propag.42:905–11
Tsuji H, Hatanaka Y, Sagiya T, HashimotoM. 1995. Coseismic crustal deformationfrom the 1994 Hokkaido-Toho-Oki earth-quake monitored by a nationwide continu-ous GPS array in Japan.Geophys. Res. Lett.22(13):1669–72
Tushingham AM, Peltier WR. 1992. Validationof the ICE-3G model of Wurm-Wisconsindeglaciation using a global data base of rel-ative sea level histories.J. Geophys. Res.97:3285–304
vanDam TM, Blewitt G, Heflin MB. 1994. At-mospheric pressure loading effects on GlobalPositioning System coordinate determina-tions.J. Geophys. Res.99:23939–50
Wahr J, DaZhong H, Trupin A. 1995. Predic-tions of vertical uplift caused by changing po-lar ice volumes on a viscoelastic Earth.Geo-phys. Res. Lett.22:977–80
Wald DJ, Heaton TH. 1994. Spatial and tem-poral distribution of slip for the 1992 Lan-ders, California, earthquake.Bull. Seismol.Soc. Am.84(3):668–91
Wald DJ, Heaton TH, Hudnut KW. 1996. Theslip history of the 1994 Northridge, Cali-fornia, earthquake determined from strong-motion, teleseismic, GPS, and levelingdata.Bull. Seismol. Soc. Am.86(1B):S49–70
Ware R, Rocken C, Solheim F, Van Hove T,Alber C, Johnson J. 1993. Pointed WaterVapor Radiometer corrections for accurateGlobal Positioning System surveying.Geo-phys. Res. Lett.20:2635–38
Weber JC. 1995.New Madrid seismic zonedeformation from repeat Global PositioningSystem (GPS) surveys. PhD thesis. North-western Univ., Evanston, Ill. 141 pp.
Williams C, Arnadottir T, Segall P. 1993. Co-seismic deformation and dislocation modelsof the 1989 Loma Prieta earthquake derivedfrom Global Positioning System measure-ments.J. Geophys. Res.98:4567–78
Wu JT, Wu SC, Hajj GA, Bertiger WI, LichtenSM. 1993. Effects of antenna orientation on

P1: SDA/mkv P2: rpk/plb/vks QC: MBL/agr T1: MBL
March 27, 1997 9:30 Annual Reviews SEGATEXT.TXT AR29-10
336 SEGALL & DAVIS
GPS carrier phase.Manuscr. Geod.18:91–98
Yoshida S, Koketsu K, Shibazaki B, Sagiya T,Kato T, Yoshida Y. 1996. Joint inversion ofnear and far-field waveforms and geodeticdata for the rupture process of the 1995 Kobeearthquake.J. Phys. Earth.Special issue. Inpress
Yuan LL, Anthes RA, Ware RH, Rocken C,Bonner WD, et al. 1993. Sensing climatechange using the global positioning system.J. Geophys. Res.98:14925–37
Zumberge JF, Liu R, Neilan RE. 1995.1994Annual Rep., Int. GPS Serv. Geodyn., IGSCentral Bur., Jet Propulsion Lab., Pasadena,CA