kinematics of the east african rift from gps and earthquake...
TRANSCRIPT

1
Kinematics of the East African Rift from GPS and Earthquake Slip Vector Data E. Calais Purdue University, Department of Earth and Atmospheric Sciences, West Lafayette, Indiana, U.S.A., [email protected] C. Ebinger Department of Geology , Royal Holloway, University of London, Egham, U.K. C. Hartnady Umvoto Africa (Pty) Ltd, PO Box 61, Muizenberg, South Africa 7950 J.M. Nocquet CNRS, UMR6526 Géosciences Azur, Valbonne, France Abbreviated title: Kinematics of the East African Rift
2
Abstract. Although the East African rift system (EAR) is often cited as the archetype for
models of continental rifting and breakup, its present-day kinematics remains poorly
constrained. We show that the currently available GPS and earthquake slip vector data are
consistent with (1) a present-day Nubia-Somalia Euler pole located between the southern tip
of Africa and the Southwest Indian ridge, (2) the existence of a distinct microplate (Victoria)
between the Eastern and Western rifts, rotating counter-clockwise with respect to Nubia.
Geodetic and geological data also suggest the existence of a (Rovuma) microplate between
the Malawi rift and the Davie ridge, possibly rotating clockwise with respect to Nubia. The
data indicate that the EAR comprises at least two rigid lithospheric blocks bounded by
narrow belts of seismicity (<50 km wide) marking localized deformation rather than a wide
zone of quasi-continuous, pervasive deformation. On the basis of this new kinematic model
and mantle flow directions interpreted from seismic anisotropy measurements, we propose
that regional asthenospheric upwelling and locally focused mantle flow may influence
continental deformation in East Africa.

3
The East African Rift (EAR), a 5,000 km long series of fault-bounded depressions straddling
east Africa in a roughly NS direction, marks the divergent boundary between two major
tectonic plates, Somalia and Nubia (Figure 1). Although the EAR is often cited as a modern
archetype for rifting and continental breakup and a Cenozoic continental flood basalt
province, its current kinematics is still poorly understood and quantified, owing in part to its
tremendous extent and inaccessibility.
Jestin et al. (1994) were among the first to quantify the kinematics of the EAR by
estimating a 3 My average Nubia-Somalia angular velocity. Using Arabia-Nubia and Arabia-
Somalia relative motions determined from marine geophysical data in the Red Sea and the
Gulf of Aden, they find a Nubia-Somalia Euler pole south of the Southwest Indian Ridge
(Figure 1). Their result differs significantly from that of Chu & Gordon (1999), who estimate
a 3 My average Nubia-Somalia angular velocity from marine geophysical data along the
Southwest Indian ridge and the Antarctica-Somalia and Antarctica-Nubia plate closure circuit
(Figure 1). More recently, direct estimates of the Nubia-Somalia plate motion have been
made possible thanks to a limited number of permanent Global Positioning System (GPS)
stations on both plates. For instance, Sella et al. (2002) used 2 GPS sites on the Somalian
plate and 4 on the Nubian plate, while Fernandes et al. (2004) used 3 GPS sites on the
Somalian plate and 11 on the Nubian plate and longer data time series. Again, these two GPS
estimates of the Nubia-Somalia angular velocity differ significantly from each other, as well
as from previous results derived from oceanic data (Figure 1).
In addition to far-field plate motions, the kinematics of the EAR itself remains an open
question. Some authors have proposed that the EAR consists of a mosaic of rigid lithospheric
blocks bounded by localized deformation within narrow seismically and volcanically active
rift valleys (e.g., Ebinger 1989; Hartnady 2002). Others favor a broad deformation zone (e.g.,
Gordon 1998) implicit in models that assume a weak mantle lithosphere beneath continents

4
(e.g., Jackson 2002). But the distribution of strain across and along the EAR is currently
unknown and no quantitative kinematic data are presently available for that plate boundary.
In this paper, we use an updated GPS and earthquake slip vector data set to estimate the
Somalia-Nubia angular velocity and propose a first-order kinematic model for present-day
deformation in the EAR.
2 GPS Data
We processed GPS data from 10 permanent GPS sites operating on the Nubian plate (MAS1,
GOUG, NKLG, ZAMB, RBAY, SUTH, SUTM, HRAO, HARB, SIMO), the 3 sites available
on the Somalian plate (MALI, SEY1, REUN), and one site in the EAR (MBAR). The results
presented here include all the publicly available data from August 1998 to April 2005. We
processed the GPS data using the GAMIT software version 10.2 (King and Bock 2005). We
solved for station coordinates, satellite state vectors, one tropospheric delay every four hours
at each site, and phase ambiguities using double-differenced GPS phase measurements, with
International GPS Service (IGS) final orbits and International Earth Rotation Service (IERS)
earth orientation parameters relaxed. We then combined our regional daily solutions with
global Solution Independent Exchange (SINEX) files from the IGS daily processing routinely
done at Scripps Institution of Oceanography and imposed the reference frame by minimizing
the position deviations of 38 globally-distributed IGS core stations with respect to the
International Terrestrial Reference Frame 2000 (ITRF2000; Altamimi et al. 2002), while
estimating an orientation and translation transformation. Our primary result consists of
precise positions and velocities at 14 continuous GPS sites on the Nubian and Somalian
plates, expressed in ITRF2000 (Figure 2; Table 1). In a second step, explained hereafter, we
rotate these velocities in a Nubia-fixed frame.
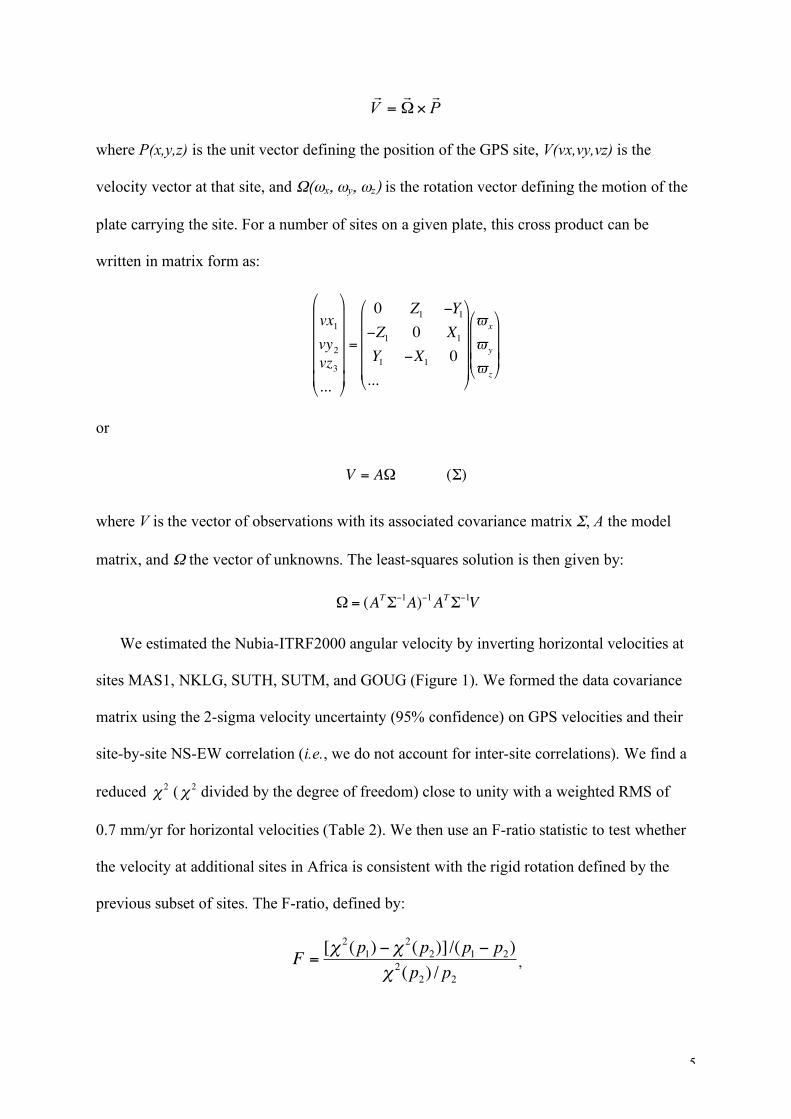
GPS velocities, in a Cartesian geocentric frame, can be modeled as:
5
PV
rrr!"=
where P(x,y,z) is the unit vector defining the position of the GPS site, V(vx,vy,vz) is the
velocity vector at that site, and Ω(ωx, ωy, ωz) is the rotation vector defining the motion of the
plate carrying the site. For a number of sites on a given plate, this cross product can be
written in matrix form as:
!
vx1
vy2
vz3
...
"
#
$ $ $ $ $
%
&
' ' ' ' '
=
0 Z1
(Y1
(Z1
0 X1
Y1
(X1
0
...
"
#
$ $ $ $
%
&
' ' ' '
) x
) y
) z
"
#
$ $ $
%
&
' ' '
or
!
V = A" (#)
where V is the vector of observations with its associated covariance matrix Σ, A the model
matrix, and Ω the vector of unknowns. The least-squares solution is then given by:
!
" = (AT#$1A)
$1AT#$1V
We estimated the Nubia-ITRF2000 angular velocity by inverting horizontal velocities at
sites MAS1, NKLG, SUTH, SUTM, and GOUG (Figure 1). We formed the data covariance
matrix using the 2-sigma velocity uncertainty (95% confidence) on GPS velocities and their
site-by-site NS-EW correlation (i.e., we do not account for inter-site correlations). We find a
reduced
!
" 2 (
!
" 2 divided by the degree of freedom) close to unity with a weighted RMS of
0.7 mm/yr for horizontal velocities (Table 2). We then use an F-ratio statistic to test whether
the velocity at additional sites in Africa is consistent with the rigid rotation defined by the
previous subset of sites. The F-ratio, defined by:
!
F =[" 2(p
1) # " 2(p
2)]/(p
1# p
2)
" 2(p2) / p
2
,

6
tests the significance of the decrease in χ2 from a model with p2 versus p1 degrees of
freedom, with p1 > p2. This experimental F-ratio is compared to the expected value of a F(p1-
p2, p1) distribution for a given risk level α % (equivalent to a (100-α ) % confidence level)
that the null hypothesis (the additional site is consistent with the rigid plate model) can be
rejected. The degree of freedom of a rigid rotation estimation is p1=2×N-3 for N site
velocities, it becomes p2=2×N-3-2 with an additional site. For site ZAMB, the F-test value is
F = [(8.52-7.53)/(9-7)] / [7.53/7] = 0.4 (using values provided in Table 1), corresponding to
α = 0.32. The velocity at ZAMB is consistent with a Nubian plate model (defined by sites
MAS1, NKLG, SUTH, SUTM, and GOUG) at a 68% confidence level. This indicates that
the relative motion between the Zambia craton and the stable Nubian plate is less than the
residual velocity at ZAMB, or ~1 mm/yr. The same F-ratio test with sites HRAO, HARB,
and RBAY (F = [(12.87-7.53)/(15-7)] / [7.53/7] = 0.62, α = 0.25) shows that these sites are
consistent with the Nubian plate model defined above at a 75% confidence level. However,
both HRAO and RBAY are separated from stable Nubia by the seismically active Okavango
Rift in Botswana (Modisi et al. 2000) and the Senqu Seismic Belt in South Africa and
Lesotho (Hartnady 1998) and may lie on a microplate separate from Nubia and Somalia
(Transgariep block of Hartnady 2002). We therefore did not use them in our final Nubia-
ITRF2000 angular velocity estimate.
3 Somalia-Nubia plate motion
We finally rotate the ITRF2000 velocities into a Nubia-fixed frame using the Nubia-ITRF
angular velocity estimated with MAS1, NKLG, SUTH, SUTM, and GOUG. We use the
Nubia-fixed velocities at sites MBAR, MALI, SEY1, and REUN in the following kinematic
analysis. In addition to GPS velocities, we use slip vectors derived from the 53 focal
mechanisms determined from body-waveform inversion by Foster & Jackson (1998),
7
augmented by the Harvard Centroid Moment Tensor (CMT) database (Figure 3A). We use
the same slip vectors as Foster & Jackson (1998), who based their choice on structural
framework of each epicentral region. We follow the same criteria for the additional CMT
events. The joint inversion of geodetic and slip vector data is based on the maximum
likelihood algorithm of Minster & Jordan (1978) and fitting functions of Chase (1978),
modified to incorporate ability to use geodetic vectors and their statistics.
First, we solve for the Somalia-Nubia angular velocity in a 2-plate inversion (Nubia-
Somalia) using sites MALI, SEY1, and REUN plus 9 earthquake slip vectors along the Main
Ethiopian Rift, a fairly simple single structure that marks the boundary between Nubia and
Somalia between latitudes 5°N and 10°N (Figure 1; Table 2). We repeated the inversion for
Somalia-Nubia angular velocity without using earthquake slip vectors along the Main
Ethiopian Rift and found a similar result. The associated 1-sigma confidence ellipse includes,
although barely, previous GPS-derived Somalia-Nubia estimates by Fernandes et al. (2004),
Sella et al. (2002), and Prawirodirdjo & Bock (2004). Differences between GPS estimates of
plate motions may stem from the length of the time series used in the analysis, the version of
the global reference frame used and its implementation, and the choice of sites used to define
stable plates. Here, it is likely that the major difference is due to site REUN on the Somalian
plate. For instance, Sella et al. (2002) and Prawirodirdjo & Bock (2004) do not use REUN in
their analysis. Sella et al. (2002) define Somalia using 2 sites only (SEY1 and MALI), to
which Prawirodirdjo & Bock (2004) add RBAY, even though that site is located on the
Nubian side of the Nubia-Somalia plate boundary of Lemaux et al.’s (2002; Figure 1).
Fernandes et al. (2004) define Somalia using the same sites as our study but obtain a
significantly different velocity at REUN (Figure 1), rotated counter-clockwise compared to
our solution. This shifts their Somalia-Nubia Euler pole south compared to ours. The reason
for the velocity difference at REUN between the two solutions is unclear, as they agree better
8
for other sites. It may be due to the shorter time series used by Fernandes et al. (2004), which
stops in mid-2003, or to possible volcanic deformation. However, the 5-year long position
time series at REUN shows a linear displacement over that time period (in spite of a data gap
between mid-2000 and mid-2001; Figure 2), with no clear indication of transient deformation
due to volcanic processes.
The reason for a difference between our Somalia-Nubia estimate and Chu & Gordon’s
(1999) is less clear, but could reflect changes in the regional plate kinematics over the past
3 My (Calais et al. 2003), a time of propagating plate boundaries in the Afar depression (e.g.,
Courtillot et al. 1999). Clearly, additional measurements at more sites on the Somalian plate
(e.g., eastern Ethiopia, Somalia, Madagascar) are needed to firmly establish the present-day
Somalia-Nubia motion.
We then compare the observed velocity at site MBAR with the one predicted by the
Somalia-Nubia angular velocity defined above (Figure 3A). Site MBAR shows a
significantly smaller magnitude than predicted and is rotated clockwise, in a direction close
to earthquake slip vectors along the Western rift. This is consistent with the fact that MBAR
is located on cratonic lithosphere within the Nubia-Somalia plate boundary zone, east of the
Western rift. In addition, Figure 3A shows that earthquake slip vector directions are constant
or vary smoothly along each of the major tectonic segments of the EAR (thin colored arrows
on Figure 3A), as also observed by Foster & Jackson (1998), but are inconsistent with the
predicted Nubia-Somalia plate motion direction along most of the EAR (thick orange arrows
on Figure 3B). These misfits between GPS velocities or earthquake slip vector directions and
Somalia-Nubia plate motion models indicate plate boundary zone deformation between
Nubia and Somalia, in the form of continuously distributed strain or of rigid block motions.
Seismicity, active faulting, and volcanism in the EAR are generally localized to the 50-
80 km wide Ethiopian rift, and the Western and Eastern rift valleys that bound the unfaulted

9
and relatively aseismic Tanzania craton (Figure 3). Seismic tomography models reveal a 200-
250 km-deep keel beneath this small Archaean craton (Ritsema et al. 1998). We discuss
hereafter a possible microplate geometry, on the basis of seismotectonic data, and test this
hypothesis by jointly inverting GPS and earthquake slip vector data for a 3-plate kinematic
model. We do not attempt to account for the belts of seismicity and faulting west of Lakes
Rukwa and Nyasa (Malawi) (Figure 3A), where the lack of data would make the analysis too
speculative.
4 Kinematics of the EAR
The northernmost seismic belt of the EAR corresponds to the Main Ethiopian rift, a single
boundary between Nubia and Somalia (Figure 3A). Near the Ethiopia-Sudan-Kenya border
lies a complex zone of deformation where the EAR overprints Mesozoic to Paleogene rifts
(e.g., Hendrie et al. 1994). Seismicity is more diffuse and fault offsets are small in these
poorly understood zones. South of about 3°N, teleseismic and tectonic activity splits into two
branches, the Eastern and Western rifts (Figure 3). Most of the teleseismic activity is
concentrated in the Western rift, which contains a relatively small volume of volcanic
material (e.g., Foster & Jackson 1998). On the contrary, the Eastern rift has eruptive centers
along its length and moderate seismic activity, except near its southern termination at the
edge of the Tanzania craton (e.g., Nyblade & Langston 1995; Foster & Jackson 1998). The
Western rift wraps around the Archean Tanzania craton and connects southward with the
Malawi rift via the reactivated Mesozoic Rukwa rift. Seismicity and field evidence for active
deformation along the Malawi rift end between 20°S and 25°S (Figure 3). Other seismic belts
include a narrow, N-S trending zone of seismicity along the Davie Ridge in the Mozambique
channel (Grimison & Chen 1988) and the NE-SW trending Mweru and Zambezi rifts on both
sides of the Early Proterozoic Zambia (Bangweulu) block.

10
These seismic belts bound broad areas mostly devoid of seismic activity. A northern
block, centered on the Tanzania Archean craton and bounded by the western and eastern
branches of the EAR, has been referred to as the Victoria (Kaz’min et al. 1987) or Ukerewe-
Nyanza (Hartnady 2002; Hartnady & Mlisa 2004) block (Figure 3B). A southern block,
bounded to the west by the Malawi rift and to the east by the Davie Ridge, has been
previously identified as the Rovuma block (Hartnady 2002). The eastern boundary of this
block may encompass parts of Madagascar, where earthquake slip vectors have a similar
direction as along the Davie Ridge (Figure 3A). The boundary between the Victoria and
Rovuma blocks is less clear as it is not well expressed in the seismicity or by recent faulting.
Localized deformation occurs in the Usangu and Ruhuhu grabens (Figure 3A), where seismic
reflection, field, gravity, and remote sensing data indicate recent extension along
morphologically young normal faults that connect further north with the Eastern rift (Harper
et al. 1999; Le Gall et al. 2004).
We estimate angular velocities for Somalia and Victoria with respect to Nubia by
simultaneously inverting GPS velocities at sites MBAR (Victoria block) and REUN, SEY1,
and MALI (Somalian plate) with earthquake slip vectors along the Main Ethiopian Rift
(Somalia-Nubia boundary), the Western rift (Victoria-Nubia boundary), and the Eastern rift
(Victoria-Somalia boundary). We use a 20° standard deviation for earthquake slip vector
directions, the 2-σ standard deviation for GPS velocities, and impose plate circuit closure in
the inversion. Results are given in Table 2 and shown on Figure 1 and 3B. The reduced
!
" 2 is
close to unity, meaning that a 3-plate model is consistent with the data within their
uncertainties. We find a Somalia-Nubia velocity statistically similar to the 2-plate inversion
above, which is expected since no additional data is used to define the Somalian plate motion.
We find that the kinematics of the Victoria block can be described by a counterclockwise
rotation with respect to Nubia about a pole located in NE Sudan (Figure 3B). Equivalently, its

11
kinematics with respect to Somalia can be described by a counterclockwise rotation about a
pole located in northern Zambia (Figure 3B).
Figure 3B shows the extension direction and rate predicted by our model along the
eastern and western branches of the EAR, which we assumed to represent the boundaries of
the Victoria microplate. We find that 2 to 5 mm/yr, or 40 to 100% of the total Somalia-Nubia
plate motion, is accommodated by extension across the Western rift, with present-day rates
increasing from north to south. Our model predicts oblique extension in the Albert rift at the
northern end of the Western rift, consistent with seismic reflection data showing a significant
strike-slip component (Abeinomugisha et al. 2004). Conversely, 3.5 to 1 mm/yr, or 60 to 20%
of the total Somalia-Nubia plate motion, is accommodated by extension across the Eastern
rift, with rates decreasing from north to south. This southward decrease of the extension rate
is consistent with the decrease in seismicity and with the progressive disappearance of
prominent active faults southward along the eastern branch, as it propagates into cold cratonic
domain (Le Gall et al. 2004).
The kinematics of the Rovuma block cannot be fully quantified because there are no GPS
data to estimate its rotation rate. However, earthquake slip vector directions and aligned
chains of Quaternary eruptive centres along the Malawi rift (Rovuma-Nubia boundary) and
the Davie ridge, the assumed Rovuma-Somalia boundary, provide some first-order
constraints. ENE-directed slip vectors along the Malawi rift provide the direction of motion
of the Rovuma block with respect to Nubia along the western border of the Rovuma block
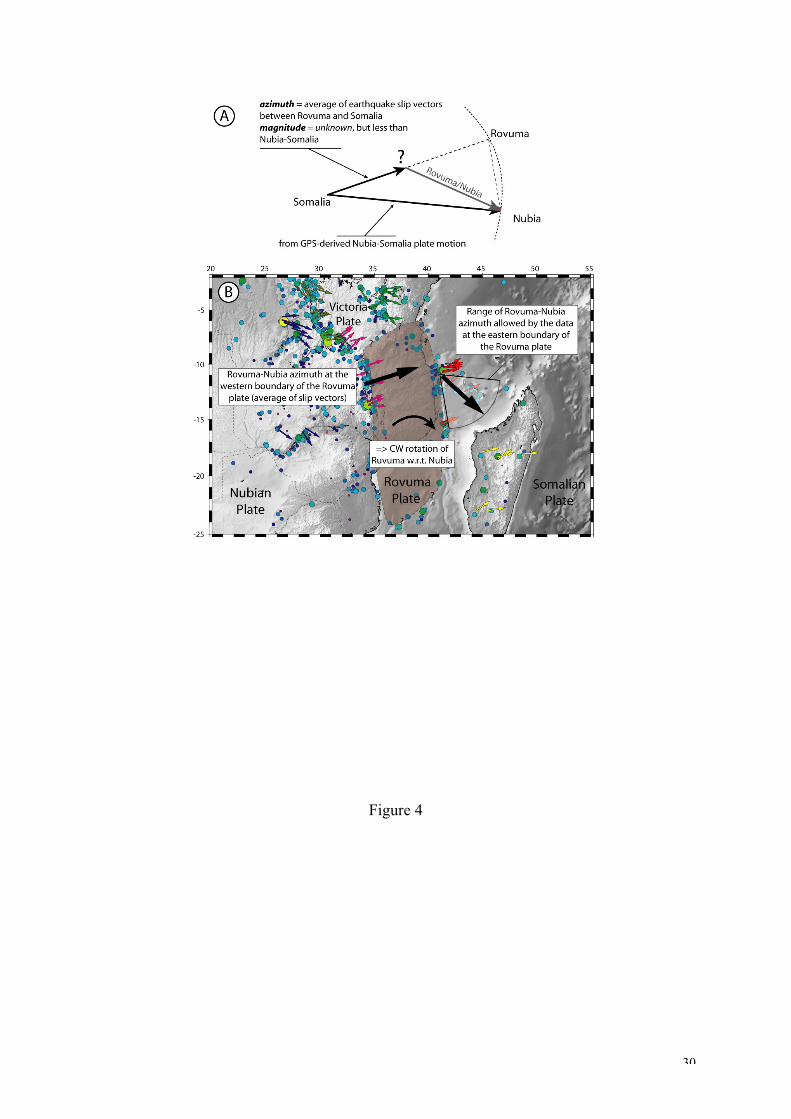
(Figure 4B; Brazier and Nyblade submitted; Ebinger et al. 1989). A velocity triangle for a
point on its eastern border (around 42W/12S, Figure 4A) can be drawn using the Somalia-
Nubia velocity, known from GPS data (see above), and the azimuth of the Somalia-Rovuma
motion, given by the average slip vector direction on the Davie ridge. Given that the
magnitude of the latter vector is not known, the Rovuma-Nubia vector can be anywhere

12
between N95°W if the Somalia-Rovuma motion is close to zero (i.e., 100% of the Somalia-
Nubia motion is taken up in the Malawi rift), to N170°W if the Somalia-Rovuma motion is
close to Somalia-Nubia in magnitude (i.e., 100% of the Somalia-Nubia motion is taken up on
the eastern boundary of the Rovuma plate). According to earthquake magnitudes from the 30-
year global NEIC catalog, seismic strain release has been larger at the Malawi rift than along
the Davie ridge, suggesting larger displacement rates on the western boundary of the Rovuma
plate than on its eastern boundary. If this is representative of longer-term strain, then the
Rovuma-Nubia velocity along the Davie ridge is closer to EW than NS. In any case, the
Rovuma-Nubia plate motion vector at the eastern boundary of the Rovuma plate around
42°W/12°S must be pointing in a southeast quadrant (Figure 4). This, together with the ENE-
directed slip vectors along the western boundary of that plate (Malawi rift), implies a
clockwise rotation of Rovuma with respect to Nubia.
Given the lack of significant active deformation features at the boundary between the
Victoria and Rovuma plates, could the data used here be fit equally well with a single plate
encompassing Victoria and Rovuma? The ∼45o systematic difference in earthquake slip
vector directions along the Western and Malawi branches (Figure 3A) argues for two distinct
plates. This can be further quantified by testing whether slip vectors along the Malawi rift are
consistent with a single plate model. Including the Malawi rift slip vectors in a Nubia -
[Victoria+ Rovuma] - Somalia inversion gives a χ2 of 63.9 for 14 additional degrees of
freedom (14 additional slip vector data). Using values from Table 2 (row 4), this leads to a F-
test value of 1.3, corresponding to α = 0.77. Hence, the hypothesis that the data fits equally
well a single Victoria+Rovuma plate can be rejected at a 77% confidence level. This
confidence level increases as a priori uncertainties on slip vector directions are lowered (we
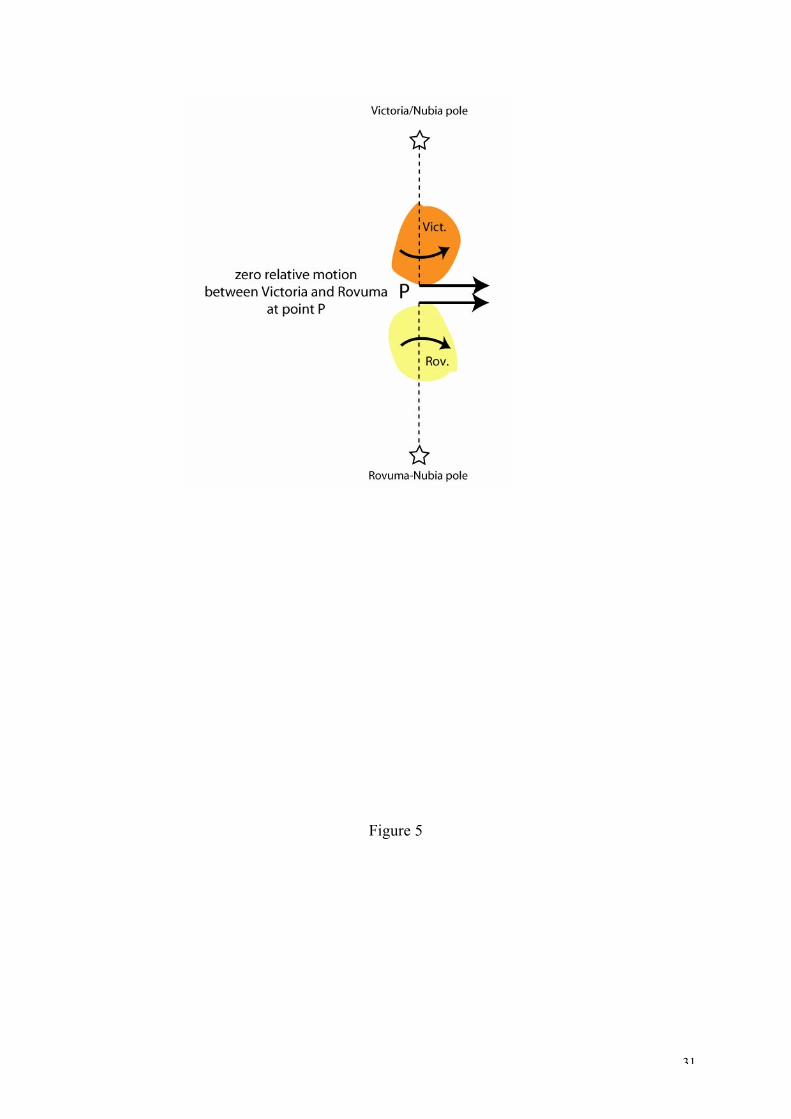
used 20° here). The counterclockwise rotation of Victoria and clockwise rotation of Rovuma
(with respect to Nubia) found here may actually explain the lack of well-expressed active

13
faults and seismicity along their common boundary, as schematically shown on Figure 5.
5 Discussion and Conclusion
The kinematic model proposed here, although consistent with the existing data, does not
account for the widespread seismicity observed west of the Western rift (Figure 1), where
earthquake slip vectors show a consistent NW-SE trend. This seismicity has been interpreted
as delineating an additional microplate (Transgariep block of Hartnady, 2002). However,
GPS station ZAMB, located on that potential microplate, does not show any significant
relative motion with respect to Nubia. In addition, active tectonic features along the Zambia
and Mweru rifts (Figure 2A) have a limited length and do not delineate a continuous plate
boundary. These observations do not preclude a relative motion of the Zambian craton with
respect to Nubia, but it must happen at very slow rates, less than 1-2 mm/yr.
Extrapolating the instantaneous kinematics found here to finite amounts of extension
across the EAR is difficult given that extension rates may have varied in time. Assuming
constant rates since the initiation of rifting (from 12-15 Ma to ~8 Ma from North to South
along the Western rift and less than 5 Ma for the Eastern rift; Ebinger et al., 1997; Ebinger,
1989; Abeinomugisha et al., 2004), the values found here lead to a maximum finite extension
of about 30 km for the Western rift and 15 to 0 km (from North to South) for the Eastern rift.
These values are at least twice the 15 km cumulative extension derived from reconstructions
of surface fault geometries (Morley, 1988; Ebinger, 1989) and cantilever models of gravity
and topography (Karner et al., 2002). The difference might be indicative of slower extension
rates during the earlier phase of rifting.
The GPS dataset used here is clearly limited, but it correlates well with well-determined
earthquake slip vectors. The combined interpretation of the two data sets is consistent with a
plate boundary model where deformation of the African plate is restricted to the narrow rift
14
valleys, and the surrounding lithospheric blocks remain undeformed. These kinematic data
are consistent with tomographic models that also show lithospheric thinning and heating
restricted to 100-150 km wide zones beneath the faulted Ethiopian and Eastern rift valleys
(e.g., Green et al. 1991; Ritsema et al. 1998; Bastow et al. 2005).
The identification of rigid lithospheric blocks that are kinematically independent from the
Nubian or Somalian plates raises the question of the mechanism that drives their motion. The
Ethiopian and Eastern rift systems form a diachronous but nearly contiguous belt that passes
along the eastern side of the Tanzania craton. But, what drives extension in the magma-poor
Western rift system? A possible model stemming from studies of interactions between the
cratonic keel and mantle flow provides insights into this problems. The core of the Victoria
microplate is the 2.5-3 Ga Tanzania craton (Figure 3B; Cahen et al. 1984), an assemblage of
metamorphic and granitic terranes that has remained undisturbed tectonically since the
Archean, except for minor reheating attested by Tertiary kimberlites (e.g., Chesley et al.
1999). Seismic, xenolith, and gravity data show that the lithosphere of the Tanzanian craton
is colder and stronger than surrounding orogenic belts (e.g., Ebinger et al. 1997; Ritsema et
al. 1998), and is underlain by a 170-250 km thick lithospheric keel (Nyblade et al. 2000;
Weeraratne et al. 2003; Debayle et al. 2005).
Viscous coupling between the convecting mantle and the lithosphere has been proposed as
a significant driving force (either active or resistive) for plate motions, in particular in
cratonic domains where a deep lithospheric keel is embedded in the convecting mantle (e.g.,
Ziegler 1992; Bokelmann 2002; Fouch et al. 2002; Sleep et al. 2002). Fouch et al.’s models
(2002) predict focusing of flow around the boundaries of the keel which match anisotropy
patterns determined in SKS-splitting observations from North America. Sleep et al. (2002)
followed with the case of a mantle upwelling and a cratonic keel, demonstrating the strong
focusing effect and directionality in both decompression melting and anisotropy. But, without

15
a consensus on the present location of plume stem(s) (e.g., Rogers, this volume; Furman et al.
this volume; Weeraratne et al. 2003), we cannot easily compare models and observations
(e.g., Walker et al. 2004; Kendall et al. this volume).
Seismic anisotropy measurements and azimuthal variations in surface wave models
provide independent constraints on upper mantle flow beneath East Africa and its possible
interaction with the Tanzania craton (Figure 6; Kendall et al. this volume; Gao et al. 1997;
Walker et al. 2004). Local, surface-wave, and SKS-splitting measurements along the
Ethiopian and Eastern rifts show that strong, rift-parallel, anisotropy is primarily due to
aligned melt zones in the mantle lithosphere (Kendall et al. 2005; Kendall et al. this volume).
Azimuthal variations in surface wave models show sub-lithospheric fast shear waves
coherently oriented in a NE-direction from Tanzania to the Red Sea (Debayle et al. 2005) and
near-radial orientations from a possible plume stem beneath Lake Eyasi (Weeraratne et al.
2003). Overall, seismic anisotropy fast directions in east Africa parallel the trend of the deep
African superplume, but not the WNW motion of the African plate in a hot-spot frame
(Figure 6). At a larger scale, Behn et al. (2004) explain SKS splitting observations on islands
surrounding Africa with density driven upwelling flow from the African superplume and its
interactions with a moving plate. Thus, existing data show both a strong signal from
asthenosphere and mantle lithosphere, as well as regional variations in flow direction around
the margins of the deep-rooted Tanzania craton.
On the basis of the asthenosphere-lithosphere flow models and anisotropy analyses, we
propose that the independent motion of the Victoria plate shown in this study results from a
combination of along-axis mantle flow and increased drag exerted on the Tanzania craton
lithospheric keel by viscous coupling with normal or enhanced asthenospheric flow (e.g.,
Stoddard & Abbott 1996; Sleep et al. 2002; Figure 7).
The NE-directed sub-lithospheric flow driven by the African Superplume upwelling acting
16
on the Tanzanian craton keel, thickest in its southern part (Debayle et al. 2005), may force a
counterclockwise rotation of the craton, consistent with our preliminary kinematic data. If
confirmed, this differential rotation of the Victoria microplate can explain the origin and
geometry of the enigmatic Western rift system without requiring a complex mechanism of
stress transfer from the Eastern rift (Nyblade & Brazier 2002). In this model, the magma-poor
Western rift accommodates differential movement of the deep-keeled Victoria plate, whereas
the magma-rich Eastern rift formed in response to focused mantle flow with hot
asthenosphere possibly ponding below thinned lithosphere. The interaction between
southward-deepening asthenospheric upwelling may also explain the seismicity belts with
minor or incipient normal faults that bound cratonic domains in southern Africa (Kaapvaal,
Zimbabwe, Zambia cratons). With increased GPS and seismic coverage of the African
continent we should be able to map these variations in deformation and mantle flow and build
a database to test current models for the fragmentation of continental plates in response to
plate-driving forces.
Acknowledgments. This paper results in a large part from discussions held during the US-
Africa Workshop on Anatomy of Continental Rifts in Addis Ababa, Ethiopia, in June 2004.
We are grateful to the local organizing committee and to M. Abdelselam, S. Klemperer, and
Gezahegn Yirgu for making this event possible. We thank M. Kendall, B. Le Gall, J. Rolet, J.
Déverchère, and W. Vétel for insightful discussions on the East African Rift, R. Gordon for
reviewing an early version of this manuscript, and C. Vigny and Z. Garfunkel for their
constructive comments.

17
References
Abeinomugisha, D. & Mugisha, F. 2004. Structural analysis of the Albertine graben,
Western Uganda. Abstract, East African Rift System Evolution, Resources, and
Environment Conference, Addis Ababa, June 2004.
Altamimi, Z., Sillard P. & Boucher C. 2002. ITRF2000: A new release of the International
Terrestrial Reference Frame for earth science applications. J. Geophys. Res.,
10.1029/2001JB000561.
Barruol, G. & Ben-Ismail, W. 2001. Upper mantle anisotropy beneath the African IRIS and
GEOSCOPE stations. Geophys. J. Int., 146, 549-561.
Bastow, I., Stuart G.W., Kendall J.M. & Ebinger C. 2005. Upper mantle seismic structure in
a region of incipient continental breakup: northern Ethiopian rift. Geophys. J. Int., 162,
479-493 doi: 10.111/j.1365-246X.2005.02666.x.
Behn, M.D., Conrad C.P. & Silver P.G. 2004. Detection of upper mantle flow associated with
the African Superplume. Earth and Planetary Science Letters, 224, 259-274.
Bokelmann, G. 2002. Convection-driven motion of the North American craton: evidence
from P-wave anisotropy. Geophys. J. Int., 148, 278-287.
Brazier, R.A., Nyblade A.A. & J. Florentin J. 2005., Focal mechanisms and the stress regime
in NE and SW Tanzania, East Africa, Submitted to Geophys. Res. Letters.
Cahen, L., Snelling N.J., Delhal J. & Vail J.R. 1984. The geochronology and evolution of
Africa. 512 pp., Oxford University Press, New York.
Calais, E., DeMets C. & Nocquet, J.M. 2003. Evidence for a post-3.16 Ma change in Nubia-
Eurasia plate motion. Earth and Planetary Science Letters, doi:10.1016/S0012-
821X(03)00482-5.
Chase, C.G. 1978. Plate kinematics: the Americas, East Africa, and the rest of the world.
Earth Planet. Sci. Lett. 37, 353-68.
18
Chesley, J.T., Rudnick, R.L. & Lee, C.T., 1999. Re-Os systematics of mantle xenoliths from
the East African rift: Age, structure, and history of the Tanzanian craton. Geochimica and
Cosmochimica Acta, 63, 1203-127.
Chu, D. & Gordon, R. 1999. Evidence for motion between Nubia and Somalia along the
Southwest Indian ridge. Nature, 398, 6466.
Courtillot, V., Manighetti, I., Tapponnier, P. & Besse, J. 1999. On causal links between flood
basalts and continental breakup. Earth planet. Sci. Lett., 166, 177–195.
Debayle, E., Kennett, B. & Priestley, K., 2005. Global azimuthal seismic anisotropy and the
unique plate-motion deformation of Australia. Nature, 433, 509-512,
doi:10.1038/nature03247.
Ebinger, C.J. & Sleep, N.H. 1998. Cenozoic magmatism in central and east Africa resulting
from impact of one large plume. Nature, 395, 788-791.
Ebinger, C., Poudjom-Djomani, Y., Mbede, E. & Foster, A. 1997. Rifting the Archaean:
Development of the Natron-Manyara-Eyasi basins. Tanzania, J. Geol. Soc. London, 154,
947-960.
Ebinger, C. 1989. Tectonic development of the western branch of the East African rift
system. Geol. Soc. Amer. Bull., 101, 885-903.
Ebinger, C., Bechtel. T., Forsyth, D. & Bowin C. 1989. Effective elastic plate thickness
beneath the East African and Afar plateaux, and dynamic compensation of the uplifts. J.
Geophys. Res., 94, 2883-2901.
Fernandes R.M.S, Ambrosius, B.A.C., Noomen, R., Bastos, L., Combrinck, L., Miranda, J.M.
& Spakman, W. 2004. Angular velocities of Nubia and Somalia from continuous GPS
data: implications on present-day relative kinematics. Earth and Planetary Science
Letters, 222, 197-208.
Foster A. & Jackson, J.A. 1998. Source parameters of large African earthquakes: implications

19
for crustal rheology and regional kinematics. Geophys. J. Int., 134, 422-448.
Fouch, M., Fischer, K.M., Parmentier, E.M., Wysession, M. E. & Clarke, T.J. 2000. Shear-
wavesplitting, continental keels and patterns of mantle flow. J. Geophys. Res., 105, 6255-
6275.
Furman, T., Bryce, J., Rooney, T., Hanan, B., Yirgu, G. & Ayalew, D., 2006. Heads and
Tails: 30 My of the Afar plume. In: Yirgu, G., Ebinger, C.J. & Maguire, P.K.H. (eds)
Structure and Evolution of the Rift Systems within the Afar volcanic province, Northeast
Africa, Geological Society Special Publications.
Gao, S., Davis, P.M., Liu, H., Slack, P.D., Rigor, W., Zorin, Y.A., Mordvinova, V.V.,
Kzhevnikov,V.M. & Logachev, N.A. 1997. SKS splitting beneath continental rift zones.
J. Geophys. Res., 102, 22781-22797.
Gordon, R. G. 1998.The plate tectonic approximation: Plate nonrigidity, diffuse plate
boundaries, and global plate reconstructions. Annual Reviews of Earth and Planetary
Sciences, 26, 615-642.
Green, V., Achauer, U. & Meyer, R. P. 1991. A 3D seismic image of the crust and upper
mantle beneath the Kenya rift. Nature, 354, 199-203.
Grimison N.L. & Chen, W.P. 1988. Earthquakes in Davie Ridge-Madagascar region and the
southern Nubian-Somalian plate boundary. J. Geophys. Res., 93, 10,439-10,450.
Gripp, A.E. & Gordon, R.G. 2002. Young tracks of hotspots and current plate velocities.
Geophys. J. Int., 150, 321-361.
Harper, R., Stone, D. & Morley, C.K. 1999. Geophysics of the Usangu flats, Tanzania. In:
Morley C.K. (ed), Geoscience of Rift Systems – Evolution of East Africa, AAPG Studies
in Geology No. 44, 111-114.
Hartnady, C.J.H., 1998. Lesotho seismotectonics: SE African SCR in transition. Amer.
Geophys. Un. Chapman Conference on Stable Continental Region (SCR) Earthquakes,

20
National Geophysical Research Institute, Hyderabad, India (January 25-29), Abstract
Volume, p.23.
Hartnady, C.J.H., 2002. Earthquake hazard in Africa: perspectives on the Nubia-Somalia
boundary. South African Journal of Sciences, 98, 425-428.
Hartnady, C.J.H. & Mlisa A. 2004. Boundaries and recent motions of the Ukerewe-Nyanza
plate. International Conference on the East African Rift System: Development, Evolution
and Resources, Addis Ababa (June 20-24), Ethiopia, p. 81-84.
Hendrie, D., Kusznir, N., Morley, C.K. & Ebinger, C.J. 1994. A quantitative model of rift
basin development in the northern Kenya rift: Evidence for the Turkana region as an
“accommodation zone” during the Paleogene. Tectonophysics, 236, 409-438.
Jackson, J.A. 2002. Strength of the continental lithosphere: time to abandon the jelly
sandwich? GSA Today, September issue.
Jestin, F., Huchon, P. & Gaulier J.M. 1994. The Somali plate and the East African Rift
system: present-day kinematics. Geophys. J. Int., 116, 637-654.
Karner, G., Byamungu, B., Ebinger, C., Kampunzu, A., Mukasa, R., Nyakaana, J., Rubondo,
E., & Upcott, N. 2000. Distribution of crustal extension and regional basin architecture of
the Albertine rift system, East Africa. Mar. Petrol. Geol., 17, 1131-1150.
Kaz’min, V.G., Zonenshayn L.P., Savostin, L.A. & Bershbitskaya A.I. 1987. Kinematics of
the Afro-Arabian rift system. Geotectonics, 21, 452-460.
Kendall, J.-M., Stuart, G.W., Ebinger, C.J. , Bastow, I.D. & Keir, D. 2005. Magma-assisted
rifting in Ethiopia. Nature, 433, 146-148.
Kendall, J-M., Pilidou, S., Keir, D., Bastow, I.D., Stuart, G.W. & Ayele, A. 2006. Mantle
upwellings, melt migration and the rifting of Africa: Insights from seismic anisotropy.
In: Yirgu, G., Ebinger, C.J. & Maguire, P.K.H. (eds) Structure and Evolution of the Rift
Systems within the Afar volcanic province, Northeast Africa, Geological Society Special
21
Publications.
King, R.W. & Bock, Y. 2005. Documentation for the GAMIT GPS software analysis, release
10.2. unpublished.
Le Gall, B., Gernigon, L., Rolet, J., Ebinger, C., Gloaguen, R., Nilsen, O., Dypvik, H.,
Deffontaines, B. & Mruma, A., 2004. Neogene-Recent rift propagation in Central
Tanzania: Morphostructural and aeromagnetic evidence from the Kilombero area. Geol.
Soc. Amer. Bull., 116, 490-510.
Lemaux, J., Gordon, R. G. & Royer, J.-Y. 2002. The location of the Nubia-Somalia boundary
along the Southwest Indian Ridge. Geology, 30, 339-342.
McKenzie, D.P., Davies, D. & Molnar, P. 1970. Plate tectonics of the Red Sea and East
Africa. Nature, 226, 243-248.
Minster, J.B. & Jordan, T.H. 1978. Present-Day Plate Motions. Journal of Geophysical
Research, 83, 5331-5354.
Modisi, M.P., Atekwana, E.A., Kampunzu, A.B. & Ngwisanyi, T.H. 2000. Rift kinematics
during the incipient stages of continental extension: Evidence from the nascent Okavango
rift basin, northwest Botswana. Geology, 28, 939-942.
Morley, C. K. 1988. Variable extension in Lake Tanganyika. Tectonics, 7, 785-801.
Nyblade, A.A. & Langston, C.A. 1995. East African earthquakes below 20 km depth and
their implications for crustal structure. Geophys. J. Int., 121, 49-62.
Nyblade, A.A., Owens, T.J., Gurrola, H., Ritsema, J. & Langston, C.A. 2000. Seismic
evidence for a deep upper mantle thermal anomaly beneath East Africa. Geology, 7, 599-
602.
Nyblade, A. & Brazier, R. 2002. Precambrian lithospheric controls on the development of the
East African rift system. Geology, 30, 755-758.
Prawirodirdjo, L. & Bock, Y. 2004. Instantaneous global plate motion model from 12 years

22
of continuous GPS observations. J. Geophys. Res., 109, B08405, doi:10.1029/
2003JB002944.
Ritsema, J., Nyblade, A.A., Owens,T.J. & Langston, C.A. 1998. Upper mantle seismic
velocity structure beneath Tanzania, east Africa: Implications for the stability of cratonic
lithosphere. J. Geophys. Res., 103, 21,201-21,213.
Rogers, N., 2006. Basaltic magmatism and geodynamics of the African rift system. In: Yirgu,
G., Ebinger, C.J. & Maguire, P.K.H. (eds) Structure and Evolution of the Rift Systems
within the Afar volcanic province, Northeast Africa, Geological Society Special
Publications.
Sella, G. F., Dixon, T.H. & Mao, A. 2002. REVEL : A model for recent plate velocities from
Space Geodesy. J. Geophys. Res., doi: 107, 10.1029/2000JB00033.
Sleep, N.H., Ebinger, C.J. & Kendall, J.M. 2002. Deflection of mantle plume by cratonic
keels, In: Fowler, C.M.R., Ebinger, C.J. & Hawkesworth, C.J. (eds) The Early Earth:
Physical, Chemical, and Biological Development. Geol. Soc. Spec. Publ. London, 199,
135-150.
Stoddard, P.R. & Abbott, D. 1996. Influence of tectosphere upon plate motion. J. Geophys.
Res., 101, 5425-5433.
Walker, K.T., Nyblade, A.A., Klemperer, S.L., Bokelmann, G.H.R. & Owens, T.J. 2004. On
the relationship between extension and anisotropy: Constraints from shear wave splitting
across the East African Plateau. J. Geophys. Res., 109, B08302, doi:
10.1029/2003JB002866.
Weereratne, D.S., Forsyth, D.W., Fischer, K.M. & Nyblade, A.A. 2003. Evidence for an
upper mantle plume beneath the Tanzanian craton from Rayleigh wave tomography. J.
Geophys. Res., 108, doi:10,1029/2002JB002273.
Ziegler, P. 1992. Plate tectonics, plate moving mechanisms and rifting. Tectonophysics, 215,

23
9-34.
24
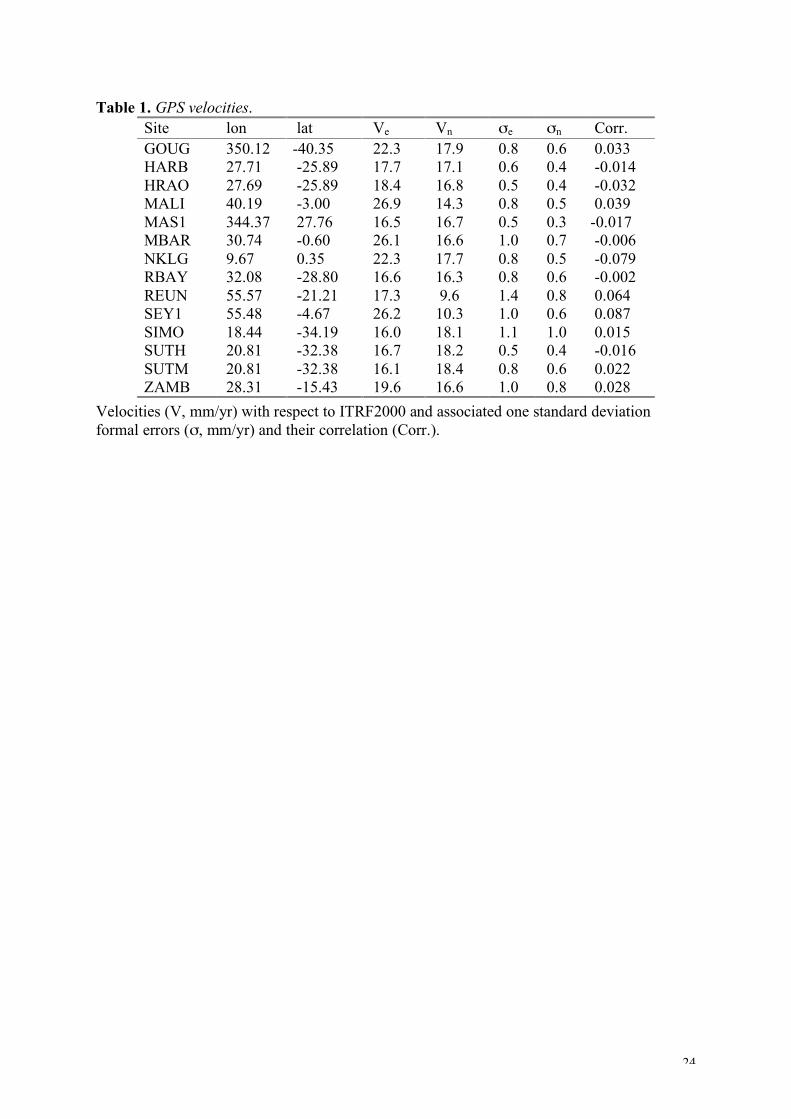
Table 1. GPS velocities. Site lon lat Ve Vn σe σn Corr. GOUG 350.12 -40.35 22.3 17.9 0.8 0.6 0.033 HARB 27.71 -25.89 17.7 17.1 0.6 0.4 -0.014 HRAO 27.69 -25.89 18.4 16.8 0.5 0.4 -0.032 MALI 40.19 -3.00 26.9 14.3 0.8 0.5 0.039 MAS1 344.37 27.76 16.5 16.7 0.5 0.3 -0.017 MBAR 30.74 -0.60 26.1 16.6 1.0 0.7 -0.006 NKLG 9.67 0.35 22.3 17.7 0.8 0.5 -0.079 RBAY 32.08 -28.80 16.6 16.3 0.8 0.6 -0.002 REUN 55.57 -21.21 17.3 9.6 1.4 0.8 0.064 SEY1 55.48 -4.67 26.2 10.3 1.0 0.6 0.087 SIMO 18.44 -34.19 16.0 18.1 1.1 1.0 0.015 SUTH 20.81 -32.38 16.7 18.2 0.5 0.4 -0.016 SUTM 20.81 -32.38 16.1 18.4 0.8 0.6 0.022 ZAMB 28.31 -15.43 19.6 16.6 1.0 0.8 0.028
Velocities (V, mm/yr) with respect to ITRF2000 and associated one standard deviation formal errors (σ, mm/yr) and their correlation (Corr.).

25
Table 2: Plate angular velocities.
Angular velocity Uncertainties
Plates lat. Lon. Ang. Major minor azim σang χ2
[χ2/dof] data used
1 Nubia-ITRF 50.60 -80.97 0.261 1.30 0.68 -74.37 0.003 7.53 [1.08]
MAS1, NKLG, SUTH, SUTM, GOUG
2 Nubia-ITRF 50.66 -81.30 0.261 1.26 0.66 -75.84 0.003 8.52 [0.95] idem + ZAMB
3 Nubia-ITRF 51.24 -81.92 0.261 1.04 0.52 -79.80 0.002 12.87 [0.86]
idem + ZAMB, HRAO, HARB, RBAY
Victoria-Nubia 16.61 35.99 -0.075 16.55 1.85 17.86 0.040 4 Somalia-Nubia -43.06 27.51 0.069 13.23 3.59 -25.83 0.013
45.34 [0.92]
47 slip vectors + MBAR, MALI, SEY1, REUN
5 Somalia-Nubia -41.77 27.39 0.068 11.82 2.78 -20.63 0.012 15.40 [1.28]
9 slip vectors + MALI, SEY1, REUN
Angular velocities, associated uncertainties, χ2, reduced χ2 (dof = degrees of freedom), and data used in the estimation. Angular velocities are in degree per million years, clockwise is positive. Azimuth is given clockwise from north. Note that row 4 is a 3-plate inversion (Somalia-Nubia-Victoria).
26
Figure 1: GPS sites used in this study. Black dots show seismicity (NEIC catalog). Stars are Euler poles for Somalia-Nubia relative motion with associated 1-sigma error ellipse. S02 = Sella et al., 2002; PB04 = Prawirodirdjo and Bock, 2004; F04 = Fernandes et al., 2004; CG99 = Chu and Gordon, 1999; J94 = Jestin et al., 1994, This work 2-plate = 2-plate inversion using GPS velocities at MALI, REUN, and SEY1 + 9 earthquake slip vectors along the Main Ethiopian rift; This work 3-plate = 3-plate inversion using GPS velocities at MBAR, MALI, REUN, SEY1 and 47 earthquake slip vectors along the East African Rift (see Figure 2 and Table 1). Dashed line shows the Nubia-Somalia plate boundary in the southwest Indian ocean proposed by Lemaux et al. (2002).
Figure 2. Position times series for sites MBAR, REUN, MALI, and SEY1. One position per day and its associated one-sigma formal error, shown with respect to the weighted mean of the entire time series. Each component (north-south, east-west, vertical) is shown separately.
Figure 3. A. Data used to quantify the present-day kinematics of the EAR: GPS velocities (black arrows, shown w.r.t. Nubia) and earthquake slip vector directions (color bars – color code indicates regional grouping). B. Kinematic model of the EAR. Stars show the Euler pole of the Victoria plate and the associated 1-sigma error ellipse. Arrows show velocities predicted by our model along main branches of the EAR and at GPS sites.
Figure 4. Kinematics of the Rovuma block. A. Velocity triangle for a location on the Rovuma-Somalia boundary around 42N/12S. B. Zoom on the Rovuma plate. Large black arrows show relative plate motions along its western and eastern boundaries (Malawi rift and Davie Ridge, respectively). They imply a CW rotation of Rovuma w.r.t. Nubia. Colored arrows show earthquake slip vectors. Seismicity (NEIC catalog) is shown in background.
Figure 5. Schematic kinematic diagram showing the counterclockwise rotation of Victoria and clockwise rotation of Rovuma (with respect to Nubia). In the configuration shown here, the relative motion at point P along their common boundary is null.
Figure 6. Existing anisotropy data in the central part of the EAR. Red bars are from SKS shear-wave splitting data (Gao et al., 1997; Walker et al., 2004; Barruol and Ismail, 2001), blue bars are from a surface wave study for a depth of 200 km (Debayle et al., 2005). Green arrows show the current African plate motion in a hot-spot frame (Gripp and Gordon, 2002).
Figure 7: Interpretative block diagram across the central part of the EAR. Viscous coupling between NE-directed asthenospheric flow driven by the African Superplume and the Tanzanian craton keel may force a counterclockwise rotation of the craton, consistent with our preliminary kinematic data. The magma-poor Western rift accommodates differential movement of the deep-keeled Victoria plate, whereas the magma-rich Eastern rift formed in response to focused mantle flow with hot asthenosphere possibly ponding below thinned lithosphere.

27
Figure 1

28
Figure 2

29
Figure 3
30
Figure 4
31
Figure 5

32
Figure 6

33
Figure 7