government bonds outlook - standard life …...government bonds outlook quarter 1 2018 this document...
TRANSCRIPT

Government Bonds Outlook QUARTER 1 2018
This document is intended for institutional investors and investment professionals only and should not be distributed to or relied upon by retail clients.
UN
DER
WEI
GHT
OV
ERW
EIG
HT
NEU
TRAL
Outlook Summary
SUMMARY
US Summary - UNDERWEIGHT Page 2
Very little has changed over the period since our last outlook, with T-bonds defying the flow of resoundingly positive economic information. The somewhat surprising passage of a tax plan at this stage of the cycle will likely prompt further reaction from the Federal Reserve but global QE is acting as a very strong suppressant. The shift in bond supply during 2018, both locally and globally, looks like the catalyst but when markets react remains an open question. The Mueller enquiry is also inching closer to the White House and could produce some fireworks.
UK Summary - NEUTRAL Page 3
We maintain our view that UK economic activity will stagnate and continue to underperform other developed markets while Brexit uncertainty persists. Weakness in consumption and investment will mean the economy continues to operate close to, but not above, its potential. However, we are mindful that the reaction functions of the Bank of England and the gilt market to that environment are no longer asymmetric. For the Monetary Policy Committee, the trade-off between supporting growth and employment, and controlling inflation has shifted due to supply-side considerations. Combined with the fragility of the political situation, this leaves us with a much wider distribution of possible outcomes for the gilt market. With that in mind, we prefer to adopt a broadly neutral outlook on UK bonds.
Euro Summary - UNDERWEIGHT Page 4
Economic surprises continue to the upside in Europe. The strong data is broad based, both in terms of internal and external demand, and is fairly uniform across the currency bloc. This continued strong growth cannot coexist with ultra-low policy dovishness ad infinitum. The market now expects no movement on policy rates until near the end of Draghi’s tenure (late 2019). Draghi has almost been too successful in managing expectations to the downside and has now potentially sowed the seeds of bund volatility in the new year. Policy will have to evolve and bond markets should finally respond negatively.
Japan Summary - UNDERWEIGHT Page 5
Despite reasons to believe the inflation trajectory in Japan remains firmly below target, there are features of Bank of Japan (BoJ) policy and the Japanese government bond (JGB) market that suggest asymmetry around an underweight position and curve steepeners. The BoJ’s comprehensive review led to the introduction of yield curve control and a new paradigm of thinking. We think that the explicit desire for steeper curves, and the BoJ’s longer-term willingness and ability to allow long-end yields to edge higher will continue to support this trade. Our base case is not JGBs to be higher in yield or for inflation to hit target imminently, but we think the asymmetry means the risks for yields are to the upside.
Australia Summary - OVERWEIGHT Page 6
The central theme that led us to favour Australian bonds still holds (high household leverage, reliance on the housing market to support growth, external vulnerabilities related to China) and indeed there are signs that the recent housing slowdown could restrain growth further in 2018 as Australian Prudential Regulation Authority measures and stretched valuations start to bite. Additionally, the economy is likely to be frustrated with low inflation and wage growth, as structural factors continue to take hold. The factors outlined above do not constitute an environment conducive to rate hikes, and we believe the Reserve Bank of Australia will be forced to keep rates on hold. We remain positive on Australian duration.
RATES
Philip Laing Head of Rates
Jack Kelly Investment Director Global and European funds
Liam O’Donnell Investment Director Gilt funds
Aaron Rock Investment Director Gilt funds
Ross Hutchison Investment Director Gilt, Global and European funds
Findlay Hyde Investment Analyst Gilt funds
INFLATION
Katy Forbes Investment Director Inflation funds
Adam Skerry Investment Director Inflation funds
Tom Walker Investment Director Inflation funds
Connor Godsell Rates Graduate
UN
DER
WEI
GHT
OV
ERW
EIG
HT
NEU
TRAL
US
Market Prices & Moves (as at Q4 2017) WeightingsInstrument Current 1 month ago 3 months ago Fundamentals UNDERWEIGHT
10-year UST 2.36% 2.32% (+4bp) 2.20% (+16bp) Sentiment NEUTRAL
30-years breakeven 1.94% 1.93% (+1bp) 1.93% (+1bp) Valuation, technical & supply UNDERWEIGHT
DXY Index 93.49 93.81 (-0.34%) 91.87 (+1.76%) Summary UNDERWEIGHT
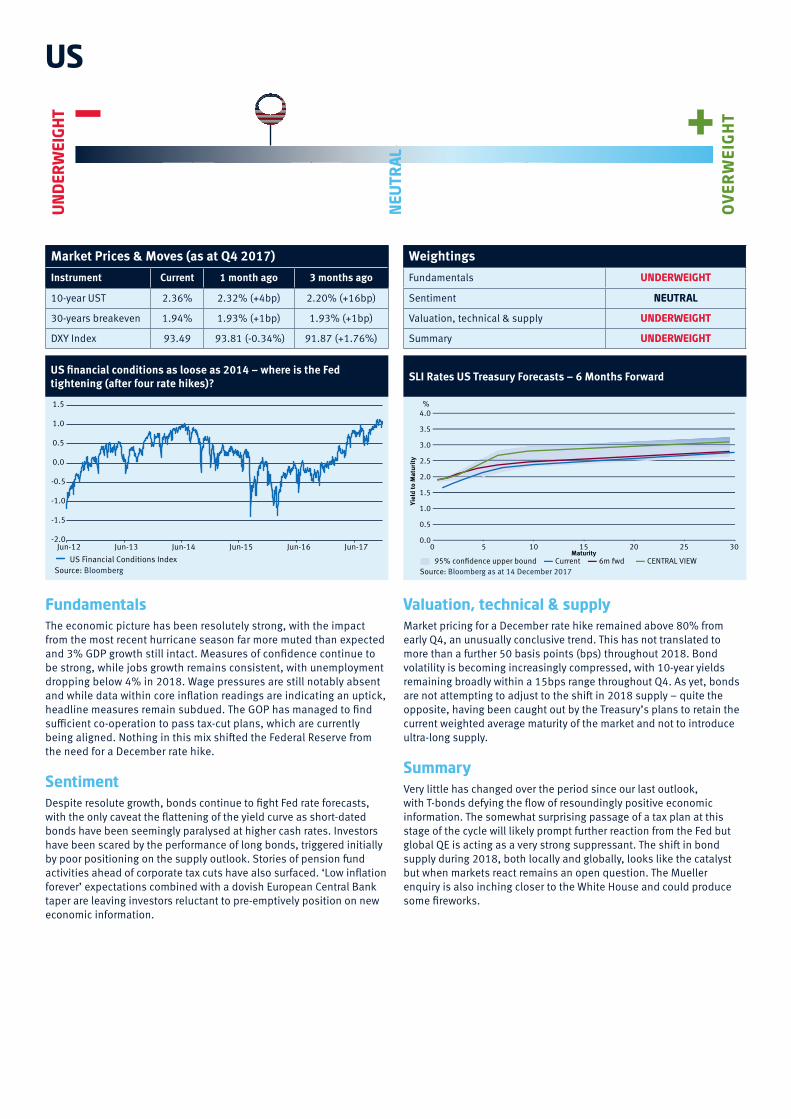
US financial conditions as loose as 2014 – where is the Fed tightening (after four rate hikes)?
Source: Bloomberg
-2.0
-1.5
-1.0
-0.5
0.0
0.5
1.0
1.5
Jun-12 Jun-13 Jun-14 Jun-15 Jun-16 Jun-17 US Financial Conditions Index
SLI Rates US Treasury Forecasts – 6 Months Forward
0.0
0.5
1.0
1.5
2.0
2.5
3.0
3.5
4.0%
0 5 10 15 20 25 30
95% con�dence upper bound Current Source: Bloomberg as at 14 December 2017
6m �d CENTRAL VIEW
Yiel
d to
Mat
urity
Maturity
Fundamentals The economic picture has been resolutely strong, with the impact from the most recent hurricane season far more muted than expected and 3% GDP growth still intact. Measures of confidence continue to be strong, while jobs growth remains consistent, with unemployment dropping below 4% in 2018. Wage pressures are still notably absent and while data within core inflation readings are indicating an uptick, headline measures remain subdued. The GOP has managed to find sufficient co-operation to pass tax-cut plans, which are currently being aligned. Nothing in this mix shifted the Federal Reserve from the need for a December rate hike.
SentimentDespite resolute growth, bonds continue to fight Fed rate forecasts, with the only caveat the flattening of the yield curve as short-dated bonds have been seemingly paralysed at higher cash rates. Investors have been scared by the performance of long bonds, triggered initially by poor positioning on the supply outlook. Stories of pension fund activities ahead of corporate tax cuts have also surfaced. ‘Low inflation forever’ expectations combined with a dovish European Central Bank taper are leaving investors reluctant to pre-emptively position on new economic information.
Valuation, technical & supplyMarket pricing for a December rate hike remained above 80% from early Q4, an unusually conclusive trend. This has not translated to more than a further 50 basis points (bps) throughout 2018. Bond volatility is becoming increasingly compressed, with 10-year yields remaining broadly within a 15bps range throughout Q4. As yet, bonds are not attempting to adjust to the shift in 2018 supply – quite the opposite, having been caught out by the Treasury’s plans to retain the current weighted average maturity of the market and not to introduce ultra-long supply.
SummaryVery little has changed over the period since our last outlook, with T-bonds defying the flow of resoundingly positive economic information. The somewhat surprising passage of a tax plan at this stage of the cycle will likely prompt further reaction from the Fed but global QE is acting as a very strong suppressant. The shift in bond supply during 2018, both locally and globally, looks like the catalyst but when markets react remains an open question. The Mueller enquiry is also inching closer to the White House and could produce some fireworks.
UK
Market Prices & Moves (as at Q4 2017) WeightingsInstrument Current 1 month ago 3 months ago Fundamentals OVERWEIGHT
10-year UKT 1.16% 1.29% (-13bp) 1.31% (-15bp) Sentiment NEUTRAL
30-year UKT 1.72% 1.86% (-14bp) 1.90% (-18bp) Valuation, technical & supply UNDERWEIGHT
GBP Trade Weighted 78.11 76.66 (+1.89%) 78.00 (+0.14%) Summary NEUTRAL
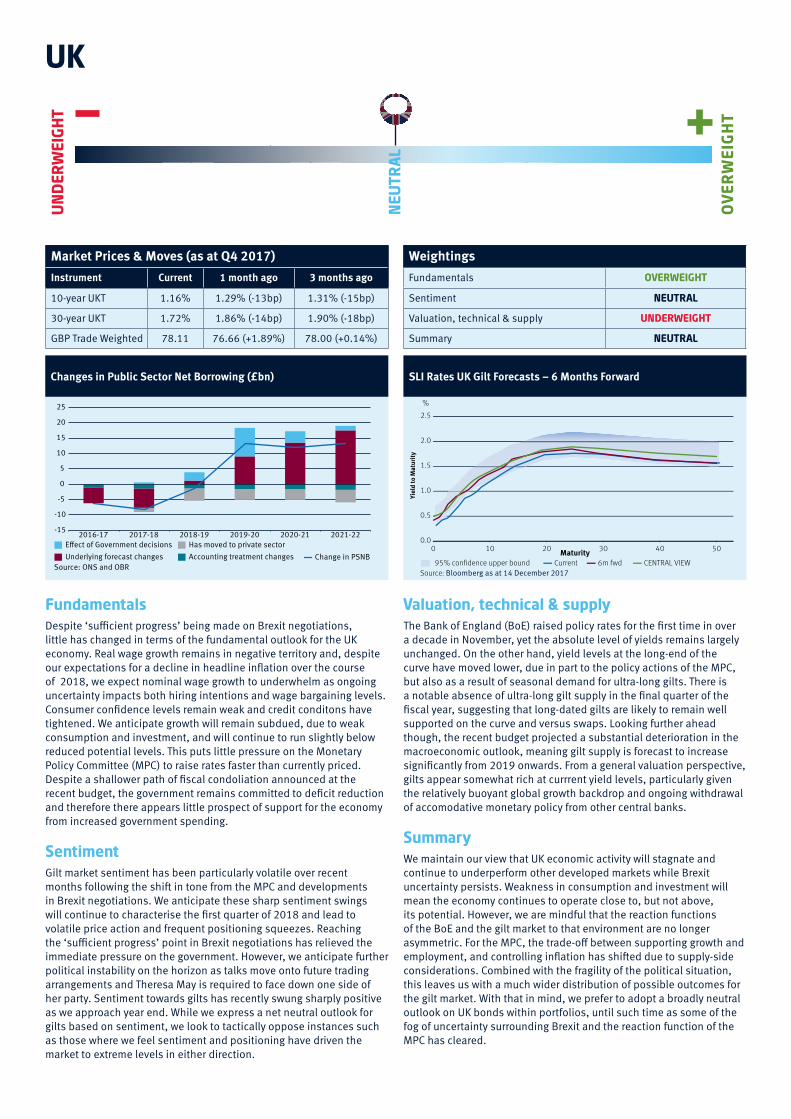
Changes in Public Sector Net Borrowing (£bn)
-15
-10
-5
0
5
10
15
20
25
2016-17 2017-18 2018-19 2019-20 2020-21 2021-22 E�ect of Government decisions Has moved to private sector Underlying forecast changes
Source: ONS and OBRAccounting treatment changes Change in PSNB
FundamentalsDespite ‘sufficient progress’ being made on Brexit negotiations, little has changed in terms of the fundamental outlook for the UK economy. Real wage growth remains in negative territory and, despite our expectations for a decline in headline inflation over the course of 2018, we expect nominal wage growth to underwhelm as ongoing uncertainty impacts both hiring intentions and wage bargaining levels. Consumer confidence levels remain weak and credit conditons have tightened. We anticipate growth will remain subdued, due to weak consumption and investment, and will continue to run slightly below reduced potential levels. This puts little pressure on the Monetary Policy Committee (MPC) to raise rates faster than currently priced. Despite a shallower path of fiscal condoliation announced at the recent budget, the government remains committed to deficit reduction and therefore there appears little prospect of support for the economy from increased government spending.
SentimentGilt market sentiment has been particularly volatile over recent months following the shift in tone from the MPC and developments in Brexit negotiations. We anticipate these sharp sentiment swings will continue to characterise the first quarter of 2018 and lead to volatile price action and frequent positioning squeezes. Reaching the ‘sufficient progress’ point in Brexit negotiations has relieved the immediate pressure on the government. However, we anticipate further political instability on the horizon as talks move onto future trading arrangements and Theresa May is required to face down one side of her party. Sentiment towards gilts has recently swung sharply positive as we approach year end. While we express a net neutral outlook for gilts based on sentiment, we look to tactically oppose instances such as those where we feel sentiment and positioning have driven the market to extreme levels in either direction.
Valuation, technical & supplyThe Bank of England (BoE) raised policy rates for the first time in over a decade in November, yet the absolute level of yields remains largely unchanged. On the other hand, yield levels at the long-end of the curve have moved lower, due in part to the policy actions of the MPC, but also as a result of seasonal demand for ultra-long gilts. There is a notable absence of ultra-long gilt supply in the final quarter of the fiscal year, suggesting that long-dated gilts are likely to remain well supported on the curve and versus swaps. Looking further ahead though, the recent budget projected a substantial deterioration in the macroeconomic outlook, meaning gilt supply is forecast to increase significantly from 2019 onwards. From a general valuation perspective, gilts appear somewhat rich at currrent yield levels, particularly given the relatively buoyant global growth backdrop and ongoing withdrawal of accomodative monetary policy from other central banks.
SummaryWe maintain our view that UK economic activity will stagnate and continue to underperform other developed markets while Brexit uncertainty persists. Weakness in consumption and investment will mean the economy continues to operate close to, but not above, its potential. However, we are mindful that the reaction functions of the BoE and the gilt market to that environment are no longer asymmetric. For the MPC, the trade-off between supporting growth and employment, and controlling inflation has shifted due to supply-side considerations. Combined with the fragility of the political situation, this leaves us with a much wider distribution of possible outcomes for the gilt market. With that in mind, we prefer to adopt a broadly neutral outlook on UK bonds within portfolios, until such time as some of the fog of uncertainty surrounding Brexit and the reaction function of the MPC has cleared.
UN
DER
WEI
GHT
OV
ERW
EIG
HT
NEU
TRAL
SLI Rates UK Gilt Forecasts – 6 Months Forward
0.0
0.5
1.0
1.5
2.0
2.5
0 10 20 30 40 50
Yiel
d to
Mat
urity
Maturity
%
95% con�dence upper bound Current Source: Bloomberg as at 14 December 2017
6m �d CENTRAL VIEW

Europe
Market Prices & Moves (as at Q4 2017) WeightingsInstrument Current 1 month ago 3 months ago Fundamentals UNDERWEIGHT
10-year bund 0.30% 0.38% (-8bp) 0.43% (-13bp) Sentiment NEUTRAL
10-year BTP 1.77% 1.83% (-6bp) 2.12% (-35bp) Valuation, technical & supply UNDERWEIGHT
EUR/USD 1.18 1.18 (+/-0%) 1.20 (-1.67%) Summary UNDERWEIGHT
Draghi’s trick: pulling down rate expectations as he tapers
-0.5
-0.4
-0.3
-0.2
-0.1
0.0
0.1
0.2
1m 3m 6m 1Y 2Y 3Y Historical implied policy curve as of 23/03/2017 Current implied policy curve as of 23/11/2017
Source: Bloomberg
SLI Rates Bund Yield Forecasts – 6 Months Forward
95% con�dence upper bound Current
Source: Bloomberg as at 14 December 2017
6m �d CENTRAL VIEW
Yiel
d to
Mat
urity
Maturity
-1.0
-0.5
0.0
0.5
1.0
1.5
2.0%
0 5 10 15 20 25 30
FundamentalsThe macro picture is rapidly improving, with the continuation of broad-based strength in Q4 2017. In terms of the European Central Bank’s (ECB) stated position, not a great deal has changed and, given the dependence of the core European bond markets on QE signalling, this has led to even less volatility over the last couple of months. We finally had the announcement on further tapering and the weight of consensus expectation proved accurate, with investors correctly anticipating €30 billion a month for a further nine months. Stepping back, we had to be impressed by Draghi’s ability to pitch the announcement of a reduction of purchases at such a dovish event, atlhough this was partially helped by bearish bond positioning.
SentimentSentiment remains highly negative towards core bonds, particularly France, which investors see as both a duration and EU crisis insurance play. Sentiment towards peripheral markets remains broadly negative for those who believe that quantitative tapering will weaken these back to pre-QE levels. However, this group has had to reassess its view given strong price action, punitive carry, and a compliant and supportive ECB. The key point for us here is that central bank sentiment towards stemming any standalone peripheral weakness remains robust. Scarcity persists in German bunds, but should dissipate as policy tightens. However, sentiment alone acts as a powerful barrier to bunds weakening in repsonse to the stronger data.
Valuation, technical & supply Valuations still look expensive, with 2-year rates 20bps below the deposit rate. This is despite very little genuine deflation risk and some clear signalling that current emergency policy settings are inappropriate and even corrosive. However, QE is not disappearing and scarcity will continue as a driver. Appetite for relaxing the deficit rules and all the accompanying supply fears are bond negative. Prospects of a grand coalition in Germany should loosen fiscal purse strings and peripheral political risks have also dissipated, with Italy’s Five Star now pro-EU. Supply will be coming back onstream properly in Q1 and that is helping to soften up bonds; Germany will have positive net supply in Q1.
SummaryEconomic surprises continue to the upside in Europe. The strong data is broad based, both in terms of internal and external demand, and is fairly uniform across the currency bloc. This continued strong growth cannot coexist with ultra-low policy dovishness ad infinitum. The market now expects no movement on policy rates until near the end of Draghi’s tenure (late 2019). Draghi has almost been too successful in managing expectations to the downside and has now potentially sowed the seeds of bund volatility in the new year. Policy will have to evolve and bond markets should finally respond negatively.
UN
DER
WEI
GHT
OV
ERW
EIG
HT
NEU
TRAL

Japan
Market Prices & Moves (as at Q4 2017) WeightingsInstrument Current 1 month ago 3 months ago Fundamentals NEUTRAL
10-year JGB 0.04% 0.04% (+/-0bp) 0.02% (+2bp) Sentiment NEUTRAL
30-year JGB 0.81% 0.81% (+/-0bp) 0.83% (-2bp) Valuation, technical & supply UNDERWEIGHT
USD/JPY 112.15 112.88 (-0.65%) 110.83 (+1.19%) Summary UNDERWEIGHT
Japan CPI ex fresh food year on year (%)
-3
-2
-1
0
1
2
3
4
2007 2008 2009 2010 2011
Source: Bloomberg
2012 2013 2014 2015 2016 2017
SLI Rates JGB Forecasts – 6 Months Forward
95% con�dence upper bound Current Source: Bloomberg as at 14 December 2017
6m �d CENTRAL VIEW
Yiel
d to
Mat
urity
Maturity
-0.4-0.2
0.2
0.6
1.0
0.0
0.4
0.8
1.21.41.6
1.8%
0 5 10 15 20 25 30 35 40
FundamentalsBuilding on momentum, the Japanese economy has recorded seven consecutive quarters of economic growth, with most recent data printing at 1.4% annualised QoQ GDP growth in Q3, down from 2.5% in Q2. By historical measures this is a very impressive run, last matched in 1999-2001. However, both the BoJ and the MoF estimate the potential growth rate in the economy at around 0.5% annually, and see the economy decelerating towards that into the new year. But for now this means that measures of the ‘output gap’ suggest an economy running above potential with diminishing spare capacity. Despite an optically tight labour market, real wage growth continues to fall, although we note tentative signs of labour shortages in various sectors leading to higher compensation. Even with apparently strong economic fundamentals, inflation remains weak – as has been the case for an extended period.
SentimentSince the last update, the tight yield range in the Japanese rates market that we have observed since the introduction of yield curve control (YCC) continues to hold. Although JGBs continue to trade directionally with the rest of the G10 FI complex, the ‘beta’ of the move has been reduced drastically since YCC. Since September 2016, simple calculations imply a 10bps move in USTs is consistent with a 1.5bps move in JGBs. Moving the regression window to a year prior to YCC, this relationship was as high as 0.8. The curve has pivoted around 10s, as the BoJ intended.
Valuation, technical & supplyStructural flows in the JGB market mean the front end of the curve continues to trade below the deposit rate of -0.10%, but they have cheapened from the end of 2016. The cross currency basis that drove foreign investors to buy front-dated JGBs hedged has moved back from the most extreme levels. This has reduced the spread pick-up, although it remains firmly in positive territory. This structural richness continues to distort rate pricing signals from the front end of the government bond curve. Looking at the OIS market though, we can see that no further cuts are priced in, and the first hike 10bps is not fully priced until September 2021.
Summary Despite reasons to believe the inflation trajectory in Japan remains firmly below target, there are features of BoJ policy and the JGB market that suggest asymmetry around an underweight position and curve steepeners.The BoJ’s comprehensive review led to the introduction of YCC and a new paradigm of thinking. We think that the explicit desire for steeper curves, and the BoJ’s longer-term willingness and ability to allow the long end to edge higher in yield, will continue to support this trade. Further emphasis by the BoJ board of a “reversal rate”, when prolonged easy policy becomes counterproductive, adds to our conviction. Our base case is not JGBs to be higher in yield or for inflation to hit target imminently, but we think the asymmetry means the risks for yields are to the upside.
UN
DER
WEI
GHT
OV
ERW
EIG
HT
NEU
TRAL

Australia
Market Prices & Moves (as at Q4 2017) WeightingsInstrument Current 1 month ago 3 months ago Fundamentals OVERWEIGHT
3-year ACGB 2.04% 1.93% (+11bp) 2.11% (-7bp) Sentiment OVERWEIGHT
10-year ACGB 2.52% 2.59% (-7bp) 2.74% (-22bp) Valuation, technical & supply NEUTRAL
AUD/USD 0.768 0.759 (+1.19%) 0.800 (-4.00%) Summary OVERWEIGHT
Housing marking cooling
-1
0
1
2
3
4
5
Mar12
Jun 12
Sep 12
Dec 12
Mar 13
Jun 13
Sep 13
Dec 13
Mar 14
Jun 14
Sep 14
Dec 14
Mar 15
Jun 15
Sep 15
Dec 15
Mar 16
Jun 16
Sep 16
Dec 16
Mar 17
Jun 17
Sep 17
Quar
terly
Cha
nge i
n Hou
se Pp
rices
, RBA
Targ
et R
ate (
%)
Quarterly House Price Index RBA Interest Rate Source: Bloomberg
SLI Rates ACGB Forecasts – 6 Months Forward
95% con�dence upper bound Current Source: Bloomberg as at 14 December 2017
6m �d CENTRAL VIEW
Yiel
d to
Mat
urity
Maturity
0.0
0.5
1.0
1.5
2.0
2.5
3.0
3.5
4.0%
0 5 10 15 20
FundamentalsThe labour market continues to produce impressive jobs growth; however, the Reserve Bank of Australia (RBA) is facing the same problems with regards to weak wage growth and a flat Philips curve that has dogged so many other central banks post financial crisis. We would argue that there is still a long way to go before significant wage pressures emerge, pointing to the significant gap between the official unemployment rate and other measures of labour market slack, such as the underutilisation rate, which at 13.7% is almost 4% above its pre-crisis low. In the absence of significant increases in wages and salaries, consumers continue to get squeezed, with falling savings rates and stagnating house prices providing little in the way of positive impetus for increased spending. Headline inflation surprised to the downside as structural forces more than offset gains from rising energy prices. This leaves the RBA below its target band once again.
SentimentSentiment towards Australian bonds improved dramatically, as weaker wage growth and inflation prints pushed back fears of policy tightening by the RBA later into 2018. The global hunt for safe-haven assets, which drove aggressive flattening of the US yield curve, gave further support to Australian bonds as they significantly outperformed other markets over the quarter. This was partially due to a squeeze on some investors who had positioned themselves short duration at the front-end of the yield curve in expectation that the RBA would join other central banks in adopting a more hawkish outlook. Australian bonds should continue to find support in this yield curve flattening regime.
Valuation, technical & supplyIn general, bonds are attractively priced given the current mix of policy rates and low inflation. Smaller current account deficits will reduce bond issuance going forward. The Australian Office of Financial Management is likely to continue to target longer issuance as it fills out the bond curve past the 10-year mark, where we see a significant demand for these safe-haven, relatively higher-yielding assets. Meanwhile, with just one rate hike priced in over the next 12 months, and a high bar to further easing by the RBA, we prefer forward structures further out the curve where valuations still look attractive.
Summary The central theme that led us to favour Australian bonds still holds (high household leverage, reliance on the housing market to support growth, external vulnerabilities related to China) and indeed there are signs that the recent housing slowdown could restrain growth further in 2018 as Australian Prudential Regulation Authority measures and stretched valuations start to bite. Additionally, the economy is likely to be frustrated with low inflation and wage growth, as structural factors continue to take hold. The factors outlined above do not constitute an environment conducive to rate hikes, and we believe the RBA will be forced to remain on hold. We remain positive on Australian duration. However, after a period of significant outperformance, we are maintaining our current positioning rather than looking to increase our holdings. We will look for opportunities in the new year to add to our core holding on a cross-market basis.
UN
DER
WEI
GHT
OV
ERW
EIG
HT
NEU
TRAL

Standard Life Investments Limited is registered in Scotland (SC123321) at 1 George Street, Edinburgh EH2 2LL. Standard Life Investments Limited is authorised and regulated in the UK by the Financial Conduct Authority.
Standard Life Investments (Hong Kong) Limited is licensed with and regulated by the Securities and Futures Commission in Hong Kong and is a wholly-owned subsidiary of Standard Life Investments Limited.
Standard Life Investments Limited (ABN 36 142 665 227) is incorporated in Scotland (No. SC123321) and is exempt from the requirement to hold an Australian financial services licence under paragraph 911A(2)(l) of the Corporations Act 2001 (Cth) (the ‘Act’) in respect of the provision of financial services as defined in Schedule A of the relief instrument no.10/0264 dated 9 April 2010 issued to Standard Life Investments Limited by the Australian Securities and Investments Commission. These financial services are provided only to wholesale clients as defined in subsection 761G(7) of the Act. Standard Life Investments Limited is authorised and regulated in the United Kingdom by the Financial Conduct Authority under the laws of the United Kingdom, which differ from Australian laws.
Standard Life Investments Limited, a company registered in Ireland (904256) 90 St Stephen’s Green Dublin 2, is authorised and regulated in the UK by the Financial Conduct Authority.
Standard Life Investments (USA) Limited is registered as an Exempt Market Dealer with the Ontario Securities Commission and as an Investment Adviser with the US Securities and Exchange Commission. Standard Life Investments (Corporate Funds) Limited is registered as an Investment Adviser with the US Securities and Exchange Commission.
Calls may be monitored and/or recorded to protect both you and us and help with our training.
www.standardlifeinvestments.com © 2017 Standard Life Aberdeen, images reproduced under licence
INVBGEN_16_1867_Rates Outlook_Q1 2018_TCM 1217
Important InformationAll information, opinions and estimates in this document are those of Standard Life Investments, and constitute our best judgement as of the date indicated and may be superseded by subsequent market events or other reasons.
This material is for informational purposes only and does not constitute an offer to sell, or solicitation of an offer topurchase any security, nor does it constitute investment advice or an endorsement with respect to any investment vehicle.This material serves to provide general information and is not meant to be legal or tax advice for any particular investor, which can only be provided by qualified tax and legal counsel.
This material is not to be reproduced in whole or in part without the prior written consent of Standard Life Investments. Any data contained herein which is attributed to a third party (“Third Party Data”) is the property of (a) third party supplier(s) (the “Owner”) and is licensed for use by Standard Life Aberdeen*. Third Party Data may not be copied or distributed. Third Party Data is provided “as is” and is not warranted to be accurate, complete or timely. To the extent permitted by applicable law, none of the Owner, Standard Life Aberdeen* or any other third party (including any third party involved in providing and/or compiling Third Party Data) shall have any liability for Third Party Data or for any use made of Third Party Data. Past performance is no guarantee of future results. Neither the Owner nor any other third party sponsors, endorses or promotes the fund or product to which Third Party Data relates.
*Standard Life Aberdeen means the relevant member of the Standard Life Aberdeen group, being Standard Life Aberdeen plc together with its subsidiaries, subsidiary undertakings and associated companies (whether direct or indirect) from time to time.