government affiliation and peer-to-peer lending platforms
TRANSCRIPT

Journal of Empirical Finance 62 (2021) 87–106
iileosP
z
Contents lists available at ScienceDirect
Journal of Empirical Finance
journal homepage: www.elsevier.com/locate/jempfin
Government Affiliation and Peer-To-Peer Lending Platforms inChina✩
Jinglin Jiang, Li Liao, Zhengwei Wang, Xiaoyan Zhang ∗
PBC School of Finance, Tsinghua University, PR China
A R T I C L E I N F O
JEL classification:G21G28O3
Keywords:Peer-to-peer lending platformsFintechGovernment affiliationState-owned enterpriseEmerging markets
A B S T R A C T
With thousands of co-existing and competing platforms, the Chinese peer-to-peer (P2P) lendingmarket experienced both high growth and high failure rate. We hand collect unique datafor these P2P platforms and investigate the differences in performances and survivals forplatforms with and without affiliations with state-owned enterprises (SOEs). P2P platformswith SOE affiliations have higher trading volumes, attract more investors, and offer lowerinterest rates. These platforms also survive significantly better than those without the SOEaffiliations, especially during market downturns. Using P2P platforms with fake SOE affiliationsas identification, we show that the SOE affiliation itself (not related to the fundamentals) is animportant signal for P2P market participants. These results can be helpful to investors andregulators, especially those from other emerging markets.
1. Introduction
Peer-to-peer (P2P) lending, the practice of directly matching lenders and borrowers through online services, was first introducedn China in 2007. Over the 10 years between 2008 and 2018, the Chinese P2P market enjoyed phenomenal growth and became anmportant component of the financial industry. By early 2018, around 6,000 P2P platforms had been established in China, facilitatingoans in the amount of around $800 billion. This tremendous growth has been accompanied by a phenomenally high failure rate. Byarly 2018, over 60% of the 5,000 + P2P platforms that ever operated were closed. As a result of nation-wide tightening regulationsn P2P platforms over 2018 to 2020, only 29 online lending platforms are still operating by June 2020. The substantial industryize, large cross section of platforms, the extremely high failure rate and dramatic regulation changes all clearly separate the Chinese2P market from the P2P markets from developed countries,1 which also makes it a fascinating research subject.
One potential driver for the rapid growth of P2P platforms in China is the under-development of the economic infrastructure,including the traditional banking sector, the credit system, and the law enforcement system, which possibly leaves space for the fastgrowth of financial innovations such as P2P platforms. On the other hand, the under-development of the economy can also leadto many uncertainties and even systemic risks for financial innovations such as P2P platforms. In this situation, the government’sguidance and regulation on the P2P platforms can be essential. Interestingly, many Chinese P2P platforms advertise prominently
✩ We would like to thank seminar/conference participants at Tsinghua University, Purdue University, RFS Fintech Conference, FMA Asia/Pacific 2018Conference, 2018 Chinese Finance Research Conference, Baruch College, Georgia Tech University and Georgia State University for helpful comments andsuggestions. Zhang acknowledges financial support from the China NSF Grant 71790605.∗ Correspondence to: 43 Chengfu Road, Beijing, 100083, PR China.
E-mail addresses: [email protected] (J. Jiang), [email protected] (L. Liao), [email protected] (Z. Wang),[email protected] (X. Zhang).
1 According to IBISWorld Industry Report OD4736: Peer-to-Peer Lending Platforms in the US, there were around 200 platforms in the U.S., and three P2P platformswere closed around the same period. As for the total transaction volumes, U.S. platforms facilitated $8.21 billion in loans in 2018, while the number for Chinais $178.89 billion, according to https://www.statista.com/statistics/497241/digital-market-outlook-global-comparison-alternative-lending-transaction-value.
https://doi.org/10.1016/j.jempfin.2021.02.004Received 24 September 2020; Received in revised form 17 February 2021; Accepted 22 February 2021Available online 6 March 20210927-5398/© 2021 Elsevier B.V. All rights reserved.

J. Jiang, L. Liao, Z. Wang et al. Journal of Empirical Finance 62 (2021) 87–106
S
on their websites that they are affiliated with the government, or state-owned enterprises (SOEs), indicating that these platformspossibly believe that SOE affiliations can help them to attract potential customers. In this paper, we study the development anddynamics of the overall Chinese P2P market by investigating how government affiliations are related to the performances andsurvival dynamics of thousands of P2P lending platforms in China.
To the best of our knowledge, few if any previous studies examine the cross section of P2P platforms, possibly because thereare no available public data on multiple P2P platforms. Given that the history of the industry is short, the nature of the business isprivate, and regulators have not requested the P2P platforms to submit their operational data, it is quite difficult to obtain relevantand direct data on multiple P2P platforms. To overcome the data difficulty, we hand collect data on thousands of P2P platforms,with substantial cross-sectional variations in government affiliations and platform performance measures. To be specific, we collecttwo datasets. The first dataset contains detailed weekly transaction data at the platform level for 1,593 P2P platforms from January1, 2014 to February 28, 2018. The second dataset contains survival information for over 5,000 platforms, which covers almost all ofthe P2P platforms that existed between 2012 and 2018. We stop in 2018 because the data sources cease to exist after mid-2018, whenthe whole industry went through major contraction. That is, our study focuses on the uprising expansion period of the P2P industryin China. These novel datasets allow us to closely examine important issues such as cross-platform performances and survivals,which have been difficult for previous studies to investigate. Unfortunately, P2P platforms mostly do not disclose information aboutindividual loans, or information regarding their routine operations. Therefore, our data also do not have this detailed information.
The previous literature argues that state-owned enterprises (SOEs) could be considered government agents in China’s specificsetting.2 Therefore, we use SOE affiliation as a proxy for government involvement. Our empirical results show that platforms withSOE affiliations are more likely to enjoy larger transaction volumes and attract more investors. In terms of magnitude, the transactionvolumes and the number of investors for P2P platforms with SOE affiliations are on average more than double those of P2P platformswithout SOE affiliations. In addition, platforms with SOE affiliations are 87.2% less likely to fail, and they offer lower interest ratesby 2 percentage points. These results indicate that P2P platforms with SOE affiliations have better performances and higher survivalprobabilities, and SOE affiliations can serve as a signal for investors to choose among thousands of P2P platforms.
It is possible that the SOE affiliation could be correlated with unobservable variables that have nothing to do with governmentaffiliation but affect platform performances and survival probabilities. To better understand whether the SOE affiliation itself is agood signal for selecting platforms, we examine the performances of several P2P platforms with fake SOE affiliations. That is, theseplatforms claim to be affiliated with SOEs, while they are not. We find that the characteristics of platforms with fake SOE affiliationsresemble those of platforms without SOE affiliations, yet platforms with fake SOE affiliations attract significantly more tradingvolumes and investors than the other non-SOE-affiliated platforms. After the revelation of fake SOE affiliations, the performancesfor these platforms deteriorates significantly. The results indicate that the title of ‘‘SOE affiliation’’ itself is a valid signal for attractingmore traffic for P2P platforms, even when the affiliation is fake.
What drives the relation between SOE affiliations and P2P platforms’ performances? One possibility is that the SOE affiliationmight provide (a perception of) government protection against defaults, even though the affiliated-SOE never gives any promises forprotection. That is, if an SOE-affiliated platform were to face default, the affiliated SOE would, or is believed to, save the platformand fulfill its obligations, or at least offer better terms than the platforms without SOE affiliations. Alternatively, it could also be thatP2P platforms with SOE affiliations have, or are believed to have, better access to capitals and other business resources, and enjoyhigher operational efficiencies. Finally, it is also possible that, due to the affiliation with the government, the platforms are lesslikely to be involved in fraud or other illegal activities, or at least investors believe that to be the case. If SOE-affiliated platformsprovide downside protection or offer better efficiency or have better creditability, or at least if investors believe they do, investorconfidence in SOE-affiliated platforms would be bolstered. As a result, SOE-affiliated platforms have more investors, higher tradingvolumes and survival probabilities, and the investors are willing to accept the lower interest rates offered by them.
To thoroughly examine whether SOEs truly provide downside protection or better efficiency or better creditability for affiliatedplatforms, we would need detailed data on how SOEs affect day-to-day operations of the P2P platforms, how each loan performs, andwhether defaulted loans are bailed out by the SOEs, while all of these data items are unavailable. As an alternative, we hand collectseveral platform characteristics as proxies, such as whether the affiliations are with central SOEs or local SOEs, and whether theaffiliations are with financial SOEs or nonfinancial SOEs. Between central SOEs and local SOEs, the former have more creditabilityand resources; and between financial and nonfinancial SOEs, the former have more expertise. We find that the positive correlationsbetween SOE affiliations and platform performances and survivals are much stronger for central SOEs and financial SOEs, whichsheds some light on the driving forces of the connection between SOE affiliations and platforms.
Our paper naturally connects to the growing literature on P2P lending market. This strand of literature primarily focuses on howa borrower’s information (e.g., Pope and Sydnor, 2011; Duarte et al., 2012; Lin et al., 2013; Iyer et al., 2015) and market designs(Hildebrand et al., 2017; Wei and Lin, 2017; Hertzberg et al., 2018) affect lender behaviors, funding outcomes, and borrowers’performances. Different from our study, the above studies mostly focus on information processing using data from a single U.S.based platform. To the best of our knowledge, we are the first study to examine performances and survivals across thousands of P2Plending platforms, with rich cross-sectional properties. Our paper provides a broader picture and may help investors, regulators,and practitioners better understand this new industry.
Recently, researchers have also studied the relation between P2P platforms and traditional financial institutions, such ascommercial banks (Tang, 2019) and institutional investors (Vallee and Zeng, 2019). Many papers, such as Bartlett et al. (2018),
2 Bai et al. (2006) document that SOEs are charged with the task of social welfare provision by the Chinese government. Liao et al. (2014) document thatOEs’ executives are appointed and evaluated by the Chinese government.
88

J. Jiang, L. Liao, Z. Wang et al. Journal of Empirical Finance 62 (2021) 87–106
UE
bdS
Buchak et al. (2018), Chen et al. (2019), Fuster et al. (2019), examine the advantage of fintech over traditional financial servicesproviders. Unlike these studies, which are all based on data from developed countries, our research focuses on the largest emergingmarket with an under-developed banking, credit and law enforcement system, and thus provides a new perspective on how fintechfirms grow and mature in an emerging market, as well as the associated benefits and costs.
Relatedly, our study is also related to the literature on how government involvement affects financial innovations. Simon (1989)argues that standard-setting by regulators can benefit participants, especially in unregulated markets, which in our case is the P2Pindustry. The story can also be much more complicated in emerging markets, as indicated in Glaeser et al. (2001). A recent reportby the IMF, Sy et al. (2018), clearly states that ‘‘Fintech is a major force shaping the structure of the financial industry’’ in Africa,and ‘‘policy measures are needed to reap the potential benefits of Fintech while managing associated risks’’. Our analysis shows apositive correlation between P2P platform performances and government affiliations, which provides important additional evidenceto this strand of literature, and it might be particularly important for other emerging markets to design their regulations on financialinnovations.
The remainder of this article is organized as follows. In Section 2, we introduce the institutional background of the ChineseP2P market. Data are discussed in Section 3. Section 4 provides the basic empirical results on the relation between governmentaffiliations and platform performances and survival probabilities. We discuss the identification issue using platforms with fake SOEaffiliations in Section 5. In Section 6, we provide evidence on potential channels for the positive correlations between SOE affiliationsand platform performances and survivals. Section 7 concludes.
2. China P2P platforms: Institutional background
The P2P market is first introduced in the developed markets, which have more efficient financial sectors, more mature creditscore systems, and more effective law enforcement than the emerging markets do. In the existence of mature banking and investmentsectors, Tang (2019) finds that the U.S. P2P market serves as a supplement to traditional banking in the case of small size loans,and as a substitute for infra-marginal bank borrowers. However, in neither case are the P2P platforms significant players in thefinancial market. In contrast, Chinese P2P platforms are much more important for investors and borrowers, and they play a muchmore significant role in society, especially for small- and medium-sized enterprises (SMEs) and individuals, whose financing needscannot be fully satisfied by traditional financial institutions in China.
From the borrowers’ side, the P2P market acts as an important alternative funding source for small firms and individuals. Due tothe underdeveloped credit score system, information asymmetry, and diseconomies of scale, it is quite difficult for individuals andsmall firms to borrow from commercial banks. In the Chinese loan market, only 21.8% of financially constrained individuals and46.2% of SMEs are served by the banking system.3 The P2P market provides viable access to capital for this under-served market.
From the investors’ perspective, the P2P market serves as an exciting new investment channel for Chinese households. Chinesehouseholds normally consider fixed income products, stocks, mutual funds, and real estate market as investment channels. Thetypical annual CD rate offered by Chinese banks is approximately 3%, and the annual return on bank wealth management productsis approximately 5%. The P2P lending platforms on average provide investment returns above 10%, much higher than returns offeredby conventional fixed-income investment tools. In terms of stock investment and real estate investment, the recent turbulence in theChinese stock market leads to low stock returns, and frequent regulation changes on the housing prices make real estate investmentsless attractive. Not surprisingly, the P2P lending platforms attract many households as a new and potentially ‘‘better’’ (yet riskier)investment channel, compared to traditional investments in fixed income, equity, and real estate.
Given the substantial demand for this alternative capital channel and ample supply of funding, maybe it is not surprising thatthousands of P2P platforms were founded over a short period to serve the market. The total transaction volume in China P2P marketin 2018 reached about $178.89 billion. In comparison, the U.S. P2P platforms aggregate trading volume was $8.21 billion for thesame year. By February 2018, there were around 6,000 platforms in China, in contrast to approximately 200 in the U.S. over thesame time period. The drastic difference between China and the U.S. clearly indicate the popularity and importance of P2P platformsas a funding channel in China, which is a direct result of an under-developed financial market. In addition, the large number of P2Pplatforms provides a rich cross section that is not observed in any other country.
P2P platforms, like many other financial innovations, can carry substantial uncertainties and risks, especially in emergingmarkets. They might fail, they might introduce greater fragility to the financial system, and they might even lead to systemic crises,as indicated in Carter (1989) and Rajan (2006). In the case of China’s P2P industry, the rapid growth of P2P platforms has beenaccompanied by substantial fraud and failure. By early 2018, over 60% of P2P platforms had closed, while during the same period,only three U.S. P2P platforms are reported to have failed. We hand collect the reasons for failed Chinese P2P platforms and findthat 40% of platforms were closed due to fraud, 18% of platforms were liquidated due to bad performances, while the rest ceasedto exist for unknown reasons.4
3 The former number comes from the 2010 wave of China Family Panel Studies, which was launched by the Institute of Social Science Survey (ISSS) of Pekingniversity. The latter number comes from the 2014 wave of China Household Finance Studies, which was launched by Southwestern University of Finance andconomics.
4 When a platform fails, how much investors can recover varies from platform to platform, and most of the time information is not disclosed and cannote collected on a large scale. To help readers gain perspectives on this issue, we provide details on how two defunct platforms treated their liabilities after theefault in Appendix A. The anecdotal evidence shows that platforms with SOE affiliations tend to return investors’ original investments, while platforms withoutOE affiliations tend to disappear without payments to investors.
89

J. Jiang, L. Liao, Z. Wang et al. Journal of Empirical Finance 62 (2021) 87–106
‘pcl‘bs
orecsf
paowgf
tiCft
3
wags
3
iSatOcsB
paji
sttc
Given the fierce cross-platform competition for visitor traffic and survival, some platforms have begun to adopt the practice of‘principal guarantee’’; this practice quickly has become prevalent among all P2P platforms. The ‘‘principal guarantee’’ means that thelatform guarantees to payback principal to investors in the event of default by borrowers. Typical P2P platforms in most of the otherountries, such as the U.S., only serve as an intermediary for connecting the borrowers and the lenders. When borrowers default,enders bear the losses, which has no impact on the platform. For Chinese P2P platforms, however, when borrowers default, under‘principal guarantee’’, the platform promises to return the principal back to the lenders. Therefore, the platform, not the lender,ears (most of) the consequence of borrowers’ default, and the majority of the credit risk exposure (at least the principal part) ishifted from individual investors to platforms.
This practice of ‘‘principal guarantee’’ has two important implications. First, because the platforms bear most of the default riskf individual loans, to protect the platforms from the default risk, they carefully screen the loan applications, preset the interestates accordingly, and require collateral from borrowers if the loan amount is relatively large. Second, given that the credit riskxposure to individual loans is shifted to the platforms, and the platforms might default themselves, it is essential for investors tohoose the right platform by assessing the platform’s credit-worthiness. That is, considering the under-developed credit and legalystem, choosing the right platform, rather than the individual loan itself, becomes one of the most challenging and important issuesor investors in the Chinese P2P market.
The Chinese government is an active and powerful participant in the financial market, and its regulation and guidance for the P2Platforms gradually evolves as the P2P market grows. The 2015 Chinese Government Work Report highlighted ‘‘entrepreneurshipnd innovation by all’’ and ‘‘financial inclusiveness’’. Many of the P2P lending platforms are start-up firms, which embodies the ideaf entrepreneurship. Meanwhile, the P2P platforms also serve a population with limited access to the traditional capital market,hich supports the idea of ‘‘financial inclusiveness’’. Given that the P2P platforms fit the government’s strategic view, the Chineseovernment permitted and implicitly supported the rapid growth of the P2P platforms. Before 2015, many P2P platforms wereounded by state-owned enterprises, indicating that the government permits the opening of these P2P platforms.
After 2015, as frauds and scandals appeared more frequently in the media and negatively affect investors, the Chinese governmentook a series of correcting actions to standardize the industry. For instance, the National Internet Finance Association (NIFA) wasnitiated in March 2016 as an official self-regulatory organization of P2P platforms. In August 2016, the Chinese Banking Regulatoryommission (CBRC), introduced the requirement that P2P platforms operate as information intermediaries, which prohibited them
rom engaging in illegal fund-raising, but without clear statements on financial or legal penalty for violations of these requirements,he cost of violation can be low.5
. Data
Most existing studies on P2P platforms use data from the U.S., and they typically only examine one platform, mostly Prosper.com,hich makes data publicly available. For multiple P2P platforms, because no regulation requires them to make the data publiclyvailable, data are hard to obtain. For our study, we hand collect the data items. In Section 3.1, we introduce our measure forovernment affiliation. The datasets for performances and survivals are discussed in Section 3.2, Section 3.3 provides summarytatistics.
.1. SOE affiliations
Following DeFond et al. (2000), we use SOE affiliation as a proxy for government involvement. To obtain the affiliationnformation, we manually check all platforms’ shareholder information in the National Enterprises Credit Information Publicityystem, which provides public access to official registration data for all legal entities in China. A P2P platform is identified asn SOE-affiliated platform if there is one or more state-owned enterprises among the platform’s shareholders, which means ifracking through the share-holding structure, one or more government agencies, central or local, is among its ultimate shareholders.therwise, it is identified as a non-SOE-affiliated platform. Central government agencies include all the departments of the stateouncil, such as the State-owned Assets Supervision and Administration Commission (SASAC), and other government departments,uch as the Ministry of Finance, etc. Local government agencies include, for example, the SASAC in local government, and the localureau of Finance.
The SOE affiliation reflects government involvement rather than government direct intervention. Typically, a SOE-affiliatedlatform is founded jointly by an SOE and other private entity. Notice that the SOE affiliations are established when the platformsre founded and can be changed during the life of the P2P platform. However, in our sample, there are zero cases where an SOEoins the affiliation after the platform is founded, and there are zero cases of SOE withdrawal from the affiliation after the platforms founded.
There are several reasons why SOEs choose to be affiliated with the P2P platform. It is possible that SOEs follow the nation’strategic view for ‘‘entrepreneurship’’ or ‘‘financial inclusiveness’’ and choose to be involved. It is also possible that SOEs would likeo profit from this emerging P2P market. Finally, due to career concern and/or peer pressure, the leadership of SOEs might wanto invest in P2P platforms so as not to miss out on this new opportunity. Without direct observable data on SOEs’ intentions, weannot confirm which reason dominates, but it is likely that all reasons play some role in the P2P affiliation decision.
5 In Appendix B, we provide more detailed discussions on government regulations and guidance for the industry over 2015 to 2020.
90
J. Jiang, L. Liao, Z. Wang et al. Journal of Empirical Finance 62 (2021) 87–106
csp
3.2. P2P platform performances and survivals
We use two datasets for P2P platform performances and survivals. The first dataset contains weekly trading data for eachplatform, and we refer to this sample as the ‘‘trading sample’’. The data are collected from a website, www.wdzj.com, which isthe largest and the most popular online information provider for P2P platforms in China. Given that the same data have been usedby regulatory authorities, such as the China Banking Regulatory Commission (CBRC), for industry overviews, we assume this sampleis credible and accurately represents the P2P platform universe in China. The ‘‘trading sample’’ contain weekly trading data on 1,694P2P platforms between January 1, 2014 and February 28, 2018, and data items include trading volumes, numbers of investors, terms(time to maturity), and interest rates, etc.
To ensure that our data contain the most important and liquid platforms, we apply the following filters, similar to those in Yin(2016) for hedge funds, to the weekly trading data. First, to exclude platforms with insignificant market sizes, we require eachplatform to have at least 5 million Chinese Yuan in registered capital. Second, to mitigate the backfill bias, we exclude the first halfyear of observations for each platform. Third, to eliminate reporting errors and outliers, we winsorize trading volumes, number ofinvestors, interest rates, and registered capital at the 1st and 99th percentiles. The filtered sample contains 1,593 platforms, with1,371 live ones and 222 defunct ones.
Our second dataset contains the life cycle information of thousands of Chinese P2P platforms, and we refer to this sample asthe ‘‘long sample’’. As mentioned earlier, from 2011 to 2018, around 6,000 platforms came into existence in this market, and over3,000 platforms ended in failure. Before this study, no existing database had aggregated the information on the life cycles of theseplatforms. We first collect the platforms’ names from www.wdzj.com, and www.p2peye.com, (the second largest online informationprovider for P2P platforms in China but without trading information), and then hand collect the life cycle information from theplatforms’ homepages and the public press For detailed information of defunct platforms, we cross check their historical informationvia web.archive.org, a U.S.-based website taking snapshots of public websites automatically. The data items collected includeplatform name, inception date, amount of capital at time of registration, holding structure, and failure date (when applicable).We obtain information for 5,498 platforms, which covers majority of the P2P platforms that have existed since 2011. To excludeplatforms with insignificant market sizes, we require each platform to have at least 5 million Chinese Yuan in registered capital.This filter leaves a sample of 4,210 platforms.6
3.3. Summary statistics on key variables
We first compute the summary statistics for a dummy variable SOE, which takes the value of one if a P2P platform is affiliatedwith an SOE, and zero otherwise. In our pooled trading sample, 8.9% of the platform × week observations are from platforms withSOE affiliations.
Next we present summary statistics of the pooled trading sample in Table 1 Panel A. To facilitate direct comparison betweenSOE and non-SOE platforms, we report the statistics of platform performance measures for platforms with SOE affiliations in the lefthalf panel and platforms without SOE affiliations in the right half panel. Since platform income is mostly from loan origination feesand account service fees, which are not reported but are largely based on platform transaction volumes, we use trading volumesand number of borrowers/investors as performance measures for the P2P platforms. All information is aggregated at the platformlevel each week, so we do not have individual loans information.
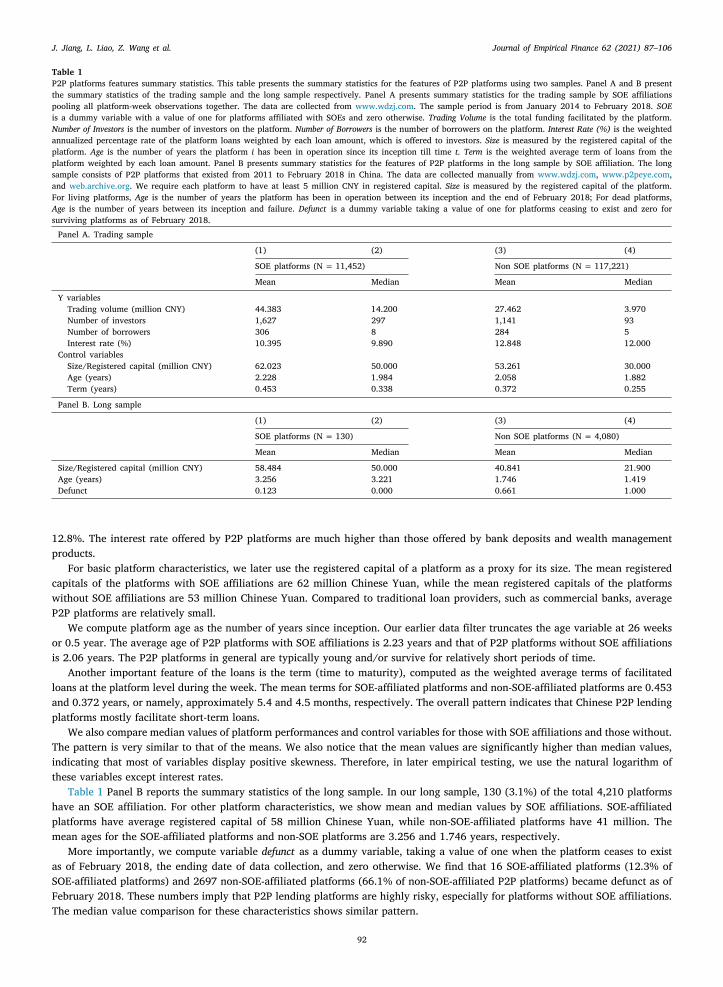
We measure Trading Volume as the weekly total amount of new loans funded. For Trading Volumes, the mean values for platformswith SOE affiliations and for platforms without SOE affiliations are 44 and 27 million Chinese Yuan, respectively. For Number ofInvestors, the mean values for platforms with SOE affiliations and those without are 1,627 and 1,141 each week. For Number ofBorrowers, the mean values for platforms with SOE affiliations and those without are 305 and 208, respectively. That is to say, theSOE platforms have higher trading volumes, larger numbers of investors and borrowers than the non-SOE platforms do.
To better understand how the trading volumes and number of investors evolve over time, we present the time series of averageweekly trading volumes and numbers of investors for SOE-affiliated platforms and non-SOE-affiliated platforms for the tradingsample platforms in Fig. 1. Interestingly, the SOE-affiliated P2P platforms enjoy larger and gradual increases over the period of2015 to 2017, in terms of both trading volumes and number of investors, than the non-SOE-affiliated platforms do. The platformswithout SOE affiliations, on the other hand, also have increased volumes and number of investors, while the increases mostly happenin 2017. Clearly, the SOE-affiliated platforms attract most of the investors during the beginning of the quick expansion period ofthe P2P industry in 2015. The non-SOE affiliated platforms catch up with the SOE affiliated platforms in 2017, possibly becauseinvestors are more familiar and comfortable with the business model of P2P platforms.
The trading data also provide weekly platform-level Interest Rate, which is computed as a loan amount-weighted average of theannualized percentage return rate of all facilitated loans for the platform during the week. The interest rate is what the platformoffers to investors. As discussed earlier, the interest rates at Chinese P2P platforms are preset and directly offered to investors.Therefore, these rates possibly reflect both the platform’s risk assessment and investor’s risk appetite. The mean interest rate offeredby P2P platforms with SOE affiliations is 10.4%, and the mean interest rate offered by P2P platforms without SOE affiliations is
6 While the long sample has a greater coverage of all platforms, the trading sample contains the largest and the most active platforms, and we need to beautious that results using the trading sample might be biased toward the larger and more active platforms. Meanwhile, to examine the coverage of the tradingample platforms, we compute the total trading volume of the whole P2P lending market (as in the long sample) in 2017, and find that trading sample P2Platforms accounts for 90% of the total transaction volume, which indicates that the trading sample’s coverage of the whole P2P industry is adequate.
91
J. Jiang, L. Liao, Z. Wang et al. Journal of Empirical Finance 62 (2021) 87–106
cwP
oi
lap
Tit
hpm
aSFT
Table 1P2P platforms features summary statistics. This table presents the summary statistics for the features of P2P platforms using two samples. Panel A and B presentthe summary statistics of the trading sample and the long sample respectively. Panel A presents summary statistics for the trading sample by SOE affiliationspooling all platform-week observations together. The data are collected from www.wdzj.com. The sample period is from January 2014 to February 2018. SOEis a dummy variable with a value of one for platforms affiliated with SOEs and zero otherwise. Trading Volume is the total funding facilitated by the platform.Number of Investors is the number of investors on the platform. Number of Borrowers is the number of borrowers on the platform. Interest Rate (%) is the weightedannualized percentage rate of the platform loans weighted by each loan amount, which is offered to investors. Size is measured by the registered capital of theplatform. Age is the number of years the platform i has been in operation since its inception till time t. Term is the weighted average term of loans from theplatform weighted by each loan amount. Panel B presents summary statistics for the features of P2P platforms in the long sample by SOE affiliation. The longsample consists of P2P platforms that existed from 2011 to February 2018 in China. The data are collected manually from www.wdzj.com, www.p2peye.com,and web.archive.org. We require each platform to have at least 5 million CNY in registered capital. Size is measured by the registered capital of the platform.For living platforms, Age is the number of years the platform has been in operation between its inception and the end of February 2018; For dead platforms,Age is the number of years between its inception and failure. Defunct is a dummy variable taking a value of one for platforms ceasing to exist and zero forsurviving platforms as of February 2018.
Panel A. Trading sample
(1) (2) (3) (4)
SOE platforms (N = 11,452) Non SOE platforms (N = 117,221)
Mean Median Mean Median
Y variablesTrading volume (million CNY) 44.383 14.200 27.462 3.970Number of investors 1,627 297 1,141 93Number of borrowers 306 8 284 5Interest rate (%) 10.395 9.890 12.848 12.000
Control variablesSize/Registered capital (million CNY) 62.023 50.000 53.261 30.000Age (years) 2.228 1.984 2.058 1.882Term (years) 0.453 0.338 0.372 0.255
Panel B. Long sample
(1) (2) (3) (4)
SOE platforms (N = 130) Non SOE platforms (N = 4,080)
Mean Median Mean Median
Size/Registered capital (million CNY) 58.484 50.000 40.841 21.900Age (years) 3.256 3.221 1.746 1.419Defunct 0.123 0.000 0.661 1.000
12.8%. The interest rate offered by P2P platforms are much higher than those offered by bank deposits and wealth managementproducts.
For basic platform characteristics, we later use the registered capital of a platform as a proxy for its size. The mean registeredapitals of the platforms with SOE affiliations are 62 million Chinese Yuan, while the mean registered capitals of the platformsithout SOE affiliations are 53 million Chinese Yuan. Compared to traditional loan providers, such as commercial banks, average2P platforms are relatively small.
We compute platform age as the number of years since inception. Our earlier data filter truncates the age variable at 26 weeksr 0.5 year. The average age of P2P platforms with SOE affiliations is 2.23 years and that of P2P platforms without SOE affiliationss 2.06 years. The P2P platforms in general are typically young and/or survive for relatively short periods of time.
Another important feature of the loans is the term (time to maturity), computed as the weighted average terms of facilitatedoans at the platform level during the week. The mean terms for SOE-affiliated platforms and non-SOE-affiliated platforms are 0.453nd 0.372 years, or namely, approximately 5.4 and 4.5 months, respectively. The overall pattern indicates that Chinese P2P lendinglatforms mostly facilitate short-term loans.
We also compare median values of platform performances and control variables for those with SOE affiliations and those without.he pattern is very similar to that of the means. We also notice that the mean values are significantly higher than median values,
ndicating that most of variables display positive skewness. Therefore, in later empirical testing, we use the natural logarithm ofhese variables except interest rates.
Table 1 Panel B reports the summary statistics of the long sample. In our long sample, 130 (3.1%) of the total 4,210 platformsave an SOE affiliation. For other platform characteristics, we show mean and median values by SOE affiliations. SOE-affiliatedlatforms have average registered capital of 58 million Chinese Yuan, while non-SOE-affiliated platforms have 41 million. Theean ages for the SOE-affiliated platforms and non-SOE platforms are 3.256 and 1.746 years, respectively.
More importantly, we compute variable defunct as a dummy variable, taking a value of one when the platform ceases to exists of February 2018, the ending date of data collection, and zero otherwise. We find that 16 SOE-affiliated platforms (12.3% ofOE-affiliated platforms) and 2697 non-SOE-affiliated platforms (66.1% of non-SOE-affiliated P2P platforms) became defunct as ofebruary 2018. These numbers imply that P2P lending platforms are highly risky, especially for platforms without SOE affiliations.he median value comparison for these characteristics shows similar pattern.
92

J. Jiang, L. Liao, Z. Wang et al. Journal of Empirical Finance 62 (2021) 87–106
Fig. 1. Platform traffic evolvement. This figure illustrates the pattern for platform traffics by SOE affiliation. The data are collected from www.wdzj.com. Thesample period is from January 2014 to February 2018. Panel A shows the weekly trading volumes per platform for SOE-affiliated platforms and non-SOE-affiliatedplatforms. Panel B shows the average number of investors per platform for SOE-affiliated platforms and non-SOE-affiliated platforms.
4. Main results
In this section, we examine how P2P platforms with and without SOE affiliations differ. We first study the relation betweenSOE affiliations and P2P performances using the trading sample in Section 4.1. In Section 4.2, we link a platform’s affiliation to itssurvival in the long sample. Finally, we compare interest rates offered by P2P platforms with and without SOE affiliations using thetrading sample in Section 4.3.
4.1. SOE affiliations and performances
It is unclear how government affiliations are related to P2P platform performances. Rajan and Zingales (2004) state that atthe early stage of a financial market, government can be useful in establishing the market rules as a central authority, whichimplies that the government might play a positive role in shaping financial innovation. In addition, Acharya and Kulkarni (2019)find that government affiliation can be especially important during a financial crisis, using the Indian banking system data duringthe 2007–2009 global financial crisis. They find that public banks had a higher deposit and credit growth than private banks,and experienced an increase in confidence, as investors believed that their downside risk was minimized because of the implicitgovernment guarantee. Acharya and Kulkarni (2019) further note that the government guarantees facilitate state-owned banks inobtaining access to inexpensive credit and thus, state-owned banks in India outperform private sector banks during a crisis. In thecontext of China, Kornai (1986), Boyreau-Debray and Wei (2005), Lu et al. (2005), and Song et al. (2011) determine SOEs are morelikely to obtain external financing from banks and enjoy soft-budget constraints that help protect their business.
93

J. Jiang, L. Liao, Z. Wang et al. Journal of Empirical Finance 62 (2021) 87–106
bi
FoTcp
loy
pracp
Table 2P2P platform performance and SOE affiliation. This table presents the results of the ordinary least squaresregression for our baseline model (1). The data are collected from www.wdzj.com. The sample periodis from January 2014 to February 2018. Trading Volume is the total funding facilitated on the platform.Number of Investors is number of investors on the platform. Number of Borrowers is number of borrowerson the platform. SOE is a dummy variable with a value of one for platforms affiliated with SOEs and zerootherwise. Size is measured by the registered capital of the platform. Age is the number of years since theplatform i’s inception to time t. Term is the weighted average term of loans from the platform weighted byeach loan amount. In all regressions, province fixed effects and week fixed effects are included. Standarderrors are clustered at both the platform and the week level. T-statistics are reported in parentheses. ***indicates the coefficient is different from zero at the 1% level, ** at the 5% level, and * at the 10% level.
(1) (2) (3)Ln(Trading volume) Ln(#Investors) Ln(#Borrowers)
SOE 0.775*** 0.814*** 0.178(6.146) (4.192) (1.056)
Ln(Size) 0.260*** 0.367*** 0.245***(7.237) (6.635) (5.118)
Ln(Age) 1.163*** 1.857*** 1.786***(7.966) (8.868) (7.708)
Ln(Term) 0.855*** 0.852*** 2.123***(5.211) (3.045) (7.484)
Province FE Y Y YWeek FE Y Y YObservations 128,673 128,673 128,673R-squared 0.284 0.217 0.272
It is possible that given the potential advantages of SOEs, the SOE-affiliated platforms may attract more investors and enjoyetter performances. To empirically investigate the relation between P2P performances and SOE affiliations, we use the panel datan the trading sample, and estimate the following panel regression for platform i at week t :
𝑃𝑒𝑟𝑓𝑜𝑟𝑚𝑎𝑛𝑐𝑒𝑖𝑡 = 𝛼 + 𝛽 × 𝑆𝑂𝐸𝑖 + 𝛾 × 𝐶𝑜𝑛𝑡𝑟𝑜𝑙𝑖𝑡 + 𝑃𝑟𝑜𝑣𝑖𝑛𝑐𝑒𝑖 +𝑊 𝑒𝑒𝑘𝑡 + 𝜀𝑖𝑡. (1)
or the dependent variable, as mentioned earlier, the main source of a typical P2P platform’s revenue is the origination fees chargedn the facilitated loan amount on a proportionate basis, plus the service fees to investors for processing and passing on proceeds.herefore, trading volume, number of investors, and number of borrowers directly and positively affect how much revenue a platforman collect, and we use them as performance measures. The coefficient 𝛽 measures whether the SOE affiliation would affect theerformance measures.
For the control variables, we follow Ackermann et al.’s (1999) study for hedge funds and include the following three platform-evel control variables: platform size, age, and the term of loans. Due to data limitations, we do not observe platform capitalizationver time. Instead, we use the platform’s registered capital as a proxy for Size. The platform’s age, Age, is defined as the number ofears since inception at time t. The term of loans on the platform, Term, is computed as the weighted average term of facilitated
loans at the platform during the week.For fixed effects, the ideal control would be the platform fixed effect. However, since none of the platforms changed their
affiliations in the sample, the platform fixed effect will not be identifiable from the SOE coefficient. Instead, we control for locationfixed effect and time fixed effect. The location fixed effect, 𝑃𝑟𝑜𝑣𝑖𝑛𝑐𝑒, is defined as where a platform’s headquarter is located, whichcan be any of the 31 provinces (except for Hong Kong, Macau, and Taiwan). The location fixed effect accounts for time-invariantsystematic differences across provinces, such as legal environment, local banking market, local tax difference, and local governments’strategic plans. Variable 𝑊 𝑒𝑒𝑘 represents time fixed effects by week, such as seasonality, the business cycle, regulations change,and trends in P2P lending over time. We double cluster standard errors at both the platform level and the week level, because theperformances for a given platform may be correlated over time, and performances across the platforms for a given time may becorrelated as well.
Table 2 reports the estimation results on how SOE affiliation is related to our three performance measures. In the first regressionfor trading volume, the coefficient on 𝑆𝑂𝐸 is 0.775 with a t-statistic of 6.146. In other words, an SOE-affiliated platform has 117.06%(= e0.775 − 1) more trading volume on average than a non-SOE-affiliated platform. In the second regression for number of investors,the coefficient on 𝑆𝑂𝐸 is 0.814, with a significant t-statistic of 4.192. Economically, a SOE-affiliated platform attracts 125.69%(= e0.814 − 1) more investors than a non-SOE-affiliated platform does on average. For the third regression for number of borrowers,the coefficient on 𝑆𝑂𝐸 is 0.178, with an insignificant t-statistic of 1.056. In terms of magnitude, an SOE-affiliated platform has19.48% (= e0.178 − 1) more borrowers than a non-SOE-affiliated platform on average.
It is perhaps not surprising that the SOE affiliation is more important for investors than borrowers. For investors, given therincipal payback guarantee by platforms, it is more important to evaluate the default risk of the platforms rather than the defaultisk of the loans. The SOE affiliation possibly provides useful information for investors to choose platforms, which is why the SOEffiliation is important for explaining the number of investors. For borrowers, however, because the platforms bear most of theredit risks from the borrowers, given the principal payback guarantee, the platforms are highly cautious in selecting the loans. The
rocedures adopted by the SOE-affiliated platforms may not vary substantially from the non-SOE-affiliated platforms, and therefore,94

J. Jiang, L. Liao, Z. Wang et al. Journal of Empirical Finance 62 (2021) 87–106
ttS
4
aa
wbhctc
Sp
tal
t
Table 3SOE affiliation and survival: Cox model. This table presents the estimates of determinants of thehazard rate to becoming a defunct platform using the Cox-proportional hazard model (2). SOEis a dummy variable with a value of one for platforms affiliated with SOEs and zero otherwise.Size is measured by the registered capital of the platform. Province fixed effects is included.T-statistics are reported in parentheses. *** indicates the coefficient is different from zero at the1% level.
Cox analysis
Coefficient Hazard ratio
SOE −2.055*** [0.128](−8.172)
Ln(Size) −0.137***(−6.819)
Province FE YObservations 4,210
the SOE affiliation does not significantly affect the number of borrowers. In future tables, we most focus our discussion on numberof investors rather than number of borrowers.
The coefficients on the control variables are all significant and carry the expected signs. Larger platforms and older platformsend to have higher trading volumes and attract more investors and borrowers. Interestingly, platforms with longer term loans tendo attract more traffic. The 𝑅2s for all three regressions are approximately 25%. Our findings in Table 2 show that platforms withOE affiliations are more likely to attract higher trading volumes, more investors, and more borrowers.7
.2. SOE affiliations and survivals
We examine P2P platforms survivals using the long sample, with 4,210 platforms. Since the survival variables are right-censoredt the sample collection date, we follow Kiefer (1988) and Seru et al. (2010), and use the Cox model to estimate the effect of SOEffiliation on P2P platforms’ survival probabilities. At the end of February 2018, we estimate the following specification,
ℎ𝑖 (𝑡) = ℎ0 (𝑡) exp(𝛿 × 𝑆𝑂𝐸𝑖 + 𝛾 × 𝐶𝑜𝑛𝑡𝑟𝑜𝑙𝑖 + 𝑃𝑟𝑜𝑣𝑖𝑛𝑐𝑒𝑖), (2)
here the hazard rate, ℎ𝑖 (𝑡), is platform i’s probability of failing at time t conditioning on not failing until time t, and ℎ0 (𝑡) is theaseline hazard function at time zero. The coefficient 𝛿 measures how much the SOE affiliation would affect the change in theazard rate each period. A negative estimate of 𝛿 implies that SOE platforms are less likely to fail than a non-SOE platform. Forontrol variables, we include platform size and province fixed effect. We do not include platform age or week fixed effect, becausehe Cox analysis has already accounted for the duration that the platform has been in existence. We also do not include term as aontrol variable, because the data are unavailable in the long sample.
We report the Cox analysis results in Table 3. The coefficient on the SOE variable is −2.055, with a significant t-statistic of −8.172,with the standard errors clustered by platform as in Heimer (2016). The negative sign indicates that SOE affiliation significantlyreduces the conditional default probability of P2P platforms. In economic terms, the hazard ratio of 0.128 = exp(−2.055) indicatesthat during the sample period (from 2014 to Feb 2018), the conditional failure probability for P2P platforms with SOE affiliationis only 12.8% of that for P2P platforms without SOE affiliation. In other words, P2P platforms with SOE affiliation are, on average,87.2% less likely to default than those without SOE affiliation. The coefficients on the size variable is negative and significant,indicating that larger platforms survive longer.
As in Acharya and Kulkarni (2019), government affiliation can be especially important during financial crises. If the investorsbelieve that the SOEs would protect the affiliated P2P platforms from failing, they would not abandon the SOE-affiliated platforms,and these platforms are more likely to survive. The recent Chinese stock market turbulence over year 2014 and 2015 provide anexcellent opportunity to investigate the survival pattern of the P2P platforms. Between June 2014 and June 2015, the ShanghaiStock Exchange Composite Index (SSECI) first surged by approximately 110%. In early July 2015, however, the SSECI plummetedby 32%, destroying more than 18 trillion Chinese Yuan in share value, according to Huang et al. (2016). On August 24, 2015, theSSECI fell by another 8.48%, marking the largest single day fall since 2007. From October 2015 to the end of our sample, the marketslowly recovered.
We directly investigate the defunct probabilities of various P2P platforms from June 2015 to June 2016. In this exercise, werequire the platforms to be founded before January 1, 2015 to have an adequate number of time series observations for eachplatform when market turbulence occurs. Our sample contains 1754 platforms, of which 77 are SOE-affiliated. As of June 2016,773 platforms, or 44.1% of all platforms in this sample, ceased to exist, yet none of these 773 defunct platforms are affiliated withOEs. This distinctive pattern provides strong evidence that SOE-affiliated platforms are much less likely to default than non-SOElatforms during market turmoil.8
7 We conduct two robustness checks, and results are reported in Appendix C. First, to better control for size, we match each SOE affiliated platform withhree similar-sized platforms without SOE affiliation, and re-estimate the panel regression. Second, we use monthly data rather than weekly data. The resultsre quite similar to those in Tables 2–4. In both cases, SOE-affiliated platforms have higher trading volumes, number of investors, and survival probabilities andower interest rates than non-SOE-affiliated platforms.
8 Following one of the referees’ suggestion, we also look at measures for macroeconomic conditions and examine the survival pattern of platforms duringhe economic downturns. We measure economic conditions with GDP growth rate, urban household income growth rate, and registered unemployment rate. The
95

J. Jiang, L. Liao, Z. Wang et al. Journal of Empirical Finance 62 (2021) 87–106
maS
i
ea
5
htfp
5
paitp
Table 4P2P platform interest rate and SOE affiliation. This table presents the results from the ordinaryleast squares regression of model (3). The data are collected from www.wdzj.com. The sampleperiod is from January 2014 to February 2018. Interest Rate (%) is the weighted annualizedpercentage rate of the platform loans weighted by each loan amount, which is offered to investors.SOE is a dummy variable with a value of one for platforms affiliated with SOEs and zerootherwise. Size is measured by the registered capital of the platform. Age is the number ofyears since the platform’s inception. Term is the weighted average term of loans of the platformby each loan amount. Province fixed effects and week fixed effects are included. Standard errorsare clustered at both the platform and the week level. T-statistics are reported in parentheses.*** indicates the coefficient is different from zero at the 1% level, ** at the 5% level, and * atthe 10% level.
Interest rate (%)
SOE −2.134***(−6.925)
Ln(Size) −0.308***(−3.349)
Ln(Age) 0.680**(2.194)
Ln(Term) −1.203***(−3.044)
Province FE YWeek FE YObservations 128,673R-squared 0.275
4.3. SOE affiliation and interest rate
Interest rates are key variables for P2P loans. As discussed earlier, most P2P platforms provide principal guarantee, and bearost of the default risks from borrowers. As a result, the P2P platforms preset the interest rates for investors.9 If SOE affiliation is
ssociated with higher platform survival probability, maybe it is natural that investors are willing to accept lower interest rates forOE-affiliated platforms. Therefore, we use the trading sample to estimate the following specification for platform i at week t :
𝐼𝑛𝑡𝑒𝑟𝑒𝑠𝑡𝑅𝑎𝑡𝑒𝑖𝑡 = 𝛼 + 𝛽 × 𝑆𝑂𝐸𝑖 + 𝛾 × 𝐶𝑜𝑛𝑡𝑟𝑜𝑙𝑖𝑡 + 𝑃𝑟𝑜𝑣𝑖𝑛𝑐𝑒𝑖 +𝑊 𝑒𝑒𝑘𝑡 + 𝜀𝑖𝑡. (3)
Table 4 presents the estimated coefficients. The coefficient on 𝑆𝑂𝐸 is −2.134 with a t-statistics of −6.925, suggesting that thenterest rates offered by a SOE-affiliated platform on average are 2.134% lower than that by a non-SOE-affiliated platform.
Our finding that SOE-affiliated platforms offer lower interest rates to investors is close to findings in Allen et al. (2017), whichxamine Chinese trust products and find that if the products are issued by trust companies affiliated with SOEs, then the yield spreadsre significantly lower. They conclude that the expectation of an implicit protection from the government affects the pricing.10
. Identification: Fake SOE affiliation
In the previous sections, we provide empirical evidence that P2P platforms with SOE affiliations have higher trading volumes andigher survival probabilities. Nevertheless, it is possible that SOE affiliation could be correlated with some unobservable variableshat affect platforms’ performances and survival probabilities. In this section, we investigate this identification issue by using datarom platforms with fake SOE affiliations. Section 5.1 compares the performances of platforms with fake SOE affiliations and otherlatforms. Section 5.2 discusses how the revelation of the fake SOE affiliations affects platform performances.
.1. Fake SOE affiliations and platform performances
We identify platforms with fake SOE affiliations in two steps. First, with the registration information, we clarify that theselatforms do not have SOEs as an ultimate shareholder and do not have real connections with SOEs. Second, the platforms publiclydvertise that they have SOE affiliations. For example, Jucaivoo.com, originally claimed on its website and advertisements thatt was affiliated with China National Nuclear Corporation (CNNC), a large state-owned enterprise under direct management byhe Chinese central government. However, on February 7, 2018, CNNC announced that it never had any relations with any P2Platforms, and CNNC would not bear the consequences of any actions taken by any P2P platform.
results are reported in Appendix D. The overall empirical pattern is that the positive effect of SOE affiliation on survival becomes larger, as macroeconomicconditions deteriorate.
9 Notice that the platform interest rate, accepted by both investors and the platform, is actually an equilibrium outcome, reflecting optimal choices made byboth the platforms and the investors, and it might contain information other than loans’ quality.
10 In Appendix E, we examine a small sample provided by NIFA on member P2P platforms on their financial performances. We find no statistically significantdifferences in the profitability between P2P platforms with and without SOE affiliations.
96

J. Jiang, L. Liao, Z. Wang et al. Journal of Empirical Finance 62 (2021) 87–106
e
Table 5Fake SOE Affiliation and platform performance. This table presents the ordinary least squares estimation results on performance measures, interest rates, andsurvivals for platforms with fake SOE affiliations. The data are collected from www.wdzj.com. The sample period is from January 2014 to February 2018. PanelA compares the summary statistics for platforms with fake SOE affiliations and other platforms. In Panel B, we match each fake-SOE-affiliated platform withthree non-SOE-affiliated platforms with similar size, age and the same province, respectively, and examine the performance for fake SOE affiliations vs. non-SOEaffiliations based on the matched samples using model (4). Panel B also presents the marginal effect for platform failure probabilities using model (5). PanelC presents the ordinary least squares estimation results using fake SOE affiliation revelation as a shock. FakeSOE equals one if the platform has a fake SOEaffiliation and zero otherwise. After is a dummy variable equal to one when the fake SOE affiliations are revealed and zero otherwise. Standard errors areclustered at the platform and the week level in Panel B Column (1) and (2) and Panel C. T-statistics are reported in parentheses. *** indicates the coefficientis different from zero at the 1% level, ** at the 5% level, and * at the 10% level.
Panel A. Summary statistics for platforms with Fake SOE affiliations
(1) (2) (3) (4) (5)
Fake SOE platforms SOE platforms Non-SOE platforms 𝑝-value for diff. (2)–(1) 𝑝-value for diff. (3)–(1)
Registered capital (million CNY) 51.526 62.917 53.247 0.000*** 0.238Age (years) 2.594 2.225 2.074 0.000*** 0.000***Term (years) 0.380 0.460 0.374 0.000*** 0.247
Panel B. Fake SOE Affiliation vs. Non SOE Affiliation, matched sample
(1) (2) (3)Ln(Trading volume) Ln(#Investors) Platform failure probability
FakeSOE 0.740** 1.135** −3.837%***(2.237) (2.123) (−18.893)
Week FE Y Y YObservations 4,612 4,612 6,323R-squared 0.168 0.097 0.502
Panel C. Revelation of fake SOE Affiliation and platform performance, matched sample
(1) (2)Ln(Trading volume) Ln(#Investors)
FakeSOE 0.728** 1.103**(2.195) (2.048)
FakeSOE × After −0.806*** −0.757*(−4.648) (−1.829)
After 0.554*** 0.283(4.542) (0.768)
Observations 4,764 4,764R-squared 0.205 0.177
We are able to identify eleven platforms with fake affiliations with CNNC, consisting of 1499 observations in the trading sample,quivalent to over 13% of real SOE affiliated platforms observations. We define FakeSOE as a dummy variable, taking the value of
one when a platform fakes its SOE affiliation, and zero otherwise.We first compare platforms with fake SOE affiliations to other platforms. From Panel A of Table 5, we find that the platforms
with fake SOE affiliations are significantly smaller than platforms with true SOE affiliations and are not significantly different fromplatforms without SOE affiliations. Interestingly, platforms with fake SOE affiliations survive longer, by a few months, than platformswith true SOE affiliations and no SOE affiliations.
Next, we investigate whether fake SOE affiliations attract more traffic than platforms with no SOE affiliations. FollowingChemmanur et al. (2014), for each fake-SOE-affiliated platform, we match it with three control platform with similar size, ageand province at the beginning of the sample. Based on the matched sample, we estimate the following specification:
𝑃𝑒𝑟𝑓𝑜𝑟𝑚𝑎𝑛𝑐𝑒𝑖𝑡 = 𝛼 + 𝛽 × 𝐹𝑎𝑘𝑒𝑆𝑂𝐸𝑖 +𝑊 𝑒𝑒𝑘𝑡 + 𝜀𝑖𝑡. (4)
We restrict the sample to the week before the revelation. In the first regression for trading volume of Table 5 Panel B, thecoefficient on 𝐹𝑎𝑘𝑒𝑆𝑂𝐸 is 0.740 with a t-statistic of 2.237. In other words, a platform with fake SOE affiliation on average has109.59% (= e0.740 − 1) more trading volume than matched non-SOE-affiliated platforms do. In the second regression for number ofinvestors, the coefficient on 𝐹𝑎𝑘𝑒𝑆𝑂𝐸 is 1.135, with a significant t-statistic of 2.123. Economically, a fake-SOE-affiliated platformattracts 211.12% (= e1.135 − 1) more investors than other non-SOE platforms do on average. The above results suggest that the titleof ‘‘SOE affiliation’’ itself could attract more traffic for P2P platforms, even though it is fake.
We also use the matched sample to compare survival probabilities for platforms with fake SOE affiliations. Since no platformswith fake SOE affiliations failed during the sample period, the cox model cannot be identified, we estimate the following probitmodel,
Pr(𝐷𝑒𝑓𝑢𝑛𝑐𝑡𝑖𝑡) = 𝛷(
𝛼 + 𝛽 × 𝐹𝑎𝑘𝑒𝑆𝑂𝐸𝑖 +𝑊 𝑒𝑒𝑘𝑡 + 𝜀𝑖𝑡)
. (5)
Here, we construct a platform × week panel data using the long sample, and 𝐷𝑒𝑓𝑢𝑛𝑐𝑡𝑖𝑡 is a dummy variable equal to one if a platformi is defunct during week t, and zero otherwise.
From the last column in Table 5 Panel B, for convenience of economic interpretation, we report marginal effect of FakeSOE,which is −3.837% with a significant t-statistic of −18.893. That is, the P2P platforms with fake SOE affiliations have a weekly
97

J. Jiang, L. Liao, Z. Wang et al. Journal of Empirical Finance 62 (2021) 87–106
e
Tow
a
ttr
ai
6
pStsS
6
tpp
wsp3NaTt
cib
ttaa
failure rate that is 3.837% (or an annual failure rate that is 86.93% = 1-(1–3.837%)52) less than that of other non-SOE-affiliatedP2P platforms. In other words, the platforms with fake SOE affiliations are significantly more likely to survive than other platformswith no SOE affiliations.11
5.2. Revelation of fake SOE affiliations
What happens after the fake SOE affiliations are revealed? We examine the revelation of fake SOE affiliations on February 7, 2018to see how the platform performances changed afterward. If SOE affiliation is a valid signal for market participants, then when thefake signal is corrected, we expect to see the market self-adjust to the new information, and the performance measures for platformswith fake SOE affiliations would deteriorate.
We construct a dummy variable, After, with value of one after the fake SOE affiliations are revealed, and zero otherwise. Westimate the following specification,
𝑃𝑒𝑟𝑓𝑜𝑟𝑚𝑎𝑛𝑐𝑒𝑖𝑡 = 𝛼 + 𝛽1 × 𝐴𝑓𝑡𝑒𝑟𝑖 × 𝐹𝑎𝑘𝑒𝑆𝑂𝐸𝑖 + 𝛽2 × 𝐹𝑎𝑘𝑒𝑆𝑂𝐸𝑖 + 𝛽3 × 𝐴𝑓𝑡𝑒𝑟𝑖 + 𝜀𝑖𝑡. (6)
he interaction term, 𝐴𝑓𝑡𝑒𝑟𝑖 ×𝐹𝑎𝑘𝑒𝑆𝑂𝐸𝑖, captures the difference-in-difference effect. The regressions are estimated using the samene-to-three matched sample of platforms with fake and no SOE affiliations in the previous subsection. Since we only have threeeeks of data after the revelation, the related coefficient estimates might have large standard errors.
Panel C of Table 5 compares the performance measures of platforms with no or fake SOE affiliations before and after the fake SOEffiliation revelation.12 For trading volume and number of investors, the coefficients on interaction terms between FakeSOE and After
are both significantly negative, implying that platforms with fake SOE affiliations are more negatively affected by revelation thanother non-SOE-affiliated platforms. As expected, the coefficients on FakeSOE are positive and significant, indicating that a fake SOEaffiliation is associated with better traffic. When we consider the magnitude of the coefficients for FakeSOE and 𝐹𝑎𝑘𝑒𝑆𝑂𝐸 ×𝐴𝑓𝑡𝑒𝑟ogether, the original positive coefficients on FakeSOE is mostly offset by the negative coefficients on the interaction term, indicatinghat platforms with fake SOE affiliations become no different from other non-SOE-affiliated platforms after the fake information wasevealed.
Overall, the results in Table 5 indicate that compared to other non-SOE platforms, the performance measures for fake-SOE-ffiliated platforms are better before revelation of fake status, but worse afterward. This result indicates that the SOE affiliationtself, rather than some unobservable variables, is a valid signal for investors to choose platforms.
. Possible channels
Why would SOE affiliation be positively related to platform performances and survivals? It is possible that SOE affiliationsrovide, or are perceived to provide, protection against platform default, better operational efficiencies, and/or better creditability.ince we do not directly observe the interactions between the SOEs and the P2P platforms, we cannot provide direct answers. Inhis section, we consider variables that could potentially affect the relation between SOE affiliation and platform performances andurvivals, which could shed some light on the underlying channels and mechanisms of the relation. In Section 6.1, we separate theOEs into central SOEs and local SOEs. In Section 6.2, we separate the platforms into financial SOEs and nonfinancial SOEs.
.1. Central vs. Local SOEs
Chen et al. (2005) suggest that central SOEs often enjoy higher creditability than local SOEs, due to their higher ability to protectheir stakeholders. In our case, if there is a protection from the SOEs, or if there is belief that there is a protection, we expect P2Platforms affiliated with central SOEs are more likely to perform better than platforms affiliated with local SOEs because the potentialrotection is more trustworthy from central SOEs.
To examine the difference between the central SOEs and noncentral SOEs, we estimate the following specification:
𝑃𝑒𝑟𝑓𝑜𝑟𝑚𝑎𝑛𝑐𝑒𝑖𝑡 = 𝛼 + 𝛽 × 𝐶𝑒𝑛𝑡𝑟𝑎𝑙𝑆𝑂𝐸𝑖 + 𝜃 ×𝑁𝐶𝑒𝑛𝑡𝑟𝑎𝑙𝑆𝑂𝐸𝑖 + 𝛾 × 𝐶𝑜𝑛𝑡𝑟𝑜𝑙𝑖𝑡 + 𝑃𝑟𝑜𝑣𝑖𝑛𝑐𝑒𝑖 +𝑊 𝑒𝑒𝑘𝑡 + 𝜀𝑖𝑡, (7)
here CentralSOE is a dummy variable, which equals one if the State Council (the central government) is one of the ultimatehareholders of the P2P platform, and zero otherwise. Variable NCentralSOE is also a dummy variable, which is equal to one if thelatform is only affiliated with noncentral SOE(s), and zero otherwise. Among the 114 SOE-affiliated platforms in the trading sample,1 platforms are affiliated with central SOE(s). In Table 6 Panel A, for performance measures, the coefficients on CentralSOE andCentralSOE are all positive, and the former are generally larger than the latter. In the fourth regression for interest rates, all SOE-ffiliated platforms offer significantly lower interest rates to investors than non-SOE-affiliated platforms with similar magnitudes.hat is, while both types of SOE-affiliated platforms attract more trading volumes and investors than non-SOE-affiliated platforms,he central-SOE-affiliated platforms do better than the local-SOE-affiliated platforms.
11 To further understand whether the SOE affiliations affect investor behaviors as a perception on platform quality or a signal for real platform quality, we alsoompare the performances and interest rates of platforms with fake SOE affiliations to those of platforms with (real) SOE affiliations. The results are presentedn Appendix F. Overall, we do not find significant differences between performances and interest rates of fake SOE platforms and real SOE platforms. We thankoth referees for suggesting this test.12 To show that the effects on fake SOEs differ significantly before and after the revelation, we present a trend chart in Appendix F. The two lines representing
he natural logarithm of trading volume (number of investors) for the fake-SOE-affiliated platforms and non-SOE-affiliated platforms trend closely in parallel inhe six weeks leading up to the revelation of fake SOE affiliations. On the revelation and afterward, the line for the non-SOE-affiliated platforms start to climbnd the line for the fake-SOE-affiliated platforms start to decline and two lines start to converge, indicating different pattern in performances for two groupsnd a drop for the fake-SOE-affiliated platforms. The results clearly show that the revelation event, rather than other time trend, affects the results.
98

J. Jiang, L. Liao, Z. Wang et al. Journal of Empirical Finance 62 (2021) 87–106
FawuNa
l
wsii
ia
Table 6Potential channels. This table presents the estimation results relating platform performances and survivals to platforms affiliated with certain types of SOEs.Panel A presents the estimations for performance measures and interest rates for platforms affiliated with central SOEs vs. those with noncentral SOEs usingmodel (7) and presents the marginal effect for platform failure probabilities in Column (5) using model (8). CentralSOE is equal to one if the State Council (thecentral government) is one of the ultimate shareholders of the P2P platform, and zero otherwise. NCentralSOE is equal to one if the platform is only affiliatedwith noncentral SOE(s) and zero otherwise. Panel B presents the estimations for performance measures and interest rates for platforms affiliated with financialSOEs vs. those with nonfinancial SOEs using model (9), and presents the marginal effects for platform failure probabilities using the following equation.Pr(𝐷𝑒𝑓𝑢𝑛𝑐𝑡𝑖𝑡) = 𝜙(𝛼 + 𝛽 × 𝐹 𝑖𝑛𝑆𝑂𝐸𝑖 + 𝜃 ×𝑁𝐹𝑖𝑛𝑆𝑂𝐸𝑖 + 𝛾 × 𝐶𝑜𝑛𝑡𝑟𝑜𝑙𝑖𝑡 + 𝑃𝑟𝑜𝑣𝑖𝑛𝑐𝑒𝑖 +𝑊 𝑒𝑒𝑘𝑡 + 𝜀𝑖𝑡).
inSOE is taking a value of one for a platform if it is affiliated with an SOE running a financial business. NFinSOE is equal to one if the platform is onlyffiliated with nonfinancial SOE(s) and zero otherwise. The estimation results from Column (1) to Column (4) in two panels are based on the trading sample,ith size, age, term, week fixed effects, and province fixed effects controlled. The estimation results in Column (5) in both panels are based on the long samplesing the probit model, with size, age, week fixed effects, and province fixed effects controlled. Trading Volume is the total funding facilitated by the platform.umber of Investors is the number of investors on the platform. Number of Borrowers is the number of borrowers on the platform. Interest Rate (%) is the weightednnualized percentage rate of the platform loans weighted by each loan amount. Defunct is equal to one for platforms ceasing to exist at time t and zero for
surviving platforms. T-statistics are reported in parentheses. *** indicates the coefficient is different from zero at the 1% level, ** at the 5% level, and * at the10% level.
Panel A. P2P Platform performance and central-SOE affiliation
(1) (2) (3) (4) (5)Ln(Trading volume) Ln(#Investors) Ln(#Borrowers) Interest rate (%) Probit (Defunct = 1)
CentralSOE 1.027*** 1.417*** 0.713* −2.005*** −3.541%***(3.644) (3.688) (1.801) (−4.470) (−54.624)
NCentralSOE 0.697*** 0.629*** 0.013 −2.174*** −0.693%***(5.293) (2.939) (0.077) (−5.914) (−8.174)
Controls, Province FE, Week FE Y Y Y Y YObservations 128,673 128,673 128,673 128,673 397,617R-squared 0.285 0.219 0.274 0.275 0.104
Panel B. P2P Platform performance and financial-SOE affiliation
(1) (2) (3) (4) (5)Ln(Trading volume) Ln(#Investors) Ln(#Borrowers) Interest rate (%) Probit (Defunct = 1)
FinSOE 1.483*** 1.353** 0.926* −2.653*** −3.665%***(5.374) (2.504) (1.905) (−4.777) (−48.109)
NFinSOE 0.652*** 0.721*** 0.048 −2.044*** −0.710%***(4.978) (3.617) (0.285) (−6.030) (−8.292)
Controls, Province FE, Week FE Y Y Y Y YObservations 128,673 128,673 128,673 128,673 397,617R-squared 0.287 0.218 0.274 0.275 0.104
We also expect platforms affiliated with central SOEs are less likely to default than those affiliated with local SOEs. Using theong sample, we estimate the following equation:
Pr(𝐷𝑒𝑓𝑢𝑛𝑐𝑡𝑖𝑡) = 𝛷(𝛼 + 𝛽 × 𝐶𝑒𝑛𝑡𝑟𝑎𝑙𝑆𝑂𝐸𝑖 + 𝜃 ×𝑁𝐶𝑒𝑛𝑡𝑟𝑎𝑙𝑆𝑂𝐸𝑖 + 𝛾 × 𝐶𝑜𝑛𝑡𝑟𝑜𝑙𝑖𝑡 + 𝑃𝑟𝑜𝑣𝑖𝑛𝑐𝑒𝑖 +𝑊 𝑒𝑒𝑘𝑡 + 𝜀𝑖𝑡). (8)
The fifth column in Table 6 Panel A shows that the marginal effect on CentralSOE and NCentralSOE are −3.541% and −0.693%,respectively. In economic terms, the P2P platforms affiliated with central SOEs have a weekly failure rate that is 3.541% less thanthat of non-SOE-affiliated P2P platforms, while the number for platforms with local SOEs is 0.693%. That is, P2P platforms affiliatedwith central SOEs have higher trading volumes, more investors, and higher survival probabilities than those affiliated with localSOEs, possibly because they have better creditability and they provide or are perceived to provide downside protections for theaffiliated platforms.
6.2. Financial vs. Non-financial SOEs
Compared to nonfinancial institutions, financial institutions have more relevant expertise, more connections in their businessnetwork, and more financing capacity, and the affiliated P2P platforms are more likely to perform better than non-affiliated P2Pplatforms. To examine the difference between the impacts of financial SOEs and nonfinancial SOEs, we estimate the followingspecification:
𝑃𝑒𝑟𝑓𝑜𝑟𝑚𝑎𝑛𝑐𝑒𝑖𝑡 = 𝛼 + 𝛽 × 𝐹 𝑖𝑛𝑆𝑂𝐸𝑖 + 𝜃 ×𝑁𝐹𝑖𝑛𝑆𝑂𝐸𝑖 + 𝛾 × 𝐶𝑜𝑛𝑡𝑟𝑜𝑙𝑖𝑡 + 𝑃𝑟𝑜𝑣𝑖𝑛𝑐𝑒𝑖 +𝑊 𝑒𝑒𝑘𝑡 + 𝜀𝑖𝑡, (9)
here FinSOE is a dummy variable, taking a value of one for a platform if it is affiliated with an SOE running a financial business,uch as an insurance company, a mutual fund company, or an asset management company, and zero otherwise. Variable NFinSOEs equal to one if the platform is only affiliated with nonfinancial SOE(s) and zero otherwise. Among the total 114 SOE platformsn the trading sample, there are 21 with financial SOE affiliations.
In Panel B of Table 6, the coefficients on FinSOE and NFinSOE for trading volume, number of investors, number of borrowers, andnterest rates all carry the expected signs and almost all are statistically significant. Interestingly, the magnitudes of the coefficientsre always larger for FinSOE than for NFinSOE. When we compare whether the differences between the financial and nonfinancial
SOE coefficients are significant, we find that they are significant in most cases. We also estimate the survival probabilities for these
99

J. Jiang, L. Liao, Z. Wang et al. Journal of Empirical Finance 62 (2021) 87–106
wtt
7
iia
depTwh
Hfgpiao
it
D
t
A
fa[
A
obdd
sibclGbn
c
two types of SOE affiliations, with a similar specification as in Eq. (8). From the fifth column in Table 6 Panel B, the coefficient onFinSOE and NFinSOE are both negative, and the marginal effect is significantly larger for FinSOE than that for NFinSOE.
The results suggest that platforms with financial SOE affiliations have better performances and survive better than platformsith nonfinancial SOE affiliations. Possibly, the financial SOE affiliations provide more expertise, better networks, and more access
o the capital market. This is slightly different from the trustworthiness and the protection for default risk mentioned earlier, buthese perspectives are not mutually exclusive, and they can all be at work.
. Conclusion
For the past few years between 2011 and 2018, P2P platforms have thrived in China and have provided an alternative, yetmportant, funding/investment channel. Unlike the P2P platforms in other countries, China’s P2P platforms have many unique andnteresting features, such as government involvement, guarantee on principals, and a large cross section of competing P2P platforms,ll of which makes the P2P industry an interesting research topic.
Our paper focuses on this rapid growth period and examine the cross section of P2P platforms, and how platform performancesiffer with and without government affiliations. Using unique, hand-collected platform-level data, we present a few interestingmpirical findings. First, P2P platforms affiliated with SOEs have higher trading volumes and attract more investors. Second, P2Platforms with SOE affiliations have higher survival probabilities, especially during the 2015–2016 Chinese stock market downturns.hird, the interest rate offered by SOE-affiliated platforms are significantly lower than other platforms. Finally, using P2P platformsith fake SOE affiliations, we show that the SOE affiliation itself is an important signal for P2P market participants. These findingsave direct implications for investors in choosing among thousands of P2P platforms by using SOE affiliation as a signal.
Our study also has important implications for regulators. Clearly, governments play an important role in global financial markets.owever, in terms of how governments influence financial development, the answers vary from one country to another. Our paper
ocuses on the Chinese P2P lending market, a significant component of the rising fintech industry. We provide evidence thatovernment affiliation has positive correlations with performance measures in the peer-to-peer lending market during its expansioneriod. This finding might be useful for other emerging markets aiming to develop a fintech industry, in fields like robo-advising,nsuretech, digital payment and digital wallet, etc. Government affiliations may help FinTech companies in their early times tottract customers, gain survival probabilities, and thus bolster financial innovation. However, it remains an open question what theptimal form of government involvement would be, when the fintech industry gradually matures.
Our paper focuses on the expansion period of the P2P industry. One might be aware that over 2019 and 2020, the P2P industryn China went through dramatic policy changes, and number of platforms quickly shrank to double digit. The dynamics betweenhe platforms and the government during contraction period should be another important research question for future studies.
eclaration of competing interest
The authors declare that they have no known competing financial interests or personal relationships that could have appearedo influence the work reported in this paper.
cknowledgment
The authors would like to thank seminar/conference participants at Tsinghua University, Purdue University, RFS Fintech Con-erence, FMA Asia/Pacific 2018 Conference, 2018 Chinese Finance Research Conference, Baruch College, Georgia Tech Universitynd Georgia State University for helpful comments and suggestions. Zhang thanks the National Natural Science Foundation of China71790605] for financial support.
ppendix A. Individual examples on defaults and bailouts
When a platform fails, what happens? We first examine the 16 defunct SOE-affiliated platforms in our sample. By the end ofur sample, at least four of them have returned investors’ investment. We find almost no complaint on each platform’s discussionoard. We also examine the 10 largest defunct non-SOE platforms by collecting news on the Internet. These platforms simply shutown the platform’s website and disappear, leaving investors complaining on discussion board. Below we provide two examples ofefunct platforms, one is affiliated with SOE, and one is not.
For the SOE-affiliated platform, the platform ‘‘Lian Che Jin Fu’’ (LCJF), is affiliated with an SOE ‘‘Guang Da Li He’’ (GDLH), aubsidiary of China State Construction Engineering Corporation Limited. On October 11, 2017, the platform LCJF announced onts website that because of one borrower’s default, the due principal and interest cannot be paid to the investors on time. To payack investors, the platform itself was actively collecting proceeds from the borrowers. The event led to heated discussions andomplaints from investors. On the following day, October 12, 2017, the platform LCJF published a letter from the SOE GDLH. Theetter stated that the SOE GDLH would bail out the platform and pay back the loan’s principal and interests to investors. The SOEDLH explained the bailout decision is to protect investors’ trust in the SOE GDLH, because the investors invest in the P2P LCJFased on their trust on GDLH. On October 13, 2017, investors get their money back, according to the discussion board. We haveo information on many bailouts, and we do not know whether bailout is representative.
For the non-SOE affiliated platforms, we found an example of ‘‘Ezubao’’. This platform was founded in 2014, and they attractedapitals from approximately 900,000 investors, in the amount of approximately 50 billion Chinese Yuan (around $7.6 billion). The
100

J. Jiang, L. Liao, Z. Wang et al. Journal of Empirical Finance 62 (2021) 87–106
platform was shut down in December 2015, because it was reported to operate as a Ponzi scheme. The platform’s founders were thensued and imprisoned. However, the salvage value from the platform and the founders is far below the amount they borrowed fromthe investors, so most of the investors lost big in this platform.
One popular approach that many platforms take for risk control is to form internal reserve funds to cover potential defaults. TheP2P platforms are not required to report any details on these reserve funds. However, from IPO filings or other filings of platforms,which went public, we are able to collect two examples. First, in the IPO filings13 of Jiayin Group Inc., which owns a P2P platformcalled ‘‘Niwodai’’, Jiayin states that it runs an ‘‘investor assurance program’’ which protect investors investments. From 2016 to2018 September, the total payouts, which are total amount of cash paid to investors upon borrower’s default, amount to RMB 5.7billion (US$0.8 billion). Second, from the SEC filing, a U.S. listed Chinese P2P lending company ‘‘PPdai Group Inc.’’ runs a ‘‘qualityassurance fund’’ and ‘‘investor reserve funds’’, with payout amounting to RMB 3.03 billion (US$ 0.44 billion) from 2015 to 2017according to its form-1 filing.14
Appendix B. Additional details on regulations
Before 2015, there is no specific regulation on platforms. In July 2015, the People’s Bank of China, or the PBOC, together withnine other regulatory agencies, jointly issued ‘‘The Guidelines on Promoting the Healthy Development of Internet Finance’’, or‘‘The Guidelines’’.15 The Guidelines seek to promote development of Internet Finance, or FinTech, encourage financial innovation,and believe that FinTech has a positive impact on both traditional financial sector and the overall economy, especially for small-and-medium-sized firms’ development. One field that the Guidelines encourage is online peer-to-peer lending. Additionally, theGuidelines formally introduced for the first time the regulatory framework and basic principles governing the P2P lending industry.The Guidelines define online peer-to-peer lending as direct lending between individuals through an online platform, which is underthe supervision of the Chinese Banking and Regulatory Commission (CBRC) and governed by the PRC Contract Law, the GeneralPrinciples of the Civil Law of the PRC, and related judicial interpretations promulgated by the Supreme People’s Court. Pursuantto the Guidelines, a company that provides online peer-to-peer lending information intermediary services shall function solely asan information intermediary and provide information services rather than provide credit enhancement services or engage in illegalfund-raising for platform itself.
After 2015, as fraud and scandals appeared more frequently in the media and began to negatively affect investors (for example,Ezubao, which collapsed in December 2015), the CBRC took actions to standardize the industry by introducing a series of detailedmeasures. In August 2016, the CBRC and other four regulatory agencies issued ‘‘The Interim Measures on Administration of BusinessActivities of Online Lending Information Intermediaries’’, or ‘‘The Interim Measures’’.16 The Interim Measures further define P2Plending platform as online lending information intermediary and prohibit P2P platforms from engaging in certain activities, includingamong others, (i) fundraising for the platforms themselves, (ii) holding investors’ fund, including accepting, collecting or gatheringfunds of lenders directly or indirectly,17 (iii) providing guarantee to investors as to the principals and returns of the investment, (iv)raising funds by issuing financial products as wealth management products, (v) mismatch between investor’s expected timing ofexit and the loan’s maturity date, (vi) securitization, (vii) promoting its financing products on physical premises other than throughthe permitted electronic channels, such as telephones, mobile phones and Internet,18 (viii) providing loans with its own capital,except as otherwise permitted by laws and regulations, (ix) equity crowd-funding, (x) deducting interest from loan principal, (xi)outsourcing key services such as customer information collection, screening, credit evaluation, (xii) facilitating loans without adesignated purpose,19 and (xiii) cheating.
Since the Interim Measures prohibit platforms from providing security or guarantee to investors as to the principals and returnsof the investment, P2P platforms increasingly replace self-managed risk reserve fund by partnering with third-party guarantorsto protecting investors’ interests against delinquency risks. However, the third-party protection often with an upper limit and theplatforms continue to hold the rest.
To strengthen supervision on P2P lending platforms, in October, 2016, the CBRC, along with the Ministry of Industry andInformation Technology and the State Administration for Industry and Commerce, issued the ‘‘Guidelines on the Filing-basedAdministration of the Online Lending Information Intermediaries’’, or ‘‘The Administration Guidelines’’.20 The AdministrationGuidelines set out rules on the filing-based administrative regime of online lending information intermediaries that require onlinelending information intermediaries shall apply for value-added telecommunications business operation licenses with certificate ofregistration issued by the local financial regulatory authority. However, to our best of knowledge, at least until February 2019, thefinancial regulatory authorities are still in the process of making detailed implementation rules regarding the filing procedures andnone of the online lending information intermediaries have been permitted to apply for such filing.
To prevent platforms from running away with investor’ money, in February 2017, the CBRC issued ‘‘The Guidelines on OnlineLending Funds Custodian Business’’, or ‘‘The Custodian Guidelines’’.21 One of the guidelines is to require the platforms to set up
13 https://www.nasdaq.com/markets/ipos/filing.ashx?filingid=13116225, accessed on March 14, 2019.14 https://www.sec.gov/Archives/edgar/data/1691445/000119312517309953/d285990df1.htm, accessed on March 14, 2019.15 Official site for the Guideline: http://www.gov.cn/xinwen/2015-07/18/content_2899360.htm, accessed on March 14, 2019.16 Official site for the Interim Measures: http://www.cbrc.gov.cn/govView_37D312933F1A4CECBC18F9A96293F450.html, accessed on March 14, 2019.17 This requirement leads to the introduction of the Custodian Guidelines below.18 This requirement aims at preventing platforms from acquiring investors offline.19 This requirement aims at preventing borrowers from borrowing money from P2P platform and then investing in stock market.20 Official site for the Administration Guideline: http://www.cbrc.gov.cn/govView_E7B94B41E8C340E4833472632308AEC5.html, accessed on March 14, 2019.21 Official site for the Custodian Guideline: http://www.cbrc.gov.cn/govView_4201EF03472544038242EED1878597CB.html, accessed on March 14, 2019.
101

J. Jiang, L. Liao, Z. Wang et al. Journal of Empirical Finance 62 (2021) 87–106
o
custody accounts with commercial banks to keep the funds from being controlled by platforms. Through the usage of custodianbanks, the proceeds of investing and collecting will go through the custodian bank, which make it less likely for platforms runningaway with investor’s money.
To make the industry more transparent, the CBRC further issued the ‘‘Guidelines on Information Disclosure of Business Activitiesof Online Lending Information Intermediaries’’, or ‘‘The Disclosure Guidelines’’, in August, 2017.22 Pursuant to the DisclosureGuidelines, P2P lending platforms shall disclose certain required information on their websites in a fair, accurate, complete andtimely manner.
To the extent that the relevant P2P lending platforms are not in full compliance with the Administration Guidelines, the CustodianGuidelines, and the Disclosure Guidelines upon Guidelines’ introduction, they are required to make correction or rectification withina rectification period specified by the Guidelines. Over the years of 2019 and 2020, the rectification continues, and no new regulationguidelines are added. As of June 2020, 29 platforms remain with outstanding loans of around 100 billion RMB.
Appendix C. Robustness: Sized matched pairs and data over different horizons
This table presents the results of the ordinary least squares regression for our baseline model (1). Panel A uses sized matchedpairs and Panel B uses monthly data in Panel B. This table also presents the estimates of determinants of the hazard rate to becominga defunct platform using the Cox-proportional hazard model (2). The matched sample is constructed by matching each SOE affiliatedplatform with three similar-sized platforms without SOE affiliation. Trading Volume is the total funding facilitated in the platform.Number of Investors is number of investors on the platform. Number of Borrowers is number of borrowers on the platform. Interest Rate(%) is the weighted annualized percentage rate of the platform loans weighted by each loan amount, which is offered to investors.SOE is a dummy variable with a value of one for platforms affiliated with SOEs and zero otherwise. Size is measured by the registeredcapital of the platform. Age is the number of years since the platform’s inception. Term is the weighted average term of loans fromthe platform weighted by each loan amount. Standard errors are clustered at both the platform and the month level. T-statistics arereported in parentheses. *** indicates the coefficient is different from zero at the 1% level, ** at the 5% level, and * at the 10%level.
Panel A. Match SOE-Affiliated platforms with Non-SOE-Affiliated platforms by size (1:3)(1) (2) (3) (4) (5)Ln(Trading volume) Ln(#Investors) Ln(#Borrowers) Interest
rate (%)Coxcoefficient
Hazardratio
SOE 0.842*** 0.779*** 0.259 −2.325*** −1.954*** [0.142](5.479) (3.275) (1.260) (−6.271) (−7.523)
Week FE Y Y Y YObservations 35,651 35,651 35,651 35,651 520R-squared 0.135 0.086 0.130 0.244 0.038Panel B. Using monthly data
(1) (2) (3) (4) (5)Ln(Trading volume) Ln(#Investors) Ln(#Borrowers) Interest
rate (%)Coxcoefficient
Hazardratio
SOE 0.910*** 0.827*** 0.200 −2.360*** −2.055*** [0.128](6.954) (3.936) (1.163) (−7.637) (−8.172)
Ln(Size) 0.266*** 0.367*** 0.255*** −0.249*** −0.137***(7.031) (6.204) (5.278) (−2.765) (−6.819)
Ln(Age) 1.334*** 1.848*** 1.739*** 0.816***(9.993) (9.689) (9.047) (2.942)
Ln(Term) 0.955*** 0.706** 2.095*** −1.935***(5.310) (2.192) (7.002) (−3.863)
Province FE Y Y Y Y YMonth FE Y Y Y YObservations 40,908 40,908 40,908 40,908 4,210R-squared 0.280 0.172 0.247 0.281 0.0126
Appendix D. Platform survival patterns and macroeconomic conditions
This table examines the platform survival patterns during different macroeconomic conditions. The estimation results are basedn the long sample using the following probit model, with size, age, and province fixed effects controlled.
Pr(𝐷𝑒𝑓𝑢𝑛𝑐𝑡𝑖𝑡) = 𝛷(𝛼 + 𝛽 × 𝑆𝑂𝐸𝑖 + 𝜃 × 𝑆𝑂𝐸𝑖 ×𝑀𝑎𝑐𝑟𝑜𝐶𝑜𝑛𝑑𝑖𝑡𝑖𝑜𝑛𝑡 + 𝜇 ×𝑀𝑎𝑐𝑟𝑜𝐶𝑜𝑛𝑑𝑖𝑡𝑖𝑜𝑛𝑡 + 𝛾 × 𝐶𝑜𝑛𝑡𝑟𝑜𝑙𝑖𝑡 + 𝑃𝑟𝑜𝑣𝑖𝑛𝑐𝑒𝑖 + 𝜀𝑖𝑡).
22 Official site for the Disclosure Guideline: http://www.cbrc.gov.cn/govView_C8D68D4C980A4410B9F4E21BA593B4F2.html, accessed on March 14, 2019.
102

J. Jiang, L. Liao, Z. Wang et al. Journal of Empirical Finance 62 (2021) 87–106
uti
NaemS
d
SOE is a dummy variable with a value of one for platforms affiliated with SOEs and zero otherwise. MacroCondition is LowGDP,LowIncome, or HighUnemployment. LowGDP is a dummy variable with a value of one when the GDP growth rate is below the sampleaverage and zero otherwise. LowIncome is a dummy variable with a value of one when the urban household income growth rateis below the sample average and zero otherwise. HighUnemployment is a dummy variable with a value of one when the registerednemployment rate is over the sample average and zero otherwise. Defunct is equal to one for platforms ceasing to exist at timeand zero for surviving platforms. Standard errors are clustered at the platform level. T-statistics are reported in parentheses. ***
ndicates the coefficient is different from zero at the 1% level, ** at the 5% level, and * at the 10% level.
(1) (2) (3)Probit (Defunct = 1)
SOE −0.653*** −0.653*** −0.804***(−8.746) (−8.745) (−8.653)
SOE × LowGDP −0.690***(−6.048)
LowGDP 3.654***(107.617)
SOE × LowIncome −0.717***(−6.467)
LowIncome 3.656***(116.487)
SOE × HighUnemployment −0.760***(−4.975)
HighUnemployment 0.753***(−21.134)
Controls, Province FE Y Y YObservations 397,617 397,617 397,617R-squared 0.0347 0.0353 0.0537
Appendix E. The NIFA sample and platform profitability
We obtain the third dataset which is collected by NIFA and we refer to it as the ‘‘NIFA sample’’. To standardize the P2P market,IFA was established in March 2016 as an official self-regulatory organization of P2P platforms. Membership in NIFA is voluntarynd all member platforms need to release financial reports to the public, including information on earnings, revenue, total assets,tc. There are 89 P2P platforms with NIFA membership by the year of 2016. The NIFA sample covers 40% of the existing P2Parket, a fair representation of the whole market. Given that membership is promoted by the government, but not required, more
OE-affiliated platforms choose to participate compared to non-SOE-affiliated platforms.We present summary statistics of the NIFA sample in the following table Panel A. In the first row, we compute the mean, standard
eviation, and percentiles of the variable SOE. Given that the NIFA is established for regulation purposes, among the 89 platformsin the NIFA sample, there are 13 SOE-affiliated platforms (15.7% of the sample), suggesting that the ‘‘NIFA sample’’ covers moreSOE platforms relative to the trading sample and long sample. In terms of other characteristics, on average, P2P platforms haveregistered capital of 77 million Chinese Yuan. The mean and median ages are 2.991 and 2.589 years, respectively. We find nodefunct platforms in this sample. The summary statistics suggest that the ‘‘NIFA sample’’ covers larger and older platforms, relativeto the trading sample and the long sample.
We then compare platforms profitability using this sample with the following specification:
𝑃𝑟𝑜𝑓𝑖𝑡𝑎𝑏𝑖𝑙𝑖𝑡𝑦𝑖 = 𝛼 + 𝛽 × 𝑆𝑂𝐸𝑖 + 𝛾 × 𝐶𝑜𝑛𝑡𝑟𝑜𝑙𝑖 + 𝑃𝑟𝑜𝑣𝑖𝑛𝑐𝑒𝑖 + 𝜀𝑖𝑡.
We measure platform profitability in three ways: Profit_POS, ROA, and Earnings Ratio. Variable Profit_POS is a dummy variable, takinga value of one if a platform’s 2016 earnings are positive, and zero otherwise. The ROA is calculated as earnings over total assets andthe Earnings Ratio is earnings over total revenue. The control variables include platform registered capital, age, and province fixedeffects. Here, we do not include term as a control variable, because the data are unavailable in the NIFA sample. Additionally, givenall observations are from the same date, we do not control for time fixed effects. Finally, given that this sample only contains 89observations, we need to keep in mind that the limited number of observations might make the estimation noisy and not as precise.
We present the results in the following table Panel B. Since variable Profit_POS is a dummy variable, Column (1) uses probitregression, while Column (2)–(3) use OLS. In the first regression for the positive profit dummy, the coefficient on SOE is 0.087but is not statistically significant. For economic meaning, the SOE-affiliated platforms are on average 3.46% more likely to haveprofits rather than suffer losses. For the ROA measure in the second regression, the coefficient on SOE is −0.161, indicating that theSOE-affiliated platforms have lower ROAs than non-SOE-affiliated platforms by 16.1% on average. For the earnings ratio in the thirdregression, the coefficient on SOE is negative at −0.254, implying that SOE-affiliated platforms on average have a lower earningsratio than non-SOE-affiliated platforms by 25.4%. However, none of the above coefficients is statistically significant. The resultssuggest that there are no significant differences in the profitability of SOE-affiliated platforms and non-SOE-affiliated platforms.
103

J. Jiang, L. Liao, Z. Wang et al. Journal of Empirical Finance 62 (2021) 87–106
rSs
H
Panel A. Summary statistics (N = 89)Mean Std. Dev. P1 P25 Median P75 P99
SOE 0.157 0.366 0 0 0 0 1Size/Registered capital(million CNY)
76.519 55.279 10 31.579 53.125 100 200
Age (years) 2.991 1.373 0.419 2.222 2.589 3.405 7.8Defunct 0 0 0 0 0 0 0Panel B. Platform profitability and SOE affiliation
(1) (2) (3)Profit_POS ROA Earnings ratio
SOE 0.087 −0.161 −0.254(0.191) (−1.511) (−0.383)
Ln(Size) 0.366** 0.081* 0.069(2.007) (1.990) (0.268)
Ln(Age) −0.012 0.016 −0.202(−0.026) (0.153) (−0.302)
Province FE Y Y YObservations 89 89 89R-squared 0.076 0.144 0.045
Note: T-statistics are reported in parentheses. *** indicates the coefficient is different from zero at the 1% level, ** at the 5% level,and * at the 10% level.
Appendix F. Additional results on fake SOE
To further understand whether the SOE affiliations affect investor behaviors as a perception on platform quality or a signal foreal platform quality, we also compare the performances of platforms with fake SOE affiliations to those of platforms with (real)OE affiliations. Empirically, for each fake-SOE-affiliated platform, we match it with three SOE-affiliated platforms with similarizes, ages, and provinces at the beginning of the sample. Based on the matched sample, we estimate the following specification:
𝑃𝑒𝑟𝑓𝑜𝑟𝑚𝑎𝑛𝑐𝑒𝑖𝑡 = 𝛼 + 𝛽 × 𝑅𝑒𝑎𝑙𝑆𝑂𝐸𝑖 +𝑊 𝑒𝑒𝑘𝑡 + 𝜀𝑖𝑡.
ere we restrict the sample to the week before the revelation.
Real SOE Affiliation vs. Fake SOE Affiliation, Matched sample(1) (2) (3)Ln(Trading volume) Ln(#Investors) Interest rate (%)
RealSOE −0.037 −0.867 −1.540(−0.095) (−1.287) (−1.430)
Week FE Y Y YObservations 4469 4469 4469R-squared 0.310 0.274 0.564
In the first regression for trading volume, the coefficient on 𝑅𝑒𝑎𝑙𝑆𝑂𝐸 is −0.037, with an insignificant t-statistic of −0.095. Inthe second regression for number of investors, the coefficient on 𝑅𝑒𝑎𝑙𝑆𝑂𝐸 is −0.867, with an insignificant t-statistic of −1.287.That is to say, we do not find significant differences between performances of fake SOE platforms and real SOE platforms.
Further, we investigate whether platforms with real SOE affiliations offer a higher interest rate for investors than platformswith fake SOE affiliations. In the third regression, the coefficient on 𝑅𝑒𝑎𝑙𝑆𝑂𝐸 is −1.540 with an insignificant t-statistic of −1.430,indicating that the interest rates offered by a real-SOE-affiliated platform on average are 1.540% lower than that by a fake-SOE-affiliated platform. Again, we do not find significant differences between interest rates offered by fake SOE platforms and real SOEplatforms.
The figure below shows the performance for fake-SOE-affiliated platforms and matched non-SOE-affiliated platforms, from sixweeks before the revelation of fake SOE affiliation to two weeks after the revelation. Panel A shows the results captured by thenatural logarithm of trading volume and Panel B the natural logarithm of number of investors. The sample is constructed based onthe matching procedure described in Section 5.1.
104

J. Jiang, L. Liao, Z. Wang et al. Journal of Empirical Finance 62 (2021) 87–106
AAB
References
Acharya, V.V., Kulkarni, N., 2019. Government Guarantees and Bank Vulnerability During the Financial Crisis of 2007–09: Evidence from an Emerging Market.Working Paper, NYU Stern School of Business.
ckermann, C., McEnally, R., Ravenscraft, D., 1999. The performance of hedge funds: risk, return, and incentives. J. Financ. 54, 833–874.llen, F., Gu, X., Qian, J., Qian, Y., 2017. Implicit Guarantee and Shadow Banking: The Case of Trust Products. Unpublished Working Paper.ai, C., Lu, J., Tao, Z., 2006. The multitask theory of state enterprise reform: empirical evidence from China. Am. Econ. Rev. P & P. 96, 353–357.
Bartlett, R., Morse, A., Stanton, R., Wallace, N., 2018. Consumer-lending discrimination in the era of FinTech. Available at SSRN: https://ssrn.com/abstract=3063448.
Boyreau-Debray, G., Wei, S.J., 2005. Pitfalls of a State-Dominated Financial System: The Case of China. National Bureau of Economic Research, No. w11214.Buchak, G., Matvos, G., Piskorski, T., Seru, A., 2018. Fintech, regulatory arbitrage, and the rise of shadow banks. J. Financ. Econ. 130, 453–483.Carter, M., 1989. Financial innovation and financial fragility. J. Econ. Issues 23, 779–793.Chemmanur, T.J., Loutskina, E., Tian, X., 2014. Corporate venture capital, value creation, and innovation. Rev. Financ. Stud. 27, 2434–2473.Chen, Y., Démurger, S., Fournier, M., 2005. Earnings differentials and ownership structure in chinese enterprises. Econ. Dev. Cult. Change 53, 933–958.Chen, M., Wu, Q., Yang, B., 2019. How valuable is fintech innovation? Rev. Financ. Stud. 32, 2062–2106.DeFond, M.L., Wong, T.J., Li, S., 2000. The impact of improved auditor independence on audit market concentration in China. J. Account. Econ. 28, 269–305.Duarte, J., Siegel, S., Young, L., 2012. Trust and credit: the role of appearance in peer-to-peer lending. Rev. Financ. Stud. 25, 2455–2484.Fuster, A., Plosser, M.C., Schnabl, P., Vickery, J., 2019. The role of technology in mortgage lending. Rev. Financ. Stud. 32, 1854–1899.Glaeser, E., Johnson, S., Shleifer, A., 2001. Coase versus the coasians. Q. J. Econ. 116, 853–899.Heimer, R., 2016. Peer pressure: social interaction and the disposition effect. Rev. Financ. Stud. 29, 3177–3209.Hertzberg, A., Liberman, A., Paravisini, D., 2018. Screening on loan terms: evidence from maturity choice in consumer credit. Rev. Financ. Stud. 31, 3532–3567.Hildebrand, T., Puri, M., Rocholl, J., 2017. Adverse incentives in crowdfunding. Manag. Sci. 63, 587–608.
105

J. Jiang, L. Liao, Z. Wang et al. Journal of Empirical Finance 62 (2021) 87–106
Huang, Y., Miao, J., Wang, P., 2016. Saving China’s stock market. Available at SSRN: https://ssrn.com/abstract=2821664.Iyer, R., Khwaja, A.I., Luttmer, E.F., Shue, K., 2015. Screening peers softly: inferring the quality of small borrowers. Manage. Sci. 62, 1554–1577.Kiefer, N., 1988. Economic duration data and hazard functions. J. Econ. Lit. 26, 646–679.Kornai, J., 1986. The soft budget constraint. Kyklos 39, 3–30.Liao, L., Liu, B., Wang, H., 2014. China’s secondary privatization: perspectives from the split-share structure reform. J. Financ. Econ. 113, 500–518.Lin, M., Prabhala, N.R., Viswanathan, S., 2013. Judging borrowers by the company they keep: friendship networks and information asymmetry in online
peer-to-peer lending. Manag. Sci. 59, 17–35.Lu, D., Thangavelu, S.M., Hu, Q., 2005. Biased lending and non-performing loans in China’s banking sector. J. Dev. Stud. 41, 1071–1091.Pope, D., Sydnor, J., 2011. What’s in a picture? evidence of discrimination from prosper.com. J. Hum. Resour. 46 (1), 53–92.Rajan, R.G., 2006. Has finance made the world riskier? Eur. Financial Manage. 12, 499–533.Rajan, R.G., Zingales, L., 2004. Saving Capitalism from the Capitalists: Unleashing the Power of Financial Markets to Create Wealth and Spread Opportunity.
Princeton University Press.Seru, A., Shumway, T., Stoffman, N., 2010. Learning by trading. Rev. Financ. Stud. 23, 705–739.Simon, C., 1989. The effect of the 1933 securities act on investor information and the performance of new issues. Amer. Econ. Rev. 79 (3), 295–318.Song, Z., Storesletten, K., Zilibotti, F., 2011. Growing like China. Amer. Econ. Rev. 101, 196–233.Sy, A., Maino, R., Massara, A., Saiz, H.P., Sharma, P., 2018. FinTech in Sub-Saharan African Countries: A Game Changer? Departmental Paper No.
19/04, available at https://www.imf.org/en/Publications/Departmental-Papers-Policy-Papers/Issues/2019/02/13/FinTech-in-Sub-Saharan-African-Countries-A-Game-Changer-46376.
Tang, H., 2019. Peer-to-peer lenders versus banks: substitutes or complements? Rev. Financ. Stud. 32, 1900–1938.Vallee, B., Zeng, Y., 2019. Marketplace lending: a new banking paradigm? Rev. Financ. Stud. 32, 1939–1982.Wei, Z., Lin, M., 2017. Market mechanisms in online peer-to-peer lending. Manag. Sci. 63, 4236–4257.Yin, C., 2016. The optimal size of hedge funds: conflict between investors and fund managers. J. Finance. 71 (4), 1857–1894.
106